Embed Size (px)
Citation preview

HAL Id: hal-00925579https://hal.archives-ouvertes.fr/hal-00925579
Submitted on 8 Jan 2014
HAL is a multi-disciplinary open accessarchive for the deposit and dissemination of sci-entific research documents, whether they are pub-lished or not. The documents may come fromteaching and research institutions in France orabroad, or from public or private research centers.
L’archive ouverte pluridisciplinaire HAL, estdestinée au dépôt et à la diffusion de documentsscientifiques de niveau recherche, publiés ou non,émanant des établissements d’enseignement et derecherche français ou étrangers, des laboratoirespublics ou privés.
Performance loss of proton exchange membrane fuel celldue to hydrophobicity loss in gas diffusion layer:
Analysis by multiscale approach combining pore networkand performance modelling
Joel Pauchet, Marc Prat, Pascal Schott, Srijith Pulloor Kuttanikkad
To cite this version:Joel Pauchet, Marc Prat, Pascal Schott, Srijith Pulloor Kuttanikkad. Performance loss of protonexchange membrane fuel cell due to hydrophobicity loss in gas diffusion layer: Analysis by multiscaleapproach combining pore network and performance modelling. International Journal of HydrogenEnergy, Elsevier, 2012, vol. 37, pp. 1628-1641. <10.1016/j.ijhydene.2011.09.127>. <hal-00925579>

Open Archive TOULOUSE Archive Ouverte (OATAO) OATAO is an open access repository that collects the work of Toulouse researchers and makes it freely available over the web where possible.
This is an author-deposited version published in : http://oatao.univ-toulouse.fr/ Eprints ID : 10489
To link to this article : doi:10.1016/j.ijhydene.2011.09.127 URL : http://dx.doi.org/10.1016/j.ijhydene.2011.09.127
To cite this version : Pauchet, Joel and Prat, Marc and Schott, Pascal and Pulloor Kuttanikkad, Srijith Performance loss of proton exchange membrane fuel cell due to hydrophobicity loss in gas diffusion layer: Analysis by multiscale approach combining pore network and performance modelling. (2012) International Journal of Hydrogen Energy, vol. 37 (n° 2). pp. 1628-1641. ISSN 0360-3199
Any correspondance concerning this service should be sent to the repository
administrator: [email protected]

Performance loss of proton exchange membrane fuel cell due
to hydrophobicity loss in gas diffusion layer: Analysis
by multiscale approach combining pore network
and performance modelling
Joel Pauchet a,*, M. Prat b,c, P. Schott a, S. Pulloor Kuttanikkad d
aCEA, LITEN, LCPEM, Laboratory of Fuel Cell Components, Electrolysers and Modeling, 17 rue des Martyrs, 38054 Grenoble, FrancebUniversite de Toulouse, INPT, UPS, IMFT, Avenue Camille Soula 31400, Toulouse, FrancecCNRS, IMFT 31400, Toulouse, FrancedShell Global Solutions International, The Netherlands
Keywords:
PEM fuel cell
Gas diffusion layer
Two-phase flow
Pore network model
Degradation
Multiscale coupling
a b s t r a c t
Loss of hydrophobicity in the gas diffusion layers (GDL) is sometimes suggested as
a potential mechanism to explain in part the performance loss of PEMFC. The present
study proposes a numerical methodology to analyse this effect by combining pore network
modelling (PNM) and performance modelling (PM): the PNM/PM approach. PNM allows
simulating the decrease of through-plane gas diffusion coefficient in the GDL as a function
of the hydrophobicity loss, which is taken into account through the increase in the fraction
of hydrophilic pores in GDL. Then PM based on Darcy equations allows simulating
performance loss of PEMFC as a function of gas diffusion decay. This coupling shows that
the loss of hydrophobic treatment increases flooding, decreases performance, and
increases current density heterogeneities between inlet and outlet of the cell. Interestingly,
this degradation is found to be highly non-linear, mainly because of the non-linear influ-
ence of the fraction of hydrophilic pores on gas diffusion (this is due to the existence of
a percolation threshold associated with the hydrophilic pore sub-network) as well as the
non-linear behaviour of electrochemistry with gas diffusion. This study also shows that the
loss of hydrophobicity in a GDL is a very suitable candidate to explain performance loss
rates that are classically observed during long-term tests. The proposed methodology may
also help linking other local properties of components to fuel cell global performance.
Copyright
1. Introduction
Proton Exchange membrane fuel cells (PEMFCs) are one of the
most promising solutions as an alternative to combustion
engine with no pollution emission. Nevertheless, before their
industrialisation for automotive application, some bottle-
necks are to be solved to reduce their cost and to increase their
durability [1,2]. Numerous degradation mechanisms have
already been observed or are suggested to explain perfor-
mance loss of PEMFC (mechanical deformation, chemical
* Corresponding author. Tel.: +33 (0)4 38 78 52 96.E-mail address: [email protected] (J. Pauchet).
doi:10.1016/j.ijhydene.2011.09.127

modification, dissolution, thermal stress, etc). They concern
each component of the cell (membrane, active layer, gas
diffusion layer, bipolar plates) as well as each material (cata-
lyst, electrolyte, carbon fibres, carbon grains, etc). A complete
review of these mechanisms is beyond the scope of this paper
butmore details can be found in [1e3] for instance. Despite the
different studies, most of these mechanisms are not suffi-
ciently understood [2]. Evaluating the relative influence of
each of them on the global performance loss is very difficult
for the time being. Gas diffusion layers (GDLs) are already
known as playing a crucial role on water management (see for
instance [4]) and the significance of GDL contribution to
degradation mechanisms is more and more suggested [1,2].
Some experimental results even show that degradation of
hydrophobic treatment (including the one of GDL) can induce
a performance loss two times higher than catalyst dissolution
and agglomeration in the active layer [5]. This clearly shows
that the degradation of GDL, although less documented than
the one of active layer [2], must be taken into account to
evaluate global performance loss.
The main mechanisms suggested for explaining degrada-
tion of GDL are oxidation of the carbon fibres and loss of the
hydrophobic treatment [3]. After degradation, some properties
of the GDL are modified. Tian [6] states that the size of the
micropores of the cathode backing is reduced whereas Borup
[3] states that the volume of large pores has decreased but one
of the micropores has increased. Nevertheless, due to
different experimental and tightening conditions, the
comparison between these two results is difficult. Another
major modification refers to the change of GDL hydrophobic
behaviour before and after ageing. Even if an increase of
hydrophobic behaviour has been reported in some cases [6], it
is commonly accepted that ageing induces a loss of hydro-
phobic behaviour and consequently an increase of hydrophilic
behaviour [1e3,5,7] and references therein. These modifica-
tions due to ageing can be different on the microporous layer
(MPL) and on the backing [6], as well as on the anode side and
on the cathode side [5].
It should also be pointed out that wettability is often
characterised by the measurement of a “global” contact angle
Nomenclature
A cross-section, m2
a thermodynamic activity, e
C concentration, molm 3
D diffusion coefficient, m2 s 1
Deff effective diffusion coefficient, m2 s 1
dp pore diameter, m
dt throat diameter, m
E equilibrium potential, V
EW equivalent weight of Nafion, g/eq
e thickness, m
F Faraday constant, 96,485 Cmol 1
f fraction of hydrophilic pores
fc hydrophilic sub-network percolation threshold
i current density, Am 2
J molar flux, mol s 1
Kp pressure drop coefficient, Pam 4 s
L length, m
M molar mass, kgmol 1
N molar flux density, molm 2 s 1
neo electro-osmotic drag coefficient, e
P pressure, Pa
Q flow rate, m3 s 1
R resistivity, ohmm2
S saturation, e
SBT saturation at breakthrough, e
T temperature, K
t time, h
U voltage, V
X molar fraction, e
z coordinate along the channel length, m
Greek
a parameter of the electrochemical law
b parameter of the electrochemical law
d parameter of the Weibull law used in PNM
r density, kgm 3
h Overpotential, V
l membrane water content, e
l0 parameter of the Weibull law used in PNM
g parameter of the Weibull law used in PNM
s conductivity, Sm 1
q contact angle, "
Subscripts
act activation
dry related to dry porous medium
eff effective
eo electro-osmotic
g gas
inlet inlet of the cell
m membrane
max maximum
min minimum
outlet outlet of the cell
n nitrogen
rev reversible
sat saturation
v vapour
x oxygen (at the cathode) or hydrogen (at the anode)
Acronyms
CL catalyst layer
DMFC direct methanol fuel cell
GDL gas diffusion layer
IP invasion percolation
LBM lattice Boltzmann modelling
MC Monte-Carlo
MEA membrane-electrodes assembly
MPL microporous layer
PEMFC proton exchange membrane fuel cell
PM performance modelling
PNM pore network modelling
PTFE polytetrafluoroethylene
REV representative elementary volume
on the surface of the GDL with droplets much larger than the
pore size of the medium. It is therefore questionable to
consider these measurements as really representative of the
wettability of GDL fibrous matrix since the GDL external
surface is not flat but porous. Local measurements, for
instance on the pore walls, would be of major interest [1] but
are not available for the moment [3]. In the absence of a better
characterisation, we therefore consider that the comparison
of these “global” surface contact angles is up-to-date a good
way to compare wettability before and after ageing. As sug-
gested in [1,8e10] we also consider the GDL as a mixed-wet
porous medium in which some hydrophilic zones (with
a contact angle qcarbone w80" corresponding to carbon fibres)
are mixed with some hydrophobic ones (with a contact angle
qPTFE w115" corresponding to the coating of carbon fibres by
fluoropolymer, [9]). The increase in the fraction of hydrophilic
zones is assumed to be a consistent way to describe the loss of
hydrophobicity. For more discussion about these hypotheses,
the reader can refer to for instance [10].
As stated above, the understanding of degradation mech-
anisms in PEMFC requiresmore effort but there is also a global
lack of understanding concerning the reasons why degrada-
tion of each individual component induces performance loss
[2]. It is commonly suggested that the GDL loss of hydropho-
bicity increases the flooding and then decreases the perfor-
mance [1e3] but up-to-date, no real analysis allows discussing
this [2] as no approach allows linking explicitly and correctly
hydrophobicity loss of GDL to performance loss of PEMFC.
To fill this gap, we propose a new modelling approach,
combining performance modelling (PM) at the scale of the cell
and pore network modelling (PNM) at the scale of a compo-
nent (in our case the GDL on the cathode side as well as on the
anode side). The approach is therefore called the PNM/PM
approach.
Current PM, e.g. for instance [11e14], are based on macro-
homogeneous approach in which transfers are modelled
using transfer coefficients such as effective permeability,
diffusion, capillary pressure, etc which are dependent on the
material, on its local properties (wettability, pore sizes, etc)
and also on its liquid saturation level. Unfortunately, due to
experimental difficulties, most of these coefficients remain
globally unknown for GDL and the scarce results [15e17] do
not explain how these coefficients will be modified as a func-
tion of ageing. An additional aspect is that the relationships
used in macro-homogeneous PM are based on the classical
phenomenological relations, such as Darcy’s law for example,
which is questionable in the case of GDL for several reasons.
When the wettability is mixed, it is not easy to predict the
impact of local (i.e. at the scale of microstructure) wettability
changes directly at the Darcy’s scale. Scale separation
between thickness of GDL and pore sizes is not sufficient and
transfer coefficients depend on the thickness [18]. Water
invasion regime is a function ofwettability and as discussed in
[19] it is not correct to use the same capillary pressure
description (the so-called Leverett function) as for a purely
hydrophobic system when the wettability is sufficiently
modified due to the loss of hydrophobicity.
All this suggests that care should be exercisedwhen PM are
used to analyse the effect of degradation of GDL due to
hydrophobicity loss on performance of PEMFC.
By contrast, PNM, see for example the review [20], are well
suited to analyse fluid transfers in GDL as a function of its
properties at pore scale. PNM, even when the GDL is repre-
sented by a simplified structure such as a cubic network
[9,10,18], have yielded numerous interesting results not only
on two-phase regime and liquid pattern inside the GDL but
also on effective transfer coefficients. They allowed for
instance analysing the effect of a change in wettability when
the wettability is spatially uniform [19]. as well as the effect of
changes in the local wettability properties in a network of
mixed wettability on gas diffusion properties [10]. In the
model considered in [10], a pore is either hydrophilic (q¼ 80")
or hydrophobic (q¼ 115"). The fraction of hydrophilic pores in
the network can be varied and is randomly distributed within
the network (hydrophilic pores correspond to local zones of
GDL where the fibre surface is not covered by PTFE). The
results reported in [10] show that the through-plane gas
diffusion coefficient decreases as the number of hydrophilic
pores in the GDL increases, due to blockage of pores by liquid
water. This simple model of random distribution of hydro-
philic pores suggests also the existence of a percolation
threshold. When the fraction of hydrophilic pores is below
this threshold, hydrophobicity loss has a small effect on gas
diffusion whereas gas diffusion drastically decreases as
hydrophobicity decreases above the threshold. Classical
relationships for modelling gas diffusion, generally imported
from studies considering porous media quite different from
a GDL, are also shown to overestimate gas diffusion compared
to PNM simulations [9,10].
It should be pointed out that other approaches such as
Lattice Boltzmann Modelling (LBM) [21] or Monte-Carlo (MC)
[22] were also developed to study two-phase flow in GDL at
pore scale. Seidenberger et al. for instance [22] concludes that
water content in GDL increases as hydrophobic surface of the
pore decreases with the existence of a critical value above
which large liquid clusters appear. This result is, at pore scale,
somewhat analogous to the effect of the hydrophilic pore
percolation threshold at the scale of the complete GDL [10].
However, LBM orMC implies using several grid points per pore
size in each direction of space. By contrast, a pore is repre-
sented by only one grid point in PNM. As a result, computation
times of LBM andMC aremuch higher compared to PNM. PNM
thus appears as an excellent compromise between accuracy
and computational efficiency compared to LBM or MC.
Nevertheless, PNM involves three-dimensional computa-
tions, which are relatively computer time demanding. PNMs
are therefore not adapted to the direct simulation of PEMFC
performances. As mentioned before, the main idea of the
present article is therefore to combine the advantages of both
PNM and PM approaches to analyse the impact of the change
in hydrophobicity on performances.
First link between GDL water invasion and performance
was proposed by Gostick et al. [9]. This work aimed at ana-
lysing the link between mass transfer properties of GDL and
the limiting current of a PEMFC, assuming that mass transfer
limitation was only due to GDL. The results clearly show that
liquid water invasion in the GDL has a great influence on the
performance of PEMFC, at least on the limiting current which
drastically decreases due to mass transfers resistances in the
GDL. However, the pore network considered in [9] was 100%

hydrophobic with constant hydrophobicity (qe115") and the
approach did not allow calculating the complete performance
of a PEMFC. By contrast, a mixed wettability network is
considered in the present article and a new approach, the
PNM/PM approach, is developed to predict the PEMFC
performances.
In summary, the present paper has twomain objectives: (i)
introducing the PNM/PM approach and (ii) contributing ana-
lysing the link between loss of local wettability in GDL and loss
of performance of PEMFC thanks to the PNM/PM approach.
The paper is organised as follows. Section 2 describes the
methodology, i.e. how the pore network and performance
models can be combined to analyse the influence of GDL
structural properties on PEMFC performances. Section 3
explains how the loss of hydrophobicity in the GDL induces
the decrease of GDL gas diffusion properties and then the
degradation of performance of PEMFC. A discussion is then
proposed to link hydrophobicity loss rate to experimental
performance degradation rate. Then some concluding
remarks are offered in Section 4. The paper ends with an
Appendix where the equations of PM are reported.
2. The multiscale pore network/performancemodel approach to link micro-scale degradationof GDL to performance degradation
2.1. Motivation, overview and hypothesis
As already described in Section 1, fluid transfer coefficients in
GDLs are generally poorly known and classical (Darcy’s scale)
models of two-phase transfers are doubtful. This is especially
true when one is interested in simulating the effect of
hydrophobicity loss in a mixed-wet GDL on the performance
of the cell. On the other hand PNM offers a possible approach
to analyse fluid transfers in mixed-wet GDL as a function of
the fraction of hydrophilic pores. PNM also allows calculating
more representative effective transfer coefficients as a func-
tion of the fraction of hydrophilic pores.
As sketched in Fig. 1, the general methodology proposed,
referred to as the PNM/PM approach, is then to take advantage
of both approaches by combining them in the following way:
(i) a PNM is used for computing effective transfer coefficients
as a function of local properties of GDL, and then (ii) these
effective coefficients are used as inputs in PM to compute the
performance of the cell.
This three scales methodology allows first coupling
between local properties (pore scale) of GDL to its effective
properties (Darcy scale), and then to its performance in
a PEMFC (macro scale). The loss of hydrophobicity in the GDL
is simulated by increasing the fraction f of hydrophilic pores:
f¼ 0 corresponds to a fresh GDL considered as a totally
hydrophobic medium of uniform wettability (q¼ 115");
0< f< 1 corresponds to a partially aged GDL of mixed wetta-
bility with a fraction f of hydrophilic pores (q¼ 80") and
a fraction (1 f) of hydrophobic pores (q¼ 115"); f¼ 1 corre-
sponds to a fully aged GDL considered as a totally hydrophilic
medium of uniform wettability (q¼ 80"). As f(t), i.e. the
evolution of f as a function of time, is for the time being not
directly measured (see Section 3.3), results are first expressed
as a function of f.
Then the performance is computed as a function of t under
different assumptions on f(t). Some of them derive from
contact angle measurements available in the open literature
(see Section 3).
2.2. Thin system through-plane macro-description and
PM
PNM allows calculating different fluid transfer coefficients
such as liquid and gas permeability, gas diffusion, and capil-
lary pressure as a function of liquid saturation level, e.g. [10]
and references therein. Nevertheless, as GDL is a thin
system with insufficient scale separation over the thickness,
these coefficients are dependent on the size of the volume
over which they are calculated (see for instance [18]). In other
terms, the concept of local effective coefficient in the through-
plane direction becomes meaningless in a thin system (see
also [23] for a discussion on the concept of thin porous
system). For this reason, in this study we consider coefficients
calculated over the complete thickness of the GDL, e.g. [10].
Since these coefficients are not considered as local as in
a standard continuum approach to porous media but
describes the through-plane behaviour of the entire porous
layer, we propose to call them global effective coefficients so
as to make a clear distinction with the classical local effective
coefficients traditionally associated with the concept of REV
(Representative Elementary Volume). The consequence is that
the GDL is not meshed across its thickness (0D Model in the
thickness). This is an important and original feature of the
PNM/PM approach presented in this paper.
The “global effective transfer coefficients” can be seen as
transfer functions describing the response of the thin layer as
a function of the global saturation level.
In this study, performance of the cell is mainly driven by
gas diffusion and not by permeability. So the only global
effective transfer coefficient considered is the through-plane
gas diffusion coefficient. Note that this coefficient does
include the effect of capillarity as it is calculated by the two-
phase PNM which takes into account capillary effects (see
Section 2.3). In fact, one can distinguish the dry regions in the
GDL from the wet ones. The dry regions are the regions where
the PM predicts that water is only in the vapour phase. The
global effective gas diffusion is constant over time in dry
regions. Thus we make the assumption that the possible
change in wettability (loss of PTFE) has a negligible impact on
the GDL microstructure and therefore on the global effective
coefficient. Consequently the global effective diffusion coef-
ficient in dry regions is not subject to degradation and does
not vary with time. The wet regions are the regions where the
PM predicts that liquid water exists. In wet regions, the global
effective diffusion coefficient is calculated at breakthrough
that is when liquid water percolates across the GDL. It is
a function of f (and therefore varies with time) but is not
a function of the water production. In the quasi-static inva-
sion limit prevailing in PEMFC [18], the liquid distribution
inside the GDL for given injection conditions indeed remains
the same (and therefore also the gas diffusion) whatever the
injected liquid water flux is. We also consider that the loss of

hydrophobicity does not modify the electrical, thermal and
mechanical properties of GDL which are then kept constant
over time.
Pore network and performance models used in this
approach are described in the next two subsections.
2.3. Pore network modelling (PNM)
PNM is based on the representation of the pore space in terms
of a network of pores (or sites) connected by throats (or
bonds). The “pores” roughly correspond to the larger voids
whereas the throats connecting the pores correspond to the
constrictions of the pore space. The results useful to the
present study were obtained in [10]. For completeness, the
main features of PNM used in [10] are briefly summarised in
this subsection.
As in many previous works, see [20], and as depicted in
Fig. 1, a simple cubic network is considered. Although it would
be certainly interesting to use a more realistic representation
of GDL pore space skeleton, the simple pore network used in
Fig. 1 e Chart of the PNM/PM approach. In the present study, this approach is applied for increasing wettability of GDL to
mimic degradation due to PTFE loss.
[10] is a priori sufficient to capture the effect of the local
changes inwettability properties. It should be also pointed out
that models based on more realistic skeletons are in fact not
yet available for the fibrous materials forming GDLs. In our
case, pores of cubic shape are thus regularly placed on a 3D
cartesian grid. Two first neighbour pores are linked by
a channel of square cross-section. Such a channel is referred
to as a bond or throat. The pore size dp, which corresponds to
the diameter of the largest sphere inscribed within the pore, is
randomly distributed according to a probability law in the
range [dpmin, dpmax]. A Weibull distribution is used in the
present study. More precisely, the pore sizes are randomly
specified using the expression
dp ¼ dpmin þ
dpmax dpmin
!
h
f dlnðl0ð1 expð 1=dÞÞ
þ expð 1=dÞÞg1=g
i
(1)
with d¼ 0.1, g¼ 4.7; l’ is randomnumber drawn in the interval
[0,1]. The size dt of a throat is then specified as equal to the
minimum size of its two adjacent pores, dt¼min (dpi, dpj). The
results useful to the present study were obtained with
dpmax¼ 25 mm, dpmin¼ 10 mm, see [10] for more details. These
values are representative of pore size distributions in GDL, e.g.
[9], and lead to an average porosity of 0.77 for our model GDL.
The network size is characterised by the number of pores
placed in each direction. As discussed in [18], a 40) 40) 10
network is considered as representative of a GDL unit cell with
the in-plane extension corresponding roughly to the distance
between two channels of the bipolar plate. The pore network
is fully hydrophobic and hydrophilic when all throats and
pores are hydrophobicand hydrophilic, respectively. In
a mixed wettability pore network a fraction f of the pores and
of the throat are randomly specified as hydrophilic (q w80").
The remaining pores and throats are hydrophobic (q w115").
There are therefore a fraction 1 f of hydrophobic pores and
throats in the network. For convenience, such a network will
be referred to as a network containing a fraction f of hydro-
philic “pores” but this means in fact that the fraction of
hydrophilic throats and the fraction of hydrophilic pores are
both equal to f.
It is widely admitted that liquid water invasion in a GDL
can be computed in the quasi-static limit, that is the invasion
is controlled by capillary effects only, [19]. When the porous
matrix is sufficiently hydrophobic, quasi-static water invasion
can be simulated rather simply using the well-known inva-
sion percolation (IP) algorithm, [24]. When the medium is
hydrophilic, the computation is significantly more involved
because of cooperative mechanisms controlling the growth of
the interface between the two fluidswithin the pore space, see
[10,19] for more details. The PNM results used for the present
article were obtained using the quasi-static invasion algo-
rithms described in [10]. Liquid water is injected at the GDL
inlet and progressively invades the GDL. The simulation stops
at breakthrough that is when the liquid reaches the GDL
outlet. The volume fraction of the pore space occupied by
liquid water at breakthrough is referred to as the saturation at
breakthrough and is denoted by SBT.
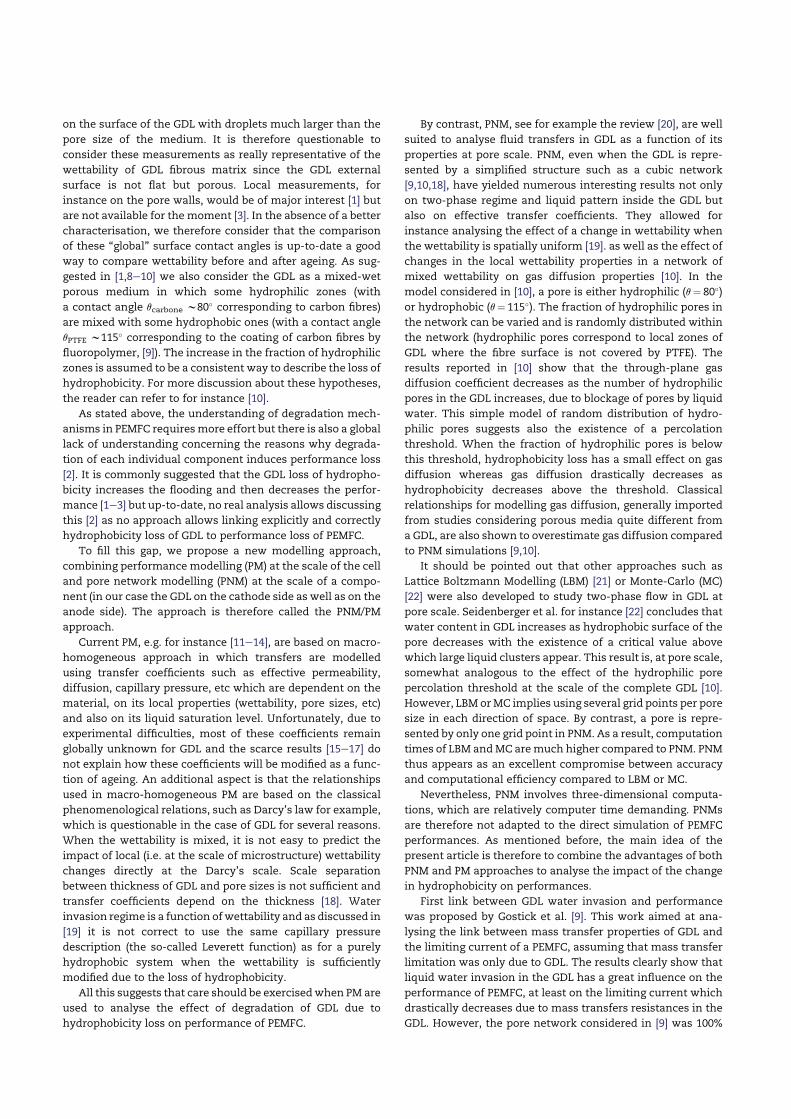
As depicted in Fig. 2, the global saturation at break-
through as a function of f computed with the PNM model
shows two very distinct behaviours depending of the value
of f with respect to the hydrophilic sub-network percolation
threshold fc (fc w47% here), see again [10] for more details.
As can be seen from Fig. 2, the variation of SBT with f is quite
weak for f* fc. By contrast, SBT increases quite significantly
with f when f> fc, indicating that the fraction of pore space
left free for the gas transport significantly decreases with f in
this range.
The procedure for computing the effective binary diffusion
coefficient from pore network simulations is described in
several previous GDL related studies, e.g. [9] for example. For
a given stage of pore network occupancy by the water, local
diffusive conductances are assigned to each pore and throat
occupied by the gas phase. Then a linear system of equations
is formed by expressing the mass conservation at each
gaseous pore of the network and imposing a concentration
difference across the network. Solving numerically the linear
system gives the concentration of the considered species (i.e.
oxygen) at each gaseous pore of network. This allows
computing the diffusive flux across the network and then to
determine the global effective diffusion coefficient Deff from
the mathematical expression of the through-plane macro-
scopic flux J, which is expressed as
J ¼ADeff
LðCinlet CoutletÞ (2)
where A is the cross-section area of the porous medium, L is
the porous medium thickness and Cinlet and Coutlet are the
concentrations imposed at the inlet and the outlet, respec-
tively. The procedure used in [10] is the same as the one
0 20 40 60 80 100
f (%)
0
0,2
0,4
0,6
0,8
SBT
Deff
/ D (Eq.(5))
Deff
/ D (PNM)
Fig. 2 e Non-linear effect of loss of hydrophobicity on gas
diffusion coefficient through the GDL [10]. SBT is the overall
saturation at breakthrough (see text). Eq. (5) in this figure
does not refer to an equation in the text but to the classical
Bruggeman expression DeffðSÞ[ε1:5ð1LSBTÞ
1:5D (the figure
is imported and adapted from [10]). As can be seen, this
classical correlation leads to overestimate the through-
plane global effective coefficient compared to the PNM
simulations. This coefficient decreases weakly with f
ðdðDeff=DÞ=dfzL0:08Þ below the percolation threshold
( f £ fcz 47%) whereas the decreasing with f is quite
significant for f above fc ðdðDeff=DÞ=dfzL1:3Þ.
described in [9] and therefore the details are not given again
for the sake of brevity.
The global effective diffusion coefficient was computed as
a function of f, i.e. for the different pore liquid occupancy
corresponding to the saturation at breakthrough depicted in
Fig. 2. The so obtained evolution of the global effective diffu-
sion coefficient (through-plane coefficient over the whole
thickness of the network) is also shown in Fig. 2. Again, one
can distinguish twomain domains. For f below fc, Deff remains
high (of the order of 0.4e0.5D, whereD is the binarymolecular
diffusion coefficient) whereas it decreases steadily down to
zero (which is reached for f w85%) as f increases above fc.
2.4. Performance modelling (PM)
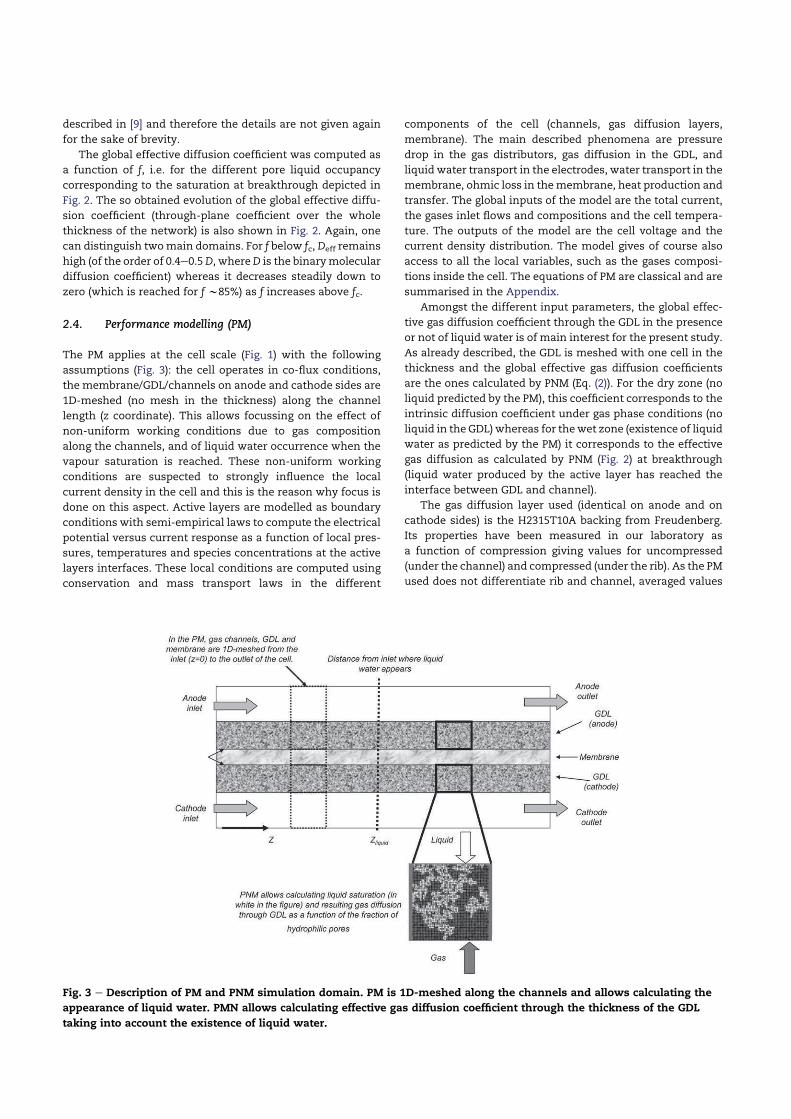
The PM applies at the cell scale (Fig. 1) with the following
assumptions (Fig. 3): the cell operates in co-flux conditions,
the membrane/GDL/channels on anode and cathode sides are
1D-meshed (no mesh in the thickness) along the channel
length (z coordinate). This allows focussing on the effect of
non-uniform working conditions due to gas composition
along the channels, and of liquid water occurrence when the
vapour saturation is reached. These non-uniform working
conditions are suspected to strongly influence the local
current density in the cell and this is the reason why focus is
done on this aspect. Active layers are modelled as boundary
conditions with semi-empirical laws to compute the electrical
potential versus current response as a function of local pres-
sures, temperatures and species concentrations at the active
layers interfaces. These local conditions are computed using
conservation and mass transport laws in the different
components of the cell (channels, gas diffusion layers,
membrane). The main described phenomena are pressure
drop in the gas distributors, gas diffusion in the GDL, and
liquid water transport in the electrodes, water transport in the
membrane, ohmic loss in themembrane, heat production and
transfer. The global inputs of the model are the total current,
the gases inlet flows and compositions and the cell tempera-
ture. The outputs of the model are the cell voltage and the
current density distribution. The model gives of course also
access to all the local variables, such as the gases composi-
tions inside the cell. The equations of PM are classical and are
summarised in the Appendix.
Amongst the different input parameters, the global effec-
tive gas diffusion coefficient through the GDL in the presence
or not of liquid water is of main interest for the present study.
As already described, the GDL is meshed with one cell in the
thickness and the global effective gas diffusion coefficients
are the ones calculated by PNM (Eq. (2)). For the dry zone (no
liquid predicted by the PM), this coefficient corresponds to the
intrinsic diffusion coefficient under gas phase conditions (no
liquid in the GDL) whereas for thewet zone (existence of liquid
water as predicted by the PM) it corresponds to the effective
gas diffusion as calculated by PNM (Fig. 2) at breakthrough
(liquid water produced by the active layer has reached the
interface between GDL and channel).
The gas diffusion layer used (identical on anode and on
cathode sides) is the H2315T10A backing from Freudenberg.
Its properties have been measured in our laboratory as
a function of compression giving values for uncompressed
(under the channel) and compressed (under the rib). As the PM
used does not differentiate rib and channel, averaged values
Fig. 3 e Description of PM and PNM simulation domain. PM is 1D-meshed along the channels and allows calculating the
appearance of liquid water. PMN allows calculating effective gas diffusion coefficient through the thickness of the GDL
taking into account the existence of liquid water.

between rib and channel have been used as inputs leading to:
thickness 192 mm, thermal conductivity 0.44 W/m/K, porosity
0.77, electrical conductivity 53 S/m.
For a given total current density delivered by the fuel cell,
the PM calculates the electrical potential for different gas
diffusion coefficient in the GDL, each of them corresponding
to different values of f. The simulation time on an Intel Core 2
Duo (2.66 Ghz) ranges from someminutes (no liquidwater and
high gas diffusion coefficient) to 1 h (high liquid water content
and low gas diffusion coefficient).
2.5. The PNM/PM approach
In the PNM/PM coupling approach considered in this article,
the GDL is meshed in the PM only along the channels. This is
consistent with the fact that scale separation in the GDL is
sufficient in the in-plane directions and not in the two others.
This 1D-mesh will allow taking into account that liquid satu-
ration and performance are different between the inlet and
the outlet of the cell. The two-phase PNM simulations are
performed in a 3D domain representative of GDL unit cell
(thickness, distance between rib and channel and distance
along the channel) to derive effective gas diffusion coefficient
taking into account 3D effects in the GDL, especially liquid
coalescence which affects largely two-phase pattern and thus
gas diffusion and that are completely different between 2d
and 3D cases.
The PNM/PM approach is described in Figs. 1 and 3. The
approach can be considered as a one way coupling between
PM and PNM since the PNM results are input data for the PM.
In the present study, this approach is applied for increasing
wettability of GDL tomimic degradation due to PTFE loss. This
is presented in the next section.
3. Degradation of performance due to GDLloss of hydrophobicity
3.1. Impact of wettability loss on gas diffusion
As mentioned before, the main idea is to consider that the
wettability loss can be represented by the increase in the
fraction f of hydrophilic elements (pores and throats) in the
system. As discussed in more detail in [10], this change in
wettability has little impact on the water invasion pattern as
long as f is lower than the percolation threshold fc of the
hydrophilic pore sub-network. The pattern is ramified, see 2D
examples in [10], and a significant fraction of the pore space
remains free of water, thus available for transport in gas
phase. By contrast, the pattern becomes increasingly compact
as f increases in the range [fc, 1] and the network becomes
almost fully flooded at breakthrough for f¼ 1, that is when the
network is fully hydrophilic.
Accordingly, as pointed out before and shown in Fig. 2,
there is little change in the global saturation at breakthrough
SBT as long as f* fc whereas the increase in saturation with f is
significant in the range [fc, 1]. This in turn induces the evolu-
tion of through-plane global diffusion coefficient with f shown
in Fig. 2. The evolution of Deff is strongly non-linear with two
distinct evolutions depending on the value of fwith respect to
the percolation threshold. This coefficient decreases weakly
with f ðdðDeff=DÞ=dfz 0:08Þ below the percolation threshold
whereas the decreasing with f is quite significant for f above fcðdðDeff=DÞ=dfz 1:3Þ.
It should be pointed out that the results shown in Fig. 2
were obtained assuming a classical boundary condition at
the pore network inlet. As discussed in [25] and in more depth
in [23], the water invasion boundary condition to impose at
the inlet for the PNM simulations is still somewhat unclear.
The classical boundary condition amounts to considering that
the GDL is in contact at the inlet with a liquid water reservoir
at uniform pressure. However, the GDL backing is an oper-
ating fuel cell is in contact with a finer porous layer (the
catalyst layer or themicroporous layer) and therefore not with
a free liquid reservoir. From a purely phenomenological vision
of water generation in the catalyst layer, this led to consider in
[25] that liquid water enters the GDL rather through a series of
independent injection points at the inlet. As shown in [23] and
[25], this has a significant impact on pore occupancy at
breakthrough compared to the classical free reservoir
boundary condition. However, results with this new, probably
more realistic, boundary condition for networks of mixed
wettability indicate the same tendancy as the one shown in
Fig. 2, i.e. a significant decrease of Deff with f for f> fc [26]. For
this reason, we have therefore considered, as inmost previous
works using a PNM approach, see [20], results for Deff obtained
with the traditional boundary condition. This is sufficient to
illustrate the capabilities of the PNM/PM approach and to
study the impact of wettability loss on performances.
3.2. Performance decreases as wettability increases
The above described PM has been applied to simulate the
performance of a single-cell (25 cm2, co-flux) under the
following working conditions: H2/air, stoechiometry 1.5
(anode) and 1.8 (cathode), gas relative humidity 40% (anode)
and 60% (cathode), gas and cell temperature 80 "C, gas pres-
sure (outlet of the cell) 1.5 bar. Electrical potential is then
calculated at 0.6 A/cm2.
In a first step, computations are performed considering
a fresh GDL thus simulating the initial conditions (t¼ 0) of the
degradation process. As illustrated in Fig. 4, results show that
under theseworking conditions, liquidwater formswithin the
cell on both anode and cathode sides above a certain distance
zliquid (around 80% of the total length) from the inlet. This is
due to the fact that the relative gas humidity in the channel
increases along the channel from the inlet to the outlet of the
cell inducing an increase of liquidwater production. Note here
that for fresh and aged GDL liquidwater appears on anode and
cathode sides at the same position which is due to two main
reasons: (i) water transfer through the membrane is very
efficient between anode and cathode and (ii) differences
between anode and cathode can be smoothed due to the
meshing from inlet to outlet. The cell is then shared in two
regions: a dry region without liquid water from the inlet up to
z¼ zliquid, and a wet region with liquid water from z¼ zliquid up
to the outlet. The fact that liquid water is present in the GDL
under the initial working conditions (no degradation at t¼ 0) is
of course a clear indication that hydrophobicity loss in the
GDL is likely to have an impact on performance. One reason is

that liquid water is supposed to increase hydrophobicity loss
and the other reason is that PNM shows that hydrophobicity
loss (increase in fraction f of hydrophilic pores) reduces gas
diffusion.
One other output is that the current density is not uniform
in the cell. This is shown in Fig. 5. The average value is 0.6 A/
cm2 (input for the calculation) but local current density
decreases from 0.66 A/cm2 (at the inlet) to 0.5 A/cm2 (at the
outlet). As shown in Fig. 6, this ismainly due to the decrease of
oxygen fraction due to consumption.
In order to simulate the effect of the wettability increase,
the same calculation is then performed for increasing values
of fraction f of hydrophilic pores. It is assumed that f remains
uniform in the whole volume of the GDL, especially between
the inlet and the outlet of the cell, whichmeans that we do not
consider the influence of liquid water on degradation. This
could be added in the future but this dependency remains
unknown up-to-date. Nevertheless, a simple sensitivity
analysis will be discussed in next section.
For each value of f, the corresponding value of gas diffusion
calculated by PNM is used as an input for the PM. Simulations
performed for aged GDL, for example for f¼ 0.8, show that
liquidwater progresses up to the inlet (Fig. 4). In thewet region
(z> zliquid), wettability and f will increase, gas diffusion will
decrease inducing a reduction of current density. This will be
compensated by an increase in current density then in water
production in the dry region upstream in which new conden-
sation will then occur at the location where partial vapour
pressure is already thehighest, i.e. at the interfacebetweendry
andwet regions. Degradationwill then increase the size of the
wet region, which eventually progresses up to cell inlet.
As shown in Fig. 5, this will also increase the current
density non-uniformity in the cell, which ranges nowbetween
0.9 A/cm2 (at the inlet) and 0.2 A/cm2 (at the outlet). This
increased non-uniformity is linked to a competition between
proton transport due to membrane hydration (improved from
the inlet as gas hydration increases) and gas diffusion
(reduced towards the outlet as water vapour (and even liquid
water) increases and oxygen concentration reduces (Fig. 6)).
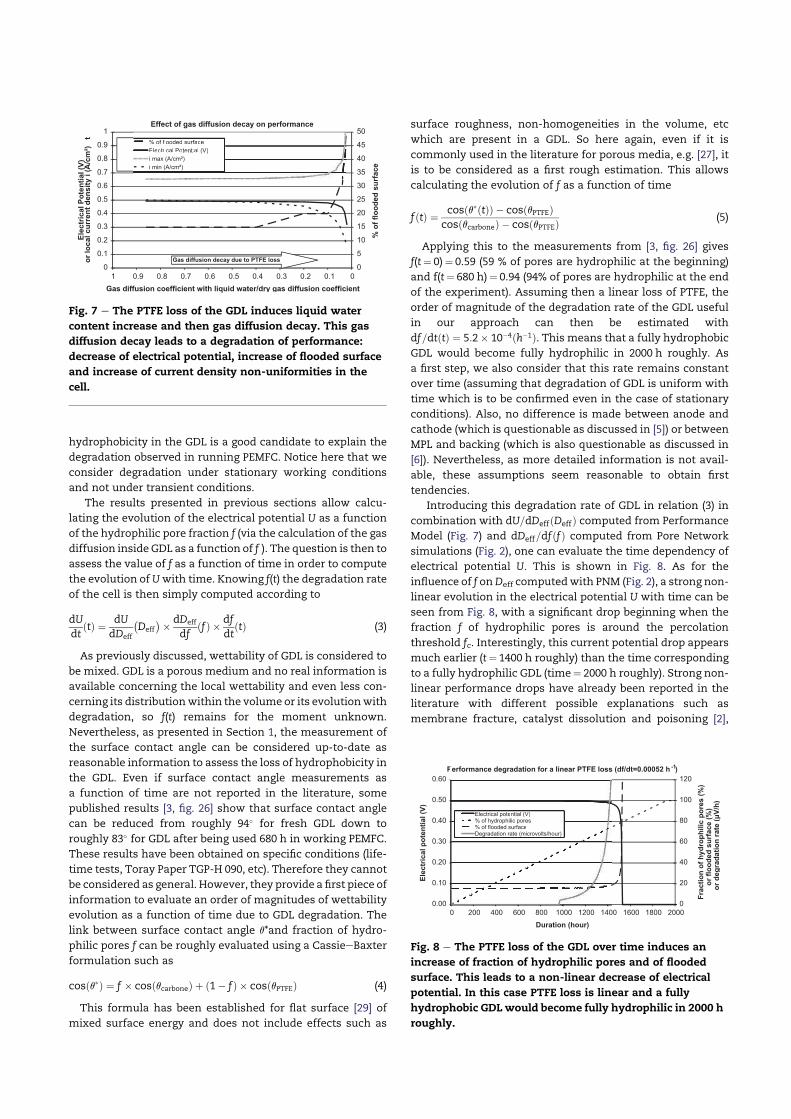
These results are summarised in Fig. 7, which also shows
that performance decreases as gas diffusion decreases and
more rapidly as diffusion approaches roughly 30% of its initial
value. Here again we do find a non-linear behaviour of
degradation.
It is interesting to point out also that no calculation was
possible forDeffðtÞ=Deffðt ¼ 0Þ < 0:03. This is due to the fact that
this low gas diffusion coefficient is obtained for a very low
hydrophobicity of the GDL ( f¼ 0.8) for which the working cell
is characterised by larger wet regions occupied by liquid
water. In that case the global gas diffusion coefficient (on the
whole cell) is not sufficient tomaintain the gas flux at the level
necessary for the requested current. Under these conditions,
the cell can be considered as flooded.
3.3. Estimation of degradation rate of performance
The above results clearly show that loss of performance of
PEMFC is more than likely when hydrophobicity of GDL
decreases due to degradation. The question is now to relate
this performance loss with time in order to compare the
calculated degradation rate with the experimental one (clas-
sically expressed in mV/h) and then discuss how far the loss of
Fig. 6 e Oxygen fraction at the active layer decreases along
the channels and aged GDL ( f[ 80%) induces a more rapid
decrease compared to a fresh one ( f[ 0%). Note the
existence of a flooded area near the outlet with nearly no
more oxygen available for electrochemical reaction.
Fig. 4 e Liquid water appears at the cell outlet and the area
of the cell with liquid water is larger with an aged GDL ( f
[ 80%) than with a fresh one ( f[ 0%).
Fig. 5 e Current density is higher at the cell inlet and non-
uniformities of current density are more important with an
aged GDL ( f[ 80%) than with a fresh one ( f[ 0%).
hydrophobicity in the GDL is a good candidate to explain the
degradation observed in running PEMFC. Notice here that we
consider degradation under stationary working conditions
and not under transient conditions.
The results presented in previous sections allow calcu-
lating the evolution of the electrical potential U as a function
of the hydrophilic pore fraction f (via the calculation of the gas
diffusion inside GDL as a function of f ). The question is then to
assess the value of f as a function of time in order to compute
the evolution of Uwith time. Knowing f(t) the degradation rate
of the cell is then simply computed according to
dU
dtðtÞ ¼
dU
dDeff
Deff
!
)dDeff
dfðfÞ )
df
dtðtÞ (3)
As previously discussed, wettability of GDL is considered to
be mixed. GDL is a porous medium and no real information is
available concerning the local wettability and even less con-
cerning its distributionwithin the volume or its evolutionwith
degradation, so f(t) remains for the moment unknown.
Nevertheless, as presented in Section 1, the measurement of
the surface contact angle can be considered up-to-date as
reasonable information to assess the loss of hydrophobicity in
the GDL. Even if surface contact angle measurements as
a function of time are not reported in the literature, some
published results [3, fig. 26] show that surface contact angle
can be reduced from roughly 94" for fresh GDL down to
roughly 83" for GDL after being used 680 h in working PEMFC.
These results have been obtained on specific conditions (life-
time tests, Toray Paper TGP-H 090, etc). Therefore they cannot
be considered as general. However, they provide a first piece of
information to evaluate an order of magnitudes of wettability
evolution as a function of time due to GDL degradation. The
link between surface contact angle q*and fraction of hydro-
philic pores f can be roughly evaluated using a CassieeBaxter
formulation such as
cosðq+Þ ¼ f ) cosðqcarboneÞ þ ð1 fÞ ) cosðqPTFEÞ (4)
This formula has been established for flat surface [29] of
mixed surface energy and does not include effects such as
surface roughness, non-homogeneities in the volume, etc
which are present in a GDL. So here again, even if it is
commonly used in the literature for porous media, e.g. [27], it
is to be considered as a first rough estimation. This allows
calculating the evolution of f as a function of time
fðtÞ ¼cosðq+ðtÞÞ cosðqPTFEÞ
cosðqcarboneÞ cosðqPTFEÞ(5)
Applying this to the measurements from [3, fig. 26] gives
f(t¼ 0)¼ 0.59 (59 % of pores are hydrophilic at the beginning)
and f(t¼ 680 h)¼ 0.94 (94% of pores are hydrophilic at the end
of the experiment). Assuming then a linear loss of PTFE, the
order of magnitude of the degradation rate of the GDL useful
in our approach can then be estimated with
df=dtðtÞ ¼ 5:2) 10 4ðh 1Þ. This means that a fully hydrophobic
GDL would become fully hydrophilic in 2000 h roughly. As
a first step, we also consider that this rate remains constant
over time (assuming that degradation of GDL is uniform with
time which is to be confirmed even in the case of stationary
conditions). Also, no difference is made between anode and
cathode (which is questionable as discussed in [5]) or between
MPL and backing (which is also questionable as discussed in
[6]). Nevertheless, as more detailed information is not avail-
able, these assumptions seem reasonable to obtain first
tendencies.
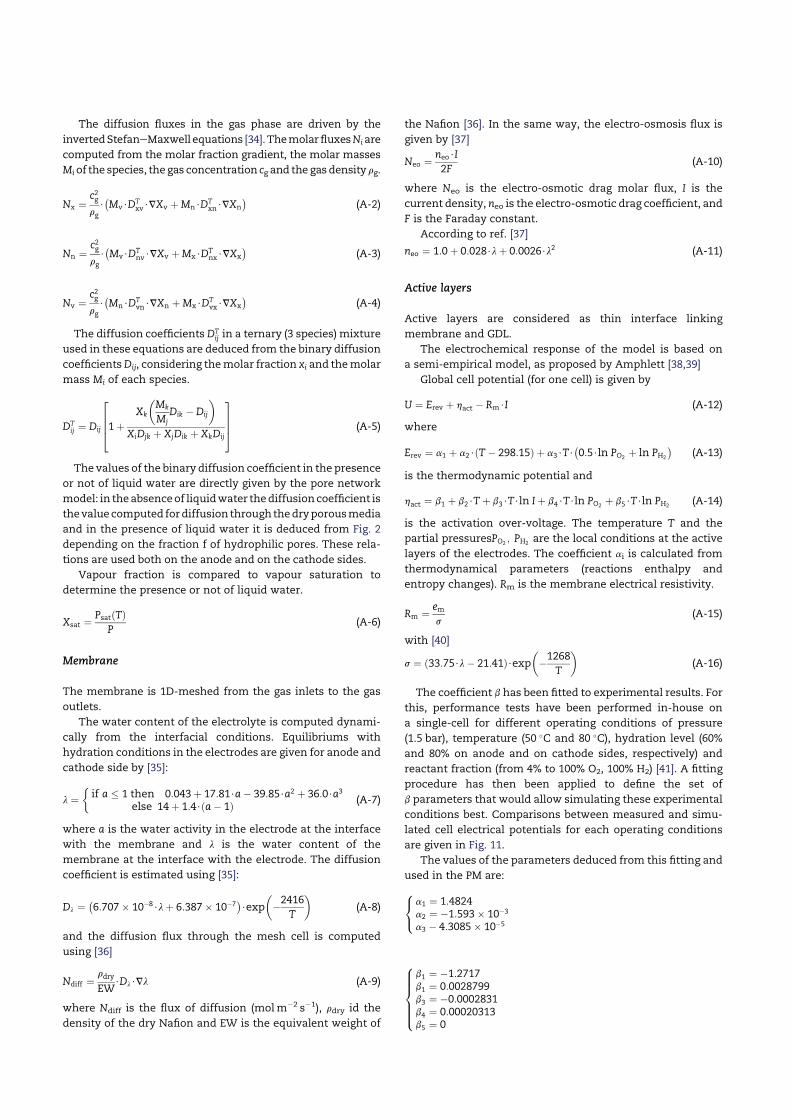
Introducing this degradation rate of GDL in relation (3) in
combination with dU=dDeffðDeffÞ computed from Performance
Model (Fig. 7) and dDeff=dfðfÞ computed from Pore Network
simulations (Fig. 2), one can evaluate the time dependency of
electrical potential U. This is shown in Fig. 8. As for the
influence of f onDeff computedwith PNM (Fig. 2), a strong non-
linear evolution in the electrical potential U with time can be
seen from Fig. 8, with a significant drop beginning when the
fraction f of hydrophilic pores is around the percolation
threshold fc. Interestingly, this current potential drop appears
much earlier (t¼ 1400 h roughly) than the time corresponding
to a fully hydrophilic GDL (time¼ 2000 h roughly). Strong non-
linear performance drops have already been reported in the
literature with different possible explanations such as
membrane fracture, catalyst dissolution and poisoning [2],
Effect of gas diffusion decay on performance
0
5
10
15
20
25
30
35
40
45
50
00.10.20.30.40.50.60.70.80.91
Gas diffusion coefficient with liquid water/dry gas diffusion coefficient
% o
f fl
oo
ded
su
rface
0
0.1
0.2
0.3
0.4
0.5
0.6
0.7
0.8
0.9
1
Ele
ctr
ical P
ote
nti
al (V
)o
r lo
ca
l c
urr
en
t d
en
sit
y i
(A
/cm
²)
t % of flooded surface
Electrical Potential (V)
% of flooded surface
Electrical Potential (V)
i max (A/cm²)
i min (A/cm²)
Gas diffusion decay due to PTFE loss
Fig. 7 e The PTFE loss of the GDL induces liquid water
content increase and then gas diffusion decay. This gas
diffusion decay leads to a degradation of performance:
decrease of electrical potential, increase of flooded surface
and increase of current density non-uniformities in the
cell.
Performance degradation for a linear PTFE loss (df/dt=0.00052 h -1)
0.00
0.10
0.20
0.30
0.40
0.50
0.60
0 200 400 600 800 1000 1200 1400 1600 1800 2000
Duration (hour)
Ele
ctr
ical
po
ten
tial
(V)
0
20
40
60
80
100
120
Fra
cti
on
of
hyd
rop
hil
ic p
ore
s (
%)
or
flo
od
ed
su
rface (
%)
or
de
gra
dati
on
rate
(µ
V/h
)
Electrical potential (V)% of hydrophilic pores% of flooded surface
erformance degradation for a linear PTFE loss
Electrical potential (V)% of hydrophilic pores% of flooded surfaceDegradation rate (microvolts/hour)
Fig. 8 e The PTFE loss of the GDL over time induces an
increase of fraction of hydrophilic pores and of flooded
surface. This leads to a non-linear decrease of electrical
potential. In this case PTFE loss is linear and a fully
hydrophobic GDLwould become fully hydrophilic in 2000 h
roughly.

membrane degradation due to oxidation of bipolar plates [28].
However, the present result shows that strong non-linear
performance drop can also appear in relation with loss of
hydrophobicity in GDL.
The second output is that the order of magnitude of the
time at which this collapse appears is reasonable compared to
classical experimental time durations, between 1000 and
20,000 h roughly [2].
The third output is that below the percolation threshold
the estimated degradation rate remains rather small (roughly
1 mV/h) then increases when f equals fc to reach 10 to
20 mV/h and evenmore with increasing f. These values are of
the order of many reported experimental decay rates (around
2e10 mV/h), i.e. [2] and references therein. More detailed
analyses show that even below the percolation threshold the
decay rate is not completely constant due to non-linearities in
the response of the Performance Model to gas diffusion
(mainly due to electrochemical ButlereVolmer relationship).
Then near the percolation threshold, non-linearities due to
the effect of wettability on gas diffusion are added to the
electrochemical non-linearities.
It is important to remind here that fully quantitative
comparisons between experiments and these calculations are
very difficult for all the previously mentioned reasons:
numerous assumptions have been made to compensate for
the lack of quantitative knowledge for loss of wettability of
GDL; calculations have been performed for stationary condi-
tions and experiments are generally done under cycling
conditions (so here we mainly refer to the sometimes called
irreversible degradation of performance); hydrophobicity loss
is probably dependent on the GDL (as well as to the process
used for the hydrophobic treatment) but available data do not
even give contact angle measurements for the tests for which
performance decay is available; differences should be made
between anode, cathode, backing and MPL; diffusion (and
percolation threshold) in the GDL is dependent on its structure
and is up-to-date simplified in the PNM simulations. Never-
theless it seems reasonable to compare tendencies and orders
of magnitude between experiments and our calculations.
These first results, although including many assumptions,
show that degradation of wettability of GDL is a serious
candidate to explain performance loss of PEMFC. This result
also shows that loss of hydrophobicity first leads to a decrease
of performance due to a decrease in gas diffusion in the wet
zones. Then, as f increases (increase of hydrophilic zones), the
wet zone enlarges and this flooding reduces even more the
global performance.
Sensitivity analysis on the influence of the GDL degrada-
tion rate (as it is one major unknown of this approach) on
performance decay rate was performed. Two cases were
studied: df=dtðtÞ ¼ 10 4ðh 1Þ and df=dtðtÞ ¼ 10 3ðh 1Þ. The
results are reported in Fig. 9 and show that the time depen-
dency of the cell performance drop (decay rate below perco-
lation threshold and time of performance drop) is, at least to
first order, linear with the degradation rate of the GDL. This is
mainly due to the fact that up to the percolation threshold, gas
diffusion varies, at least to first order, roughly linearly with f.
In the same spirit the influence of a non-constant degradation
rate of GDL has been studied to take into account that liquid
water is suspected to increase hydrophibicity loss. In this case
we assume a parabolic variation of f with time with the same
total degradation duration compared to the nominal case (df/
dt¼ 0.00052). It turns out that the GDL becomes fully hydro-
philic in the same time, roughly 2000 h. The results are
depicted in Fig. 10 and show that the main modification is
linked to the time at which f reaches fc leading to a later
appearance of performance collapse. Degradation rate of
performance is also modified (reduced in that case) but at
a second order.
a
b
Fig. 9 e Same case as in Fig. 8 but with higher or smaller
loss of PTFE of the GDL. PTFE loss is linear and a fully
hydrophobic GDL would become fully hydrophilic in
roughly (a) 200 h or (b) 20,000 h. Reduced loss of PTFE
would lead to an increased lifetime of the PEMFC.
Performance degradation for a non-linear PTFE loss with time
0.00
0.10
0.20
0.30
0.40
0.50
0.60
0 200 400 600 800 1000 1200 1400 1600 1800 2000
Duration (hour)
Ele
ctr
ical
po
ten
tial
(V)
0
20
40
60
80
100
120
Fra
cti
on
of
hyd
rop
hil
ic p
ore
s (
%)
or
of
flo
od
ed
su
rface (
%)
or
deg
rad
ati
on
rate
(µ
V/h
)
Electrical potential (V)
% of hydrophilic pores
% of flooded surface
Electrical potential (V)
% of hydrophilic pores
% of flooded surfrr ace
Degradation rate (microvolts/hour)
Fig. 10 e Simulation of performance degradation for a GDL
that would become fully hydrophilic in roughly 2000 as in
Fig. 8 but with non-linear (increasing with time)
degradation compared to a linear one (Fig. 8). In this case,
performance degradation is lower than with a linear loss of
PTFE.

4. Conclusions and perspectives
In this paper we explored the effect of a loss of hydrophobicity
of GDL on performance of a PEMFC. In order to link these local
changes of wettability at pore scale to macroscopic changes of
performance at cell scale, the analysis has been performed
using the so-called PNM/PM approach.
The PNM/PM approach is based on a one way coupling
between Pore Network Modelling (PNM) and Performance
Modelling (PM).
PNM allowed analysing two-phase flows inside GDL of
random mixed wettability for which loss of hydrophobicity is
simulated by increasing the fraction f of hydrophilic pores.
Results show that gas diffusion decreases as f increases with
a non-linear drop as f reaches the percolation threshold fc.
Then effective gas diffusion coefficient is used as an input of
PM to compute electrical performance (potential for a given
valueof total current) taking intoaccountheatandmass transfer
and electrochemical reactions inside a full size 25 cm2 cell.
Results show that degradation of GDL induces a decrease in
electrical potential with a non-linear drop as f approaches fc.
The current density distribution is not constant between the
inlet and the outlet of the cell. The current density differences
in the cell increasewith time due to degradation. This is due to
the increase of the zone in which liquid water exists. The
extent of the wet zone is limited to the cell outlet at the
beginning and progresses up to inlet due to hydrophobicity
loss. When the fraction of hydrophilic pores f becomes high
enough, flooding occurs and the cell cannot work anymore.
An estimation of degradation rate of GDL was proposed
based on the scarce surface contact angle measurements
available in the literature. This showed that a fully hydro-
phobic GDL could become fully hydrophilic in roughly 2000 h.
Under this hypothesis, the degradation rate of performance
due to degradation of wettability of the GDL could be esti-
mated as roughly 1 to 10 mV/h during the first 1000 h. Then
a sudden collapse of performance occurs. These orders of
magnitude are consistent with classical degradation rates
observed under various experiments. This suggests that
degradation of PTFE in a GDL is a serious candidate to explain,
at least in part, the performance degradation of a PEMFC.
This work illustrates also the possibilities offered by
coupling or combining PNM and PM in order to link local
properties of a component to its performance in a cell. Inter-
esting future work should focus on measuring loss of prop-
erties of GDL due to degradation and improve the models to
take into account more representative structures, condensa-
tion effects and coupling between layers. This approach could
also help proposing improvements of structure of GDL to
reduce its degradation rate due to PTFE loss.
One can notice also here that the approach presented in
this paper could be applied aswell to the study of performance
loss of DMFC using high concentration methanol [30e32] for
which water management is also a critical issue especially on
the cathode side. DMFC use very hydrophobic water
management layers to provide the water to the anode side.
These water management layers are vulnerable to the loss of
hydrophobicity as time goes by and this could lead also to
performance degradation.
Acknowledgements
This work has been performed within the European project
DECODE and the Performance Model used has been partly
developed and improved in the frame of the French National
Project CHAMEAU. The financial support of the European 7th
Framework Programme (Grant Agreement 213295), of the
French Research Agency (contract ANR-06-PANH-022) and of
CEA is gratefully acknowledged.
Appendix. Description of the performancemodel
Gas distributors
Anode and cathode gas channels are 1D-meshed (Fig. 3) from
the gas inlets to the gas outlets.
Mass and thermal balances are computed on each cell of
themesh considering gas inlet, gas outlet, oxygen or hydrogen
consumption, water production, water condensation or
evaporation and heat exchanges with the bipolar plate and
the gas diffusion layer. Pressure drop is modelled using
simplified linear correlations [33].
Q ¼VP
Kp(A-1)
Q is the volumic flow rate and Kp the pressure drop
coefficient.
Gas diffusion layers
The anode and cathode GDL are 1D-meshed from the gas
inlets to the gas outlets.
Fig. 11 e Comparison between experimental (X-axis) and
simulated (Y-axis) electrical potential for the different
operating conditions used for the fitting of the parameters
of the electrochemical law. Ideal fitting would lead to the
dashed line (the electrical potential simulated would be
always equal to the experimental one) and current fitting is
given by (D) for each operating conditions.
The diffusion fluxes in the gas phase are driven by the
invertedStefaneMaxwell equations [34].ThemolarfluxesNiare
computed from the molar fraction gradient, the molar masses
Miof the species, thegas concentration cg and the gasdensity rg.
Nx ¼c2grg$
Mv$DTxv$VXv þMn$D
Txn$VXn
!
(A-2)
Nn ¼c2grg$
Mv$DTnv$VXv þMx$D
Tnx$VXx
!
(A-3)
Nv ¼c2grg$
Mn$DTvn$VXn þMx$D
Tvx$VXx
!
(A-4)
The diffusion coefficients DTij in a ternary (3 species) mixture
used in these equations are deduced from the binary diffusion
coefficientsDij, considering themolar fraction xi and themolar
mass Mi of each species.
DTij ¼ Dij
2
6
6
4
1þ
Xk
'
Mk
MjDik Dij
(
XiDjk þ XjDik þ XkDij
3
7
7
5
(A-5)
The values of the binary diffusion coefficient in the presence
or not of liquid water are directly given by the pore network
model: in theabsenceof liquidwater thediffusioncoefficient is
thevaluecomputed fordiffusion throughthedryporousmedia
and in the presence of liquid water it is deduced from Fig. 2
depending on the fraction f of hydrophilic pores. These rela-
tions are used both on the anode and on the cathode sides.
Vapour fraction is compared to vapour saturation to
determine the presence or not of liquid water.
Xsat ¼PsatðTÞ
P(A-6)
Membrane
The membrane is 1D-meshed from the gas inlets to the gas
outlets.
The water content of the electrolyte is computed dynami-
cally from the interfacial conditions. Equilibriums with
hydration conditions in the electrodes are given for anode and
cathode side by [35]:
l ¼
,
if a * 1 then 0:043þ 17:81$a 39:85$a2 þ 36:0$a3
else 14þ 1:4$ða 1Þ(A-7)
where a is the water activity in the electrode at the interface
with the membrane and l is the water content of the
membrane at the interface with the electrode. The diffusion
coefficient is estimated using [35]:
Dl ¼
6:707) 10 8$lþ 6:387) 10 7!
$exp
'
2416
T
(
(A-8)
and the diffusion flux through the mesh cell is computed
using [36]
Ndiff ¼rdry
EW$Dl$Vl (A-9)
where Ndiff is the flux of diffusion (molm 2 s 1), rdry id the
density of the dry Nafion and EW is the equivalent weight of
the Nafion [36]. In the same way, the electro-osmosis flux is
given by [37]
Neo ¼neo$I
2F(A-10)
where Neo is the electro-osmotic drag molar flux, I is the
current density, neo is the electro-osmotic drag coefficient, and
F is the Faraday constant.
According to ref. [37]
neo ¼ 1:0þ 0:028$lþ 0:0026$l2 (A-11)
Active layers
Active layers are considered as thin interface linking
membrane and GDL.
The electrochemical response of the model is based on
a semi-empirical model, as proposed by Amphlett [38,39]
Global cell potential (for one cell) is given by
U ¼ Erev þ hact Rm$I (A-12)
where
Erev ¼ a1 þ a2$ðT 298:15Þ þ a3$T$
0:5$ln PO2þ ln PH2
!
(A-13)
is the thermodynamic potential and
hact ¼ b1 þ b2$Tþ b3$T$ln Iþ b4$T$ln PO2þ b5$T$ln PH2
(A-14)
is the activation over-voltage. The temperature T and the
partial pressuresPO2; PH2
are the local conditions at the active
layers of the electrodes. The coefficient ai is calculated from
thermodynamical parameters (reactions enthalpy and
entropy changes). Rm is the membrane electrical resistivity.
Rm ¼ems
(A-15)
with [40]
s ¼ ð33:75$l 21:41Þ$exp
'
1268
T
(
(A-16)
The coefficient b has been fitted to experimental results. For
this, performance tests have been performed in-house on
a single-cell for different operating conditions of pressure
(1.5 bar), temperature (50 "C and 80 "C), hydration level (60%
and 80% on anode and on cathode sides, respectively) and
reactant fraction (from 4% to 100% O2, 100% H2) [41]. A fitting
procedure has then been applied to define the set of
b parameters that would allow simulating these experimental
conditions best. Comparisons between measured and simu-
lated cell electrical potentials for each operating conditions
are given in Fig. 11.
The values of the parameters deduced from this fitting and
used in the PM are:
8
<
:
a1 ¼ 1:4824a2 ¼ 1:593) 10 3
a3 4:3085) 10 5
8
>
>
>
>
<
>
>
>
>
:
b1 ¼ 1:2717b1 ¼ 0:0028799b3 ¼ 0:0002831b4 ¼ 0:00020313b5 ¼ 0

r e f e r e n c e s
[1] Wang Y, Chen K, Mishler J, Cho SC, Adroher XC. Appl Energy;
2010:981e1007.
[2] Wu J, Yuan X, Martin J, Wang H, Zhang J, Shen J, et al. J Power
Sources 2008;184:104e19.
[3] Borup R, Meyeres J, Pivovar B, Kim Y, Mukundan R,
Garland N, et al. Chem Rev 2007;107:3904e51.
[4] WilliamsM, Begg E, Bonville L, Kunz R, Fenton J. J Electrochem
Soc 2004;151(8):A1173e80.
[5] Schulze M, Wagner N, Kaz T, Friedrich A. Electrochim Acta
2007;52:2328e36.
[6] Tian Y, Sun G, Mao Q, Wang S, Liu H, Xin Q. J Power Sources
2008;185:1015e21.
[7] Wu J, Martin J, Orfino F, Wang H, Legzdins C, Yuan X, et al.
J Power Sources 2010;195:1888e94.
[8] Sinha PK, Wang CY. Chem Eng Sci 2008;63:1081e91.
[9] Gostick J, Ioannidis M, Fowler M, Pritzker M. J Power Sources
2007;173:277e90.
[10] Pulloor Kuttanikkad S, Prat M, Pauchet J. J Power Sources
2011;196:1145e55.
[11] Mazumder S, Cole J. J Electrochem Soc 2003;150(11):
A1510e7.
[12] Weber A, Darling R, Newman J. J Electrochem Soc 2004;
151(10):A1715e27.
[13] You L, Liu H. J Power Sources 2006;155:219e30.
[14] Shah A, Kim G, Sui P, Harvey D. J Power Sources 2007;163:
793e806.
[15] Becker J, Wieser C, Fell S, Steiner K. J Electrochem Soc 2009;
156(10):B1175e81.
[16] Gostick J, Fowler M, Pritzker M, Ioannidis M, Behra J. J Power
Sources 2006;162:228e38.
[17] Gurau V, Bluemle M, De Castro E, Tsou Y, Zawodzinski T,
Mann J. J Power Sources 2007;165:793e802.
[18] Rebai M, Prat M. J Power Sources 2009;192:534e43.
[19] Chapuis O, Prat M, Quintard M, Chane-Kane E, Guillot O,
Mayer N. J Power Sources 2008;178:258e68.
[20] Mukherjee PP, Kang Q, Wang C. Energy Environ Sci 2011;4:
346e69.
[21] Mukherjee P, Mukundan R, Borup R. Proceedings of the ASME
2010 eighth international fuel cell science, engineering and
technology conference, Brooklyn, USA; 2010.
[22] Seidenberger K, Wilhelm F, Schmitt T, Lehnert W, Scholta J.
J Power Sources 2011;196(2):5317e24.
[23] Ceballos L, Prat M, Duru P. Physical Review E; in press.
[24] Wilkinson D, Willemsen JF. J Phys A Math Gen 1983;16:
3365e76.
[25] Ceballos L, Prat M. J Power Sources 2010;195:825e8.
[26] Ceballos L. Ph.D thesis, INPT; 2011.
[27] Ustohal P, Stauffer F, Dracos T. J Contam Hydrol 1998;33:
5e37.
[28] Wind J, Spah R, Kaiser W, Bohm G. J Power Sources 2002;105:
256e60.
[29] Cassie ABD, Baxter S. Trans Faraday Soc 1944;40:546e51.
[30] Bahrami H, Faghri A. J Fuel Cell Sci Technol 2011;8(1e15):
021011.
[31] E Shaffer C, Wang CY. Electrochim Acta 2009;54(24):
5761e9.
[32] Bahrami H, Faghri A. J Electrochem Soc 2010;157(12):
B1762e76.
[33] Dauphin-Tanguy G. Les Bonds Graphs. Hermes; 2000.
[34] Bird RB, Stewart WE, Lightfoot EN. Transport phenomena.
Wiley International; 1960.
[35] Zawodzinski TA, Davey J, Valerio J, Gottesfeld S. Electrochim
Acta 1995;40(3):297e302.
[36] Gerbaux L. PhD thesis, INPG; 1996.
[37] Meier F, Eigenberger G. Electrochim Acta 2004;49(11):
1731e42.
[38] Amphlett JC, Baumert RM, Mann RF, Peppley BA, Roberge PR,
Harris TJ. J Electrochem Soc 1995;142(1):1e8.
[39] Amphlett JC, Baumert RM, Mann RF, Peppley BA, Roberge PR,
Harris TJ. J Electrochem Soc 1995;142(1):9e15.
[40] Springer TE, Zawodzinski TA, Gottesfeld S. J Electrochem Soc
1991;138(8):2334e42.
[41] Poirot-Crouvezier JP. PhD thesis, INPG; 2000.