Embed Size (px)
Citation preview

Performance Assessment
of “Nutrition Support to
Women and Children”
PRRO 200114
Delivering nutrition support
in the Democratic People’s Republic of Korea
Performance Assessment
of “Nutrition Support to
Women and Children”
PRRO 200114
Delivering nutrition support
in the Democratic People’s Republic of Korea

Performance Assessment of Protracted Relief and Recovery Operation 200114 i
Contents
Acronyms .............................................................................................................................................. ii Map ............................................................................................................................................. iii
Executive Summary ............................................................................................................. iv
Context ...................................................................................................................................... vi
Letter of Understanding ............................................................................................................. vi Resourcing ........................................................................................................................................ viii M&E Management and Responsibilities ............................................................................. 1 Part 1: Monitoring and Evaluation ................................................................................... 1
Analysis of Monitoring Indicators ......................................................................................... 2 Site Visits by WFP Teams ........................................................................................................ 2
End-of-Project Review ............................................................................................................... 5
Limitations of the Review ........................................................................................................ 7
Effectiveness, Efficiency and Equality ................................................................................. 8 Food Distributions ....................................................................................................................... 8
Food Receipts ............................................................................................................................... 9
Suggested Food Basket Changes.......................................................................................... 9
Distribution Delays ................................................................................................................... 10
Food Quality ................................................................................................................................ 10
Food Usage .................................................................................................................................. 10
Food Production ......................................................................................................................... 11
Specific Findings from Children’s Institutions ............................................................. 12 Paediatric Wards ........................................................................................................................ 12
Children’s Institutions ............................................................................................................. 13
Part 2: Findings on Food Security .................................................................................. 14 Food Availability ........................................................................................................................ 14
Food Access ................................................................................................................................. 14
Food Utilization .......................................................................................................................... 17
Food Consumption .................................................................................................................... 20
Food Security .............................................................................................................................. 21
Coping Strategies ...................................................................................................................... 22
Analysis of current WFP food assistance targeting ...................................................... 24
Geographical Vulnerability ..................................................................................................... 25
Public Distribution System Dependents and Cooperative Farmers ....................... 25
Kitchen Gardens and Livestock ........................................................................................... 26
Household Size and Composition: Families with Children and Elderly People .. 26
Part 3: Outcomes and Outputs ........................................................................................ 27
STRATEGIC OBJECTIVE 3: RESTORE AND REBUILD LIVELIHOODS IN POST-
CONFLICT, POST-DISASTER OR TRANSITION SITUATIONS .................................... 27
Part 4: Impact and Effectiveness ................................................................................... 36
Awareness and Value of WFP Assistance ........................................................................ 37 Successes and Challenges in Implementation ............................................................. 38 Suggestions for the Future................................................................................................... 38
Part 5: Findings, Recommendations and Conclusions ........................................... 39

Performance Assessment of Protracted Relief and Recovery Operation 200114 ii
Acronyms
CFSAM Crop and Food Security Assessment Mission
CMB cereal-milk blend
CSM corn-soy milk
DPRK Democratic People’s Republic of Korea
EMOP emergency operation
FAO Food and Agriculture Organization of the United Nations
FCS food consumption score
FFCD Food For Community Development
LFP local food production
M&E
MICS
monitoring and evaluation
Multiple Indicator Cluster Survey
MUAC
NNS
mid-upper arm circumference
National Nutrition Survey
PDC public distribution centre
PDS public distribution system
PRRO protracted relief and recovery operation
RFSA rapid food security assessment
RMB rice-milk blend
UNICEF United Nations Children’s Fund
WFP World Food Programme
Korean terms
dong urban area
pyeong area = 3.3 m2
ri Village

Performance Assessment of Protracted Relief and Recovery Operation 200114 iii
Map

Performance Assessment of Protracted Relief and Recovery Operation 200114 iv
Executive Summary This report assesses the outcomes and effectiveness of Protracted Recovery and Relief
Operation (PRRO) 200114: “Nutrition Support for Women and Children”, implemented in the
Democratic People’s Republic of Korea (DPRK) over 21 months, from 1 July 2010 to 31 March
2011, and from 1 July 2012 to 31 June 2013. The PRRO was temporarily suspended for 15
months in 2011 and 2012 when Emergency Operation (EMOP) 200266 was implemented.
The operation was intended as a continuation of the earlier Emergency Operations and focussed
on young child and women’s nutrition and community asset creation. The World Food
Programme (WFP) and the Government signed a Letter of Understanding (LoU) that gave WFP
staff unprecedented access to food-insecure areas. The objectives of PRRO 2001141 were to
enhance food and nutritional security with an emphasis on women and children – 196,500
metric tonnes of food were to assist 2.4 million people in 85 counties – and to support the
Government’s strategy for food security by supporting local production of fortified foods in
DPRK. WFP data show that actual food deliveries during the 21 months of PRRO 200114 totalled
almost 92,700 metric tons in raw commodities of which over 69,200 metric tons were
distributed during the last 12 months of the operation (i.e. main reporting period of this report)
to 1.9 million people. The operation did not fully meet its targets and nutritional potential
because contributions received were insufficient to provide the resources and inputs required
for planned food deliveries, especially during the last five months of the operation. Nonetheless,
WFP assistance helped significantly to enhance nutritious food intake leading to an improved
health and nutrition status of 1.9 million vulnerable people in the chronically food insecure
DPRK.
Since 1998, the production of locally fortified foods has been central to WFP’s work to address
under-nutrition and hunger in DPRK. Through a unique partnership between WFP and the
Government, a network of 14 factories produce fortified biscuits and Super Cereal enriched with
vitamins and minerals. These are distributed as supplementary food to children and women.
During the last 12 months of the PRRO 200114, 34,765 metric tons of these foods were
produced –of which 27 percent were fortified biscuits and 73 percent, Super Cereal. Due to low
resourcing levels, WFP made a decision to temporarily suspend biscuit production from mid-May
2013 until more resources are available.
Continuous monitoring and evaluation was carried out in all operational counties. Since July
2012, WFP teams conducted almost 2,600 visits, including 1,954 regular monitoring visits to
households, schools and children’s institutions, and 76 logistics monitoring visits. The teams
used specific checklists to standardize their monitoring and were supported by local officials.
During the duration of the PRRO, five country-wide assessments took place, three of them
during the last year of the operation. Some of the assessments were conducted in the presence
of international observers. The teams found that WFP food assistance had been much
appreciated by beneficiary groups and had made a significant contribution to the alleviation of
chronic hunger and malnutrition among them. Most of the targeted beneficiaries had been
reached in a timely manner, albeit with reduced rations because of the funding shortfalls.
Household food consumption and dietary diversity progressively improved during the operation,
but were still at lower levels than existed pre-2010.
The various recommendations coming out of the project review includes keeping the current
targeting of children and women, maintaining the favourable conditions in the Letter of
Understanding, improving the use of available resources to ensure complete rations, building
more awareness among the beneficiaries about fortified foods and arranging technical training
and workshops for local officials.
1 The original PRRO 200114 was intended to provide assistance to 2.53 million people by the provision of 157,000 mt of food in 60 counties. The project went through a budget revision in 2012 and the targets were revised to 2.4 million people and 196,500mt in 85 counties.

Performance Assessment of Protracted Relief and Recovery Operation 200114 v
The End-of-Project Review in July 2013 was conducted in 28 operational areas by WFP staff.
They interviewed 105 households, held 28 discussions with county officials and focus group
participants, visited 27 children’s institutions and 6 food factories to assess the efficiency,
effectiveness and impact of PRRO 200114.
All targeted counties had received monthly food distributions, but pipeline breaks had reduced
the quantities from the planned amounts and the rations were missing some food items,
especially oil and pulses. The county officials said that they wished to continue to work together
with WFP but would like to receive the planned foods without any commodities missing and
without reducing the number of feeding days. They especially highlighted the importance of oil.
97 percent of households interviewed expressed a wish to receive WFP food assistance in
future.
In general, the project was successful in reaching the targeted beneficiaries, but inadequate
donor support resulted in food shortages, which meant that the beneficiary groups received
reduced quantities and types of food. Therefore, the expected nutritional impact of the project
was only partly fulfilled.
The quality of the food assistance was reported as good, in particular beneficiaries appreciated
the Super Cereal and nutritious biscuits. There were no complaints or reports of negative
impacts caused by WFP food or activities. The interviewees mentioned that WFP food assistance
had improved the health and nutritional situation among children and pregnant and
breastfeeding women, and increased child attendance in educational institutions and their
learning capacity.
The food security situation had improved from the start of 2012 as a result of the reportedly
larger public distribution system rations and levels of WFP food. The household food
consumption output indicator also improved during the operation, but remained lower than the
target formulated in early 2010. The situation remains fragile, as is evidenced by households
utilizing coping strategies such as reducing the size of meals and by adding water to the food,
which reduces nutritional value.
The main shortfall in household level food consumption and dietary diversity in DPRK remains
the very low intake of protein and oil with the lack of these two food elements leading to
inadequate food consumption both at household and at individual level.
The overall conclusions were that PRRO 200114 had been successful in reaching the most
vulnerable groups, but that food distributions had fallen short of the original targets because
contributions received were insufficient to meet the planned interventions. This was also the
case for the livelihood rebuilding and restoring Food for Community Development (FFCD)
activities, which were rarely implemented, as available resources were channelled to the local
production and distribution of Super Cereals and nutritious biscuits. While the food security
situation has improved, it still remains fragile and liable to disruption. County officials and
beneficiaries wanted WFP’s food assistance to continue and be extended in the next
programme.
The successes of PRRO 200114 were achieved with the support of the Government and of
county officials. Their commitments are warmly acknowledged. The contributions received from
donors are also gratefully credited.

Performance Assessment of Protracted Relief and Recovery Operation 200114 vi
Context
Protracted Relief and Recovery Operation (PRRO) 200114: “Nutrition Support to Women and
Children” was launched on 1 July 2010 following the conclusion of Emergency Operation
107570. The two year PRRO was suspended from April 2011 until June 2012 as per the DPRK
government’s request for emergency aid, which triggered an emergency operation2 responding
to severe food shortages caused by a harsh winter and structural issues. The PRRO re-started
in July 2012 for one year following a budget revision, bringing the duration of the operation to
21 months. The Letter of Understanding (LoU) between the World Food Programme (WFP) and
the Government guiding the implementation of the operation was renewed for the resumed
operation. The LoU enabled WFP staff to visit beneficiary households, institutions and markets
across the country, carry out food security assessments when needed and assess the impact of
the project itself. PRRO 200114 initially aimed to support 2.53 million beneficiaries in 603
counties with 157,000 metric tons (mt) of food over 24 months but after re-starting in July
2012, the project was adjusted to reach 2.4 million beneficiaries with 196,500mt of food in 85
counties.
The objectives of the PRRO 200114 were: (i) to restore and rebuild livelihoods and food and
nutritional security, and (ii) to assist the Government’s strategy for food security by supporting
local production of fortified foods in DPRK. The operation provided fortified biscuits and Super
Cereal enriched with vitamins and minerals to address inadequate protein and nutrient intake
among children and women resulting from food shortages caused by drought, floods and poor
harvests. These shortages mean that many people in DPRK are chronically hungry and
consuming a diet which does not meet their nutritional requirements. For many young children
and mothers, WFP food assistance is one of the main sources of protein and micronutrients.
This report focuses on project implementation between July 2012 and June 2013, additionally in
the outcome section it also presents past information available from WFP sources.
LETTER OF UNDERSTANDING
The Letter of Understanding signed by WFP and the Government of DPRK on 10 July 2012,
increased WFP’s access for monitoring and oversight of its operations under PRRO 200114.
The provisions of the Letter of Understanding were respected, but a lack of funding slowed food
procurement and WFP’s plans for increasing international staff presence. The Government
honoured all provisions relating to their part of the agreement.
Since the start of WFP’s implementation of operations in DPRK in 1996, there have been
progressive improvements in WFP’s operating conditions. The conditions of the 2010 Letter of
Understanding were an improvement compared to those negotiated for the 2008 emergency
operation. In April 2011, WFP got unprecedented conditions for the implementation of the
emergency operation 200226 – subsequently conditions have continued to improve for each
new operation launched.
Staffing
The Letter of Understanding provided an initial quota for 25 international staff, including a
minimum of five Korean speakers. International staff presence peaked in July 2012, when WFP
had 18 international staff in country, including three Korean-speaking international food aid
monitors. The staffing level was adjusted throughout the operation to reflect the project
2 EMOP 200266 3 The PRRO started in 65 counties and the coverage was extended to 85 counties when re-starting in July 2012.

Performance Assessment of Protracted Relief and Recovery Operation 200114 vii
funding level. To maintain an appropriate level of monitoring, WFP received staff support from
other WFP country offices.
WFP also received support missions from WFP’s Regional Office in Bangkok for nutrition and
database management. A Food Technologist mission also took place in December 2012 with the
aim of providing recommendations for the local production of nutritious food.
Field Offices
Since 1996 WFP has had by far the largest international presence outside of Pyongyang, but
continued funding constraints has forced WFP to reduce its permanent presence to the main
office in Pyongyang. The field offices in Wonsan, Hamhung and Chongjin are operational and
equipped with fibre-optic cables, allowing easy communication for WFP staff during missions in
the country.
Food Distribution and Targeting
At the onset of the operation, WFP and the Government agreed on a Global Implementation
Plan, which included a list of beneficiary institutions and food distribution outlets as well as a
breakdown of beneficiaries. The Global Implementation Plan is used as a basis for the
distribution of WFP’s nutrition assistance. This plan was adhered to throughout PRRO 200114.
Capacity-Building
About 460 government and county officials were trained at five regional workshops in April
2013. The training focused on the terms and conditions of the Letter of Understanding and in
various WFP administrative procedures for aid implementation.
A WFP local food production team arranged a ‘best practices’ workshop for WFP supported
factory staff in May 2013. Workshop participants comprised 52 factory staff, 20 national
counterpart staff (both from central and provincial levels) and 5 WFP staff members.
WFP also conducted two workshops on the implementation and management of Food for
Community Development (FFCD) projects for 190 participants in July 2012.
WFP sent two logistics officers to port operations training in Karachi in April 2013.
WFP supported two overseas study tours for three national staff and three counterparts to
promote capacity development in sustainable food production, improved food access and
disaster preparedness.
Monitoring
Food movements and distribution
The Letter of Understanding allowed WFP staff to access any facility where WFP food was stored
or handled and to access warehouses at entry points to verify stocks and dispatches. WFP was
permitted to install and operate its own computerized tracking system, and the Letter of
Understanding envisaged corresponding improvements in the timeliness of documentation
provided by the Government, enabling rapid access to information on food transfers.
The Government provided WFP with the list of schools, nurseries, kindergartens and
orphanages where food would be distributed, which was the tool used when planning
monitoring visits. Upon WFP’s request, the Government provided immediate travel permission
to counties where the WFP programme is implemented. However, in order for the office and
staff to organise visits, a weekly travel plan was prepared during the week before the planned
monitoring missions. The travel plans remained flexible for personnel related and other last
minute changes. On arrival at the county, WFP teams selected the sub-county and the
institutions and households they wanted to visit. Access was granted also to Public Distribution
Centres that served as the distribution platform for food distribution for pregnant and
Performance Assessment of Protracted Relief and Recovery Operation 200114 viii
breastfeeding women and FFCD participants. Government officials were fully cooperative during
the monitoring visits.
As soon as food shipments arrived in DPRK, Distribution Plan 1 was activated to transport the
food from the port to county and provincial warehouses and the local food production (LFP)
factories. After verification of these deliveries by WFP monitoring officers, Distribution Plan 2
was issued to move the food to final distribution points, such as nurseries and primary schools.
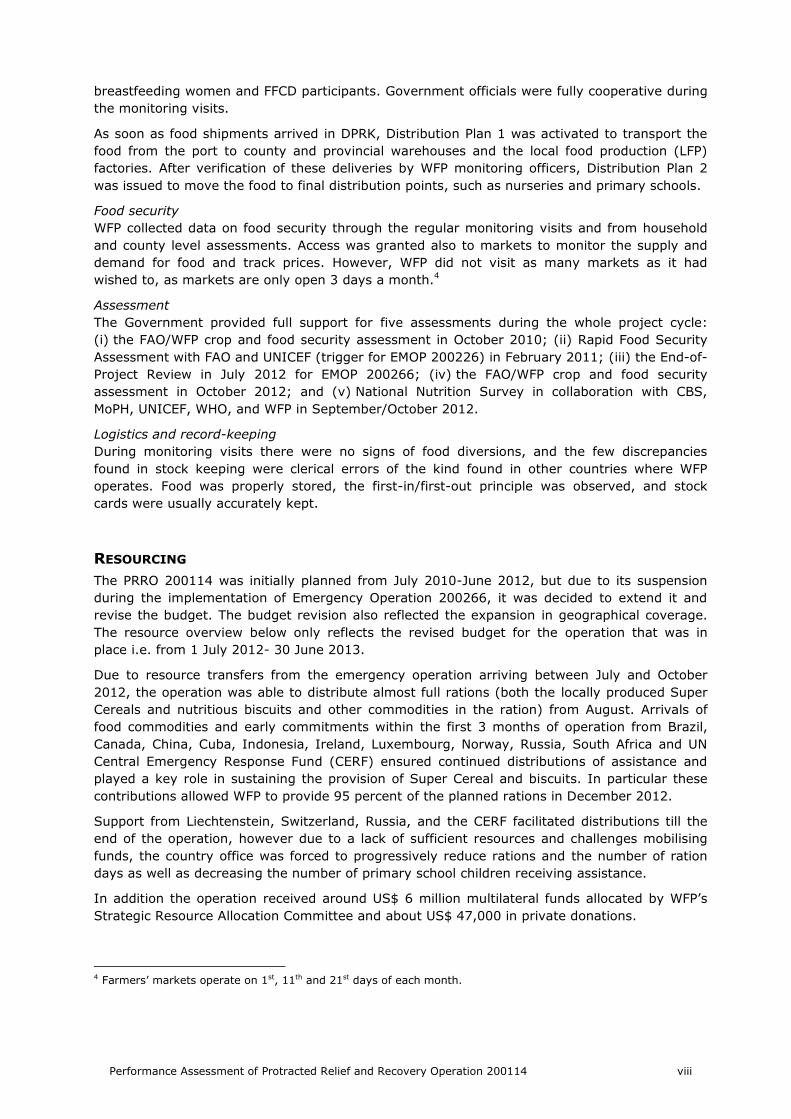
Food security
WFP collected data on food security through the regular monitoring visits and from household
and county level assessments. Access was granted also to markets to monitor the supply and
demand for food and track prices. However, WFP did not visit as many markets as it had
wished to, as markets are only open 3 days a month.4
Assessment
The Government provided full support for five assessments during the whole project cycle:
(i) the FAO/WFP crop and food security assessment in October 2010; (ii) Rapid Food Security
Assessment with FAO and UNICEF (trigger for EMOP 200226) in February 2011; (iii) the End-of-
Project Review in July 2012 for EMOP 200266; (iv) the FAO/WFP crop and food security
assessment in October 2012; and (v) National Nutrition Survey in collaboration with CBS,
MoPH, UNICEF, WHO, and WFP in September/October 2012.
Logistics and record-keeping
During monitoring visits there were no signs of food diversions, and the few discrepancies
found in stock keeping were clerical errors of the kind found in other countries where WFP
operates. Food was properly stored, the first-in/first-out principle was observed, and stock
cards were usually accurately kept.
RESOURCING
The PRRO 200114 was initially planned from July 2010-June 2012, but due to its suspension
during the implementation of Emergency Operation 200266, it was decided to extend it and
revise the budget. The budget revision also reflected the expansion in geographical coverage.
The resource overview below only reflects the revised budget for the operation that was in
place i.e. from 1 July 2012- 30 June 2013.
Due to resource transfers from the emergency operation arriving between July and October
2012, the operation was able to distribute almost full rations (both the locally produced Super
Cereals and nutritious biscuits and other commodities in the ration) from August. Arrivals of
food commodities and early commitments within the first 3 months of operation from Brazil,
Canada, China, Cuba, Indonesia, Ireland, Luxembourg, Norway, Russia, South Africa and UN
Central Emergency Response Fund (CERF) ensured continued distributions of assistance and
played a key role in sustaining the provision of Super Cereal and biscuits. In particular these
contributions allowed WFP to provide 95 percent of the planned rations in December 2012.
Support from Liechtenstein, Switzerland, Russia, and the CERF facilitated distributions till the
end of the operation, however due to a lack of sufficient resources and challenges mobilising
funds, the country office was forced to progressively reduce rations and the number of ration
days as well as decreasing the number of primary school children receiving assistance.
In addition the operation received around US$ 6 million multilateral funds allocated by WFP’s
Strategic Resource Allocation Committee and about US$ 47,000 in private donations.
4 Farmers’ markets operate on 1st, 11th and 21st days of each month.
Performance Assessment of Protracted Relief and Recovery Operation 200114 ix
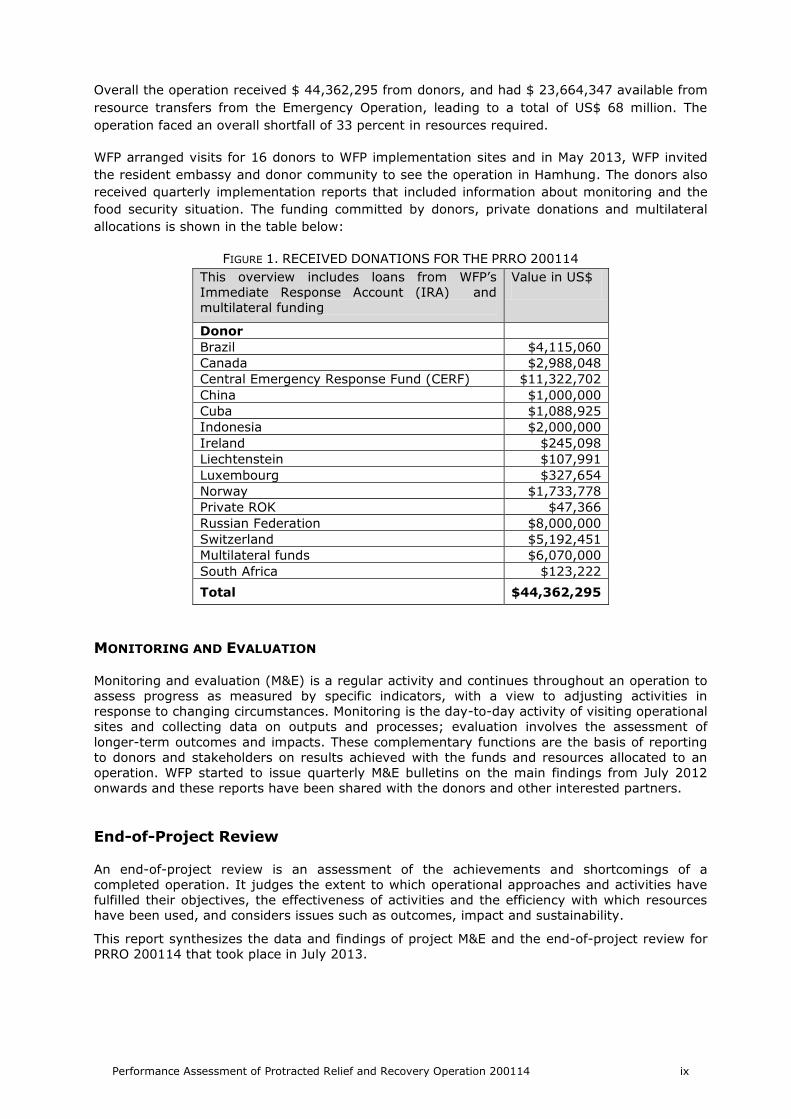
Overall the operation received $ 44,362,295 from donors, and had $ 23,664,347 available from
resource transfers from the Emergency Operation, leading to a total of US$ 68 million. The
operation faced an overall shortfall of 33 percent in resources required.
WFP arranged visits for 16 donors to WFP implementation sites and in May 2013, WFP invited
the resident embassy and donor community to see the operation in Hamhung. The donors also
received quarterly implementation reports that included information about monitoring and the
food security situation. The funding committed by donors, private donations and multilateral
allocations is shown in the table below:
FIGURE 1. RECEIVED DONATIONS FOR THE PRRO 200114
This overview includes loans from WFP’s
Immediate Response Account (IRA) and
multilateral funding
Value in US$
Donor
Brazil $4,115,060
Canada $2,988,048
Central Emergency Response Fund (CERF) $11,322,702
China $1,000,000
Cuba $1,088,925
Indonesia $2,000,000
Ireland $245,098
Liechtenstein $107,991
Luxembourg $327,654
Norway $1,733,778
Private ROK $47,366
Russian Federation $8,000,000
Switzerland $5,192,451
Multilateral funds $6,070,000
South Africa $123,222
Total $44,362,295
MONITORING AND EVALUATION
Monitoring and evaluation (M&E) is a regular activity and continues throughout an operation to
assess progress as measured by specific indicators, with a view to adjusting activities in
response to changing circumstances. Monitoring is the day-to-day activity of visiting operational
sites and collecting data on outputs and processes; evaluation involves the assessment of
longer-term outcomes and impacts. These complementary functions are the basis of reporting
to donors and stakeholders on results achieved with the funds and resources allocated to an
operation. WFP started to issue quarterly M&E bulletins on the main findings from July 2012
onwards and these reports have been shared with the donors and other interested partners.
End-of-Project Review
An end-of-project review is an assessment of the achievements and shortcomings of a
completed operation. It judges the extent to which operational approaches and activities have
fulfilled their objectives, the effectiveness of activities and the efficiency with which resources
have been used, and considers issues such as outcomes, impact and sustainability.
This report synthesizes the data and findings of project M&E and the end-of-project review for
PRRO 200114 that took place in July 2013.

Performance Assessment of Protracted Relief and Recovery Operation 200114 1
1. The M&E system in DPRK is designed to ensure that: i) adequate food assistance is distributed
as planned; ii) operational problems are identified and addressed; and iii) changes in food
security in particular areas are recognized with a view to optimizing the targeting of food to the
people in greatest need. The system assesses results in relation to Strategic Objective 3 and
the outcome and output indicators in the logical framework of PRRO 200114.
M&E MANAGEMENT AND RESPONSIBILITIES
2. Teams of WFP international and national staff regularly visited all operational counties, as
envisaged in the Letter of Understanding with the Government and in accordance with the
Guidelines for Planning Food Monitoring Visits. Three Korean-speaking international staff and 8
international staff temporarily assigned from other country offices for 3-6 months were,
together with international programme and logistics staff, the core of the monitoring team
during the last year of the project. The principles for planning monitoring visits are shown in
Figure 2.
FIGURE 2. PRINCIPLES FOR MONITORING VISITS
Monitoring
type Food movement flow Criteria
LOGISTICS
monitoring:
distribution
plan 1
Raw ingredients for
blended food:
transport from the port
of entry to LFP
factories
Food for direct
distribution: transport
to county warehouses
For each consignment: upon food arrival at county
warehouses, at least 60% of total tonnage is
checked to ensure complete delivery.
Visits are arranged according to dispatch
information from the port of entry.
Immediate access to warehouses/ports where WFP
food is handled.
BENEFICARY
monitoring:
distribution
plan 2
From factories/county
warehouses to the final
distribution points for
beneficiaries
(households, children’s
institutions or public
distribution outlets)
Immediate access to visit WFP assisted
county/city/district.
Selection of sub-county to visit on arrival in
county.
Random selection of institutions to visit from the
Global Implementation Plan – the list of beneficiary
institutions, by county
Random selection of beneficiary households from
WFP logbooks of PDC outlets.
Part 1:
Monitoring and Evaluation

Performance Assessment of Protracted Relief and Recovery Operation 200114 2
3. Monitoring teams visited an average of four operational sites per day. This involved:
discussions with county officials from as many departments and offices as possible
visits to nurseries, kindergartens, primary schools, baby homes, children’s centres and
boarding schools
visits to paediatric wards and hospitals
visits to at least one pregnant or breastfeeding woman’s household
visits to PDC outlets and markets
4. Specific monitoring checklists were used to ensure that quantitative and qualitative data were
systematically collected and entered into an Access database for analysis.
5. Logistics monitoring struck a balance between locations handling large quantities such as LFP
factories, and counties with large beneficiary populations and geographical coverage. In all
cases at least 60 percent of the tonnage was checked.
6. The monitoring system aimed for visiting half of the 85 counties each month for beneficiary
monitoring – each county, on average, every other month. However, visits to the northern
provinces of Ryanggang and North Hamgyong did not take place as frequently as planned from
December to March, as the mountain roads become too dangerous to drive over due to ice and
snow. Additionally, half of the LFP factories were visited whenever a new distribution plan was
issued.
7. Beneficiary monitoring captures information on food distribution, operational issues and food
security, focusing on:
storage conditions at warehouses, public distribution outlets and WFP stocks
receipts and delivery of WFP food and non-food-items
the number of beneficiaries receiving WFP assistance, by sex and age
the consumption and availability of food and any unmet needs
government records of food movements, storage and distributions
information on health and nutrition status
food security and agriculture
operational issues to be addressed by the Government or WFP.
ANALYSIS OF MONITORING INDICATORS
Site Visits by WFP Teams
8. Between July 2012 and June 2013, WFP teams made random visits to almost 2,6005 sites,
including 619 county visits (see Figures 3 and 4). Each county was visited four times on
average. WFP monitoring teams travelled almost 260,000 km during these missions. Monitoring
visits were reduced between December and February due to poor road conditions and reduced
(seasonal) availability of international staff for monitoring. In January, more counties were
visited compared to winter average as a large bulk of DP1 monitoring visits were undertaken to
county warehouses.
5 2,574

Performance Assessment of Protracted Relief and Recovery Operation 200114 3
FIGURE 3. NUMBER OF COUNTIES VISITED, JULY 2012 – JUNE 2013
FIGURE 4. NUMBER OF FIELD VISITS, JULY 2012 – JUNE 2013
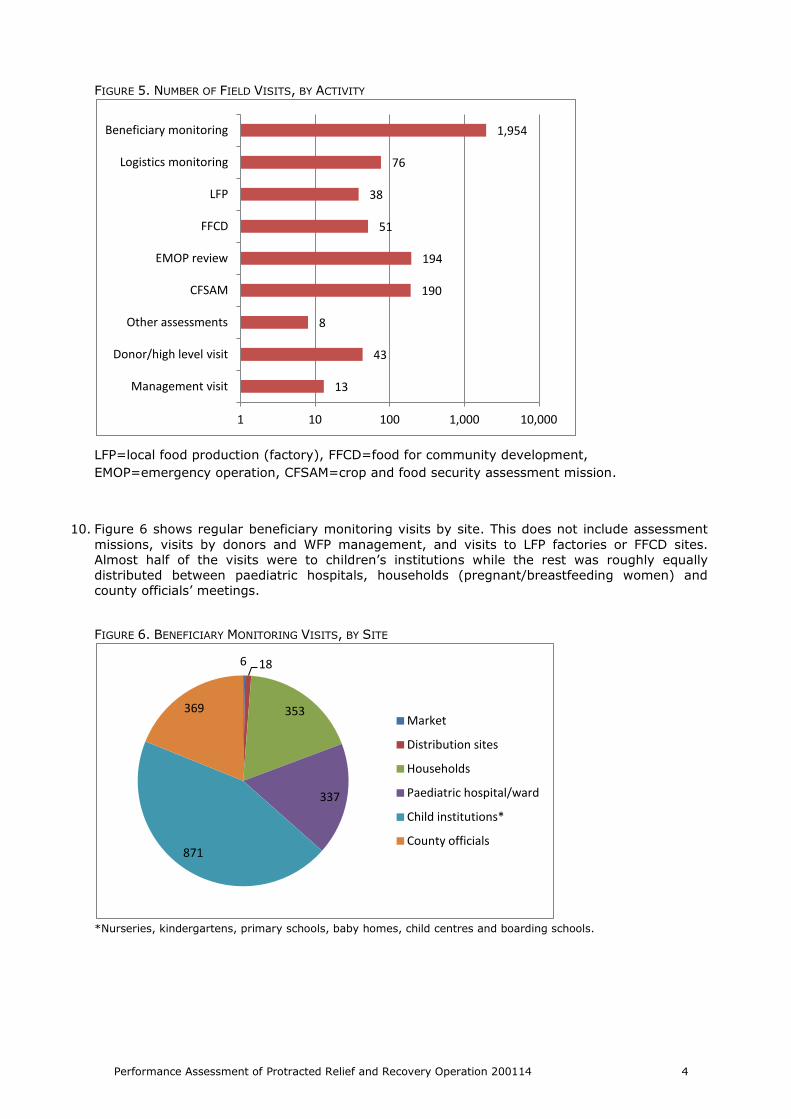
9. During the reporting period: WFP teams made 1,954 regular beneficiary monitoring visits and
76 logistics monitoring visits; three country-wide assessments – a WFP EMOP 200266 end-of-
project review, Crop and Food Security Assessment Mission (CFSAM), and National Nutrition
Survey in addition to inter-agency rapid flood assessment; 43 site visits by donors and high-
level missions such as the CIDA; WFP management made 13 visits, and there were an
additional 38 visits to LFP factories and 51 to food for community development (FFCD)
locations. In addition, a total of 7 workshops were held for LFP factory managers and WFP’s
county counterparts (see Figure 5).
75
43
61
51
85
16
46
37
47 46
54 58
0
10
20
30
40
50
60
70
80
90
Jul Aug Sept Oct Nov Dec Jan Feb Mar Apr May June
2012 2013
226 217
257 270
289
55
127
172 193 194
287 287
0
50
100
150
200
250
300
350
Jul Aug Sept Oct Nov Dec Jan Feb Mar Apr May June
2012 2013
Performance Assessment of Protracted Relief and Recovery Operation 200114 4
FIGURE 5. NUMBER OF FIELD VISITS, BY ACTIVITY
LFP=local food production (factory), FFCD=food for community development,
EMOP=emergency operation, CFSAM=crop and food security assessment mission.
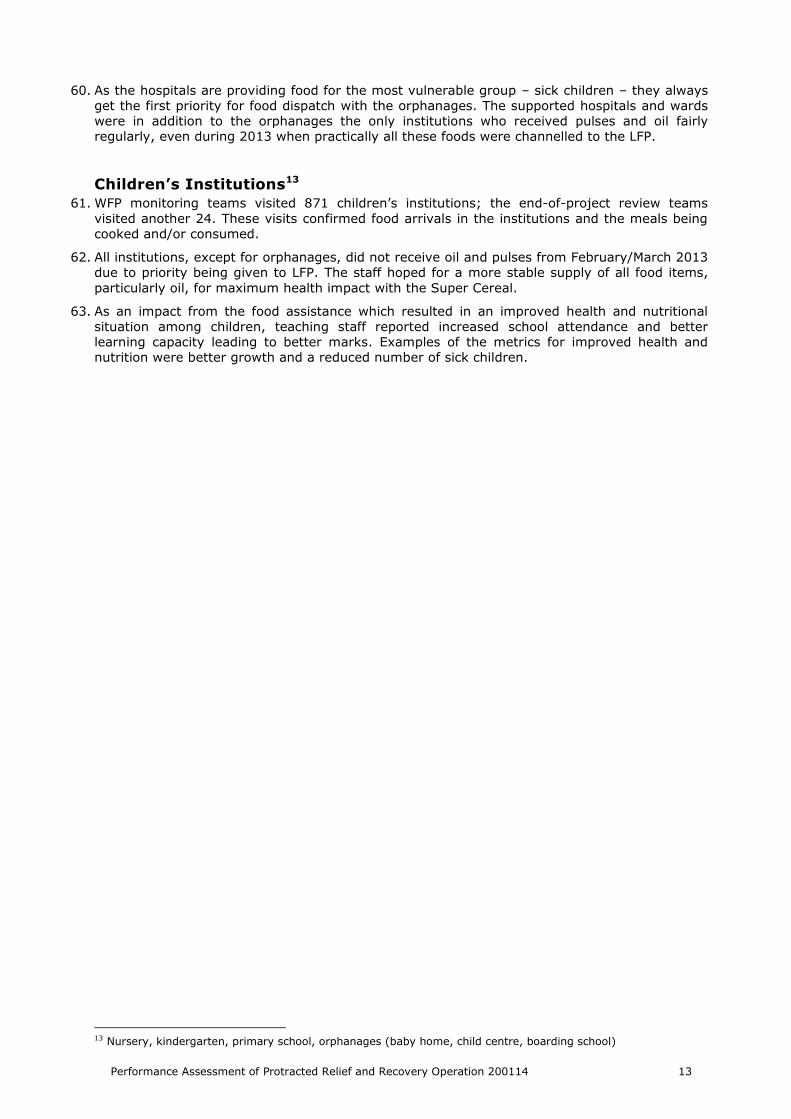
10. Figure 6 shows regular beneficiary monitoring visits by site. This does not include assessment
missions, visits by donors and WFP management, and visits to LFP factories or FFCD sites.
Almost half of the visits were to children’s institutions while the rest was roughly equally
distributed between paediatric hospitals, households (pregnant/breastfeeding women) and
county officials’ meetings.
FIGURE 6. BENEFICIARY MONITORING VISITS, BY SITE
*Nurseries, kindergartens, primary schools, baby homes, child centres and boarding schools.
13
43
8
190
194
51
38
76
1,954
1 10 100 1,000 10,000
Management visit
Donor/high level visit
Other assessments
CFSAM
EMOP review
FFCD
LFP
Logistics monitoring
Beneficiary monitoring
6 18
353
337
871
369 Market
Distribution sites
Households
Paediatric hospital/ward
Child institutions*
County officials

Performance Assessment of Protracted Relief and Recovery Operation 200114 5
END-OF-PROJECT REVIEW
11. In line with standard WFP practice, an end-of-project review in July 2013 assessed the
efficiency, effectiveness, impact and sustainability of WFP’s assistance under PRRO 200114 with
a view to deriving lessons for future operations. After training sessions spread over three days,
six teams of reviewers covered 28 counties or city districts in nine provinces that had received
WFP food since the re-start of PRRO 200114 in July 2012. In addition, an LFP factory was
visited in Pyongyang, but no other information was collected from this province.
FIGURE 7. END-OF-PROJECT REVIEW SAMPLE MAP
12. The review6 was based on discussions with county officials7 and focus groups representing
pregnant and breastfeeding women and parents of children in institutions, as well as visits to
households,8 children’s institutions and LFP factories.
13. Twenty-eight of the 85 counties covered by the operation were selected, representing one-third
of the covered counties. In each county, a ri/dong/gu/up was selected randomly for
assessment.
14. The selection of households at the second stage of sampling was not random, but in each
location the aim was to visit two pregnant and breastfeeding women’s homes, one parent, and
one non-beneficiary household.
15. Selection of child institutions to visit was by random selection in advance of the visit.
16. Household data was entered by WFP staff into an Access database developed by a WFP
Regional Bureau database expert. Other checklists were entered into an Excel spreadsheet.
6 Sample per site: interview with county officials, visit to one or two children’s institutions or paediatric wards, meeting with focus group for pregnant and breastfeeding women or parents of children at institutions or FFCD participants, visits to four households and, where applicable, to an LFP factory. 7 From county coordination councils and departments of food administration, commerce, public health and education. 8 Four households, a mix of beneficiary and non-beneficiary households in each visited location.

Performance Assessment of Protracted Relief and Recovery Operation 200114 6
Data analysis was done by DPRK Country Office VAM Officer using both SPSS and Excel
softwares.
17. Figure 8 shows that 105 household visits were made in the nine provinces, 53 percent on the
west coast and 47 percent were on the east coast. Of the respondents, 96 percent were
women. For this review, no data was collected from individual children as the findings from
EMOP 200226 review were mostly limited to children under 6 months and the sample size was
too small to come up with any significant findings. Therefore the 2012 National Nutrition Survey
was used to serve as the main reference for child nutrition related findings.
FIGURE 8. REVIEW SAMPLE
Province No. of counties
No. of interviews conducted
County officials
Focus groups
Households Children's institutions
LFP factories
Kangwon 2 2 2 49 2
Nampo 1 1 1 4 1 N Hamgyong 5 5 5 20 4 1 N Hwanghae 4 4 4 16 4 N Pyongyan 3 3 3 12 3 Pyongyang 2 Ryanggang 1 1 1 4 1 1 S Hamgyong 6 6 6 21 6 1 S Hwanghae 4 4 4 16 4 1 S Pyongan 2 2 2 8 2 Total 28 28 28 105 27 6
18. Of the households visited, 60 percent had a pregnant or breastfeeding woman, 26 percent were
non-beneficiaries; while the remaining 14 percent had a child receiving assistance from a
children’s institution (see Figure 9). Most of the 27 children’s institutions visited were nurseries,
primary schools and kindergartens which reflect the highest numbers of both beneficiary
caseloads and distribution points among children (see Figure 10).
FIGURE 9. HOUSEHOLDS BY BENEFICIARY CATEGORY
PBW=pregnant and breastfeeding women.
9 Household data was not collected from sampled Wonsan City due to flooding.
26%
60%
7% 3% 5%
0%
10%
20%
30%
40%
50%
60%
70%
Non beneficiary PBW Nursery Kindergarten Primary school

Performance Assessment of Protracted Relief and Recovery Operation 200114 7
FIGURE 10. CHILDREN’S INSTITUTIONS VISITED
*Baby home (1), Child centre (1), Boarding school (1).
19. All of the households visited were headed by men. Household size ranged from two to six
people, averaging 3 members (see Figure 11), reflecting a composition of two adults and a
young child. Thirty-seven percent had at least one child under 5, and 23 percent had an elderly
person. The sample probably shows a higher proportion of households with young children than
the population mean, as these are WFP’s beneficiary target groups.
FIGURE 11. HOUSEHOLD COMPOSITION (AVERAGE NUMBER OF MEMBERS)
CHILDREN ADULTS TOTAL
MEAN
<6 MO 6-23 MO 2-4 YRS 5-17 YRS 18-59 YRS 60+ YRS
0.3 0.04 0.04 0.32 2.07 0.37 3.14
20. A change in household composition had occurred in the preceding year in 43 percent of cases:
71 percent had a baby, 2 percent had a death and 27 percent had a marriage or other event.
This is not surprising in the context of this review as the households visited were WFP
beneficiaries, mostly pregnant and/or breastfeeding women’s households.
21. PDS dependents accounted for 71 percent of the households; 27 percent were cooperative
farmers and 2 percent of households were mixed. Data on household type was not recorded in
three cases.
LIMITATIONS OF THE REVIEW
22. Sampling did not reach planned levels in every location because the time available was limited
and some counties were experiencing seasonal flooding. However the sample can be regarded
as sufficient to understand what is the current situation compared to the situation of a year
ago. It should be remembered that sampling was done to represent WFP operational coverage
as whole and is therefore not optimal for comparison of the situation between the coasts or
household types. However, indicative findings are still presented. No comparison will be shown
at province level as the sample does not allow for this.
23. Household selection may reflect the situation of those households who have very small babies
as these were the most often visited WFP beneficiary households, rather than the population
average.
10
7
4
3 3
0
2
4
6
8
10
12
Nursery Kindergarten Primary school
Paediatric hospital/ward
Orphanage*

Performance Assessment of Protracted Relief and Recovery Operation 200114 8
24. In DPRK, normally at least one of the county or provincial officers is present during the
discussions with beneficiaries. They may influence some answers during the discussions but the
WFP teams were observant and ensured this influence was as minimal as possible.
EFFECTIVENESS, EFFICIENCY AND EQUALITY
FOOD DISTRIBUTIONS
25. WFP distributed food assistance with the help of the Government. When food arrived – by sea
at Nampo, Hungnam or Chongjin, or by rail at Sinuiju and Namyang – the Government
unloaded it in the presence of WFP logistics officers. The food was then stored at the port or
dispatched to county warehouses or LFP factories. When the WFP staff were satisfied that food
had arrived, a distribution plan guided delivery by government officials to children’s institutions
and paediatric hospitals, or to pregnant and breastfeeding women and FFCD participants, using
public distribution outlets in the WFP operational counties.
26. In May 2013, a WFP logistics team started to investigate the feasibility of utilizing the land
corridor through China (Hyesan) to deliver food, especially for the Northern Ryanggang
province. In general, the route can be used throughout the year and may be an efficient
alternative for the timely delivery of regionally procured food commodities. With a higher level
of contributions, WFP could test this corridor to establish an additional supply route.
27. WFP prioritizes local food production in DPRK for the most vulnerable beneficiaries (women and
young children) and the food is fortified with vitamins and minerals. During the PRRO 200114,
especially in 2013, direct distributions of oil and pulses were minimal as those were secured for
production of fortified foods.
28. Due to lack of resources, WFP made a difficult decision in April 2013 to temporarily suspend
production of fortified biscuits outside the Northern provinces in order to prioritize Super Cereal
production. Therefore the biscuit factories produced very minimal quantities in May and June
which mainly affected primary school children.
29. Actual distributions observed by M&E are compared with planned figures based on the project
document in Figure 12. Distribution targets were not reached, particularly during the last
quarter of PRRO 200114 because of pipeline breaks, lack of funding and long lead times to
procure and transport the food, in-kind donations in particular.
FIGURE 12. PLANNED AND ACTUAL FOOD DISTRIBUTIONS (REPORTED AS RAW FOOD COMMODITY)
0
2,000
4,000
6,000
8,000
10,000
12,000
14,000
16,000
Jul Aug Sep Oct Nov Dec Jan Feb Mar Apr May Jun
2012 2013
MT
of
foo
d p
er
mo
nth
Plan
Actual

Performance Assessment of Protracted Relief and Recovery Operation 200114 9
30. Pipeline breaks delayed or reduced the amounts of biscuits, Super Cereal and oil. The breaks
became more serious from February 2013 onwards. Cereal supplies were irregular between
February and June 2013, and biscuit production was suspended in May 2013. Cereals and
pulses were distributed to compensate for lack of Super Cereal for both children and women in
South and North Hwanghae, South and North Pyongan provinces for two months (March and
April 2013) while the Super Cereal rations were also reduced in February 2012. In May and
June 2013 food rations containing only Super Cereal (instead of additional pulses, oil and
cereals) were distributed to 48-61 percent of the women while the rest did not receive any food
from WFP. Oil did not reach all beneficiaries during the lean season.
FOOD RECEIPTS
31. Of the assessed counties, over 80 percent had first received WFP food in 1998 or earlier; none
of the counties were WFP first-timers for the PRRO 200114 but were included in WFP
programmes at the latest during 2008.
32. All the counties received maize, Super Cereal, biscuits, soya beans and vegetable oil at least
once during the project. Food was received monthly, but there were pipeline breaks for some
food types. One example of pipeline breaks is from North Hamgyong province, where vegetable
oil was not received from October or November, and where pulses were not available after
February 2013. All county officials were aware of the food amounts they were entitled to
receive and they received food based on the distribution plan. In the future the counties wish to
receive the complete food basket and for the full number of food supply days.
33. Pregnant and breastfeeding women reported that they usually received food monthly but not
the whole intended food basket or for the planned number of feeding days. Food is distributed
using the PDC facility, and the women mentioned that sometimes they were going to the PDC
more than once per month to receive different WFP food items, as the food is distributed to the
beneficiaries as soon as it reaches the facility.
34. Children’s institutions received food monthly. Distributions were regular because they were
prioritized by WFP and the Government. However, with the severity of the pipeline break,
especially for oil, they also received incomplete food baskets during severe resource shortfalls.
Most of the institutions requested a regular supply of oil as it makes the food easier to cook and
more palatable for the children. Some institutions also requested larger quantities of food.
35. The LFP factories received the food, premix and packaging material in bulk and stored them in
their warehouses.
Suggested Food Basket Changes
36. Changes to the WFP food basket suggested by government officials and women and men in
focus groups included:
take-home ration of cereal for primary school children
add sugar to children’s ration (children like sweet food)
FFCD ration could also consist of oil or pulses to diversify diet (PDS ration provides cereal)
making rice the main cereal, especially for hospitals and nurseries, because it is easier to
digest (WFP mainly distributes maize if any cereal is distributed)
in one county the officials asked for canned food for children
37. The continuation PRRO 200532 starting in July 2013 will bring changes in the food rations for
the children’s institutions; all of them are now entitled to receive oil and pulses. Biscuits were
included for nurseries and baby homes for the older children as per the recommendation from
the EMOP 200266 review in 2012.
38. For pregnant and breastfeeding women, the rations for pulses and oil are increased but cereal
is removed as it is expected that a sufficient amount will be provided through government food
distributions.

Performance Assessment of Protracted Relief and Recovery Operation 200114 10
Distribution Delays
39. County officials did not report distribution delays taking place in their counties, but noted that
deliveries from factories to central warehouses had sometimes been a few days late. This was
especially reported by those counties which are located further away from the factories or are
otherwise remote and affected by seasonal hazards (floods, snow). Inside the counties, food
was generally dispatched to distribution points as soon as possible - meaning within a few days
of receipt. From final distribution points, food was distributed to the beneficiaries without any
delay.
Food Quality
40. Food quality was generally reported as “good”. Some mentioned beans being hard and difficult
to cook. This, however, does not necessarily indicate a food quality problem but beneficiaries’
preference and possible knowledge gaps in cooking practices.
41. In some children’s institutions visited during the regular monitoring and the project review, the
staff mentioned that some very young children are getting indigestion from maize and therefore
they requested rice. This does not mean the maize quality is bad, but the cooking practices
may need to be changed. Also, rice is, in general, the preferred cereal but maize is also
commonly consumed in the country.
42. The LFP factories were satisfied with the quality of raw materials received during the project, no
complaints on quality were received by WFP. During production of fortified foods for WFP
operation, they follow WFP safety and hygiene standards. The factories do receive feedback
from the consumers and in general the feedback is positive. They have received feedback on
the ‘less sweet’ Super Cereal, but this was expected as the factories were advised to change
the Super Cereal recipe in March 2013 to produce it without sugar10 as that was not available.
43. The LFP factories report having doubts on being able to correctly store the fortified foods during
the rainy season due to high humidity. Some of the factories requested fortnightly delivery of
goods from their production sites to ensure the quality remains good all the way to the
consumers. Action was taken immediately and transport has been arranged accordingly.
44. Women at the focus groups were asked if they were aware of the Super Cereal being fortified
with vitamins and minerals. It was found that not everyone was aware of this and even among
those who were, it is very likely that in-depth understanding of the health and nutrition benefits
was not widespread. It is therefore important to consider the possibility of distributing
awareness leaflets on Super Cereal to women when they receive their rations.
Food Usage
45. Women in focus groups stated that their children received and consumed food at schools and
institutions. During the EMOP review a year ago, some half of the pregnant and breastfeeding
women shared some food with their children and husbands but during the current review
nobody reported sharing. Family sharing of the women’s ration was however found during some
of the regular monitoring visits. But, in general, sharing does not seem to be happening on a
larger scale. The women were familiar with the foods received, knew how to prepare them, and
liked the taste very much.
46. Institutions were familiar with Super Cereal and were able to prepare dishes that the children
enjoyed. The staff were asked to list the top three dishes prepared that children like the most.
The most popular was bread, followed by pancake and porridge. These are normally also listed
as easy foods to prepare by the cooks. However, when making the bread and pancakes, oil
makes food handling easier and the food softer and tastier. Therefore it is not surprising that
the institutions voiced the need for a constant oil supply.
10 Production of Super Cereal without sugar is possible and only impact is the taste (less sweet). From the nutritional view, sugar does not add any nutritional value to the food, but only energy, but makes the food sweeter. WFP has recipes available for Super Cereal production with and without sugar.

Performance Assessment of Protracted Relief and Recovery Operation 200114 11
FIGURE 13. TYPES OF FOODS PREPARED FROM SUPER CEREAL AT INSTITUTIONS (THAT CHILDREN LIKE)
Food Production
47. Since 1998 the local production of fortified food has been central to WFP’s work to address
undernutrition and hunger in DPRK. Under a unique partnership between WFP and the
Government, 14 factories produce biscuits and Super Cereal11 for distribution as supplementary
food to children and women.
48. The Government provided the factories, warehouses, staff, electrical power and maintenance.
Under WFP oversight, the Government was responsible for distributing biscuits and Super
Cereal to nurseries, kindergartens, primary schools and hospitals. WFP provided bulk raw
ingredients, a cooking mix of iodized salt and baking soda and a micronutrient premix of
vitamins and minerals – however funding shortfalls limited these supplies – and supplied
packaging materials, spare parts and technical expertise in food processing and fortification.
49. During PRRO 200114, production of biscuits and Super Cereal totalled 34,765 metric tons (mt):
biscuits accounted for 27 percent – 9,415mt – and Super Cereal for 73 percent – 25,350mt.
The monthly production plan was 4,200mt until December 2012, dropped to 1,975mt for one
month (due to school breaks in January), and has remained at 4,075mt since then.
50. Production improved every month during the second half of 2012 but 2013 was negatively
affected by pipeline breaks in raw food commodities. Wheat stocks were running out from
February 2013, reducing production of biscuits and Super Cereal CMB. Some wheat started to
arrive in April but the food stocks remained low due to lack of new contributions. In line with
these facts, the factories reported the shortage of food items being one of the main challenges
when producing fortified foods for the WFP operation.
51. In April 2013, WFP made a decision to temporarily suspend biscuit production in all but the
factories serving the Northern beneficiaries to ensure secured production of Super Cereal until
August 2013. The Northern factories were advised to exhaust their food stocks for production
while the raw commodities from the other factories were transported to the nearest Super
Cereal factory. The decision was implemented in mid-May and in June only 22mt of biscuits
were produced in Hyesan factory against the 1,417mt monthly planned production across the
country.
52. WFP teams made 38 regular monitoring visits to LFP factories; review teams re-visited six
factories. The monitoring visits included verification of accounts, stocks, raw materials and final
products, and assessments of warehouses. Production lines were checked to ensure that WFP
standards of food production were applied.
53. LFP factories reported among the challenges raw material deliveries from Nampo port, as the
factories located in the North and East often experienced difficulties with road transportation,
11 7 biscuit and 7 Super Cereal factories (1 RMB, 3 CSM, 3 CMB)
0
5
10
15
20
25 N
o. o
f in
stit
uti
on
s re
po
rtin
g
3rd
2nd
1st

Performance Assessment of Protracted Relief and Recovery Operation 200114 12
leading to delays in receipts and production. WFP should therefore utilize, as much as possible,
the ports in Hungnam and Chongjin and also explore the possibility of using the land route via
China when delivering goods to Ryanggang province.
54. The LFP factories require uninterrupted supplies of power, water and packaging materials and
need periodic maintenance. They are particularly vulnerable to power supply interruptions,
which can hamper production during winter months. During regular monitoring, as well as
during the review visits, the factories requested spare parts, forklifts and some storage
materials. During the humid rainy season, chemicals for fumigation were also requested.
55. WFP arranged annual workshops with the factory staff; including one in May 2013 on best
practices. These workshops are, in general, found useful to share experiences and also to find
solutions for any challenges. The factory staff requested the continuation of this workshop
tradition in the future.
SPECIFIC FINDINGS FROM CHILDREN’S INSTITUTIONS
Paediatric Wards
56. WFP monitoring teams visited 337 paediatric wards or hospitals; another three were visited
during the end-of-project review.
57. Figure 14 shows respiratory illnesses, diarrhoea and indigestion as the main diseases in
children admitted to paediatric wards between July 2012 and June 2013, as reported from the
337 monitoring visits to hospitals.
FIGURE 14. MAIN DISEASES IN PAEDIATRIC WARDS ON ADMISSION12
58. During the regular monitoring visits as well as the July review, the visited hospitals reported
WFP food having a positive effect on the children’s recovery time from illnesses.
59. The regular monitoring visits gather information on child acute malnutrition. From the quarterly
data, the findings suggest a rate of between 14 and 19 percent acute malnutrition levels among
under 5-year-old patients. This data is however biased, as not every hospital was visited each
quarter and these are sick children, among whom acute malnutrition is understandably higher
than in the general population of DPRK.
12 As percentage of the visited pediatric hospitals/wards who reported the illness. It was possible for the hospitals to report more than one main admission criteria. The figure does not mean that e.g. 89 percent of the admitted children suffered from respiratory illness in 2012 3rd quarter but this percentage of hospitals reported the illness among the main admission illnesses.
89% 96%
69%
32% 33%
7%
18%
96% 89%
64%
38%
30%
6%
21%
88%
79%
57%
19% 12%
3%
24%
82% 88%
49%
12% 10% 8%
29%
0%
20%
40%
60%
80%
100%
Respiratory Diarrhoea Indigestion Fever Malnutrition Skin infection Other
2012 3rd quarter 2012 4th quarter 2013 1st quarter 2013 2nd quarter
Performance Assessment of Protracted Relief and Recovery Operation 200114 13
60. As the hospitals are providing food for the most vulnerable group – sick children – they always
get the first priority for food dispatch with the orphanages. The supported hospitals and wards
were in addition to the orphanages the only institutions who received pulses and oil fairly
regularly, even during 2013 when practically all these foods were channelled to the LFP.
Children’s Institutions13
61. WFP monitoring teams visited 871 children’s institutions; the end-of-project review teams
visited another 24. These visits confirmed food arrivals in the institutions and the meals being
cooked and/or consumed.
62. All institutions, except for orphanages, did not receive oil and pulses from February/March 2013
due to priority being given to LFP. The staff hoped for a more stable supply of all food items,
particularly oil, for maximum health impact with the Super Cereal.
63. As an impact from the food assistance which resulted in an improved health and nutritional
situation among children, teaching staff reported increased school attendance and better
learning capacity leading to better marks. Examples of the metrics for improved health and
nutrition were better growth and a reduced number of sick children.
13 Nursery, kindergarten, primary school, orphanages (baby home, child centre, boarding school)

Performance Assessment of Protracted Relief and Recovery Operation 200114 14
FOOD AVAILABILITY
64. The October 2012 CFSAM indicated that cereal production14 in the 2012/13 marketing year had
been 4.9 million metric tons (mt) compared with national requirements of 5.4 million mt. This
constituted a second consecutive year of increased food production; an improvement of about
10 percent compared with the previous year, largely attributable to increased availability of
fertilizers, fuel and electricity. The cereal gap remained at 507,000mt. The Government is planning to import 300,000mt, leaving a shortfall of 207,000mt. The CFSAM identified about 2.8
million people (children, pregnant and breastfeeding women, elderly and disabled or chronically
ill) being vulnerable in the five provinces in the North and East of the country.
65. The CFSAM pointed out that, at the same time, production of soya beans dropped by over 30
percent from the previous year and this will negatively affect plant protein availability in the
country.
66. Production of wheat, barley and potatoes in July 2013 was reported by the Government as
372,000mt, 78 percent of the 475,000mt estimated by the CFSAM. Planting of early crops in
2013 was delayed by some two weeks due to cold weather. In general, rainfall was better
distributed during the 2013 early season but the annual floods from June to August did some
damage to agricultural plots, especially those located in the flood zones.
FOOD ACCESS
67. Households reported that the main food sources in the week preceding the team visit had been
state shops, PDS and cooperative rations, and home production. Gifts also accounted to some
10 percent of the food. These are very similar sources as found in the 2012 project review. As
expected and in line with better access to kitchen gardens, cooperative farmers used a higher
share of home production; PDS dependents relied more on gifts (see Figure 15).
14 Converted into cereal equivalent
Part 2:
Findings on Food Security

Performance Assessment of Protracted Relief and Recovery Operation 200114 15
FIGURE 15. HOUSEHOLD FOOD SOURCES
Kitchen Gardens and Livestock
68. Kitchen gardens and livestock are two important sources of food that can be directly controlled
by households. On average, 66 percent of the visited households assessed had kitchen gardens
– 93 percent of cooperative farmers and 57 percent of PDS dependents. The percentage of PDS
dependent households with kitchen gardens is lower compared to the EMOP review a year ago
(69 percent) but this could be due to sampling differences. For the current review, more sample
was collected from urban areas than in 2012. The average size of the gardens was 20 pyeong.15
The main crops were vegetables, potatoes and maize (see Figure 16).
FIGURE 16. KITCHEN GARDENS
CROP PRODUCTION
KG/YEAR (AVERAGE)
KG/YEAR (RANGE)
MAIZE 16 5-50
POTATO 60 10-200
VEGETABLE 96 5-200
69. The July 2013 review found that animals were kept by 70 percent of the households –
86 percent of cooperative farmers and 65 percent of PDS dependents. These were mainly
poultry, rabbits and dogs for home consumption and for bartering. The households who had
those animals, had between one and four animals of each type.
Wild Foods
70. Wild foods are an important dietary supplement. 89 percent of households reported gathering
some wild foods. From these households, 32 percent reported wild food availability being better
while 25 percent felt availability had been reduced compared to last year.
71. Thirty percent of the visited households reported consuming wild vegetables in the past week,
mostly two or three times a week.
72. Focus group participants noted the importance of wild food in protecting food security:
four percent ranked it as “very important” and 79 percent as “somewhat important”. County
officials reported that people are advised to maximize the use of wild foods, especially during
difficult times.
15 69.3 m2.
0%
10%
20%
30%
40% P
urc
has
ed f
rom
sta
te
sho
p
PD
C/C
oo
p r
atio
n
Ow
n p
rod
uct
ion
Gif
t
Hu
nti
ng
or
fish
ing
Gat
her
ing
Pu
rch
ased
fro
m
mar
ket
Foo
d a
id
All Coop farmer PDS dependent

Performance Assessment of Protracted Relief and Recovery Operation 200114 16
Household Expenditures
73. Household expenditures were obtained in July 2013 by using the proportional piling method.
The findings may have been distorted, as food was purchased through the PDCs at subsidized
prices rather than purchased from markets or shops. The main expenditure items were food,
fuel for energy, clothes and housing (see Figure 17). There were no differences between PDS
dependents and cooperative farmers.
FIGURE 17. HOUSEHOLD EXPENDITURES
74. For the main expenditures, households indicated that their expenditure has mainly increased on
clothing and household items and housing. Less money was allocated for savings, energy
(cooking/heating) and transport than a year ago.
75. Of food purchases, households prioritized cereals, oil, vegetables and condiments. These items
match with the most frequently consumed food by households. PDS dependants allocated more
to vegetables, condiments and cereals than cooperative farmers, who purchased more oil (see
Figure 18).
FIGURE 18. HOUSEHOLD FOOD EXPENDITURE PRIORITIES
Food 43%
Energy 23%
Clothing/HH items 12%
Housing 11%
Transport 4%
Savings 5%
Other 1%
Education 1%
0%
10%
20%
30%
40%
50%
60%
70%
80%
90%
100%
All
Co
-op
far
mer
PD
S d
epen
den
t
All
Co
-op
far
mer
PD
S d
epen
den
t
All
Co
-op
far
mer
PD
S d
epen
den
t
All
Co
-op
far
mer
PD
S d
epen
den
t
All
Co
-op
far
mer
PD
S d
epen
den
t
All
Co
-op
far
mer
PD
S d
epen
den
t
All
Co
-op
far
mer
PD
S d
epen
den
t
Cereals Condiments Meat/fish Oil Pulses Sugar Vegetable
3rd
2nd
1st

Performance Assessment of Protracted Relief and Recovery Operation 200114 17
PDS and Cooperative Farm Rations
76. Government rations are reportedly the main source of cereals for households in DPRK. PDS
dependents – 70 percent of the population, mainly workers, officials, professionals and state
farmers – are in principle entitled to an average ration of 573 g per person per day in
fortnightly or monthly allocations. The actual ration size varies depending on the age and
occupation. In view of their heavy workload, cooperative farmers are entitled to 600 g per day,
provided in an annual allocation after the main harvest.
77. PDS dependent populations’ entitlements were never received in full, the rations varied
according to the availability of cereals. According to government sources, during PRRO 200114,
the average rations decreased after April 2011 to 200 g or less per person per day for five
consecutive months, which timed with the EMOP 200226. Rations saw another seasonal
decrease from June 2012 to 310 grams in August and September. However, after the main
harvest the ration increased from October until the end of the project to around 400 g per
person. The ration size and composition is based on the information provided by national and
local authorities and has not been verified by WFP (see Figure 19).
FIGURE 19. AVERAGE PUBLIC DISTRIBUTION SYSTEM RATIONS AS REPORTED BY THE GOVERNMENT, 2008–2013
FOOD UTILIZATION
Number of Meals Consumed
78. All adult household members consumed three meals per day while some pregnant and
breastfeeding women consumed four meals. This is similar to last year’s findings and as a
further positive note, the proportion of households reporting reduced meal serving sizes has
reduced from two-thirds to one-third.
0
100
200
300
400
500
600
700
Jan Feb Mar Apr May Jun Jul Aug Sep Oct Nov Dec
gram
s/p
ers
on
/day
Target
2008
2009
2010
2011
2012
2013

Performance Assessment of Protracted Relief and Recovery Operation 200114 18
Dietary Diversity
79. Households consumed at least one type of cereal, vegetable, condiment and oil almost on a
daily basis. Each animal or plant protein16 type was consumed at most once per week (see
Figure 20). The average household consumed any type of protein source foods 3.4 days per
week, but 13 percent reported zero consumption of any protein in a week. This is an
improvement from the situation a year ago, as then protein was consumed 2.4 days per week
with 19 percent not having any protein sources in their diet. However, despite this
improvement, people’s diet does not provide enough protein or micronutrients, while fat intake
appears better. However, if quantities consumed per day remain marginal, not all essential
fatty acids may be present in the diets to meet the recommended daily quantities for adequate
nourishment.
FIGURE 20. NUMBER OF DAYS PER WEEK ON WHICH FOODS WERE CONSUMED BY HOUSEHOLD
80. WFP regular monitoring data provides seasonal information on WFP assisted households’ fat
and protein consumption. Oil consumption has remained around six days per week but
information about the quantity of the oil consumed is not available. Furthermore, as reflected in
the previous graph, consumption of protein sources (animal protein and pulses) remains very
limited and with these consumption levels individuals will not be getting sufficient amounts of
protein for adequate growth and wellbeing.
16 Pulses, meat, fish, eggs.
0
1
2
3
4
5
6
7
No
of
day
s co
nsu
me
d in
pas
t 7
day
s Total Coop PDC

Performance Assessment of Protracted Relief and Recovery Operation 200114 19
FIGURE 21. NUMBER OF DAYS PER WEEK ON WHICH OIL AND PROTEIN SOURCES WERE CONSUMED BY HOUSEHOLD
81. Food consumption patterns were further analysed in terms of the number of food groups17
consumed. In general, a daily diet of four food groups18 or fewer is not considered diverse
enough for physical wellbeing as it lacks some necessary nutrients. As seen in Figure 22,
diversity has improved from a year ago with two-thirds of the visited households reporting poor
diversity diet instead of over 80 percent in 2012 and earlier. The situation was better among
cooperative farmers compared to PDS dependent households for low diversity (61 vs 68
percent). Therefore, the situation is still far from optimal, but the trend is positive.
FIGURE 22. HOUSEHOLD DIETARY DIVERSITY
17 Based on the WFP standard food consumption table: eight food groups are analysed: cereals, pulses, animal protein, dairy products, oil or fat, sugar, vegetables and fruit. 18 Based on International Food Policy Research Institute guidelines: <4.5 food groups consumed during the previous 24 hours indicates low diversity, 4.5–6 medium and 6+ high diversity.
6.0 5.8 5.9 6.5
0.8 1.3 1.3
1.8 1.7 1.6 1.2 1.3
0
1
2
3
4
5
6
7
3rd quarter
4th quarter
1st quarter
2nd quarter
3rd quarter
4th quarter
1st quarter
2nd quarter
3rd quarter
4th quarter
1st quarter
2nd quarter
2012 2013 2012 2013 2012 2013
Oil Meat/fish Pulses
Fat Protein
# d
ays
con
sum
ed
th
e f
oo
d
91% 97% 81% 83%
66%
8% 3% 19% 16%
33%
0% 1% 1%
0%
20%
40%
60%
80%
100%
RFSA WFP WFP WFP WFP
June Jun/Jul May-June July July
2008 2009 2010 2012 2013
1 - Low (<4) 2 - Medium (5-6) 3 - High (>=7)

Performance Assessment of Protracted Relief and Recovery Operation 200114 20
FOOD CONSUMPTION
82. Households were asked about the food items consumed in the week before the assessment to
enable the calculation of a standard food consumption score (FCS) as a proxy indicator for food
insecurity.19 The FCS score is expressed as “poor”, “borderline” or “acceptable”.
83. The findings from WFP’s regular monitoring of 353 households during PRRO 200114 suggest
that food consumption was the most fragile before the main harvest during the 3rd quarter
(July-September), improved for the year’s last quarter but then again returned to the pre-
harvest levels in the first quarter of 2013, after which it has steadily improved. The monitoring
information was obtained from a limited number of households so it can only be indicative of
trends. Therefore, although a trend can be observed, caution is needed when interpreting the
findings on a larger scale.
84. Data from the end-of-project review (see Figure 23) showed improved food consumption
compared with 2012, especially a significant increase of households with acceptable food
consumption. Nonetheless, 38 percent of households had borderline consumption: if a shock
were to reduce food production and overall availability, these households could slip into the
“poor” category. Also, some of the households currently having acceptable diversity may also
return to the borderline consumption category. The situation, therefore, remains fragile.
FIGURE 23. HOUSEHOLD FOOD CONSUMPTION CATEGORIES
85. The Figure 24 below shows the consumption frequency in the past week for the food groups
used to derive food consumption categories. “Poor” consumption households have significantly
lower consumption of protein sources (animal and plant based), oil and even vegetables and
fruits which provide some micronutrients. Low protein consumption is the main reason for
borderline consumption households not meeting the criteria for an acceptable consumption.
Therefore, the only way to improve the food consumption patterns in DPRK is to increase both
protein and fat consumption.
19 FCS is a composite based on dietary diversity, food frequency and relative nutritional importance of the food groups consumed: the higher the FCS, the higher the dietary diversity and frequency. High food consumption increases the possibility that a household achieves nutrient adequacy. The FCS cut-off points used by WFP for DPRK include “poor” <=28, “borderline” >28-42 and “acceptable >42.
41%
17% 4%
25% 21%
30%
35%
25%
57%
38%
29%
48%
72%
19%
40%
0%
20%
40%
60%
80%
100%
June July May-June July July
WFP (n=247) WFP (n=155) WFP (n=151) WFP (n=134) WFP (n=104)
2008 2009 2010 2012 2013
Poor (<28) Borderline (28-42) Acceptable (>42)

Performance Assessment of Protracted Relief and Recovery Operation 200114 21
FIGURE 24. CONSUMPTION FREQUENCY OF THE FOOD GROUPS WITHIN FOOD CONSUMPTION CATEGORIES
FOOD SECURITY
86. Of the counties visited during the review, 55 percent of the food production surplus counties
export only to counties within the province and some 27 percent reported exporting over half of
their surplus to other provinces. Similarly, 43 percent of the food deficit counties import only
from their province while 38 percent import over half of their food from outside the province.
87. County officials, men and women in this year’s focus groups reported that the two main factors
affecting food security were natural disasters in general (floods, cold winters, dry spells) and
lack of agricultural inputs. They reported these same causes in previous surveys.
88. Asked to rank factors affecting food security in order of importance, the women identified
floods, PDS rations, low food production, drought, dry spells and lack of agricultural inputs. PDS
ration in this context was a positive factor, protecting from food insecurity while the others
have a negative effect. Own animals, wild foods and kitchen gardens were rated as “somewhat
important” factors (positive, protective effect) while fuel and food prices, sloping land
cultivation and other factors (such as heavy snow) were generally regarded as not important
(see Figure 25).
FIGURE 25. FACTORS AFFECTING FOOD SECURITY
WASH = water, sanitation and hygiene.
0
1
2
3
4
5
6
7
No
day
s co
nsu
me
d in
pas
t 7
day
s Acceptable (>42) Borderline (>28 - 42) Poor (<=28)
0%
10%
20%
30%
40%
50%
60%
70%
80%
90%
100%
Not important
Somewhat imporant
Very important

Performance Assessment of Protracted Relief and Recovery Operation 200114 22
89. County officials categorized 75 percent of the counties as neutral compared to the other
counties in the province as, in a way, all counties are equal as food distribution is organized
centrally. Those who reported a county as being more food insecure, reported limited arable
land, mountainous terrain, reliance on food imports and a high proportion of PDS dependents
compared to farmers, being the causes. In general the classification used by officials for a food
security category was formulated based on the county’s food production capacity. However,
with the country-wide food production gap, some food deficit counties do also export some of
their produce to other counties that have a comparatively wider food production gap (especially
City areas). So good production capacity does not necessarily translate into a better food
security situation for the inhabitants of a particular county.
90. The majority (93 percent) of the visited counties reported that food security was better
currently than in July 2012. The reason for the improved situation was a higher PDS ration in
the past year compared to earlier years - due to increased cereal production in the country. The
counties have also increased production of organic fertilizers, which should have a positive
effect on food production and they have implemented activities to prevent disasters, such as
preparing dams to protect agricultural land and other assets.
COPING STRATEGIES
91. County officials reported that in times of food shortages, or if there is a risk thereof, people are
utilizing more wild food, eat less and will utilize whatever food there is available. They also
mentioned the use of traditional support networks of relatives and friends.
92. Focus group participants listed utilization of wild foods and bartering of small livestock for other
food as the main coping strategies during difficult times. As mentioned in the past, relatives
provide the main support network. Pregnant and breastfeeding women traditionally receive
additional food from their families to support their increased nutritional requirements. Overall,
people generally help each other during difficult times and support is also obtained through the
People’s Livelihood Unit.
93. The most common household coping strategies were to rely on less preferred foods, obtain
support from relatives, and limit meal portion sizes (see Figure 26). Moreover, 30 percent were
adding water to food to increase its volume. In general, the percentage of households using
any types of coping strategies has decreased from 2012 and is around pre-2010 levels.
However, reliance on support from family and friends remains very important.
FIGURE 26. HOUSEHOLD COPING STRATEGIES, BY YEAR
94. Data from the regular monitoring visits to beneficiary households give information on the
coping strategy seasonality; support from friends and relatives appears somewhat stable
throughout the year at around 60 percent while reliance on less preferred food, diluting food
26%
73%
64% 60%
40% 37%
68%
33%
66% 71%
87%
66%
2008 2009 2012 2013 2008 2009 2012 2013 2008 2009 2012 2013
Borrowed food, helped by friends or relatives
Limited portion sizes at meals Rely on less preferred, less expensive food

Performance Assessment of Protracted Relief and Recovery Operation 200114 23
with extra water and limiting meal serving sizes peak in June-July, before the early crop
harvest.
TARGETING
95. The review focused on the most vulnerable and those prioritized for food assistance, and sought
data on the characteristics of vulnerable households.
Vulnerable Groups and Priority for Food Assistance
96. Asked to name the most vulnerable groups, county officials and focus group participants
identified children, pregnant and breastfeeding women and elderly. Another 14 percent of both
groups listed households with many children or dependents and a few specifically mentioned
PDC dependent households (see Figure 27). These groups were listed as the most vulnerable as
they have special nutrition needs, higher dependency on others, are not income earners and
they rely highly on PDS rations.
FIGURE 27. VULNERABLE GROUPS IDENTIFIED
PBW=pregnant and breastfeeding women, CO=county officials, FGD=focus group discussion.
97. The officials and householders said that in future activities they would give greater priority to
children (especially under 5-year-olds), pregnant and breastfeeding women, followed by the
elderly (see Figure 28). Every third household also identified school children, almost 20 percent
mentioned people with disabilities, and 11 percent PDS dependents.
98. All county officials and 97 percent of householders emphasized that food assistance would be
needed in the future; 12 percent of these mentioned the food especially being needed during
the lean season from May to August.
89%
86%
54%
68%
68%
61%
0% 20% 40% 60% 80% 100%
Children
PBW
Elderly
CO
FGD

Performance Assessment of Protracted Relief and Recovery Operation 200114 24
FIGURE 28. PRIORITY GROUPS IDENTIFIED FOR ASSISTANCE
PBW=pregnant and breastfeeding women, HH=household, CO=county officials.
Analysis of current WFP food assistance targeting
99. Overall, county officials and focus group participants stated that WFP’s activities reached the
most vulnerable. The only additional thing they consistently pointed out was to include elderly
in the beneficiary list. Regarding coverage of the assistance received, they hoped that the
beneficiaries would receive their full entitlement without pipeline breaks and mentioned oil as
being particularly important.
100. In addition to the findings from the discussions with the county officials and women
about how well WFP targeted vulnerable households, some indicative analysis was done from
the household data by comparing interviewed beneficiary and non-beneficiary households.
While interpreting the results, one should keep in mind that the analysis is based on household
consumption patterns and in many cases only one person from the household was getting
individual WFP rations - so the whole household’s food consumption was not necessarily
improved.
101. The main difference in food consumption among these households was that the non-
beneficiaries had higher protein (animal based and pulses) intake frequency. However, protein
consumption still remains low for a majority of households.
102. The indicative findings suggest that WFP has targeted the right individual beneficiaries.
The variety of food categories and therefore dietary diversity was found to be low amongst the
beneficiary households and this was especially evident in the consumption of protein. This
indicates that WFP beneficiaries would benefit by receiving more protein, especially in the form
of pulses. A further advantage of targeting children and women was that this helped ease the
pressure on the meagre food resources available to other members of their households.
43%
93%
100%
70%
93%
88%
0% 20% 40% 60% 80% 100%
Elderly
PBW
Children
HH
CO

Performance Assessment of Protracted Relief and Recovery Operation 200114 25
FIGURE 29. FOOD CONSUMPTION CATEGORIES AMONG WFP BENEFICIARIES AND NON-BENEFICIARY HOUSEHOLDS
Geographical Vulnerability
103. As in the past year, officials did not identify great differences between counties in each
province. Some however mentioned urban up areas as being more food insecure as their access
to kitchen gardens and wild foods is lower compared with rural areas. The main reason behind
the equity between the areas is the public distribution rations being allocated by the state.
104. During the project review, WFP teams visited 12 households in up areas and a very
indicative analysis comparing an up sample with dong/gu/ri showed poorer food consumption
patterns in the urban up areas; both in food consumption categories and in dietary diversity.
This is an aspect that appears worth exploring further as this review sample is too limited to
draw definite conclusions.
105. An indicative analysis was done from the household data, albeit from a small sample to
see if there are differences between the coastal areas20. A year ago a similar review found
minor differences, however no significant differences were observed in July 2013.
Public Distribution System Dependents and Cooperative Farmers
106. As found at the past food security assessments, cooperative farmers had a better food
consumption pattern than PDS dependents, who were less likely to have kitchen gardens and
livestock. Looking at food groups consumed on average days in the week before the interviews,
farmers consumed all food groups21 more frequently except for vegetables. Particularly,
consumption of nutrient rich oil and protein sources (animal source and pulses) was higher for
farming households, putting them into a better food consumption category than PDS
dependents.
20 East and West coast 21 It was found that cereal was consumed daily by all households.
25% 11%
40%
33%
35%
56%
0%
20%
40%
60%
80%
100%
WFP ben (n=77) Non-ben (n=27)
Poor (<=28) Borderline (>28 - 42) Acceptable (>42)

Performance Assessment of Protracted Relief and Recovery Operation 200114 26
FIGURE 30. FOOD CONSUMPTION CATEGORIES AMONG FARMERS AND PDS DEPENDENTS
Kitchen Gardens and Livestock
107. Focus group participants and county officials observed that households without kitchen
gardens or livestock were more vulnerable to food insecurity.
108. The household data showed a strong positive correlation between improved food
consumption (and dietary diversity) and the ownership of kitchen gardens and livestock, which
clearly contribute significantly to household food utilization. This also reflects the similar finding
on better food consumption among the cooperative farmers than PDS dependents – as farmers
have a higher share of kitchen gardens and livestock.
109. Households with livestock had, on average, at least 1 day per week higher consumption
frequency of animal protein, mostly eggs, compared to households without livestock.
110. Kitchen garden ownership did not show as drastic differences on food group
consumption but in general, improved food consumption was positively linked with kitchen
gardens. There was a minor increase in animal protein consumption among the kitchen garden
owners but not as strong as for the households with livestock.
Household Size and Composition: Families with Children and Elderly
People
111. Two commonly reported vulnerabilities were families with many children or dependants
and households with elderly people, either as a member of a family or those living alone.
112. For the analysis, no comparison was made between household sizes as 70 percent of
the households were 3-4 member households. Analysis for households with or without at least
one child under 5 years old did not show any significant differences in food consumption
patterns.
113. The data from the review a year ago indicated poorer food consumption for the
households with elderly members. The current review did not find drastic differences but did
indicate slightly better consumption for the households who had at least one elderly member.
One possible explanation for this finding could be that these families received support from
relatives that improved household food availability.
11% 27%
43%
38%
46% 35%
0%
20%
40%
60%
80%
100%
Coop (n=28) PDS (n=71)
Poor (<=28) Borderline (>28 - 42) Acceptable (>42)

Performance Assessment of Protracted Relief and Recovery Operation 200114 27
114. This section refers to the logical framework of PRRO 200114 in discussing the extent to
which the targets of the operation were met during and after implementation.
STRATEGIC OBJECTIVE 3:
RESTORE AND REBUILD LIVELIHOODS IN POST-CONFLICT, POST-DISASTER
OR TRANSITION SITUATIONS
Outcome 3.1
Improved food consumption
over assistance period for target population
Households with acceptable food consumption
scores increased from 48 percent to 70 percent
115. The target of increasing acceptable food consumption from 48 percent to 70 percent of
households was not met. On reflection, the target was overambitious as food consumption in
DPRK remains susceptible to any kind of shocks. The 2009 baseline was after improved crop
production after the main harvest in 2008 and in 2010 the situation was also very good until
the main harvesting time when heavy rains led to significant post-harvest losses and the
following harsh winter to seed damage.
116. Compared to the findings in 2012, food consumption at WFP households has improved
but not to the hoped for levels. One of the main constraints for not achieving the target is the
consistently low consumption of protein. This skews the results negatively as protein gives a
high score in the food consumption calculations.
117. Further, looking at the seasonality of food consumption, the situation worsens during
the first quarter of the year (winter season) and 3rd quarter before the main harvest. While in
other quarters households seem to be shifting mainly towards borderline food consumption. At
the moment, if early crops can supplement the government rations and the main food harvest
in October will be good, consumption is likely to remain better than a year ago. However, any
significant shock in food availability can again shift the trend in a worsening direction.
Part 3:
Outcomes and Outputs

Performance Assessment of Protracted Relief and Recovery Operation 200114 28
FIGURE 31. HOUSEHOLD FOOD CONSUMPTION AT WFP ASSISTED HOUSEHOLDS22
118. The analysis presented earlier in this report on food consumption between WFP assisted
and non-beneficiary households suggested that a worse situation existed in WFP households.
This being said, WFP has targeted the right households, as without the additional WFP food, the
most vulnerable would have been unable to meet their food requirements adequately. As none
of the WFP fortified food or more complex food rations were targeted at the whole household,
the positive impact was not observed in general household food consumption patterns but only
the intended vulnerable groups got the benefit. Therefore individual level food intake among
WFP’s beneficiaries improved.
119. Even though nutrition outcomes were not included in the PRRO logframe, it is worth
mentioning that, in general, the nutritional situation in DPRK has improved between 2009
(Multiple Indicator Cluster Survey, MICS) and 2012 (National Nutrition Survey, NNS) reflecting
the situation in September/October for both years.
120. Overall in DPRK, child chronic malnutrition, stunting, decreased to below 30 percent,
underweight to around 15 percent and acute malnutrition, wasting, to acceptable levels of
below 5 percent. Geographical differences however remain, with the Northern and Eastern
provinces showing higher malnutrition levels, Ryanggang province having consistently the
poorest performance.
22 Only WFP assisted households are included in the analysis. The food consumption analysis earlier in this report includes also the non-assisted households and reflects situation in DPRK overall.
17% 4%
24%
46%
24%
42% 28% 25%
35%
25%
57% 28%
50%
37% 53%
40%
48%
72%
19% 26% 26% 21% 19%
35%
0%
20%
40%
60%
80%
100%
July May-Jun July Jul-Sep Oct-Dec Jan-Mar Apr-Jun July
2009 2010 2012 2012 2012 2013 2013 2013
Poor (<=28) Borderline (>28 - 42) Acceptable (>42)

Performance Assessment of Protracted Relief and Recovery Operation 200114 29
FIGURE 32. DPRK CHILD MALNUTRITION INDICATORS TREND IN 2009 AND 2012
FIGURE 33. CHRONIC CHILD MALNUTRITION IN 2012, BY PROVINCE
121. The 2012 NNS also found anaemia among 28.7 percent of children and in 31.2 percent
of their mothers. These levels translate into a moderate public health concern based on WHO
standards.
122. The 2012 survey also collected data from children’s (6-23 month olds) and their
mothers’ diet for the past 24 hours. It found that some half of the mothers and only 26.5
percent of the children had adequate dietary diversity23. So the diet both on individual and
household level is not adequate and more advocacy is needed to emphasise the importance of
an increased intake of protein and appropriate child feeding practices in general to improve the
23 Children consuming at least 4 food groups out of the 7 recommended and mothers 4 out of the 9 recommended.
32.4%
27.9%
18.8% 15.2%
5.2% 4.0%
0%
10%
20%
30%
40%
50%
2009 2012 2009 2012 2009 2012
Stunting Underweight Wasting

Performance Assessment of Protracted Relief and Recovery Operation 200114 30
situation. This also shows that more diverse food is available at the household level (mothers’
consumption) but not all food items are given to the child. Further, as the dietary diversity as
well as other food consumption related indicators remains very poor throughout the country
(except for Pyongyang), nutrition interventions are needed almost equally everywhere.
FIGURE 34. CHILD DIETARY DIVERSITY IN 2012, BY PROVINCE
Outcome 3.2
Targeted communities have increased access to assets to
restore livelihoods
Community asset score
123. The PRRO 200114 project document logframe listed community asset score as the main
outcome for the FFCD activity. However, WFP failed to gather baseline data and therefore
during project implementation more easily available alternative indicators were included. Also,
negative news on food production during the second half of 2010 (initial start of the project)
changed the intended focus of WFP work. Challenges in fundraising and lack of resourcing also
made WFP reduce the FFCD activity and prioritize the nutritious food support for young children
and women – therefore lowering the importance and impact of FFCD activity and its outcome
indicators.

Performance Assessment of Protracted Relief and Recovery Operation 200114 31
Output 3.1.1
Food items distributed in sufficient quantity and quality to targeted
beneficiaries.
Days of rations distributed to targeted beneficiaries
124. Figure 35 shows that actual quantities of food distributed were well below the project
targets, particularly during the last four months of the PRRO 200114, because of pipeline
breaks affecting both direct distribution and production of fortified foods in the country.
125. The food distribution plan and actual figures were lower in January 2013 because of
known school breaks. WFP was not able to provide full food baskets to its beneficiaries during
most months; rations dropping even as low as 25 percent entitlements for children and women
and to zero for primary school children due to the lack of fortified biscuits.
126. Food distribution per month averaged almost 5,800mt against a planned average of
10,900mt. This is total food tonnage distributed under direct distribution and for the production
of Super Cereal and biscuits (raw material). In total, during July 2012 and June 2013, WFP
distributed over 69,200mt of food.
FIGURE 35. PLANNED AND ACTUAL QUANTITIES OF FOOD DISTRIBUTED, JULY 2012 – JUNE 2013 (REPORTED AS
RAW FOOD COMMODITY)
Note: Food distribution in August was higher than planned as it included prepositioning of oil rations for 2 months and pulses for 4 months.
127. The intended beneficiary caseload as outlined in the project document was not reached
(see Figure 36) due to the lack of food resources for distribution, as described above. Overall,
the biggest gaps were in July 2012 and January 2013 – the first due to the late arrival of food
transferred from the EMOP 200266 project. As a result children in some nurseries were cut off
from assistance in July 2012. The second mostly due to school breaks. On average, WFP
reached almost 1.5 million people each month during July 2012 and June 2013.
128. The Figure 36 shows a good but biased picture how well WFP reached its intended
beneficiaries, as it does not take into consideration ration reductions and incompleteness, as
well as reductions in the number of monthly feeding days from 30 days to less. Therefore the
figure gives a more complete picture when combined with the figure on actual food distribution
0
2,000
4,000
6,000
8,000
10,000
12,000
14,000
16,000
Jul Aug Sep Oct Nov Dec Jan Feb Mar Apr May Jun
2012 2013
MT
of
foo
d p
er
mo
nth
Plan
Actual

Performance Assessment of Protracted Relief and Recovery Operation 200114 32
quantities. Further, during 2013, beneficiary prioritization also took place and there were
reductions in the coverage for primary school children.
FIGURE 36. PLANNED AND ACTUAL NUMBERS OF BENEFICIARIES, JULY 2012 – JUNE 2013
Note: Food distribution for August and January was lower due to school break.
Output 3.2.1 & 3.2.2
Developed, built and restored assets in targeted communities.
Provision of cereal in sufficient quantity to targeted beneficiaries
129. FFCD activity was heavily affected by the poor resourcing situation for WFP during the
last year of the PRRO 20014. This was because, in the case of pipeline breaks, WFP prioritizes
its resources on young children and vulnerable women. FFCD activity was always the first to
face cuts.
130. A total of 20,000mt of food was planned for 450,000 beneficiaries through participation
in FFCD activities. As a consequence of resource shortfalls, WFP implemented 2224 FFCD
projects during the reporting period of this performance assessment report (July 2012 – June
2013). Therefore the activity reached only 171,375 beneficiaries (or 57,125 participants who
received the food for themselves and their families) with 3,181mt of food (maize),
corresponding to 38 percent of the planned number of beneficiaries and 16 percent of the
planned food tonnage.
131. The FFCD projects protected a total of 2,357 Ha of agricultural land through
construction and/or rehabilitation of embankments and excavation of river beds.
24 37 projects during the 21 months duration of the PRRO 200114: July 2010 – March 2011 and July 2012 and June 2013
Performance Assessment of Protracted Relief and Recovery Operation 200114 33
132. The FFCD projects also improved 46 km of water systems. These projects were
implemented in partnership with UNICEF, who provided the water pipes while WFP provided the
food.
133. WFP achieved an approximately equal participation of females and males in the
projects, however, for future projects WFP aims to increase female participation.
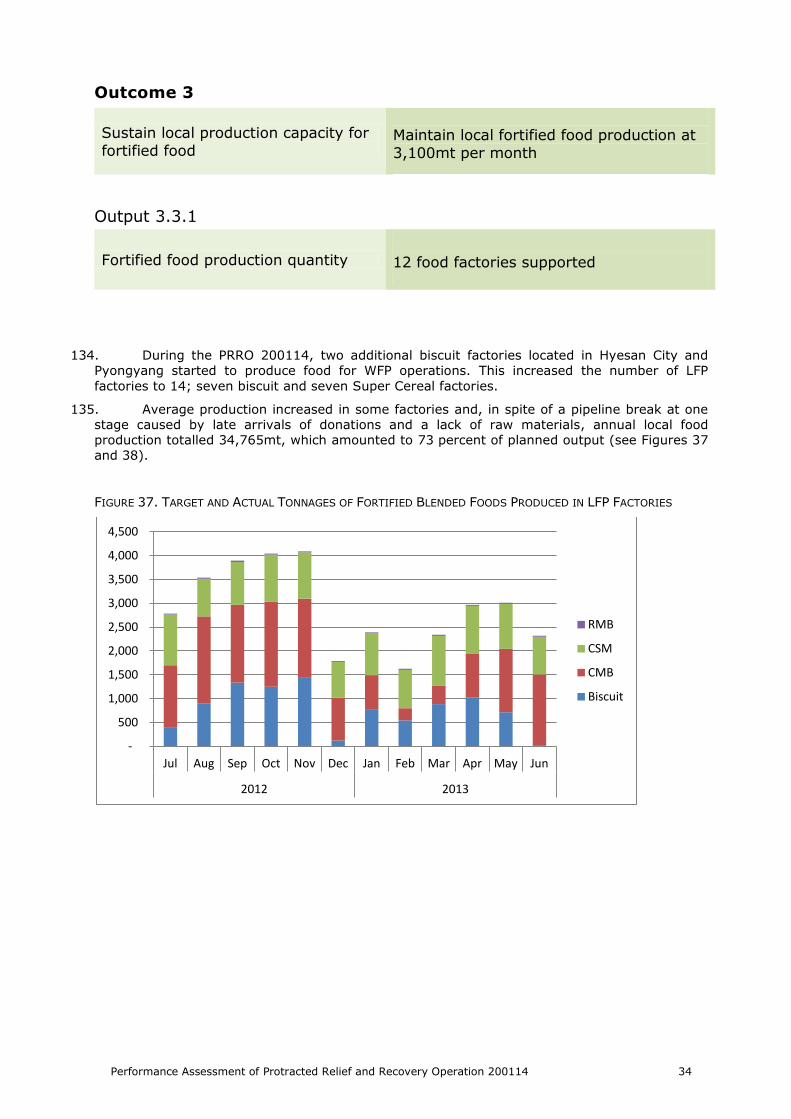
Performance Assessment of Protracted Relief and Recovery Operation 200114 34
Outcome 3
Sustain local production capacity for
fortified food
Maintain local fortified food production at
3,100mt per month
Output 3.3.1
Fortified food production quantity
12 food factories supported
134. During the PRRO 200114, two additional biscuit factories located in Hyesan City and
Pyongyang started to produce food for WFP operations. This increased the number of LFP
factories to 14; seven biscuit and seven Super Cereal factories.
135. Average production increased in some factories and, in spite of a pipeline break at one
stage caused by late arrivals of donations and a lack of raw materials, annual local food
production totalled 34,765mt, which amounted to 73 percent of planned output (see Figures 37
and 38).
FIGURE 37. TARGET AND ACTUAL TONNAGES OF FORTIFIED BLENDED FOODS PRODUCED IN LFP FACTORIES
-
500
1,000
1,500
2,000
2,500
3,000
3,500
4,000
4,500
Jul Aug Sep Oct Nov Dec Jan Feb Mar Apr May Jun
2012 2013
RMB
CSM
CMB
Biscuit

Performance Assessment of Protracted Relief and Recovery Operation 200114 35
FIGURE 38. ACTUAL LFP FACTORY PRODUCTION SHARE, JULY 2012 –JUNE 2013, BY FOOD TYPE
RMB=Rice-Milk Blend, CSM=Corn-Soya Milk, CMB=Cereal-Milk Blend
Output 3.3.2
Number of people reached through WFP local food production.
1. Number of people reached
2. Number of schools assisted 3. Number of kindergartens assisted
136. Figure 39 shows the monthly average number of beneficiaries reached between July
2012 and June 2013.
FIGURE 39. BENEFICIARIES REACHED PER MONTH ON AVERAGE, BY TYPE, JULY 2012–JUNE 201325
25 Highest number for FFCD reported as the activity is seasonal
Biscuit 27%
CMB 41%
CSM 31%
RMB 1%
1,564 4,744 10,552
104,296 167,971
542,561
280,129
643,727
-
100,000
200,000
300,000
400,000
500,000
600,000
700,000

Performance Assessment of Protracted Relief and Recovery Operation 200114 36
Discussions with county officials, focus groups and staff at children’s institutions indicated that
PRRO 200114 had improved:
health and nutrition among pregnant and breastfeeding women and children; which resulted
in easier pregnancies, the delivery of healthier babies, and the production of more breast
milk
attendance rates and overall child learning performance at children’s institutions
children’s capacity to fight disease (less illnesses)
children’s recovery at paediatric hospitals
food consumption
137. Impacts are always difficult to measure with exact numbers. Feedback from all types of
interviewees reflected improved health and nutrition status among women and children. This
was impossible to measure in this impact assessment. However, the findings from the recent
National Nutrition Survey (October 2012) found improvements in child and women’s nutrition
and so it appears reasonable to state that WFP food contributed to these results.
138. County officials and women in focus groups rated the most effective activities being food
distributions for pregnant and breastfeeding women and young children (see Figure 40). The
children needed the food to support growth, and improved nutrition among pregnant women
had reduced the prevalence of low birthweight and enhanced the health of babies by increasing
the numbers of healthy pregnancies and deliveries. The women and child institution staff
reported less childhood illnesses as children were in better health and therefore had a reduced
risk of contracting illnesses.
Part 4:
Impact and Effectiveness

Performance Assessment of Protracted Relief and Recovery Operation 200114 37
FIGURE 40. EFFECTIVENESS OF WFP ACTIVITIES REPORTED BY COUNTY OFFICIALS AND FOCUS GROUP
PARTICIPANTS
PBW=pregnant and breastfeeding women; FFCD=food for community development; FGD=focus
group discussion.
139. FFCD participants mentioned that the physical assets created under the project will help
communities avoid a wider group of people being affected by possible floods while increasing
agricultural production.
140. Women and institution staff reported children getting sick less often, as they are in better
health due to improved nutritional status. This also results in medical treatment being more
effective. This is also difficult to measure in exact numbers, but it is reasonable to assume
that the mothers and caretakers have good knowledge regarding their children’s health.
141. Child institution staff listed improved child health and nutrition as the main benefit of the
food assistance. Also increased attendance, alertness and learning capacity were mentioned
frequently. All of the paediatric hospitals reported faster recovery time from illnesses due to
the on-site meals provided. No negative impacts were reported.
142. In general, all mentioned the improved health and nutrition situation among children and
women. When asked what this entails precisely, improved weight gain and growth were the
standard answers.
143. Parents observed that children were happy to go to the institutions and to eat the WFP-
supported on-site meals. The food gives them energy to be active, study harder and get
better marks. Primary school staff and the parents of these children hoped that the biscuit
assistance would continue as the children find them good to eat and useful.
144. Overall, all institution staff and WFP project participants were very happy with the food
provided, and wished the assistance to continue.
AWARENESS AND VALUE OF WFP ASSISTANCE
145. The reviewers found that the county officials were aware that WFP is a humanitarian
organization that provides food assistance for vulnerable and food insecure people and that
it also addresses hunger in general. Groups specifically mentioned were food assistance to
women and children. About half pointed out that WFP was the biggest humanitarian
organization, while some knew that WFP was a United Nations organization.
146. The women in focus groups knew that WFP provided food free-of-charge for vulnerable
groups such as women and children, and some mentioned the nutritional value of the food.
Less than half of the groups mentioned that WFP is an international organization, but none
mentioned that WFP belongs to the United Nations family.
0%
20%
40%
60%
80%
100%
a) P
BW
b)
Nu
rser
y
c) K
ind
erga
rten
d)
Pri
mar
y sc
ho
ol
e) O
rph
anag
e
f) In
-pat
ien
t
g) F
FCD
a) P
BW
b)
Nu
rser
y
c) K
ind
erga
rten
d)
Pri
mar
y sc
ho
ol
e) O
rph
anag
e
Eld
erly
f) In
-pat
ien
t
g) F
FCD
County official FGD
5th
4th
3rd
2nd
1st

Performance Assessment of Protracted Relief and Recovery Operation 200114 38
147. All those interviewed were very happy with WFP’s food assistance and hoped that the
programmes would continue. Of the householders interviewed, 3 percent stated that they
would not need WFP food assistance, 11 percent said that they would need it in an
emergency or during a lean season26, and 86 percent said that they would need continuous
food assistance in future.
148. The women were asked about their awareness of Super Cereal and biscuits being fortified
with vitamins and minerals. Most of the group members were knowledgeable but more in-
depth knowledge on the micronutrients and their functions/deficiencies may not be fully
understood. But all of the women were positive about the food being fortified and the WFP
team explained the basics about the positive impact on health and nutrition.
149. WFP food was also seen to improve overall food consumption and as a food that
complements the cereal-based PDS rations. The food was also seen as nutritious and tasty.
It was also frequently mentioned that the women and children need fortified food, are the
highest priority and where the impact can be the highest – their nutritional needs are higher
compared to the other people and WFP food can make a difference.
SUCCESSES AND CHALLENGES IN IMPLEMENTATION
150. The children’s institutions staff were asked about successes and challenges in
implementation. Many reported that county officials provided training to them on record
keeping, food storage and cooking. WFP provided a training to the provincial and county
officials for these matters prior to their trainings to the implementing partners at child
institutions.
151. The challenges in implementation were mainly around transport and the reduced quantity of
WFP food received. Even though some reported food transport to the institutions being
improved, more reported facing some days delays in food receipts. This is a common global
constraint on implementation when small quantities of food are delivered to the final
distribution point (e.g. nursery).
152. Not surprisingly, the majority of the institutions visited listed the reduction in the number of
feeding days / food supply days as well as the incomplete food basket being the main
challenges hampering successful implementation. They hope to get oil and pulses regularly
to be able to cook more diverse food that is also more digestible and tastier for the children.
153. Most of the institutions were familiar with how to cook Super Cereal but there were a few
cases where guidance and/or recipes how to cook it were requested.
154. LFP factories reported food pipeline inadequacies as the main challenge in their work. When
food arrives in DPRK, WFP should better utilize the ports in the East coast and also explore
further the opportunities to deliver goods to Ryanggang province by road via China to reduce
food transportation time. These are however challenging for WFP logistics as the cost
implications would be significant, especially when the amount of food to be delivered
remains small. Bulk purchases would make this more feasible, but this requires timely and
steady donor contributions.
SUGGESTIONS FOR THE FUTURE
155. County officials wish to continue implementation of WFP’s activities in their areas. They
hoped to receive assistance for pregnant and breastfeeding women and young children.
Support for the elderly was also requested and in terms of programming, some requested
more FFCD projects. A few also asked for take-home rations for primary school children.
156. County officials felt that the food had made a positive impact even with the reduced food
rations. However, for maximum impact they wish to receive full food rations for the intended
number of feeding days. They mentioned fortified food and oil being the most nutritious
foods. In terms of food items, more oil and pulses were requested while fortified food was
not that frequently mentioned as its pipeline was more secure during the past year.
26 Households identified the period between April and August; duration varied between households.

Performance Assessment of Protracted Relief and Recovery Operation 200114 39
157. Like the county officials, the women from focus groups also wanted the WFP assistance to
children and women to continue. In addition to the current caseload, the elderly would need
WFP food as well, especially during the lean season.
158. The women were very happy with the food but hoped more oil and pulses to be provided in
the future as these are also valuable commodities for them. They also suggested increasing
the biscuit rations for the primary school children, providing pulses to the children’s
institutions and rice to the pregnant and breastfeeding women. Most importantly, they
hoped that the food supply would be regular and the feeding days not be reduced.
159. The FFCD participants felt their projects were successful and valuable. More projects are
therefore requested. One of the few groups that were interviewed also suggested that the
food could be e.g. pulses instead of cereal (maize) to diversify household diet. And where
possible, they hope to get more non-food items that support them in their work, such as rain
coats.
160. Where possible, WFP should explore better utilization of eastern sea ports and China road
transport for the Northern provinces.

Performance Assessment of Protracted Relief and Recovery Operation 200114 40
Findings
PRRO 200114 was effective in that it reached many of the targeted beneficiaries.
Implementation was satisfactory in spite of operational challenges such as a funding shortfalls.
Overall, the PRRO 200114 was appreciated by the beneficiaries and county officials, and that it
had reached the most needy population groups, however, support for the elderly was again
requested. Food quality was good and it was also appreciated by the beneficiaries. In general,
food was received on a monthly basis but in reduced quantities and with a reduced number of
different food items as a result of funding shortfalls, especially during 2013.
The project did not reach its maximum impact potential as WFP was not able to provide full
food baskets for the intended numbers of feeding days. WFP did well to continue reaching its
beneficiaries throughout the last year of the project, but the food tonnages tell another story.
Fortified food was available for the women and children but the temporary shutting down of
biscuit factories meant that primary school children were dropped from the assistance scheme.
Further, due to the highest priority being given for the production of fortified foods for the
women and children, the number of FFCD projects were reduced from the original plans,
therefore the support for resilience and recovery did not meet targets.
Food security in terms of household food consumption has improved since 2012, but remains
precarious. A large proportion of households remain with “borderline” food consumption, one-
third were reducing serving sizes and adding water to meals to increase the volume, and
almost two-thirds relied on their support networks for additional food. Despite some positive
developments, intake of protein remained low and dietary diversity poor in terms of the number
of food groups consumed. Any shock or reduction in food availability could negatively affect the
situation and lead to increasing numbers of households in the “poor” food-consumption
category. The population groups most likely to suffer from food-related shocks were children,
pregnant and breastfeeding women and elderly people.
To improve household food consumption towards an acceptable level of consumption, increased
access to, and consumption frequency of protein (animal and/or plant) and also of oil is
essential.
Food consumption was better for those with ownership of a kitchen garden or livestock. Animal
protein consumption increased among livestock owners.
As found a year ago, the main factors that mitigated food insecurity were the PDS rations and
gathering wild foods, cultivating kitchen gardens and keeping livestock. But natural disasters
and lack of agricultural inputs were leading to food insecurity. Therefore for the counties to
improve their food production increasing inputs by preparing organic fertilizers and protecting
land from floods, in order to mitigate flood damage, would help in reducing chronic food
insecurity.
Part 5:
Findings, Recommendations
and Conclusions

Performance Assessment of Protracted Relief and Recovery Operation 200114 41
County officials, institution staff and individual beneficiaries wanted WFP’s food assistance to
continue regularly with full rations for the intended days. They especially highlighted oil that
was not often available for direct distribution in 2013. More pulses were also requested and this
is actually addressed in the continuation PRRO 200532 that aims to provide more pulses and
oil. Overall, Super Cereal and fortified biscuits were highly appreciated and distribution of these
commodities is requested in the future.
WFP provided fortified food was highly appreciated but the knowledge of the micronutrients and
why the food is so nutritious and good for the women and children may not be fully understood.
The current targeting of population groups was seen as appropriate, but assistance was again
requested for elderly people.
Recommendations
As recommended in the past, WFP should maintain the conditions agreed in the Letter of
Understanding with the Government for EMOP 200266 and PRRO 200114 so that the extent and
quality of monitoring and assessments can be maintained.
WFP has conducted annual trainings for the Provincial and County officers but more training
could be needed, for example in children’s institutions on record keeping, food management
and also on the cooking of Super Cereal.
Continue organizing annual workshops on best practices with the food production factory staff
so they can share their knowledge and learn about the latest developments from the WFP side.
WFP’s targeting of young children and pregnant and breastfeeding women as principle
beneficiaries is appropriate and should continue. Locally produced Super Cereal and biscuits are
highly appreciated and should continue to be provided in future.
Inclusion of the elderly in food assistance could be considered, especially in the most food-
insecure areas during lean seasons to ensure that elderly people and their families consume
larger quantities and varieties of food.
WFP should consider including pulses in household rations (FFCD in particular) to increase
consumption of protein.
WFP should review the Super Cereal recipe book and identify new recipes for the institutions
and women; all recipes should be developed to utilize locally available foods.
WFP should create awareness on the importance of micronutrients – in the form of fortified
foods – especially among pregnant and breastfeeding women and child institution staff.
WFP could support the creation and improvement of kitchen gardens and small livestock as a
means to avert food insecurity and improve household food consumption.
Food security is understood in DPRK generally as “food production/availability”. WFP with the
Food Security and Agriculture, Health, Nutrition, and WASH Theme Groups should build
understanding of other food security pillars.
WFP should continue to advocate with donors to ensure that more funding and resources are
available to prevent pipeline breaks, especially during lean seasons.
More advocacy for FFCD should be made to increase resilience and risk reduction.
WFP has reached good monitoring coverage with the available resourcing but more monitoring
is recommended, but this depends on how the project is resourced. With more resources WFP
can recruit larger number of international food aid monitors. Monitoring, at least in the current
coverage, should continue, including annual project reviews around June-July.
WFP should also consider how to maintain the targeted level assistance among the most
vulnerable beneficiaries during pipeline breaks instead of stretching the available food to reach
all beneficiaries with reduced rations. The temporary ceasing of biscuit production was a strong
step towards reaching the most vulnerable and this kind of decision may be needed to be taken
also in the future unless the projects attract more resources from donors. Without full rations,
the project will not reach its nutritional goals.

Performance Assessment of Protracted Relief and Recovery Operation 200114 42
Conclusions
161. It is clear that in delivering almost 92,700 metric tons of food assistance in raw
commodities, out of which over 69,200 were distributed over the last 12 months,
PRRO 200114 made a significant contribution to enhancing the food intake and nutrition
status of 1.9 million vulnerable children, women and men at a time of chronic food insecurity
in DPRK. The nutrition survey also indicates an improved nutrition situation among children
and women; WFP food, especially fortified food, has certainly contributed to this positive
finding.
162. The successes of WFP’s PRRO 200114 were achieved with the support of the Government of
DPRK and of the many county officials, hospital and child institution staff involved in
implementing it. Their commitment and hard work are warmly acknowledged. In particular,
WFP staff were granted unprecedented access to the project areas under the terms of the
Letter of Understanding with the Government, which made it possible to deliver food
assistance to the targeted people and to monitor outputs and outcomes with a view to
optimizing the activities.
163. The generous contributions received from the donors who supported the operation are also
gratefully acknowledged. WFP will keep on advocating for more funds and continues to
provide quarterly M&E bulletins and annual project review reports.
164. As with EMOP 200266, PRRO 200114 did not receive the required funding and resources
requested from the international community. Because of this the operation did not meet its
targets, particularly during the last months in 2013. This meant that WFP was unable to
mobilize sufficient food to address the widespread hunger and malnutrition in DPRK in the
preferred impact.
165. WFP continues to be concerned about the long-term intellectual and physical development of
young children who are malnourished because their diet is monotonous and lacking in
protein, fats and micronutrients. Operational activities continue to focus on providing
nutritious food products to address the nutritional needs of young children and their
mothers.

WFP in the Democratic People’s Republic of Korea
21 Munsudong, Pyongyang, DPR Korea
P.O.Box 29, Munsudong, Pyongyang, DPRK Korea
Tel: +850 2 3817219 / +850 2 3817217
Fax: +850 2 3817639
Email: [email protected]
Front cover photo: WFP/Rein Skullerud