Embed Size (px)
Citation preview

IEEE Int'l Conf. Systems, Man, and Cybernetics, Hawaii, October 2005
Performance Analysis and Validation of a Stereo Vision System
Won S. Kim, Adnan I. Ansar, Robert D. Steele, Robert C. Steinke
Jet Propulsion Laboratory California Institute of Technology
4800 Oak Grove Drive, Pasadena, CA 91109-8099, USA [email protected]
Abstract – This paper presents an in-depth performance analysis and validation of a correlation based stereo vision system being used as part of the ongoing 2003 Mars Exploration Rover flight mission. Our analysis includes the effects of correlation window size, pyramidal image down-sampling, vertical misalignment, focus, maximum disparity, stereo baseline, and range ripples. A key element of validation is to determine the stereo localization error both analytically and experimentally. We study both down-range and cross-range error and verify that while camera calibration inaccuracy contributes to both, stereo correlation error affects only the former. Error contributions of subpixel interpolation, vertical misalignment, and foreshortening on stereo correlation are examined carefully. A novel method using bricks with reflective metrology targets and a mast-mounted stereo camera system enabled experimental measurements of the stereo disparity error. The standard deviation of the down-range disparity error was measured at σ=0.32 pixel for high-resolution 1024×768 camera images. The result is critical in evaluating accurate rover navigation and instrument placement within given error budgets.
Keywords: Stereo vision, stereo localization error, stereo correlation, subpixel interpolation, foreshortening.
1 Introduction A binocular stereo vision system generates a 3D reconstruction of points from a pair of camera images using their associated camera models. A catalog of stereo techniques along with performance characteristics is presented in [1]. An extensive bibliography of various aspects of stereo vision is listed in [2]. In this paper we focus our analysis and experimental validation on a particular stereo vision system – the JPL (Jet Propulsion Laboratory) stereo vision software module [3], which is being used for the 2003 Mars Exploration Rover (MER) flight mission. In particular, we performed an extensive stereo localization error analysis, more complete than that presented in an earlier paper [4]. By employing a novel method of using bricks with reflective metrology targets and a mast-mounted stereo camera system, we successfully obtained experimental measurements of the stereo disparity subpixel error. We used the CLARAty (Coupled Layer
Architecture for Robotic Autonomy) stereo vision package to run JPL Stereo within the CLARAty testbed. CLARAty [5] provides a common software environment that enables comprehensive control for planetary rovers and robotic systems. The validation process is an important part of an error budget analysis of rover-stereo-based navigation and instrument placement. We anticipate that the analysis and experimental validation presented here will be applicable to other correlation based stereo systems as well.
After a brief description of the JPL Stereo Vision software in Section 2, we present an in-depth performance analysis of JPL Stereo in Section 3, stereo localization error analysis in Section 4, and experimental validation in Section 5.
2 JPL Stereo Vision Software Figure 1 shows a functional diagram of the JPL stereo vision software. We briefly review the steps. Rectification refers to virtual realignment of the stereo image pair to guarantee that matching pixels occur on the same scan lines in both images. This reduces matching to a 1D search instead of 2D. Pyramidal reduction is a factor of 2n (n ≥ 0) image size reduction, depending on desired range resolution. Difference of Gaussians refers to a convolution of the image with a filter comprised of the difference of two Gaussian kernels. This amounts to a bandpass filter and is used to compensate for photometric variations between the cameras of the stereo pair. Correlation is the process of matching pixels between image pairs using a local similarity metric, in our case the sum of absolute differences (SAD) of image intensity values in a neighborhood of the pixels being matched. Blob filtering removes small patches of incongruous data to produce a coherent disparity map. Integer disparities are converted to subpixel values by interpolation of correlation scores and then to a range map via triangulation. Additional detail together with the CLARAty API can be found in the Stereo Vision Technology Functional Design Document [6]. JPL Stereo emphasizes accurate range results with a high percentage of valid range data, while maintaining reasonable computational time and cost. The density of range data is important for reliability, while range accuracy is important for accurate rover navigation and instrument placement within given error budgets.

Figure 1. Functional diagram of JPL stereo vision software
3 Stereo Vision Performance Extensive tests and validation of the JPL camera calibration and stereo vision technology were performed and described in a detailed report [7]. Concise summary results and findings are presented in Sections 3 and 4.
3.1 Correlation window size Correlation window size affects stereo correlation performance. Too large or too small a window size yields poor range. In general, a densely textured scene, such as rocky terrain, performs better with a smaller window size (e.g., 7×7 or 9×9 pixels), while a sparsely textured scene, such as a sand dune, usually works better with a larger window size (e.g., 15×15 or 29×29 pixels). The "foreground fattening" effect, in which a textured foreground tends to be fattened over a less-textured background, is more conspicuous for wider windows [1].
3.2 Pyramidal image down sampling Pyramid reduction downsamples the image by a factor of 2 at each succeeding pyramid level by averaging over 2×2 blocks of pixels. Thus, a pyramid level of n corresponds to a size reduction by 2n. Each successive pyramid level reduces the computational time for stereo correlation by a factor of 8. Lower resolution makes stereo correlation less sensitive to focus and camera calibration errors at the expense of 3D range accuracy and resolution.
3.3 Vertical misalignment The stereo algorithm performs a one-dimensional search assuming rectified left and right images are well aligned vertically. This alignment relies on the accuracy of the camera models. To test the effect of vertical misalignment we shifted one image of a pair vertically and measured the percentage of valid disparity pixels. Experimental results (Figure 2) show that noticeable degradation of the stereo correlation performance starts at about ±0.5 pixel vertical misalignment, where the percentage of valid disparity pixels is reduced by 13%, from the maximum of 86% to 75%. At ±1 pixel vertical
misalignment, the percentage is reduced by 50%. Pyramid reduction makes correlation less sensitive to vertical misalignment. Increasing the pyramid level by 1 reduces the sensitivity by a factor of 2. For pyramid level 1 (Figure 2), the percentage of valid disparity pixels starts to degrade sharply beyond ±1 pixel vertical misalignment.
Besides the disparity density described above, the disparity error is also an important stereo performance metric. Vertical misalignment contributes to the disparity error, and details are presented in Section 4.5.
0
10
20
30
40
50
60
70
80
90
100
-1.5 -1 -0.5 0 0.5 1 1.5Vertical misalignment (pixels)
Dis
parit
y co
verg
ae (%
)
Pyr_level0Pyr_level1Pyr_level2
Figure 2. Effect of vertical image shift on the percentage of
valid disparity pixels
3.4 Focus Good camera focus is vital to stereo performance. We found this to be especially true for narrow field of view cameras, which are mechanically very sensitive to focal adjustment. To evaluate the effect of defocus, we blurred one image of a stereo pair with a Gaussian filter, and measured the percentage of valid disparities. In Figure 3, the left camera image is well-focused, while the right camera image is not. The stereo correlation of this pair at full resolution resulted in an empty or 0% disparity map (Figure 4). When the left image was blurred by using a Gaussian filter with σ = 1.5 pixel, the percentage of valid disparity pixels reached a maximum (Figure 4). The stereo correlation starts to degrade rapidly outside the range 1 < σ < 2, a range of ±0.5 pixel. Stereo matching at lower resolution using a higher pyramid level is less sensitive to focus mismatch. For example, at half resolution (pyramid level = 1), sharp degradation occurs outside the range 0.5 < σ < 2.5, a range of ±1 pixel – twice as wide as the full-resolution case.
Figure 3. A well-focused left camera image (left) and a slightly out-of-focus right camera image (right)
Left Camera Image
Right Camera Image
Pyramid Reduction
Difference of Gaussian
Pyramid Reduction
Difference of Gaussian
Stereo Correlation
Blob Filtering
Stereo Disparity
Stereo Range
Left Camera Model
Right Camera Model
Align Cameras
Rectify
Rectify

0
10
20
30
40
50
60
70
80
90
100
0 1 2 3 4 5
Gausian blur standard deviation (pixels)
Dis
parit
y co
vera
ge (%
)
Pyr_ level 0Pyr_level 1Pyr_level 2
Figure 4. Effect of image defocus on stereo correlation; the left camera is blurred to match with the right camera.
3.5 Maximum disparity The correlation algorithm searches from a specified minimum to maximum disparity value. From (2) of Section 4, the maximum disparity dmax determines the minimum stereo range Zmin (more correctly, minimum stereo z-axis distance along the optical axis) by
, (1) maxmaxmin /)/(/ dBqfdBfZ l==
where B is the stereo baseline, fl and f are the camera’s focal length in mm and pixels, respectively, and q is the pixel size in mm. As an example, we used a Point Grey Research Dragonfly digital camera equipped with a Sony ICX204AL 1/3-in CCD image sensor of 1024×768 pixels resolution. Since the image size of the 1/3-inch format CCD is approximately 4.8×3.6 mm, we can estimate the pixel size as 4.8/1024=4.69 µm. Its actual pixel size according to the manufacture’s specification is 4.65×4.65 µm, or q=0.00465 mm. For 16-mm lenses (17º×13º field of view) and a 0.3 m stereo baseline, the minimum stereo range that can be obtained from the stereo correlation is 4 m when dmax=256 pixels, and 2 m when dmax=512 pixels.
3.6 Stereo baseline Increasing the stereo baseline reduces the range error. However, it introduces two adverse effects. It increases the stereo minimum range as related by (1), limiting the closest object that can be found. Further, it reduces the stereo disparity density (percentage of valid disparity pixels) for two reasons. First, the image overlap becomes smaller as the baseline increases. Second, the viewpoint difference between left and right cameras increases, causing both greater occlusion and more variation in the appearance of objects between cameras, thus making matching more difficult.
3.7 Range ripples The “ripple effect” is shown in Figure 5. Range ripples form a pattern of lines perpendicular to the optical axis. Figure 6 is an enlarged view of part of a disparity histogram showing the number of range points detected at
subpixel disparities of 0.1 pixel steps. The maxima occur at integer-pixel disparities while minima occur at half-pixel disparities. This effect is consistent over the entire range. There are two factors contributing to these ripples: 1) the correlator has more difficulty in finding matches at half-pixel disparities, and 2) matches at quarter-pixel disparities are biased towards the nearest integer (see Section 4.4). Also note that the ripples form a pattern of parallel lines rather than concentric circles. This can be explained by (2) of Section 4; each ripple peak occurring at an integer-pixel disparity arises from points that have the same z-coordinate.
Figure 5. An elevation map constructed from stereo range
data for a mostly flat terrain, showing the ripple effect
0
20 0
40 0
60 0
80 0
100 0
120 0
140 0
160 0
180 0
200 0
10 .0 1 0 .5 11 .0 11 .5 1 2 .0 12 .5 1 3 .0 13 .5 14 .0 1 4 .5 15 .0
d ispa rity (p ixe ls )
num
ber o
f occ
urre
nces
Figure 6. Portion of the disparity histogram
4 Stereo Localization Error Analysis 4.1 Stereo Localization Geometry We now derive the relationship of the disparity error to the stereo 3D localization error. Figure 7 shows the localization geometry with a stereo camera pair. By similar triangles, the disparity d and the z-axis (along the optical axis) distance Z are related by
dBfZ /= , (2)
where B is the stereo baseline, and f is the camera’s focal length in pixels. This equation implies that constant disparity d corresponds to a fronto-parallel plane. In Figure 7, the plane will show up as a line parallel to the x-axis (see Figure 5 and Section 3.7). First we consider the down-range error ∆R along the line of sight, where ∆d is added for the right image only in Figure 7 (∆xl = 0; ∆xr = ∆d). Either by applying similar triangles or differentiating (2) and then substituting fB/Z for d, we get
, (3) dBfZZ ∆−=∆ )/( 2
The negative sign appears because increasing Z causes d to decrease. Since θcosRZ = and θcosRZ ∆=∆ ,

Figure 7. Geometry of stereo localization. The down-range error ∆R and cross-range ∆C define the error ellipsoid.
, (4) dBfRR ∆−=∆ )/cos( 2 θ
dBfRR ∆≅∆ )/( 2 , (5)
For the cross-range error that is perpendicular to the line of sight, we consider adding ∆x for both left and right image points (∆xl = ∆xr = ∆x). By similar triangles,
. (6) xfZX ∆=∆ )/(
Since θcosXC ∆=∆ ,
, (7) xfRC ∆=∆ )/cos( 2θ
. (8) xfRC ∆≅∆ )/(
Now we consider a general case when both ∆xl and ∆xr are nonzero. Since and , from (5) rl xxd −= rl xxd ∆−∆=∆
rl xxBfRR ∆−∆≅∆ )/( 2 . (9)
The stereo down-range error is directly related to the difference of ∆xl and ∆xr. On the other hand, the common average error changes neither the disparity nor the down-range error. It only affects the stereo cross-range error. From (8),
2/)( rl xx ∆+∆
, (10) 2/)()/( rl xxfRC ∆+∆≅∆
From (9) and (10), the standard deviations of the down-range and cross-range errors are given by
, (11) rl xxdR BfRBfR ∆−∆∆∆ =≅ σσσ )/()/( 22
2/)()/(rl xxC fR ∆+∆∆ ≅ σσ . (12)
In general, the stereo localization error is described by an error ellipsoid in 3D space bounded by the down-range and cross-range errors of (11) and (12). The down-range error increases as the square of the range while the cross-range error increases linearly. As the range increases, the down-
Figure 8. Visualization of stereo range 3D data
range error along the line of sight is dominant as can be observed in a stereo range 3D visualization in Figure 8. As described in the next two sections, camera calibration inaccuracy (including mast calibration inaccuracy for mast-mounted cameras) affects both stereo down-range and cross-range errors, while stereo correlation inaccuracy affects the down-range error only.
4.2 Effect of camera calibration inaccuracy The error model of (11) and (12) can be tested by using camera calibration data. Since the camera calibration process produces the 3D metrology of the calibration fiducials (dots in Figure 9) as well as their associated 2D image points, we can compute both 2D reprojection error and the 3D localization error.
The 2D reprojection error was obtained by comparing the 2D projections of the metrology-based 3D positions of calibration dots and their corresponding 2D image points.
Figure 9. A 10×10 dots camera calibration target image
Figure 10. Down-range error caused by camera calibration inaccuracy;
rl xx ∆−∆σ =0.12 pixel (red) and 1 pixel (black)
B
B
Zθ d
f
R
∆R
∆xr
∆xl
∆C ∆X
∆Z
xl xr

-0.15
-0.1
-0.05
0
0.05
0.1
0.15
8 8.2 8.4 8.6 8.8 9
horizontal image shift (pixels)
disp
arity
bia
s er
ror (
pixe
ls
-0.15
-0.1
-0.05
0
0.05
0.1
0.15
8 8.2 8.4 8.6 8.8 9
horizontal image shift (pixels)
disp
arity
rms
erro
r (pi
xels)
Figure 11. Cross-range error caused by camera calibration inaccuracy; =0.21 pixel (red) and 1 pixel (black) 2/)( rl xx ∆+∆σ
For a stereo image pair obtained with 2.3 mm lenses (113º× 86º field of view), the 2D reprojection differential and common errors were = 0.12 pixel and
= 0.21 pixel, respectively. Using these values, the down-range and cross-range error models of (11) and (12) are plotted with red solid lines in Figures 10 and 11. The 3D localization error for each calibration dot, which is computed by comparing the metrology-based 3D position and the stereo range 3D position constructed from its 2D image points using the stereo camera models, is also plotted with a ‘+’ mark in Figures 10 and 11. These 3D localization error values agree well with the expected error models predicted by (11) and (12).
rl xx ∆−∆σ 2/)( rl xx ∆+∆σ
4.3 Stereo correlation inaccuracy Stereo correlation performance is affected by various factors including subpixel interpolation, vertical mis-alignment, and foreshortening. Details are described below.
4.4 Subpixel interpolation JPL stereo correlation employs quadratic subpixel disparity interpolation, in which correlation scores at three adjacent disparity values are used to estimate the disparity value to subpixel accuracy. This interpolation improves the accuracy of the stereo disparity estimate, but some inaccuracy persists. To evaluate this inaccuracy, we shifted an image by an integer plus some subpixel amount (Figure 12), and compared the stereo correlator output disparity with the actual image shift. The horizontal image shift corresponds to the case where a fronto-parallel planar surface moves back or forth. If the stereo correlator were perfect, every pixel would register a disparity equal to the actual amount of the shift. By observing deviations from the correct
Figure 12. Horizontal image shift corresponds to the case when a fronto-parallel planar surface moves back or forth.
Figure 13. Disparity bias error (left) and rms error (right) of the subpixel disparity interpolation, obtained by varying
the amount of horizontal image shift.
disparity, we can estimate the amount of subpixel error contributed by the subpixel interpolation. The results (Figure 13 left plot) indicate that the subpixel quadratic interpolation has a bias error in estimating the subpixel disparity value. The bias tends towards the nearest integer disparity, and is about 0 at half-pixel (integer-and-a-half) disparities. Due to a large bias value at quarter-pixel disparities, the rms disparity error relative to the actual horizontal image shift yields double humps (Figure 13 right plot) at integer+1/4 and integer+3/4 pixels. The overall stereo disparity rms error due to subpixel interpolation can be computed as the disparity rms error over all integer-pixel and fractional-pixel disparities, or 11.0, =∆ interpoldσ
pixel. Without subpixel interpolation, the stereo disparity peak bias error would have been ±0.5 pixel, and the rms error would have been 0.29 pixels.
4.5 Vertical misalignment Vertical misalignment caused by imperfect camera calibration also affects stereo performance. To investigate the effect of vertical misalignment, the left image is shifted both horizontally and vertically (Figure 14). Figure 15 shows the bias and rms errors of the stereo disparity estimate for various vertical disparities. The curves show mean deviation, and the vertical bars show standard deviation from the mean for 0.0 to −0.5 pixel vertical shifts. Horizontal shifts of 8.1-8.4 pixels have a negative mean deviation, biased towards 8 pixels, while horizontal shifts of 8.6-8.9 pixels have a positive mean deviation, biased towards 9 pixels. Vertical shift reduces the mean bias error somewhat, but increases the rms error. The stereo disparity rms error caused by only vertical misalignment can be computed by considering only integer horizontal image shifts (Figure 16, red square marks), while the stereo disparity error caused by both subpixel
Figure 14. A horizontal & vertical image shift corresponds to the case when a fronto-parallel planar surface moves
back or forth with a vertical misalignment

Figure 15. Stereo disparity error over horizontal and vertical image shifts
0
0.1
0.2
0.3
0.4
0.5
-0.7 -0.5 -0.3 -0.1 0.1 0.3 0.5 0.7
vertical image shift (pixels)
disp
arity
erro
r (pi
xels
)
overall rms errorinteger hor. disp only
-0.4-0.3
-0.2
-0.1
0
0.1
0.2
0.30.4
0.5
7.8 8 8.2 8.4 8.6 8.8 9 9.2
horizontal image shift (pixels)
disp
arity
err
or (p
ixel
s)
vertical shift 0.0vertical shift -0.1vertical shift -0.2vertical shift -0.3vertical shift -0.4vertical shift -0.5
Figure 16. Stereo disparity rms error due to vertical misalignment (vertical image shift) and subpixel
interpolation (horizontal image shift)
interpolation and vertical misalignment can be computed by considering all horizontal image shifts of both integer and fractional values (Figure 16, blue diamond marks). The two curves in Figure 16 suggest that the stereo disparity rms error due to vertical and horizontal image shift can be approximately decoupled,
, (12) 2_,
2,
2, misalignverticaldinterpoldcombinedd ∆∆∆ +≅ σσσ
where 11.0, =∆ interpoldσ pixel from Section 4.4.
4.6 Foreshortening Foreshortening also contributes to stereo disparity error [4]. When a planar surface tilts forward or backward, the left and right images are related by a shear transformation (Figure 17). It can be shown that
, (14) ixiLiR yZBmZBfxx )/()/( 00,, +−=
where mx is the surface tilt slope relative to the vertical plane and mxB/Z0 is the disparity increment rate per row on the right image. With the baseline B = 0.2 m, the disparity increment rate becomes 1/8 pixel per row, when the surface horizontal slope relative to the horizontal plane = 9° at 10 m away, 39° at 2 m, or 58° at 1 m. Figure 18 shows the stereo disparity bias and rms errors for three different
Figure 17. Image shear corresponds to the case when the planar surface is tilted forward or backward.
Figure 18. Disparity bias error (left) and rms error (right) of the subpixel disparity interpolation, obtained by varying
the image shear rate of 1/4, 1/8, 1/16 pixel shift per row
image shear rates with a window size of 9×9 pixels. The results are similar to Figure 13.
When a planar surface rotates left or right from the fronto-parallel vertical plane, foreshortening errors are again introduced. This time the effect stretches or squeezes one image relative to the other (Figure 19). It can be shown
, (14) iyiLiR xZBmZBfxx )/()/( 00,, +−=
where my is the surface rotation slope relative to the vertical plane and myB/Z0 is the disparity increment rate per column on the right image. Figure 20 shows the stereo
Figure 19. Image stretch/squeeze corresponds to the case when the planar surface is rotated sideways
0
0.1
0.2
0.3
0.4
0 0.5 1
subpixel disparity
disp
arity
rms
erro
r (pi
xels
)
sixteentheighthquarter
-0.15
-0.1
-0.05
0
0.05
0.1
0.15
0 0.5 1
subpixel disparity
disp
arity
bia
s er
r (pi
xels
)
0
0.1
0.2
0.3
0.4
0 0.5 1
subpixel disparity (pixels)
disp
arity
rms
erro
r (pi
xels
)
sixteentheighthquarter
-0.15
-0.1
-0.05
0
0.05
0.1
0.15
0 0.5 1
subpixel disparity (pixels)
disp
arity
bia
s er
ror (
pixe
ls)
Figure 20. Disparity bias error (left) and rms error (right) of subpixel disparity interpolation, obtained by varying the image stretch rate of 1/4, 1/8, 1/16 pixel shift per column
disparity bias and rms errors for three different image rotation rates with a window size of 9×9 pixels. The results are very similar to Figure 17 for image shear, except that the rms error values are slightly larger. 4.7 Computing Overall Localization Errors So far we examined various sources contributing to stereo localization error individually. Now we tally all of these individual errors and compute a combined error. Noting that down-range and cross-range errors can be computed by (11) and (12) for the given range, all we need to determine is the overall stereo disparity error d∆σ and the common horizontal reprojection error in
pixels. We analyzed the stereo localization error for five different stereo settings: three (2.3mm, 4 mm, 16 mm) focal length lenses with total station metrology and two (2.8 mm and 16 mm) with laser tracker metrology. The metrology accuracy was 1/100,000, or 0.1 mm over a 10 m range for the laser tracker (Leica LTD 500) and 0.5 mm for the total station (Leica TDM 5000).
2/)( rl xx ∆+∆σ
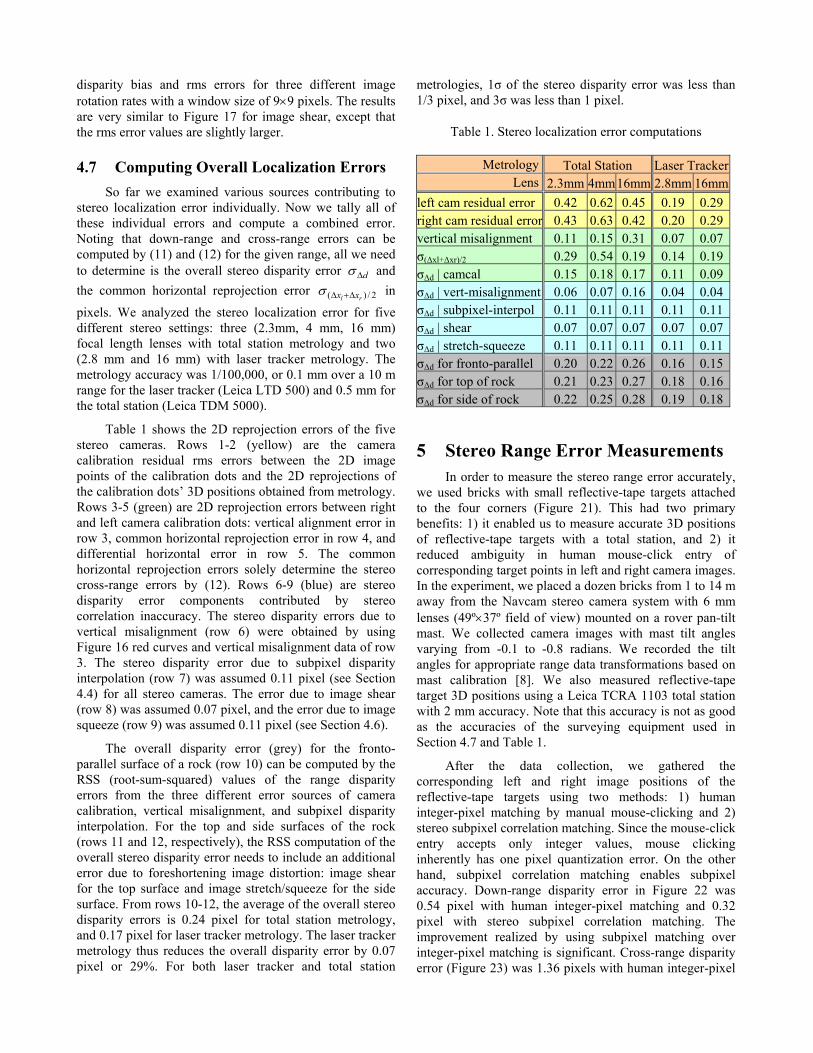
Table 1 shows the 2D reprojection errors of the five stereo cameras. Rows 1-2 (yellow) are the camera calibration residual rms errors between the 2D image points of the calibration dots and the 2D reprojections of the calibration dots’ 3D positions obtained from metrology. Rows 3-5 (green) are 2D reprojection errors between right and left camera calibration dots: vertical alignment error in row 3, common horizontal reprojection error in row 4, and differential horizontal error in row 5. The common horizontal reprojection errors solely determine the stereo cross-range errors by (12). Rows 6-9 (blue) are stereo disparity error components contributed by stereo correlation inaccuracy. The stereo disparity errors due to vertical misalignment (row 6) were obtained by using Figure 16 red curves and vertical misalignment data of row 3. The stereo disparity error due to subpixel disparity interpolation (row 7) was assumed 0.11 pixel (see Section 4.4) for all stereo cameras. The error due to image shear (row 8) was assumed 0.07 pixel, and the error due to image squeeze (row 9) was assumed 0.11 pixel (see Section 4.6).
The overall disparity error (grey) for the fronto-parallel surface of a rock (row 10) can be computed by the RSS (root-sum-squared) values of the range disparity errors from the three different error sources of camera calibration, vertical misalignment, and subpixel disparity interpolation. For the top and side surfaces of the rock (rows 11 and 12, respectively), the RSS computation of the overall stereo disparity error needs to include an additional error due to foreshortening image distortion: image shear for the top surface and image stretch/squeeze for the side surface. From rows 10-12, the average of the overall stereo disparity errors is 0.24 pixel for total station metrology, and 0.17 pixel for laser tracker metrology. The laser tracker metrology thus reduces the overall disparity error by 0.07 pixel or 29%. For both laser tracker and total station
metrologies, 1σ of the stereo disparity error was less than 1/3 pixel, and 3σ was less than 1 pixel.
Table 1. Stereo localization error computations
Metrology Total Station Laser TrackerLens 2.3mm 4mm 16mm 2.8mm 16mm
left cam residual error 0.42 0.62 0.45 0.19 0.29right cam residual error 0.43 0.63 0.42 0.20 0.29vertical misalignment 0.11 0.15 0.31 0.07 0.07σ(∆xl+∆xr)/2 0.29 0.54 0.19 0.14 0.19σ∆d | camcal 0.15 0.18 0.17 0.11 0.09σ∆d | vert-misalignment 0.06 0.07 0.16 0.04 0.04σ∆d | subpixel-interpol 0.11 0.11 0.11 0.11 0.11σ∆d | shear 0.07 0.07 0.07 0.07 0.07σ∆d | stretch-squeeze 0.11 0.11 0.11 0.11 0.11σ∆d for fronto-parallel 0.20 0.22 0.26 0.16 0.15σ∆d for top of rock 0.21 0.23 0.27 0.18 0.16σ∆d for side of rock 0.22 0.25 0.28 0.19 0.18
5 Stereo Range Error Measurements In order to measure the stereo range error accurately, we used bricks with small reflective-tape targets attached to the four corners (Figure 21). This had two primary benefits: 1) it enabled us to measure accurate 3D positions of reflective-tape targets with a total station, and 2) it reduced ambiguity in human mouse-click entry of corresponding target points in left and right camera images. In the experiment, we placed a dozen bricks from 1 to 14 m away from the Navcam stereo camera system with 6 mm lenses (49º×37º field of view) mounted on a rover pan-tilt mast. We collected camera images with mast tilt angles varying from -0.1 to -0.8 radians. We recorded the tilt angles for appropriate range data transformations based on mast calibration [8]. We also measured reflective-tape target 3D positions using a Leica TCRA 1103 total station with 2 mm accuracy. Note that this accuracy is not as good as the accuracies of the surveying equipment used in Section 4.7 and Table 1.
After the data collection, we gathered the corresponding left and right image positions of the reflective-tape targets using two methods: 1) human integer-pixel matching by manual mouse-clicking and 2) stereo subpixel correlation matching. Since the mouse-click entry accepts only integer values, mouse clicking inherently has one pixel quantization error. On the other hand, subpixel correlation matching enables subpixel accuracy. Down-range disparity error in Figure 22 was 0.54 pixel with human integer-pixel matching and 0.32 pixel with stereo subpixel correlation matching. The improvement realized by using subpixel matching over integer-pixel matching is significant. Cross-range disparity error (Figure 23) was 1.36 pixels with human integer-pixel

matching, and 1.39 pixels with stereo subpixel correlation matching. As expected based on the studies in Section 4, subpixel correlation did not improve the cross-range disparity error.
Figure 21. Bricks with reflective targets were used for
stereo range error measurements
Figure 22. Down-range error
Figure 23. Cross-range error
6 Conclusions In this paper, we presented our findings on the performance and error analysis of the JPL stereo system. Also, stereo localization errors were validated experimentally. The results are applicable to any similar real-time correlation based stereo technique.
Acknowledgment This work was performed at the Jet Propulsion Laboratory, California Institute of Technology, under a contract with the National Aeronautics and Space Administration. This work is supported by NASA Mars Science Laboratory (MSL) Focused Technology Program.
References [1] D. Scharstein and R. Szeliski, “A Taxonomy and Evaluation of Dense Two-Frame Stereo Correspondence Algorithms,” Int. J. Computer Vision, vol. 47, pp.7-42, 2002.
[2] http://iris.usc.edu/Vision-Notes/bibliography/contents stereo.html
[3] S. B. Goldberg, M.W. Maimone, L. Matthies, “Stereo Vision and Rover Navigation Software for Planetary Exploration,” IEEE Aerospace Conf., Mar. 2002.
[4] Y. Xiong, L. Matthies, "Error analysis of a real-time stereo system". IEEE Conference on Computer Vision and Pattern Recognition (CVPR), San Juan, Puerto Rico, June 1997.
[5] R. Volpe, I.A.D. Nesnas, T. Estlin, D. Mutz, R. Petras, H. Das, "CLARAty: Coupled Layer Architecture for Robotic Autonomy." JPL Technical Report D-19975, Dec 2000.
[6] A. Ansar and W. Kim, Mars Science Laboratory Technology Functional Design Document: Stereo Vision, JPL Internal Document, June 2003.
[7] W. Kim, R. Steinke, R. Steele, and A. Ansar, Camera Calibration and Stereo Vision Technology Validation Report, JPL D-27015, Jan. 2004.
[8] W. Kim, A. Ansar, R. Steele, “Rover Mast Calibration, Exact Camera Pointing, and Camera Handoff for Visual Target Tracking,” Int. Conf. on Automation and Robotics (ICAR), July 2005.