Embed Size (px)
Citation preview

PERCEIVED VALUE OF INVESTMENT PROMOTION INCENTIVES,
ORGANIZATIONAL CHARACTERISTICS, MACRO-MARKETING
ENVIRONMENT AND PERFORMANCE OF FIRMS IN EXPORT
PROCESSING ZONES IN KENYA
JOSEPH NYONJE KOSURE
A THESIS SUBMITTED IN FULFILMENT OF THE REQUIREMENTS FOR
AWARD OF THE DEGREE OF DOCTOR OF PHILOSOPHY IN BUSINESS
ADMINISTRATION, SCHOOL OF BUSINESS,
UNIVERSITY OF NAIROBI
2015

i
DECLARATION
This thesis is my original work and has not been presented for a degree award in any
other university or institution.
Signed……………………………… Date……………………………………….
Joseph Nyonje Kosure
(D80/60239/2011)
This thesis has been submitted for examination with our approval as the University
Supervisors.
Signed…………………………………… Date……………………………………
Professor Francis N. Kibera, PhD
Department of Business Administration
University of Nairobi
Signed…………………………………Date……………………………………
Dr. Raymond M. Musyoka, PhD
Department of Business Administration
University of Nairobi
Signed…………………………………Date…………………………………
Dr. James M. Njihia, PhD
Department of Business Administration
University of Nairobi

ii
DEDICATION
I dedicate this work to the legendary Odera Akang’o who inculcated in my Gem
people the power of letters through academic pursuit.
and
To my late uncle Richard Aruwa Ofinyo

iii
ACKNOWLEDGEMENT
I am grateful to the stewardship of Prof. Francis N. Kibera, Dr. Raymond M.
Musyoka and Dr. James M. Njihia through supervision and intellectual contribution
that went into this work. The fatherly advice of Prof. Kibera went beyond call of
duty. I thank Dr. Musyoka and Dr. Njihia for their guidance, advice and support. As
my supervisors, I got such unwavering support that made my work enjoyable with a
whole sense of teamwork. I appreciate Professor Martin Ogutu, Coordinator,
Doctoral Studies, Prof. Justus Munyoki, Prof. Z.B. Awino, and Prof. G. P. Pokharial
for continued guidance and encouragement during my PhD studies. I thank my
sponsors Prof. Matthew Buyu (USIU) and Prof. Paul Acholla (Kenyatta University).
I sincerely appreciate and thank the management of Export Processing Zones
Authority and particularly Benjamin Chesang, Margaret Waithaka, Fanuel Kidenda,
Meshack Kimeu, Paul Dondo, Francis Rotich, Francis Itegi, Jonathan Chifallu and
Truphine Sumbeiywo for the great support in providing secondary data and making it
possible for my research assistants to collect primary data from the investors. Your
steadfast support made this study a success. I also thank the investors who took part in
the survey especially for accepting to be part of the study.
I appreciate my colleagues at the Commission for the Implementation of the
Constitution for their support. I am indebted to Chairman Charles Nyachae, Dr.
Elizabeth Muli, Com. Kamotho Waiganjo and Dr. Kibaaya Laibuta for continuous
encouragement. I thank Professor Wanyande for his guidance and advice. I further
thank Laurraine Onyango, Phillip Abishai and Vashti Nadayat for the information
technology support. My secretary Nina Kabayo, and Daniel Ngetich thank you for
continuous encouragement.
I thank my research assistants Denis Tuiyot, Truphine Sumbeiywo, Francis Itegi and
John Winjah for doing a great job. Your immense contribution made this study a
success. George Okello thank you for the invaluable tutorials in statistics that made
this work possible.
Finally, Dr. B.M. Nyonje (Min Daughty), Atieno, Ramogi and Jema-Alando, thank
you my clan for the invaluable support and encouragement.
iv
ABSTRACT
The broad objective of this study was to establish the influence of perceived value of
investment promotion incentives, organizational characteristics and macro-marketing
environment on performance of firms in the export processing zones (EPZ) in Kenya.
The study had six specific objectives to determine both direct and indirect
relationships among variables. A conceptual model was developed, and from it, six
hypotheses were formulated. The study was cross-sectional survey where all operating
EPZ firms in Kenya formed the population. Secondary data were obtained from
various reports and bulletins. Primary data were collected from the study population
using structured self-administered questionnaire. The unit of measurement of the study
was the firm. Reliability test was undertaken using dimension reduction with
Cronbach’s alpha of 0.60 as the cut-off point. Pre-testing (pilot) exercise was carried
out to determine content validity, and necessary corrections and adjustments made to
the instrument. Analysis of data was done using various measures and tests through
descriptive and inferential statistics. Simple and multiple linear regression, and
correlation analyses were used to test the six hypotheses. The relationships between
and the influence of the variables were determined, inferences made and conclusions
drawn. Results indicated that perceived value of investment promotion incentives had
significant influence on firm performance. The tests also established that there was
strong positive relationship between organizational characteristics and firm
performance. Equally strong positive relationship was observed between macro-
marketing environment and firm performance. Macro-marketing environment was
found to have significant moderating influence between perceived value of investment
promotion incentives and firm performance. It was further established that
organizational characteristics had significant moderating influence on the relationship
between perceived value of investment promotion incentives and firm performance.
Finally, the study revealed that perceived value of investment promotion incentives,
organizational characteristics and macro-marketing environment had significant joint
influence on firm performance. However, the contribution of macro-marketing
environment to the joint effect was negligible. The study has contributed to theory
development, policy and marketing practice to the extent that it made
recommendations and offered suggestions on areas of future research. The study had
some limitations mainly caused by the scope of work. Only top management was
targeted leaving out other employees. Sampling across the organizational hierarchy
could ensure a larger and more inclusive sample. Furthermore, as a study variable,
organizational characteristics was constructed with limited aspects of culture, structure
and design namely age, size and ownership. However, the limitation did not have an
adverse effect on the results. Future studies could address these limitations by
adaptation to the sampling and instrument designs, which may include longitudinal
studies.

v
TABLE OF CONTENTS
DECLARATION…..................................................................................................... i
DEDICATION…….................................................................................................... ii
ACKNOWLEDGEMENT ........................................................................................ iii
ABSTRACT……… ................................................................................................... iv
LIST OF TABLES.. .................................................................................................. ix
LIST OF FIGURES ................................................................................................. xii
ABBREVIATIONS AND ACRONYMS ............................................................... xiii
CHAPTER ONE: INTRODUCTION ...................................................................... 1
Background .............................................................................................. 1
1.1.1 Perceived Value of Investment Promotion Incentives ........................... 2
1.1.2 Organizational Characteristics ............................................................... 4
1.1.3 Macro-marketing Environment ............................................................. 5
1.1.4 Firm Performance ................................................................................. 6
1.1.5 Export Processing Zones in Kenya ........................................................ 7
Research Problem ................................................................................... 14
Research Objectives ............................................................................... 18
Value of the Study .................................................................................. 18
CHAPTER TWO: LITERATURE REVIEW ....................................................... 21
Introduction ............................................................................................ 21
Theoretical Foundation of the Study ...................................................... 21
2.2.1 Heckscher-Ohlin’s Theory of International Trade .............................. 21
2.2.2 Macro-marketing Theory .................................................................... 22
2.2.3 Theory of Location Advantage ............................................................ 23
2.2.4 Cluster Theory ..................................................................................... 24
2.2.5 Eclectic Theory of Foreign Direct Investment..................................... 25
Perceived Value of Investment Promotion Incentives
and Firm Performance ............................................................................ 25
Organizational Characteristics and Firm Performance .......................... 27

vi
Macro-marketing Environment and Firm Performance ......................... 28
Perceived Value of Investment Promotion Incentives, Macro-marketing
Environment and Firm Performance ...................................................... 29
Perceived Value of Investment Promotion Incentives, Organizational . 30
Characteristics and Firm Performance ................................................... 30
2.8 Perceived Value of Investment Promotion Incentives, Organizational
Characteristics, Macro-marketing Environment and Firm Performance 31
Summary of Knowledge Gaps ............................................................... 32
Conceptual Framework .......................................................................... 37
Research Hypotheses .............................................................................. 39
2.12 Summary of the Chapter ......................................................................... 40
CHAPTER THREE: RESEARCH METHODOLOGY ...................................... 41
Introduction ............................................................................................ 41
Research Philosophy .............................................................................. 41
Research Design ..................................................................................... 42
Population of the Study .......................................................................... 42
Data Collection ....................................................................................... 43
Reliability and Validity Tests ................................................................. 44
Tests of Assumptions of Regression Analysis ....................................... 47
Operationalization of Study Variables ................................................... 50
Data Analysis ......................................................................................... 55
Moderation Tests .................................................................................... 60
Summary of the Chapter ......................................................................... 61
CHAPTER FOUR: DATA ANALYSIS, FINDINGS AND DISCUSSION ........ 62
Introduction ............................................................................................... 62
Response Rate ........................................................................................... 62
Respondent Characteristics ....................................................................... 63
4.4 Firm Characteristics .................................................................................. 71
4.5 Descriptive Statistics for the Independent and Dependent Variables ....... 81
4.6 Screening for Outliers ............................................................................... 91
4.7 Correlation Analysis .................................................................................. 96
4.8 Tests of Hypotheses ................................................................................... 97

vii
4.8.1 Perceived Value of Investment Promotion Incentives and
Firm Performance ................................................................................. 97
4.8.2 Organizational Characteristics and Firm Performance ....................... 100
4.8.3 Macro-marketing Environment and Firm Performance ...................... 101
4.8.3 Macro-marketing Environment, Perceived Value of
Investment Promotion Incentives and Firm Performance .................. 103
4.8.4 Organizational Characteristics, Perceived Value of
Investment Promotion Incentives and Firm performance ................... 110
4.8.5 Perceived Value of Investment Promotion Incentives,
Organizational Characteristics, Macro-marketing
Environment and Firm Performance ................................................... 116
4.8.6 Summary of Research Objectives, Hypotheses, Results and
Interpretation ....................................................................................... 123
4.8.7 Empirical Model ................................................................................. 126
4.9 Discussion of the study Findings ............................................................... 128
4.9.1 Perceived Value of Investment Promotion Incentives and
Firm Performance ............................................................................... 128
4.9.2 Organizational Characteristics and Firm Performance ....................... 129
4.9.3 Macro-marketing Environment and Firm Performance ...................... 130
4.9.4 Macro-marketing Environment, Perceived Value of
Investment Promotion Incentives and Firm Performance .................. 130
4.9.5 Organizational Characteristics, Perceived Value of
Investment Promotion Incentives and Firm Performance .................. 131
4.10 Summary of the Chapter ......................................................................... 132
CHAPTER FIVE: SUMMARY, CONCLUSION AND
RECOMMENDATIONS ...................................................... 134
Introduction ............................................................................................. 134
Summary… ............................................................................................. 134
Conclusion ............................................................................................... 135
Implications of the Study ........................................................................ 136
5.5 Limitations of the Study .......................................................................... 138
5.6 Recommendations ................................................................................... 139

viii
5.7 Suggestion for Future Research ............................................................... 140
REFERENCES…… ............................................................................................... 142
APPENDICES……… ............................................................................................ 150
Appendix I: Researcher’s Letter of Introduction ......................................... 150
Appendix II: University Letter of Introduction ........................................... 151
Appendix III: EPZA Letter of Introduction ................................................. 152
Appendix VI: Tests of Regression Analysis Assumptions .......................... 174

ix
LIST OF TABLES
Table 1.1: Performance of EPZ Key Indicators: 2011 - 2014 ............................... ….10
Table 1.2: EPZ Contribution to the National Economy: 2011- 2014………………..13
Table 2.1: Summary of Knowledge Gaps………………………………………… 33
Table 3.1: Summary of Reliability Tests ................................................................... 46
Table 3.2: Operationalization of Study Variables ...................................................... 52
Table 3.3: Summary of Data Analysis Based on Objectives, Hypotheses,
Analysis Techniques, Model Estimation and Interpretation of
Results ......................................................................................................57
Table 4.1: Respondent Distribution by Gender ......................................................... 63
Table 4.2: Distribution of Respondents by Age..……………………………………63
Table 4.3: Distribution of Respondents by Highest Level of Education
Attained ....................................................................................................64
Table 4.4: Distribution of Respondents by Position in the
Firm……...........................................................................................…...65
Table 4.5: Distribution of Respondents by Length of Service in the Firm .............. ..66
Table 4.6: Distribution of Respondents by Gender, Duration and Position
in the Firm ................................................................................................67
Table 4.7: Distribution of Respondents by Gender, Positon in the Firm
and Level of Education .............................................................................68
Table 4.8: Distribution of Respondents by Gender, Age and Duration ..................... 70
Table 4.9: Distribution of Firm Characteristics by Sector ......................................... 71
Table 4.10: Distribution of Firm Characteristics by Ownership.................................. 72
Table 4.11: Distribution of Firm Characteristics by Ownership and Sector................ 73
Table 4.12: Distribution of Firm Characteristics by Age of the Firm ......................... 74
Table 4.13: Distribution by Ownership, Age and Sector ............................................. 75
Table 4.14: Year of Incorporation in Kenya ................................................................ 76
Table 4.15: Distribution of Firm Characteristics by Year of Incorporation
and Sector .................................................................................................77
Table 4.16: Distribution of Firm Characteristics by Current Investment
Value of the Firm ('Million US. Dollars) .................................................78

x
Table 4.17: Distribution of Firm Characteristics by Number of Employees
2011-2014 (Employment Generation) ....................................................79
Table 4.18: Mean Scores, Standard Deviations and Coefficient of
Variation (Cv) for Perceived Value of Investment Promotion
Incentives ................................................................................................ 81
Table 4.19: Mean Scores, Standard Deviations and Coefficient of
Variation (Cv) for Organizational Characteristics ..................................82
Table 4.20: Mean Scores, Standard Deviations and Coefficient of
Variation (Cv) for Macro-marketing Environment (Political
Issues) .....................................................................................................83
Table 4.21: Mean Scores, Standard Deviations and Coefficient of
Variation (Cv) for Macro-marketing Environment (Economic
Issues In General) ...................................................................................84
Table 4.23: Mean Scores, Standard Deviations and Coefficient of
Variation (Cv) for Macro-marketing Environment (Social
Issues) .....................................................................................................86
Table 4.24: Mean Scores, Standard Deviations and Coefficient of
Variation (Cv) for Macro-marketing Environment
(Technological Issues) ............................................................................87
Table 4.25: Mean Scores, Standard Deviations and Coefficient of
Variation (Cv) for Macro-marketing Environment (Legal
Issues) .....................................................................................................88
Table 4.26: Mean Scores, Standard Deviations and Coefficient of
Variation (Cv) for Macro-marketing Environment (Ecological
Issues) .....................................................................................................89
Table4.27: Mean Scores, Standard Deviations and Coefficient of
Variations (Cv) for Firm Performance ....................................................90
Table 4.28: Results of Cook's Distance and Z-score Test for Outliers in the
Interaction between Perceived Value of Investment Promotion
Incentives and Firm Performance ...........................................................91
Table 4.29: Results of Cook's Distance and Z-score Tests for Outliers
in the Interaction among Perceived Value of Investment

xi
Promotion Incentives, Macro-marketing Environment and
Firm Performance……………………………………………………….92
Table 4.30: Results of Cook's Distance and Z-score Tests for Outliers in the
Interaction among Perceived Value of Investment Promotion
Incentives, Organizational Characteristics and Firm
Performance ............................................................................................93
Table 4.31: Results of Cook's Distance and Z-score Tests for Outliers in the
Interaction among Perceived Value of Investment Promotion
Incentives, Performance .......................................................................... 95
Table 4.32: Correlation Analysis ............................................................................... 95
Table 4.33: Regression Results for the Influence of Perceived Value of
Investment Promotion Incentives on Firm Performance ........................98
Table 4.34: Correlation Results for the Relationship between
Organizational Characteristics and Firm Performance .........................100
Table 4.35: Correlation Results for the Relationship between Macro-
marketing Environment and Firm Performance ...................................101
Table 4.36: Regression Results of the Influence of Macro-marketing
Environment on the Relationship between Perceived Value of
Investment Promotion Incentives and Firm Performance ....................104
Table 4.37: Regression Results of the Moderating Influence of
Organizational Characteristics on the Relationship between
Perceived Value of Investment Promotion Incentives and Firm
Performance ..........................................................................................110
Table 4.38: Regression Results of the Test of the Joint Influence of
Perceived Value of Investment Promotion Incentives,
Organizational Characteristics and Macro-marketing
Environment on Firm Performance (First Analysis) ............................116
Table 4.39: Regression Results of the Joint Influence of Perceived Value of
Investment Promotion Incentives, Organizational
Characteristics and Macro-marketing Environment on Firm
Performance (Second Analysis) ............................................................119
Table 4.40: Summary of Research Objectives, Hypotheses, Results and
Interpretation .........................................................................................122

xii
LIST OF FIGURES
Figure 2.1: Conceptual Model .................................................................................... 37
Figure 3.1: Path Analysis Diagram for Moderating Influence Tests .......................... 59
Figure 4.1: Moderation Path Diagram of the Effect of Macro-
marketing Environment ...................................................................……108
Figure 4.2: Moderation Path Diagram of the Effect of Organizational
Characteristics…………………………………………………....……..114
Figure 4.3: Empirical Model of the Study Variables………………………………...125

xiii
ABBREVIATIONS AND ACRONYMS
AGOA :
COMESA:
Cv :
EAC :
EPZ :
EPZA :
FIAS :
FDI :
FTZ :
GDP :
IT :
LaRRI :
MNC :
NHIF :
NSSF :
OLI :
PAYE :
SEZ :
SPSS :
African Growth and Opportunity Act
Common Market for Eastern and Southern Africa
Coefficient of Variation
East African Community
Export Processing Zone
Export Processing Zones Authority
Foreign Investment Advisory Service
Foreign Direct Investment
Free Trade Zone
Gross Domestic Product
Information Technology
Labour Resource and Research Institute
Multi-National Corporation
National Hospital Insurance Fund
National Social Security Fund
Ownership, Location and Internalization
Pay As You Earn
Special Economic Zone
Statistical Package for Social Sciences

xiv
SRI :
UNCTAD :
VAT :
Social Responsible Investment
United Nations Conference on Trade and Development
Value Added Tax

1
CHAPTER ONE: INTRODUCTION
Background
International market entry strategies are competition driven where comparative and
location advantages are critical in defining market share and entry decisions. With
globalization, many firms attempt to expand their market share in the new and
potentially more profitable foreign markets (Hollensen, 2007). Bartels (1968)
postulates that marketing technology or thought has been elaborately developed, and
the concepts and generalizations thereof have been held to have universality
transcending national boundaries and cultural differences. Investors venture into
foreign markets with motives of resource, efficiency and market seeking.
Export processing zones (EPZs) programme is one of the entry strategies foreign
companies may use to establish export manufacturing offshore with the aim of being
near the market at competitive costs. The programme is a country marketing policy
instrument used by host countries to stimulate exports, manufacturing, foreign
exchange earnings, employment and economic growth especially in early stages of
industrialization and economic development (Ge, 1999; Wells & Wint, 2000). It is a
sub-optimal policy option to spur export growth at the early stages of economic
development of a country. Country marketing is often undertaken by trade promotion
agencies to position host country as an attractive investment location (Wells & Wint,
2000). These agencies are therefore, established to regulate and promote programmes
such as the EPZs on behalf of the host country. In the case of Kenya, the Export
Processing Zones Authority (EPZA) regulate and promote the EPZs as one of the
country marketing programmes to position Kenya as an attractive trade and
investment destination. Performance of EPZ firms may however be affected by
several variables in the operating environment. This study considered the influence of
investment promotion incentives, macro-marketing environment and the
organizational characteristics on the performance of EPZs firms in Kenya.
The relevant theories for the study were Heckscher-Ohlin’s Theory of International
Trade, which is a development from comparative cost theory that recognizes
interdependence of marketing to the societal environment. Macro-marketing Theory

2
discusses marketing from profit/non-profit, positive/normative and macro-/ micro-
perspectives and their effect on societies based on objectives to be achieved and lays
foundation for international marketing theory. Theory of Location Advantage
advances factors that influence investment movements. Cluster Theory develops
spatiality concept, which defines geographic concentration of interconnected firms.
Lastly, Eclectic Theory defines determinants for Foreign Direct Investment (FDI)
movements across countries stimulated by considerable uncertainties faced by firms
about future conditions affecting their costs, demand and profitability hence the need
for resource, market and efficiency seeking (Hunt, 1991; UNCTAD, 1998; Hollensen,
2007; Ahuja, 2010; Denisia, 2010). Countries take advantage of these uncertainties
and create competitive incentive packages to attract investing firms from their original
locations due to challenges in productivity, market dynamics, tastes, and economic
policy changes. Holistically, these theories, mainly crystallized into location
advantage concept, inform the country marketing approach of the study.
Kenya introduced EPZs programme during the implementation of Structural
Adjustment Programmes (SAPs) in the early 1990s offering a number of fiscal and
non-fiscal incentives (EPZ Act, 1990). Kenya at the time needed investment
promotion incentives that would attract FDI to create employment, generate foreign
exchange, expose local workforce to foreign technology and skills as well as create
backward linkage with the domestic economy. This study investigates the influence of
organizational characteristics and macro-marketing environment on the relationship
between perceived value of investment promotion incentives and the performance of
firms in the EPZs in Kenya.
1.1.1 Perceived Value of Investment Promotion Incentives
Perceived value is both a uni-dimensional and multi-dimensional construct that
defines utilitarian perspective in which economic and cognitive reasoning is used to
assess the benefits and costs arising from a transaction (Sanchez-Fernandez & Iniesta-
Bonilo, 2007). The value is determined by quality and price, utility and price
relationships, risk and image of provider. Investment is current commitment of money
for a period of time in order to derive future payments that compensate the investor
for the time funds are committed, expected rate of inflation, and the uncertainty of

3
the future payments (Brown & Reilly, 2009). Investment is made when the present
value of expected future revenues is, at the margin, equal to the opportunity cost of
capital and where the net present value is equal to zero with expectation to create a
stream of future cash flow (Eklund, 2013).
Investment promotion incentive is a country marketing strategy aimed at significantly
influencing foreign investment flows into a country. It involves giving promotional
information to potential investors, exhibiting attractive country image as an
investment destination, and providing services to prospective and existing investors
(Wells & Wint, 2000). It is an offer or subsidy by a government or an institution that
ensures simplified investment procedures in order to affect investment location
decision (FIAS, 2008; LaRRI, 2000). Engman, Onodera, and Pinali (2007) posit that
the often-offered incentives under EPZ schemes include enhanced physical
infrastructure, streamlined administrative services, fiscal incentives, relaxed legal and
regulatory requirements, and export promotion services. The modern EPZs have
focused on internationally competitive business environment by providing
infrastructure in terms of transport and logistical linkages and state-of-the-art
communication networks, efficient customs operations, reliable utility services and
efficient administration.
Angko (2014) has argued in his study analyzing the performance of export processing
zones in Ghana that the benefits of free zones are both static and dynamic. He
considers two sets of benefits of EPZs. First are static benefits that directly promote
and diversify exports in order to increase foreign exchange earnings, employment
creation and income generation. Second, are the dynamic benefits that refer to
technological transfer, labor training and skills upgrading, indirect employment
creation, backward linkages and regional development with critical contribution to
economic development.
In the context of this research, investment incentives are studied in relation to their
influence on the performance of EPZ firms in Kenya. Perceived value of investment
promotion incentives is a charge or cost to the host country. In this study, the
perceived value defines utilitarian assessment of costs arising from establishment and

4
sustenance of EPZ programme. It includes the tax revenue foregone, and expenses
related to promotion, infrastructure development and regulatory management.
1.1.2 Organizational Characteristics
Organization is a process, framework of relationships and group of persons. It is the
foundation upon which management structure is built (Barney, 1986). It is a tool used
to coordinate actions to obtain something people desire or value (Jones, 2010), and is
influenced by environment, structure and culture. Organization characteristics are
therefore the sum total of its culture, structure and design that define its set of
attributes developed over time and with which the organization is perceived and
identified (Barney, 1986). It is characterized by age, size, ownership, level of
investment, linkages with domestic economy and human resource management
policies practiced over time.
Organizational culture is a set of shared values and norms that control organizational
members’ interactions with one another and with suppliers, customers and other
people outside the organization (Jones, 2010). Barney (1986) refers to organizational
culture as a complex of values, beliefs, assumptions, and symbols that define the way
in which a firm conducts its business. It has influence on the firm’s performance as it
defines its relevant employees, customers, suppliers, competitors and the interaction
parameters. Organizational structure is the formal system of task and authority
relationships including policies, responsibilities, and regulations that control how
people coordinate their actions and use resources to achieve organizational goals
(ibid, p.29). Organization design is the process by which managers select and manage
aspects of structure and culture for the organization to control the activities necessary
to achieve its goals (ibid, p.31).
Holistic combination of culture, structure, and design gives an organization its
character. It defines the organization to the extent of distinguishing it from the rest. In
this study, age, ownership and size were used as they represent critical variables in the
organizational characteristics.

5
1.1.3 Macro-marketing Environment
The concept of macro-marketing environment explains external factors or forces,
comprising political, economic, socio-cultural, technological, ecological and legal
forces affecting firm performance in its interaction with each marketing system
(Bartels, 1968). Dibb, Simkin, Pride and Ferrell (2006) posit that a decision to invest
in a particular country is dependent on the awareness and reaction to these forces.
Hollensen (2007) explains structure and content of macro-marketing environment that
are fundamental in attracting firms into EPZs scheme. Njeru (2013) states the need for
the firms to equip themselves with first-hand knowledge in the external environment
for superior performance.
Hollensen (2007) posit that factors that may determine investment location decision
are frequency of policy changes, stability, economic management, attitude towards
foreign investors and international relations. Economic environment, which include
efficient management of both fiscal and non-fiscal policies, is important in
maintaining a competitive investment location (Radelet, 2004). Technological
environment defines the level of technological advancement in the location of an
organization. It results in cultural convergence through material culture explaining
how a society organizes its economic activities while manifesting itself in availability
and adequacy of basic economic, social, ecological, financial and marketing
infrastructures. Technological environment affects productivity of human capital,
quality of raw material, transformation and infrastructure (Hollensen, 2007). It defines
the timeliness and efficiency of delivery of goods and services by the firm. Through
information and technology (IT) based operations, a firm is able to transact on real
time with its customers and suppliers all over the world making global business local.
Observation and protection of ecological environment is a challenge to many firms.
Frey (2003) raises concern over core-based hazardous production processes in
Mexican EPZs. Fraj-Andres, Martinez-Salinas and Matute-Vallejo (2009) argue that
progressive degradation in the quantity and quality of the environmental resources
had encouraged societies to consider their responsibility in environmental problems. It
is therefore a factor of influence in the macro-marketing environment. Ecological
environment affects performance by causing the organization to balance its economic
interests with those of environmental stakeholders whose views are critical in

6
determining its competitiveness in the market place. Consumers currently demand for
environmentally friendly produced goods; hence, firms attempt to put in place policies
aimed at energy conservation, communal environmental protection and employee
observance of ecological preservation.
Firms that venture into foreign markets face a number of risks. However, these risks
may be considered less costly compared to the inherent benefits hence the decision to
go global. Some of the macro-marketing environmental risks are policy, competitive,
technological and resource risks. Ghosal (1987) define policy or political risks as
those arising from actions of national governments, competitive risks arising from
competitors’ uncertain behaviour or response to firm’s own strategy, resource risks
caused by failure to acquire resources necessary to undertake a strategy and finally,
technological risks that refer to firm response to new or changes in technology. The
magnitude or permanency of these risks may have implications on the decision of
foreign firms to invest in a location.
The premise of this study was to investigate the moderating influence of macro-
marketing environment between perceived value of investment promotion incentives
and performance of firms in the Kenyan EPZs. This was relevant in defining the role
macro-marketing environment played in attracting or discouraging the flow of FDI
into the country.
1.1.4 Firm Performance
Performance is a sum total of accomplishments attained by business or departments
involved with an organizational goal within a period of time (Ling & Hung, 2010). It
is measured differently depending on the purpose of the study. Level of measurement
may be quantitative and qualitative. It may also be subjective or objective. The
indicators may be financial or non-financial (Bontis, 2001). At firm level, the
performance measurements are financial, highlighting specific aspects of profitability,
liquidity, efficiency, solvency, productivity and strength.
The balanced scorecard devised by Kaplan and Norton (1992) shows company
performance as a measurement that required holistic approach from financial,
customer, internal business, learning perspectives and innovation. Global innovation

7
as a performance measurement variable, for example, refers to the ability of an
organization to tap into new opportunities in world markets in order to deliver
superior value to its customers (Ling, 2011). Although financial measurements are
cardinal to company performance, they should be supplemented by non-financial
measures such as customer satisfaction and other operating efficiency variables. Firm
performance can therefore, be measured from different perspectives (Kaplan &
Norton, 1992; Kennerley & Neely, 2003; Bontis, 2001). Interest parties may include
shareholders, government, community, customers/clients, and other non-state actors.
From the context of EPZ firms in Kenya, this study measured quantitative and
qualitative performance on financial and non-financial indicators (Author, 2015).
Financial indicators included foreign exchange earnings and employee taxes
indicators. Non-financial indicators were the number of jobs created, increment in
domestic expenditure, level of technology and skills transferred. This measurement
approach was consistent with management theorists who support the argument that
there was no agreement on performance measures (Venkatraman & Ramanujam,
1986; Hofer, 1983). They claim that scholars conceptualize measurement parameters
depending on their discipline of the study. It is a contextual concept associated with
the phenomenon under study. This view agrees with explanation that lack of
consensus on the definition arises because the concept is associated with a variety of
firm’s overall wellbeing ranging from financial profitability, output levels to market
levels (Venkatraman & Ramanujam, 1986; Hofer, 1983). Namada, Aosa, Awino, and
Wainaina (2014) argue that performance research had been drifting from exclusive
use of financial performance measures to the use of non-financial measures as well.
This study adopted practical approach to measuring firm performance. This was due
to its scope and intent that focused on host country benefits as opposed to focus on
investor benefits. It therefore used quantified measures in order to draw actual
inferences to the Kenyan EPZ firm performance.
1.1.5 Export Processing Zones in Kenya
The concept of free zones was in existence in the Phoenician City of Tyre and Greek
Island of Delos as early as 300 BC. FIAS (2008) gives the chronology of the city-
wide zones that defined the international trade routes with the tradition of storing duty

8
free goods before re-exporting. The Roman Empire free trade zones were set up along
commercial routes with major ones being Trans-Saharan, Hanseatic League, and
Rome-India (Marhoz & Szymansky, 1996). The modern EPZs which have become
popular trade, industrial and investment policy instruments in a number of countries
can be traced to 1958 when Shannon Free Zone in Ireland was established (Angko,
2014; FIAS, 2008).
Export Processing Zone is a designated part of a special economic zone
predominantly focused on export manufacture whose concept is characterized by
geographical definition where a government proclaims special conditions in a limited
area which may include physical, social and economic separation from the rest of the
country (Madani, 1999; Ge, 1999; Engman, Onodera & Pinali, 2007). Ge (1999)
describes an EPZ as a geographic area within the territory of a country where
economic activities of certain kinds are promoted by a set of policy instruments that
are not generally applicable to the rest of the country. The separation is to protect
local industry from undue, unlevelled competition as the firms in the zone enjoy
lucrative incentives with liberal laws. Separation is also for ease of control,
monitoring, supervision and protection of government revenue from leakage.
There are several terms used interchangeably with the term EPZ. In countries such as
China and Singapore, the often used terminology is special economic zones; Malaysia
uses the term Free Trade Zone. Other terminologies used in some countries include
Industrial Free Zones, Economic Zones, Industrial Parks, Export Processing Factories,
Enterprise Zones and Free ports (Yang, Wang, Chen, & Yuan, 2011; FIAS, 2008;
Aggarwal, 2007). Establishment of EPZs has various objectives and roles depending
on the needs of the host country. Jayanthakumaran (2003) studying the benefit-cost
appraisals of export processing zones observes that the motives range from the need
to decongest and reduce pollution citing the case of Thailand; Singapore’s objective
of investment attraction; and the policy shift from inward to outward looking
orientation which motivated China, S. Korea, Malaysia and Thailand to establish
EPZs.
In terms of cost consideration, transnational investors use the EPZ concept to move
from high cost to low cost production locations where labour is cheap or

9
competitively affordable. These are locations characterized by low wages, favourable
tax structures and lack of government regulations in areas like workplace safety and
environmental protection. However, Ghosal (1987) argues that such comparative
advantage should include societal comparative advantage relating to quality, quantity
and configuration of material, human and institutional resources available within the
bounds of a country. The investor mobility may also have side benefits in terms of
universalization of skills as workers can be trained anywhere in the world. The impact
of this is that EPZs can create market differentiation with homogenized production
spaces (Venkatesh, 1999).
Kenya introduced the EPZ programme following enactment of EPZ Act, Cap.517 as
an investment promotion incentive policy in 1990 to spur economic and export trade
development (Namada, 2013).The EPZs are regulated by the EPZ Authority created
by an Act of Parliament to promote and facilitate export-oriented investments and to
develop an enabling environment for such investments (EPZ Act, 1990). The Act
provides for a number of fiscal and procedural incentives. The fiscal incentives
include ten–year corporate tax holiday and 25% tax rate for 10 years thereafter with
exception to commercial enterprises; perpetual duty and VAT exemption on raw
materials, construction materials, machinery and other business inputs with exception
to motor vehicles and certain fuels; stamp duty exemption; and 100% investment
deduction on capital expenditure within 20 years of operation.
The procedural incentives are rapid project approval under essentially one licence; no
minimum investment level and un-restricted investment by foreigners; access to off
shore borrowing; operation of foreign currency accounts without exchange control;
autonomous control of investment proceeds; exemption from Statistics Act. The other
incentives include fast-tracked issuance of work permits for senior expatriate staff;
on-site customs documentation and inspection without charges on import declaration.
Investors are offered one-stop shop service by the EPZ Authority for facilitation and
after care.
Kenya has a total of 86 EPZ firms (including purely zone developers) operating in 52
zones spread across the country. Mombasa (22) and Nairobi (8) have the largest
concentration followed by Kilifi (6). Other areas with EPZs include Machakos (4),

10
Kiambu (2), Bomet (2) and Taita Taveta, Kajiado, Murang’a, Meru, Laikipia, Elgeyo
Marakwet, Uasin Gishu and Nandi counties with one zone each (EPZA, 2014).The
firms operating in the zones are in different sectors comprising 63 in manufacturing,
14 service and 9 commercial. Pure zone developers do not engage in processing and
export business. They lease out premises to processors and exporters. In 2014, the
sub-sectors comprised of agro-processing (26.74%), garments (24.42%), services
(15.12%), and garments support services (5.81%) of firms operating in the zones.
Beverages/spirits, pharmaceuticals and medical supplies, commercial craft, and relief
supplies contributed 3.49% each. Food processing, electricals, minerals, and plastics
each contributed 2.33%. Chemicals, dartboard, printing and other contributed 1.16%
each. The performance of the EPZ programme in Kenya for the last four years is
indicated in Table 1.1.
Table 1.1: Performance of EPZ Key Indicators: 2011 - 2014
Indicator 2011 2012 2013 2014 % Growth
(2013 v/s
2014)
Gazetted zones (no.) 45 47 50 52 4.0
Projects approved (no) 28 20 21 32 52.4
Enterprises Operating (no.) 79 82 85 86 1.2
Employment – (Kenyans) a 32,043 35,501 39,961 46,221 15.7
Employment - (Expatriates) b 421 428 472 517 9.5
Total Employment (No)=a+b 32,464 35,929 40,433 46,738 15.6
Total sales (Kshs. million)** 42,442 44,273 50,294 57,192 13.7

11
Indicator 2011 2012 2013 2014 % Growth
(2013 v/s
2014)
Exports (Kshs. million) 39,067 39,962 44,427 51,377 15.6
Domestic Sales (Kshs. million) 2,553 3,322 4,601 4,211 -8.5
Imports (Kshs. million) 21,443 24,973 27,413 29,461 7.5
Investment (Kshs. million) 26,468 38,535 48,004 44,218 -7.9
Expenditure on local Purchases
(Kshs mill.)1
6,276 8,027 7,721 8,170 5.8
Expenditure on local Salaries
(Kshs mill.)2
3,769 4,509 6,043 7,511 24.3
Expenditure on power
(Kshs mill.)3 701 757 870 1,004 15.4
Expenditure on
Telecommunication
(Kshs mill.)4
61 66 63 67 6.3
Expenditure on water
(Kshs mill.)5 87 117 117 173 47.9
Other domestic expenditure
(Kshs mill.)6
4,024 4,619 4,461 4,045 -9.3
Total Domestic Expenditure
(Kshs million) =
1+2+3+4+5+6*
14,921 18,097 19,275 20,970 8.8
* Foreign exchange equivalent injected into the economy
Source: EPZA Annual Report, 2014

12
Table 1.1 shows that overall employment (both local and expatriates) level in the
EPZs increased by 15.6% from 40,433 workers in 2013 to 46.738 workers in 2014.
Direct local employment (Kenyans) expanded by 15.7 % from 39,961 persons
recorded in 2013 to 46,221 persons in 2014. The increment could have been because
of some EPZ firms expanding their operations. Investment level in the EPZs
decreased by 7.9% to Ksh.44.2 billion in 2014 from Ksh.48.0 billion recorded in
2013. This could have been as a result of degazettment of some capital-intensive
firms.
EPZ exports increased by 15.6% from KSh.44.4 billion in 2013 to Ksh.51.4 billion in
2014. The major export markets for the Kenyan EPZ products in 2014 were USA
recording the highest percentage share which increased to 61.9% in 2014 from 56.4%
in 2013, and Europe which had a slight decrease to 13.4% in 2014 from 13.6% in
2013. Asian market increased by 7.7% in 2014 compared to 6.99% in 2013 while
COMESA market had biggest drop from 8.74% in 2013 to 5.7% in 2014. The EAC
market also dropped from 3.58% in 2013 to 1.5% in 2014 (EPZA, 2014). This could
be interpreted to mean that Kenyan EPZs seem to move out of the EAC and
COMESA markets as these are gradually transforming into domestic markets with
eroded incentives. This concurs with Wells and Wint (2000) who found that
investment promotion programme attracted investors to a country if it focused on
export – oriented production and not domestic market.
Domestic expenditure (backward linkage) increased by 8.8% from KSh.19.3 billion in
2013 to KSh.21.0 billion in 2014. The expenditure translates to an average monthly
contribution of Kshs.1.8 billion to the economy by EPZ firms in the year 2014
compared to Ksh.1.7 billion in 2013. These resources go to the local supply of raw
materials, payment of local workers’ salaries, power/electricity, telecommunication,
water, rent and transportation among others thus stimulating demand and growth of
the domestic economy. Meanwhile, imports also increased by 7.5 % from 27.4 billion
in 2013 to Ksh 29.5 billion in 2014 reflecting increase of activity within the zones
due to demand for EPZ goods in foreign markets (EPZA, 2014).

13
Literature from a number of EPZA annual reports indicate that the programme
contributes to the national economy. The performance of EPZ in the national
economy in the period 2011-2014 is shown in Table 1.2.
Table 1.2: EPZ Contribution to the National Economy: 2011— 2014
Indicator 2011 2012 2013 2014
Total Kenya Exports (Kshs Mill.) 512,604 517,847 502,287 537,236
Manufacturing sector Value of
Output (Kshs Mill.)
1,015,542 1,049,345 1,097,082 1,149,742
Indicator 2011 2012 2013 2014
GDP at market price (Kshs Mill.) 3,725,918 4,261,151 4,730,801 5,357,672
Total national employment
(number)
12,116,200 12,782,000
13,517,000 14,316,700
Manufacturing sector
employment (number)
271,500 277,900 283,000 287,456
Exports EPZ (Kshs. Mill.) 39,067 39,962 44,427 51,377
Total output EPZ (Kshs. Mill.) 42,442 44,273 50,294 57,192
Total Employment EPZ 32,043 35,501 39,961 46,221
EPZ contribution to total Kenya
Exports (%)
7.64 7.72 8.84 9.56
EPZ contribution to
manufacturing sector value of
output (%)
4.21 4.25 4.58 4.97
EPZ contribution to total national
employment (%)
0.28 0.28 0.30 0.32
EPZ contribution to
manufacturing sector
employment (%)
11.80 12.77 14.12 16.1
EPZ contribution to GDP;
constant prices (%)
1.14 1.04 1.06 1.07
Source: Economic Survey, 2015 and various reports of EPZA (2011 – 2014).
Table 1.2 shows that in the manufacturing sector, value of output in 2014 increased by
4.97% compared to 4.58% in 2013. Manufacturing sector employment was 16.1% in
2014 compared to 14.1% in 2013. Exports contribution increased to 9.56% in 2014
compared to 8.84% in 2013. EPZ contribution to GDP at constant prices had a
negligible increase from 1.06% in 2013 to 1.07% in 2014.
Various EPZA reports highlight a number of challenges in the management of the
programme. The major ones have been cited to be high cost of production, shortage of
raw material, frequent policy changes, unpredictable market factors and enlarged

14
domestic market that allows only 20% sale of annual production to the East African
countries of Kenya, Uganda, Rwanda, Burundi and Tanzania. The other challenges
regard high interest rates charged by local banks, intense competition, and the
uncertainty surrounding the existence of African Growth and Opportunity Act
(AGOA) of the USA which provides the single largest export market for the
programme.
Research Problem
Country marketing is a significant activity for economic development in relation to
investment attraction and employment creation. There are a number of promotional
techniques which countries apply to attract foreign direct investment (Wells & Wint,
2000) guided by theoretical underpinnings. This study is anchored on Heckscher-
Ohlin’s Theory of International Trade and related Theory of Location Advantage.
While Theory of International Trade is concerned with classical comparative cost and
the interdependence of marketing to societal environment, Theory of location
Advantage is concerned with competitive location factors. The two theories define
factors that create competitiveness of countries for promotion of FDI attraction.
Perceived value of investment promotion incentives as factors of location
competitiveness have been considered to have significant contribution to the
performance of firms in the EPZs. These incentives are compensated by returns on
economy wide activities through trade expansion, macro-economic and exchange rate
reforms, foreign exchange earnings, job creation, technology transfers and human
capital development (Madani, 1999). This study aims to further the knowledge on the
country marketing concept in advancing promotion of a country as an investment
destination building on the Hecksher-Ohlin’s theory and theory of location advantage.
The EPZ concept is a marketing function whose performance is affected by a number
of environmental variables. Country marketing activities cost huge sums of money
and yet there has not been empirical concurrence on the accrued benefits to the host
countries. A number of studies have different views on the performance of EPZs as
country marketing policy instrument (Jenkins, 2005; LaRRI, 2000; Wells & Wint,
2000).

15
Investment promotion incentives are country marketing instruments packaged to
create location competitiveness through marketing mix, screening, monitoring and
intervening in FDI (Wells & Wint, 2000). Although the role of investment promotion
incentives in country marketing has not been adequately studied in Kenya, the costs of
these incentives are evaluated from the perspective of revenue foregone. The benefits
to host economy may be measured through firm performance in terms of employment
creation, foreign exchange earnings, forward/backward linkages and technology/skill
transfers. Studies however, show that returns on these incentives to the host countries
have faced challenges in meeting conceptual expectations (LaRRI, 2000). These
challenges suggest that performance of firms in the EPZs that enjoy the incentive
packages do not compare favourably with the perceived value of the incentives
offered by host countries.
Other studies have shown that even with investment promotion incentives offered, a
host country needs to create favourable macro-marketing environment for the location
to be competitive (Engman, Onodera & Pinali, 2007; Akhtar, 2003, Wells & Wint,
2000;) and firms should have supportive organizational characteristics (age, size and
ownership) for effective performance (Ibrahim & Shah, 2012). A study by Wei,
Samiee and Lee (2013) found no effect of firm age on firm performance while firm
size had marginal effect. But Mayende (2013) found contrary results indicating that
firm age had positive effect on firm performance. His study further indicated that firm
size influenced the increase in firm performance. Akhtar (2003) found out that
legislation, political climate, good infrastructure and stable fiscal policies had
significant impact of performance of EPZs. The nature of ownership patterns was
affected by various factors including incentives the host country offers, local
partnership scope, legislation and market opportunities (ibid. p.933). Macro-
marketing environment and organizational characteristics thus moderate the
relationship between perceived value of investment promotion incentives and firm
performance. The host country may forego revenue when offering investment
promotion incentives but with unfavourable macro-marketing environment which
negatively impacts on the firm performance, it may not achieve the development
objective of the EPZ programme. Given the differing findings from various studies,
there is need for empirical study to establish the relationship based on the Kenyan
environment.

16
Several empirical studies on EPZs have focused on economic justification excluding
the marketing aspects of investment promotion incentives. Yang, Wang, Chen and
Yuan (2011) used factor endowments, governance, incentive policies and
infrastructure as variables affecting firm performance. Performance has largely been
measured from the perspective of investors and management based on financial and
operational indicators such as return on investment, efficiency, sales growth,
relevance among other balanced score card instruments (Namada, Aosa, Awino &
Wainaina, 2014; Machuki, Aosa & Letting’, 2012; Kennerley & Neely, 2003; Kaplan
& Norton, 1992). Few studies have used foreign exchange earnings, local employee
taxes, employment creation, linkages and technology transfer as performance
indicators from the perspective of the host country offering the incentives (Angko,
2014; Aggarwal, 2007; Jenkins, 2005). In analysis of the performance of export
processing zones in Ghana, Angko (2014) used export volumes, value addition (net
foreign exchange earnings), and employment creation as variables to measure firm
performance. Jenkins (2005) reviewed policy instruments for diversification of host
nation’s exports while researching on economic and social effects of EPZs in Costa
Rica. The study focused on employment, backward linkages and incentives but did
not embrace country marketing concept which is the promotional motive that drives
countries to establish EPZs (Wells & Wint, 2000). Current study focused on
marketing concept of EPZs. The methodological gap the current study intended to
address is the application of performance measurement from the perspective of host
country that focuses on employment creation, backward linkages, technology/skills
transfer and foreign exchange earnings in consistence with Anko (2014).
Kenyan EPZ programme was part of government initiative to substantively liberalize
the economy putting in place reform measures aimed at developing trade and
investment. The EPZs provide international standard industrial and business
infrastructure such as factory buildings, warehouses, serviced land, office space,
utilities and twenty-hour security and custom services. Activities allowed in the zones
include export oriented manufacturing or processing, commercial activities and export
services (EPZ Act, 1990).
EPZ programme has however, attracted criticism over its viability and relevance to
the host economy as it is often considered sub-optimal policy benefitting a few and

17
distorts resource allocation (Engman, Onodera & Pinali, 2007; LaRRI, 2000). In
contrast, Jayanthakumaran (2003) carrying out a benefit-cost analysis based on S.
Korea, Malaysia, Sri Lanka, China and Indonesia concluded that EPZs make positive
economic impact for the citizens of a host country. In these countries, the research
showed that the EPZs were economically efficient and generated returns far above the
estimated opportunity cost.
In Kenya, amendments to the EPZ Act over time have introduced exclusion of
commercial activities from income tax holidays, and disallowing of parallel
commercial and manufacturing activities by single enterprise (EPZA, 2012). A duty
surcharge of 2.5% over and above payable taxes has been imposed on goods sold into
the domestic market with the approval of the minister responsible for industry. These
provisions have eroded the perceived positive effect of the incentives offered to the
investors in the programme. The EPZA annual report for 2013 indicates a number of
challenges influencing the performance of EPZ firms thus reducing the
competitiveness of the programme in attracting FDI. The report cites high cost of
energy, port congestion, enlarged East African Community (EAC) as domestic
market, unpredictable market factors especially on the doubts over AGOA extension
and high cost of transportation and other utilities (EPZA, 2013). With contrasting
views over EPZs viability, challenges and constraints, empirical investigation into the
performance of the Kenyan EPZ firms with special incentives could provide
knowledge for policy decision on the incentives whose perceived value continue to
draw mixed reactions from scholars and policy makers.
Holistic concept of firm performance presupposes the interaction of variables that
jointly contribute to the results. Performance being a multidimensional construct, this
study intended to establish and contribute to the understanding of the joint influence
of perceived value of investment promotion incentives, organizational characteristics
and macro-marketing environment on firm performance. The research question
addressed by this study, was therefore: To what extent do perceived value of
investment promotion incentives, organizational characteristics and macro-marketing
environment influence performance of Export Processing Zone firms in Kenya?
18
Research Objectives
The broad objective of the study was to establish the influence of perceived value of
investment promotion incentives, organizational characteristics and macro-marketing
environment on performance of firms in the EPZs in Kenya.
The specific objectives of the study were to:
i) Determine the influence of perceived value of investment promotion
incentives on firm performance.
ii) Assess the extent to which organizational characteristics influence firm
performance.
iii) Establish the extent to which macro-marketing environment influences firm
performance.
iv) Examine the effect of macro-marketing environment on the relationship
between perceived value of investment promotion incentives and firm
performance.
v) Determine the extent to which organizational characteristics affect the
relationship between perceived value of investment promotion incentives and
firm performance.
vi) Examine the extent to which perceived value of investment promotion
incentives, organizational characteristics and macro-marketing environment
jointly influence firm performance.
Value of the Study
The results of the study will add value to theory building in regard to country
marketing through offering of investment promotion incentives. The academia will
benefit from this study through theory contribution. This study advanced the role of
country marketing concept in promoting a country as investment destination using
attractive incentives. The study was to establish any structural or environmental
weaknesses affecting performance of the firms despite the incentives provided taking
cognizance of inadequacy in the area of study. It therefore intended to empirically
contribute to more knowledge in the subject and open up further frontier of research

19
on specialized economic programmes like EPZs based on the theories of international
trade, location advantage and country marketing concept.
Policy makers will benefit from the study as it will be useful as a guide in the review
or formulation of investment promotion incentive policies for country marketing.
They will appreciate the state and effect of the existing incentives and other variables
in the study in attracting investments. The findings of the study will contribute to the
development of suitable incentive policies for investment promotion to attract more
FDI.
Investors in the EPZ program in Kenya will benefit from the study outcome by better
assessment of their investments against the concessions given under the programme.
This will assist them in reviewing their investment portfolio in Kenya based on the
empirical outcome of the study.
Marketing practitioners charged with responsibility to promote the EPZ programme in
Kenya will use the results of the current study to develop the strategies necessary in
achieving superior performance in their firms. This will further enhance contribution
of the programme to economic development.
1.5 Structure of the Thesis
This study is organized into five chapters. Chapter one deals with introduction to the
study giving its background, relevant theories and description of variables. The
chapter also discusses the research problem motivating the study, research objectives
and value of the study.
Chapter two presents theoretical and empirical foundations of the study through
literature review. Theories guiding the study are Heckscher-Ohlin’s Theory of
International trade, Macro-marketing Theory, Theory of Location Advantages,
Cluster Theory and Eclectic Theory of Foreign Direct Investments. The study
variables reviewed in the chapter include discussion on the relationship between
perceived value of investment promotion incentives (as predictor variable);
organizational characteristics; macro-marketing environment; (moderating variables)
and firm performance (as dependent variable). It summarises the knowledge gaps in

20
the reviewed literature, proposes conceptual framework designs conceptual model,
and develops research hypothesis for the study.
Chapter three presents research methodology. This comprises the research
philosophy, design, population, data collection and tests of reliability and validity.
The chapter also provides operationalization of study variables and data analysis
methods with full summary of objectives, hypothesis, analysis techniques, model
estimation and interpretation of results.
Chapter four covers data analysis and presentation of results. Results of demographic
profiles are presented in the first part of the analysis where descriptive analysis of data
sets related to demography of the respondents and firms is carried out. The variables
are cross tabulated and graphical presentations given using frequencies, percentages
and bar charts among others. The next parts of the analysis deal with descriptive
statistics of items and tests of hypothesis on the relationships of the study variables. It
also presents research findings based on the objectives and hypotheses. The
discussion on the findings takes into consideration the empirical studies reviewed in
order to establish areas of convergence or divergence with the results.
Chapter five summarizes, concludes and recommends actions on findings of the
study. It highlights the implications of the study to policy makers, academicians,
practitioners and the general stakeholders. The chapter gives the limitations faced
during the study and offers suggestions for future areas of research.

21
CHAPTER TWO: LITERATURE REVIEW
Introduction
The chapter discusses the theoretical foundation and empirical literature, research
variables and their relationships. It also reviews the knowledge gaps, designs
conceptual model and the research hypotheses.
Theoretical Foundation of the Study
This study focuses on country marketing concept and five theoretical approaches
related to international trade, marketing and investment promotion. The theories
underscore the fundamentals of location and competitive advantage in marketing a
country. This is in the context of investment location offering specialized incentives
for optimal Firm Performance. Theories related to international trade and marketing
have undergone several refinements. Heckscher – Ohlin’s Theory of International
Trade is an improvement of Ricardian Comparative Advantage theory. It is also
known as Modern Theory of International Trade or General Equilibrium Theory of
International Trade. The anchoring theory for the study is Heckscher-Ohlin’s Theory
of International Trade. Other theories guiding the study include Macro-Marketing
Theory, Theory of Location Advantages, Cluster Theory, and Eclectic Theory of FDI.
2.2.1 Heckscher-Ohlin’s Theory of International Trade
This is the anchoring theory of the study. It advances further the classical comparative
cost theory recognizing the interdependence of marketing to the societal environment
in which it is operating, including the bounds of economic feasibility. Bartels (1968)
argues that separation of producers and consumers requires a country to develop
attractive incentives to promote its location to foreign investors. He argues that
provision of investment incentives by a country is a physical and social process that
involves human or national behaviour affected by various socio-economic
considerations.
Sit (1985) posits that the change in technology and development approach of Multi-
national Corporations (MNCs) and growing differentials in labour costs in different
locations contribute to comparative factor advantages thus motivating manufacturing
off shore. International Trade Theory explains that the differences in factor

22
endowments of different countries and different factor proportions needed for
producing different commodities account for the difference in comparative costs
(Ahuja, 2010). Investments in EPZs move to regions with affordable and competitive
production factors (Yang et al., 2011).These may include low production costs, low
policy risks, less capital movement restrictions, well developed hard and soft
infrastructure. These considerations underpin the core function of marketing. The
ability for a country to promote itself by providing competitive investment incentives
triggers the power of marketing among nations to compete for investment resources
generated from various locations.
In the Kenyan context, EPZs have been used as incentive package to market the
country as an investment destination. The firms in the program have largely depended
on the incentives provided by the government. This study investigates the influence of
the incentives in firm performance and draws statistical conclusions based on this
theory.
2.2.2 Macro-marketing Theory
Hunt (1991) advanced the Macro-Marketing Theory in his three dichotomies model
suggesting that marketing has impact on society and society has impact on marketing
systems. The model discusses marketing problem from profit/non-profit,
positive/normative and macro- / micro- perspectives and their effects on societies
based on objectives to be achieved. At macro-level, international marketing provides
a country with an opportunity to generate economic gains, improve productivity and
enhance overall quality of life. At micro-level, international marketing enables
individual enterprises to grow, achieve competitive edge and improve performance.
Wells and Wint (2000) argue that marketing a country starts in a sequential strategy.
It is an attempt to build the country image before undertaking investment generation
and service activities that include the use of incentives, investment and trade
promotion programmes.
From the context of seven Ps of marketing mix, Wells and Wint (2000) postulate that
country marketing is a holistic marketing mix concept. The country is the product
through its intrinsic advantages and disadvantages as an investment location. Price of
investment attraction is the foregone revenue, which is the perceived value of
investment incentives. These are made of tax incentives, grants, tariff protection and

23
other cost incentive mechanisms offered to attract investment. Promotion mix in
country marketing refers to communication to create an image, publication, and
dissemination of information on services available to the investor in the country (ibid.
p.4). Place mix refers to sales destination through distribution to domestic or
international markets. People mix is the public relation activity that defines the
conduct of country promotion agencies and governmental officials towards investors
who are the customers and suppliers of FDI. Process mix is the value of reliable
quality service offered in terms of policy and legal predictability, conformity and
sustainability. Finally, physical evidence in the marketing mix refers to packaging of
the service in terms of presentation by staff and the service offered in the country.
Macro-marketing theory is relevant to the country’s holistic macro-marketing
environment, which provides overall medium for market players to interact. The firms
in the EPZs depend on the environment they operate in for their performance. This
theory recognizes the role of society, investors and the market in achieving optimal
firm performance. The theory is important to this study as it explains holistic
marketing from incentive provision, investment, production, to societal and
organizational interventions thus providing theoretical foundation to country
marketing concept.
2.2.3 Theory of Location Advantage
The theory postulates that location factors influence investment decisions of multi-
national corporations. The fulfillment of the provisions of location advantage theory is
significant to this study as it explains the favorable conditions for FDI attraction that
influences firm performance. Engman, Onodera and Pinali (2007) emphasize choice
of location as critical for investor attraction and performance of EPZ firms. They
point out that access to local suppliers is important in promoting technology transfers
into the domestic enterprises.
Yang et al. (2011) refer to location advantages as favorable conditions offered by host
countries to attract investments. The advantages are categorized as natural or inherent
location advantage denoting proximity to major markets, abundant natural resources,
and cheap and high - quality production factors. Acquired location advantages
comprise infrastructure such as transport, communication, and public service. The
third aspect is institutional location advantage, which includes preferential tax

24
policies, land acquisition policies, government regulation and adjustments as well as
financial climate and system. The last category is other location advantages like
similarities in culture, language, and business modes. Similarities in culture, language
and business practice are social environmental factors that may encourage and
influence business location. The presence of these advantages influences the investor
in making favorable investment decision about a location.
In the Kenyan context, the promotion of EPZ program has been considered along the
development of favorable procedural and infrastructural facilities that meet world
standards. This study investigates the influence that these incentives, based on the
location advantage theory, contribute to the performance of firms in the Kenyan
EPZs.
2.2.4 Cluster Theory
Cluster theory is a spatial concept defining geographic concentrations of
interconnected companies, each of which have distinct development features,
principles and problems within proximity. They are concentration of firms within a
certain industry (UNCTAD, 1998; Hollensen, 2007). Clusters are categorized into
informal, organized, innovative, technology parks and incubators, and export
processing zones (UNCTAD, 1998). They are characterized by network of relations
with suppliers and competitors. EPZs like industrial parks, technology parks and
incubators are typical forms of clustering where concentration of industrial activities
are able to gain from economies of scale.
China, India and Singapore among other countries have used the cluster approach in
the development of their SEZs. China has been able to attract multinational
companies, which have established offshore manufacturing facilities in the country.
The theory is significant to this study in appreciating the benefits clustering offers to
a location in terms of employment and services concentration thus creating growth
centers. These isolated enclaves have been concentrated in major business sites across
the country. More concentrations are in Mombasa, Nairobi and Machakos counties.
Clustering supports experience sharing for enhanced Firm Performance.

25
2.2.5 Eclectic Theory of Foreign Direct Investment
Foreign Direct investment (FDI) is investment in physical capital, which enhances
opportunities in job creation, high productivity, competitiveness and technology
spillovers (Denisia, 2010). It is a form of capital flows moving from country of origin
to host country. FDI promotes entry into international markets through exports.
Eclectic theory contributes to the understanding of causes of decision and movement
of FDI at both macro and micro levels using ownership advantages, location
advantages and internalization. The three factors are commonly referred to as OLI
(Ownership, Location and Internalization). The theory is a holistic and context
specific framework for analyzing FDI determinants (Denisia, 2010).
The theory is useful in this study in defining the determinants of FDI and underlying
intention of investors in establishing offshore production locations. It is linked to the
theories that are related to location advantages. The main purpose of country
marketing is to attract FDI to a host country for economic development. This study
investigates how the incentives offered by Kenya influences the inflow of FDI and the
performance of firms in the EPZs.
Perceived Value of Investment Promotion Incentives and Firm
Performance
Investment promotion is an activity that significantly influences FDI flows into a
country. It involves giving information to potential investors, exhibiting attractive
country image as an investment destination, and providing services to prospective and
existing investors (Wells & Wint, 2000). A study by Yang et al. (2011) conducted in
China, Vietnam, Myanmar and Laos revealed that perceived importance of investment
incentive policies is dependent on the regions where the firms invest.
While some firms would prefer resources and low cost production incentives, others
would go for infrastructure, preferential tax and land use policies. Besides natural
resources, management and other factors, performance of a firm is influenced by
incentive policies. In order to improve performance, incentive policies need to be
specifically designed to the industry (Wells & Wint, 2000). Costa Rica offers
differentiated incentives according to regions ranging from 50% to 100% tax
exemption for different periods of time (Jenkins, 2005). As a result of the incentives

26
offered, Costa Rica was able to improve performance of her EPZ firms. EPZ exports
rose from 8% in 1989 to 47% in 2011. Mayende (2013) found out that firms with tax
incentives performed better in terms of gross sales and value addition than those that
did not have the incentives. According to the study, Uganda offered exemptions to
investors on import duties and sales taxes, drawback of duties and sales tax payable
on imported inputs used in producing goods for exports. Uganda also issued
certificates of incentives and offered easy access of credit facilities to foreign
investors. Mayende (2013) argues that firms offered tax incentives were more
productive in relation to output and value added than the ones without such facility.
Engman, Onodera and Pinali (2007) however, argue that financial and other
incentives given to foreign investors may be necessary for only a short term because
of revenue implications to government hence should not substitute for policy
measures towards sound investment environment. They posit that incentives should
be minimal and time bound because long-term commitment may create equity
problems through discrimination of a non-EPZ against an EPZ company yet both are
equally important to the host economy.
In a study of economic impact of SEZs in China, Wang (2010) concludes that
incentive policies affecting firm performance are preferential tax system, land use,
financial support, labour use and investment facilitation policies. Ghana offers fiscal
and non-fiscal incentives comprising tax holidays, 100% duty exemptions, equal
rights to foreign investors, investment guarantees among others (Angko, 2014).The
decision on investment is also affected by characteristics and stage of development of
the organization. At early stage, a firm may prefer incentive policies that reduce the
cost of investment expenditure while at the expansion stage, incentives associated
with profits and taxes are preferred (Yang et al., 2011). Firms in the manufacturing
sector prefer incentives that relate to asset depreciation due to large investment scale
on fixed assets. Investors without local investment resources are more inclined to
start-up grants and financial support offered by government rather than tax holidays.
The empirical literature reviewed indicates that perceived value of investment
promotion incentives influences the performance of EPZ firms. The current study
intended to determine the influence of promotion incentives on firm performance in

27
the Kenyan EPZ firm. It draws empirical evidence on the relationship between the
two variables based on theories of international trade and location advantage.
Organizational Characteristics and Firm Performance
Organizational characteristics affect performance in terms of financial market
outcomes or profitability, which in turn, in the case of EPZ may generate
employment, foreign exchange earnings, capital stock increment (investments),
backward/forward linkages and technology/skill transfer. Katou and Budhwar (2009)
argue that the intensity of the interface between organizational characteristics and
firm performance are dependent on the operational model. The model may involve the
business strategies, and human resource management policies. The outcome of the
interface can be affected by management style, organizational culture and reverse
causation, which are controlled by size of the firm, capital intensity, age, degree of
staff unionization and the industry to which the firm belongs. Namada (2013)
proposes need for right configuration of strategic planning systems to improve
performance.
Culture management skills are critical in recognizing and nurturing the organizational
characteristics to obtain sustained above normal performance. Aggarwal (2007)
proposes that incentive-based compensation plans are central to Firm Performance.
These are offered through bonuses, rewards, work place innovations like career
growth graph or performance - development graph to employees. In a study carried
out in Taiwan by Ling (2011) on the influence of intellectual capital on Firm
Performance, it was found out that human capital, structural capital and relational
capital had direct positive impacts on a firm’s agility and innovation (non-financial
performance). But structural capital had a direct positive impact on the firm’s
financial performance. Ling (2011) defines structural capital to comprise of structures
and systems of the organization; human capital to comprise of employees while
relational capital is the organization’s positive relationship with suppliers and
customers. The three components define what he terms in the study as intellectual
capital which was conceptualized as the capability of an enterprise to create value in
the global market under conditions of constant change.
28
Macro-marketing Environment and Firm Performance
A number of environmental factors influence firm performance such as frequent
changes in government policy, political stability, economic management, country’s
attitude towards foreign investments, political relationship with the rest of the world
and attitude towards foreign personnel (Hollensen, 2007). Radelet (2004) suggests
economic environment as policies that involve adjusting and managing the exchange
rate to establish and maintain the profitability of export industries; keeping domestic
inflation under control through prudent fiscal and monetary policies; reducing import
tariffs and removing import quotas for exporters on capital and intermediate goods.
Economic environment is determined by strengthening of efficient administrative
systems especially customs administration; stable, predictable fiscal, legislative and
procedural policies. Njeru (2013) in her study on market orientation, marketing
practices, firm characteristics and external environmental factors observed that there
was positive and statistically significant relationship between external environmental
factors and firm performance of tour firms in Kenya.
Understanding the social environment in terms of cultural values and norms, and
embracing the principle of freedom of association may improve industrial relations
and performance. Appropriate education and training to provide the workforce with
basic skills enhances human capital productivity and improves the rate of technology
uptake and skills development (Aggarwal, 2007; Engman, Onodera & Pinali, 2007;
Jenkins, 2005).
Even though one of the objectives of FDI is to transfer technology to the host
economy, the investor would be attracted to a location with some level of
technological knowhow and uptake potential. Investment locations with technology
access such as internet, telephony, computer knowledge, infrastructure, digital high-
resolution cameras and televisions are considered attractive to investors. Sustained
competitiveness and firm performance in currently globalizing economy require
continuous improvement in product, process, technology and organization (Aggarwal,
2007).
Ecological environment preservation has become a challenge to many firms due to
high demand by society for environmentally friendly products. Fraj-Andres,
Martinez-Salinas and Matute-Vallejo (2009) observe that investing in environmental

29
initiatives affects firm performance positively. They posit that investing in reduction
of environmental impact has positive relationship with organizational productivity
and economic system sustainability. Firms can achieve competitiveness through
design, development and commercialization of green products, which have
increasingly become popular with ever-growing health conscious society. But Nilsson
(2008) in his study examining the impact of pro-social attitudes and perceived
financial performance on socially responsible investments (SRI) behaviour opines that
consumer skepticism about green products and green marketing is on the increase.
Consumers have credibility issues with green labeling, packaging and products.
Marketers of pro-social products are therefore increasingly facing problems with the
credibility of the green claims made in advertising and on packaging (Nilsson, 2008).
Fraj-Andres, Martinez-Salinas and Matute-Vallejo (2009) argue that adopting
environmental values in organizational culture is not enough to develop a good
reputation in the market place, hence the commitment must be translated into specific
strategies for the concerned stakeholders to identify and value. Environmental
orientation must therefore, be accompanied by environmental transformation in the
operation and commercial systems so that organizations can be able to improve their
competitiveness (ibid. p.281).
Macro-marketing environment is a critical variable in the performance of firms in the
EPZs. Most businesses are sensitive to the operating environment. Bad politics and
unfavorable economic policies among other unfavorable conditions can drive away
current and potential investors. Kenya therefore needs to formulate and create
conducive environment for business to thrive. This study looks at the effectiveness
and challenges of the macro-marketing environment in Kenya based on Macro-
marketing theory and Eclectic theory of foreign direct investment. It therefore
establishes the extent to which macro-marketing environment influences firm
performance.
Perceived Value of Investment Promotion Incentives, Macro-marketing
Environment and Firm Performance
Quality of labor, efficiency of the regulatory authority and the possibility of industrial
linkages with the domestic economy largely influence firm performance (Sit, 1985).
These factors may be constrained by location and local business environment.

30
Macro-marketing environment in industrialized countries has become challenging for
most firms so that favorable investment promotion incentives in developing countries
tend to compete favorably for the FDIs from developed countries. But this has
ecological degradation concern. Frey (2003) observes lack of accepted factual or
methodological basis for identifying, estimating and valuing the costs and benefits of
ecological degradation. Jenkins (2005) gives Costa Rican experience with policy and
location incentives that led to attraction of investments into the EPZs in the country.
In Costa Rica, incentives offered included tax concessions, duty free concessions, and
streamlined import / export procedures in her EPZs. Yang et al. (2011) opine that
performance of EPZ firms are significantly affected by the investment climate
comprising resource availability, infrastructure, governance, geographical location,
market potential and political/legal stability. They further propose that preferential tax
policy may have close relationship with the probability that firms will invest for
resource-seeking purposes and improve firm performance. However, LaRRI (2000)
maintains that promotion policies for the attraction and performance of EPZ firms
should not dilute the quality of the environment and labour standards. Yang et al
(2011) consider factors investors look for to decide on investment location as being
predictable and non-discriminatory with stable macro-economic environment that
allow for engagement in international trade.
Promotion incentives offered by a host country to the EPZ program may achieve good
results in terms of firm performance when the macro-marketing environment is
conducive. This study investigates the effect that both promotion incentives and
macro-marketing environment have on the performance of firms in the Kenyan EPZs.
Perceived Value of Investment Promotion Incentives, Organizational
Characteristics and Firm Performance
Bontis (2001) argues that intellectual capital measurement practically explains the
organizational characteristics that interplay with firm performance. This is a
combination of market, human-centred, intellectual property and infrastructure assets.
Investment promotion incentives may therefore be successful when a host country
attracts investments from firms with strong organizational characteristics but which
are adaptable to its environment. Yang et al. (2011) argue that firms’ decisions on
investment are affected by their characteristics and stage of development. At early
31
stage they prefer incentive policies that reduce the cost of investment expenditure
while at the expansion stage, they prefer incentives associated with profits and tax.
Previous studies (Barney, 1986; Jones, 2010; Ibrahim & Shah, 2012) show that
organizational structure, design and culture have influence on the Firm Performance.
A study in Malaysia by Ibrahim and Shah (2012) investigating how organizational
characteristics variables influence the implementation of strategic human resource
practices found that firm performance is influenced by firm’s country of origin,
ownership, age, and size. Wei, Samiee and Lee (2013) posit that organic
organizational culture has influence on the performance of enterprises in the emerging
markets. Organic organizational culture is dominated by adhocracy and clannism that
encourage quick decision-making and innovativeness hence creating competitive
advantage in the performance of an enterprise. They argue in their thesis that
mechanistic organizational culture common in the developed economies is
hierarchical and market based creating heavy bureaucracy with slow decision-making
process. This affects competitiveness in certain industries. The study used firm age
and size as these have potential influence on the performance. Age was measured by
length of period the firm has been in operation while size was based on the number of
employees in the firm. Ndungu (2013) describes success in highly competitive
markets as requiring business leaders that create organizational climate that allows
employees to apply innovative thinking continually to provide solutions to customers
faster than competitors.
The study used size, age and ownership to assess the strength of organizational
characteristics in moderating the relationship between perceived value of investment
promotion incentives and performance of firms in the EPZs in Kenya.
2.8 Perceived Value of Investment Promotion Incentives, Organizational
Characteristics, Macro-marketing Environment and Firm Performance
An attractive investment location provides macro-marketing environment that is
predictable, with clear procedures and business operations backed by law where
dispensation of justice is quick and transparent. This is necessary to avoid risks
related to ownership, operation and transfer applicable through import restrictions,
local-content laws, exchange controls, market control, price controls, tax controls and
labor restrictions (Hollensen, 2007). A number of studies on foreign investment

32
decision process indicate that political stability is a major factor in an investor’s
choice to invest or not in a particular country (Wint & Wells, 2000). The aim of
policies for attracting FDI is to provide investors with an environment to conduct
business profitably and without incurring unnecessary risks (ibid. p.5). Akhtar (2003)
proposes that performance of an EPZ requires availability of sub-contracting
facilities, raw materials, affordable labour with less industrial disputes. These factors
add up to create location advantages and firm competitiveness for enhanced
profitability. An evaluation of an EPZ programme in Pakistan revealed that the
program had potential to improve human capital development through on training and
transfer of skills thus contributing to social welfare (Akhtar, 2003). The study also
found out that successful performance is also dependent on the existence of lowest
risks, liberal foreign exchange regime, stable currency, transparency in regulatory
policies.
In a study of tour firms in Kenya, Njeru (2013) found out that different market
orientation components interact with diverse external environmental factors,
marketing practices and firm characteristics in facilitating superior firm performance.
Analysis of industry dynamics, macro-marketing environment and competition
intensity is important for strategic decision making by the firm to ensure improved
firm performance (ibid. p.133).
The current study looks at the joint influence of perceived value of investment
promotion incentives, organizational characteristics and macro-marketing
environment has on the performance of firms in the Kenyan EPZs.
Summary of Knowledge Gaps
Previous studies on performance of EPZ firms affected by the type of investment
promotion incentives are limited. Several studies have mainly investigated
performance from the perspective of the investor. The impact of performance has
therefore been on the effects of generic variables including external environment and
organizational characteristics on specific factors such as infrastructure, social effects,
employment, poverty, knowledge and human development. Table 2.1 presents the
summary of knowledge gaps.

33
Table 2.1: Summary of Knowledge Gaps
Study by
Focus Main Findings Methodology and Context Comments or Knowledge gap Focus of the study
Angko
(2014)
Analysis of the
Performance of
Export
Processing
Zones in Ghana
-free zone exports not
consistent with overall
increase in national
exports
-need for coordinated
package of incentives,
infrastructure & services
that can attract foreign
investors
-Performance affected by
attitude & culture
-Data collection method
applied quantitative &
qualitative. Random &
purposive sampling used.
Simple estimation & analysis
method used to analyse
export performance
-Concept & context of Ghana
experience : exports & value
addition
The study focuses on EPZs as
economic development policies.
No marketing role recognized.
Country marketing concept is
lacking.
-Research methodology not
clear
This study linked the
factors affecting EPZ firm
performance: macro-
marketing environment,
organizational
characteristics and
perceived value of
investment incentives.
Based on country
marketing concept, the
study used whole
population.
Namada
(2013)
Influence of
strategic
planning
systems,
organizational
learning and
strategy
implementation
on performance
of firms in the
EPZ in Kenya
-Planning resources
significantly influence
performance
- Management
participation significantly
influence internal business
process but not return on
investment, sales growth,
and market.
Organizational learning is
significant mediator in
non-financial performance
-Cross sectional survey
-Descriptive statistics & tests
of hypothesis
-Use of regression analysis
-Context based on
performance of financial and
non-financial elements by
the Kenyan EPZ firms
-The study focused on human
resource elements: resources,
participation, & techniques
-Role of investment incentives
not included in the study
parameters
This study focused on
marketing aspect of
investment incentives&
how they may influence
Firm Performance
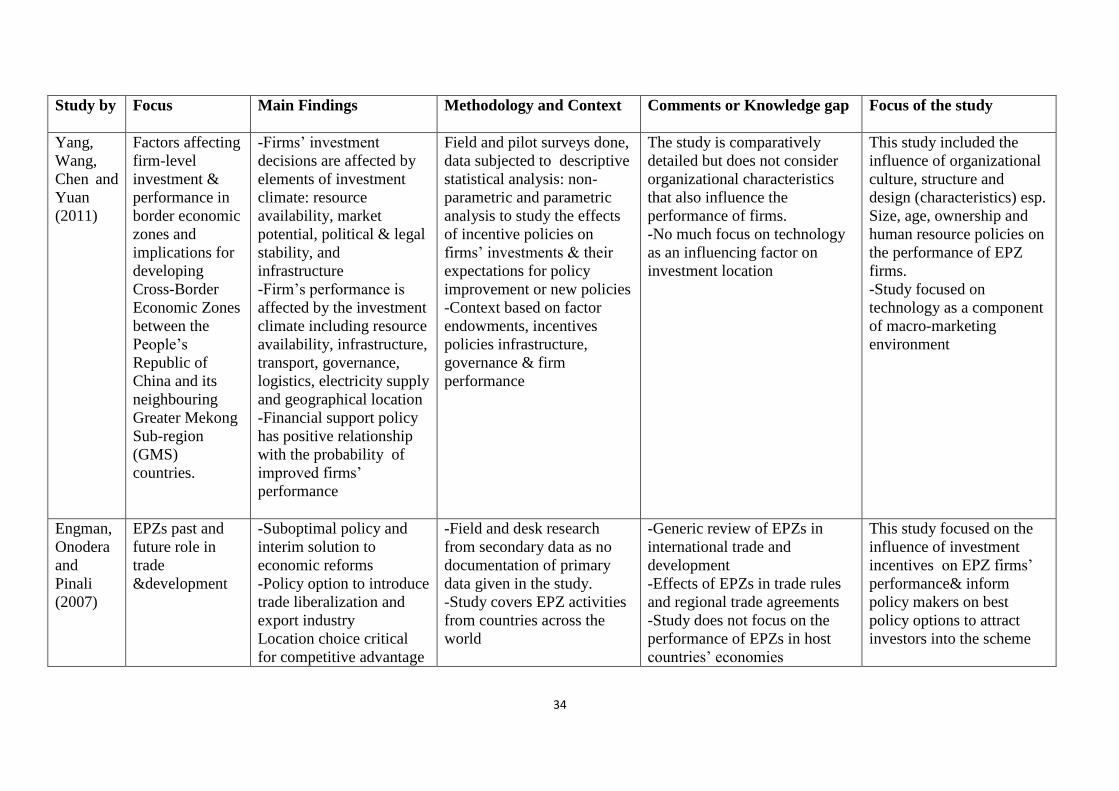
34
Study by
Focus Main Findings Methodology and Context Comments or Knowledge gap Focus of the study
Yang,
Wang,
Chen and
Yuan
(2011)
Factors affecting
firm-level
investment &
performance in
border economic
zones and
implications for
developing
Cross-Border
Economic Zones
between the
People’s
Republic of
China and its
neighbouring
Greater Mekong
Sub-region
(GMS)
countries.
-Firms’ investment
decisions are affected by
elements of investment
climate: resource
availability, market
potential, political & legal
stability, and
infrastructure
-Firm’s performance is
affected by the investment
climate including resource
availability, infrastructure,
transport, governance,
logistics, electricity supply
and geographical location
-Financial support policy
has positive relationship
with the probability of
improved firms’
performance
Field and pilot surveys done,
data subjected to descriptive
statistical analysis: non-
parametric and parametric
analysis to study the effects
of incentive policies on
firms’ investments & their
expectations for policy
improvement or new policies
-Context based on factor
endowments, incentives
policies infrastructure,
governance & firm
performance
The study is comparatively
detailed but does not consider
organizational characteristics
that also influence the
performance of firms.
-No much focus on technology
as an influencing factor on
investment location
This study included the
influence of organizational
culture, structure and
design (characteristics) esp.
Size, age, ownership and
human resource policies on
the performance of EPZ
firms.
-Study focused on
technology as a component
of macro-marketing
environment
Engman,
Onodera
and
Pinali
(2007)
EPZs past and
future role in
trade
&development
-Suboptimal policy and
interim solution to
economic reforms
-Policy option to introduce
trade liberalization and
export industry
Location choice critical
for competitive advantage
-Field and desk research
from secondary data as no
documentation of primary
data given in the study.
-Study covers EPZ activities
from countries across the
world
-Generic review of EPZs in
international trade and
development
-Effects of EPZs in trade rules
and regional trade agreements
-Study does not focus on the
performance of EPZs in host
countries’ economies
This study focused on the
influence of investment
incentives on EPZ firms’
performance& inform
policy makers on best
policy options to attract
investors into the scheme

35
Study by
Focus Main Findings Methodology and Context Comments or Knowledge gap Focus of the study
Jenkins
(2005)
Economic &
social effects of
EPZs in Costa
Rica
-EPZ is a policy
instrument for
diversification of host
nation’s exports.
- Helps attract foreign
investment
-Used econometric models to
examine estimations on
variables.
-EPZs as an industrial
composition diversification
policy
Focused on employment,
backward linkages and
incentives. No linkage to
marketing models or concepts.
This study contextualized
the relationship between
investment incentives and
the performance of EPZ
firms
Frey
(2003)
Globalization &
The
Environment:
The Transfer of
Core-based
Hazardous
Production
Processes To the
Export
Processing
Zones of the
Periphery: The
Maquiladora
Centers of
Northern Mexico
-Hazardous industries
damage to the
environment: spread of
diseases, explosions and
fires
-Risks due to limited
public awareness
-Lack of competent risk
assessment and
management capabilities,
irresponsive state agencies
-Hazardous industries
concentrated in rapidly
growing cities with
economic, social & health
risks
-Methodology not defined
-Study discusses behaviour
of transnational corporation
in transferring hazardous
products, production
processes and wastes to the
peripheral countries of the
world system with Mexico
EPZs (Maquiladora) as case
study
-Not based on methodological
research approach to study
- No conceptual model
explained
- No clear hypotheses
developed
-Mainly desk research
-This study investigated
ecological challenges of the
firms in the Kenyan EPZs

36
Study by
Focus Main Findings Methodology and Context Comments or Knowledge gap Focus of the study
Wells
and Wint
(2000)
Marketing a
Country
Promotion as a
Tool for
Attracting
Foreign
Investment
An efficient investment
promotion programme can
attract certain types of
investment to a country at
a cost that is significantly
less than the value of the
direct benefits the country
receives from the
investment.
- Country marketing
concept fits well
with the 7Ps of
marketing mix
- Export –oriented
investment
promotion attracts
more investors
-Data set of 50 industrial and
developing countries
Variables:
Independent
-Effective demand, Market
growth, BoP conditions,
Inflation, Political stability
and Investment Promotion.
Dependent:
–Foreign Direct Investment
-Used multiple regression
analysis
-Sample small at approximately
25% of total world nations
-Considered only one macro-
marketing environment element
in the variables (political
stability)
-No conceptual model
explained
-No clear hypotheses developed
-Study focused on all EPZ
operating firms in Kenya
-It considered macro-
marketing environment
wholly along with
organizational
characteristics as
moderating variables
-Independent variables
were perceived value of
investment promotion
incentives and dependent
variable was Firm
Performance
- developed clear
hypotheses and conceptual
model
Barney
(1986)
Organizational
Culture: Can it
be a source of
sustained
competitive
advantage?
-A firm’s culture can be a
source of sustainable
competitive advantage it is
valuable, rare, and
imperfectly imitable
-Performance may be a
reflection of the
organizational culture
-Review of the subject of
organizational culture
- No research methodology
defined
-Generic context of
organizational culture
-Key concepts discussed
-Review limited to only
relationship between
organizational culture and
sustained superior financial
performance.
-No discussion on non-financial
performance
-Study considered
organizational culture as
part of organizational
characteristics and its
influence on firm
performance both non-and
financial.
Source: Researcher, 2015

37
Conceptual Framework
The conceptual model (Figure 2.1) of this study is formulated on the basis of the
relationship between perceived value of investment promotion incentives as
independent variable and the performance of firms in the EPZs in Kenya as dependent
variable. The items comprising perceived value of investment promotion incentives
include foreign exchange rates, duty and tax exemptions, repatriation of capital and
profits. Others are Foreign exchange account maintenance, quota-free import of
capital and intermediate goods, land use policy and one-stop shop operations.
Macro-marketing environment is a moderating variable, which comprise political,
economic, social, technological, ecological and legal factors. Its interaction in the
model has three levels of influence on firm performance. Firstly, it modelled on direct
influence on Firm Performance. The second modelling as a moderating influence
between independent and dependent variables. Lastly, it modelled as having joint
influence with perceived value of investment incentives and organizational
characteristics on firm performance.
The other moderating variable are organizational characteristics. The items in the
variable are size, age and ownership. It also has different levels of interaction in the
model. The first is its direct influence on Firm Performance. Second interaction is the
moderating influence on the relationship between independent and dependent
variables. Finally, it has joint influence with macro-marketing environment and
perceived value of investment incentives on firm performance.
The model depicts how perceived value of investment promotion incentives, macro-
marketing environment and organizational characteristics either individually or jointly
influence firm performance. It further depicts how organizational characteristics and
macro-marketing environment moderate the relationship between perceived value of
investment promotion incentives and firm performance.

38
Figure 2.1: Conceptual Model
i)
Source: Researcher, 2015
H1
Dependent Variable
Independent Variable
Perceived Value of Investment
Promotion Incentives
Forex rates
Duty & tax exemptions
Repatriation of capital & Profits
Forex Account Maintenance
Quota-free import of capital &
intermediate goods
Land use policy
One-stop shop
H4 Moderating Variable
H5
Moderating Variable
Macro-Marketing Environment
Political, economic, social, technological,
ecological, legal
H6
H2
H3
Organizational Characteristics
Size
Age
Ownership
Firm Performance
Financial
Foreign exchange earnings
Local employee levies
Non-financial
Employment generation
Backward linkages
Technology/Skills transfer

39
Research Hypotheses
From the context of the study objectives, literature reviewed and the conceptual model
constructed, the following hypotheses have been developed to test the relationships
between the variables; perceived value of investment promotion incentives, and firm
performance moderated by organizational characteristics and macro-marketing
environment:
H1: Perceived value of investment promotion incentives have statistically significant
influence on firm performance.
H2: Organizational characteristics have statistically significant relationship with firm
performance.
H3: Macro-marketing environment has statistically significant relationship with firm
performance.
H4: Macro-marketing environment has statistically significant moderating effect on the
relationship between perceived value of investment promotion incentives and firm
performance.
H5: Organizational characteristics have statistically significant moderating effect on the
relationship between perceived value of investment promotion incentives and firm
performance.
H6: Perceived value of investment promotion incentives, organizational characteristics
and macro-marketing environment have statistically significant joint influence on
the firm performance.
The outcome of the tests from these hypotheses were used to derive conclusions from
the study. The strength and direction of relationships among variables from the
hypotheses testing defined the parameters of the research and policy recommendations
from the study.
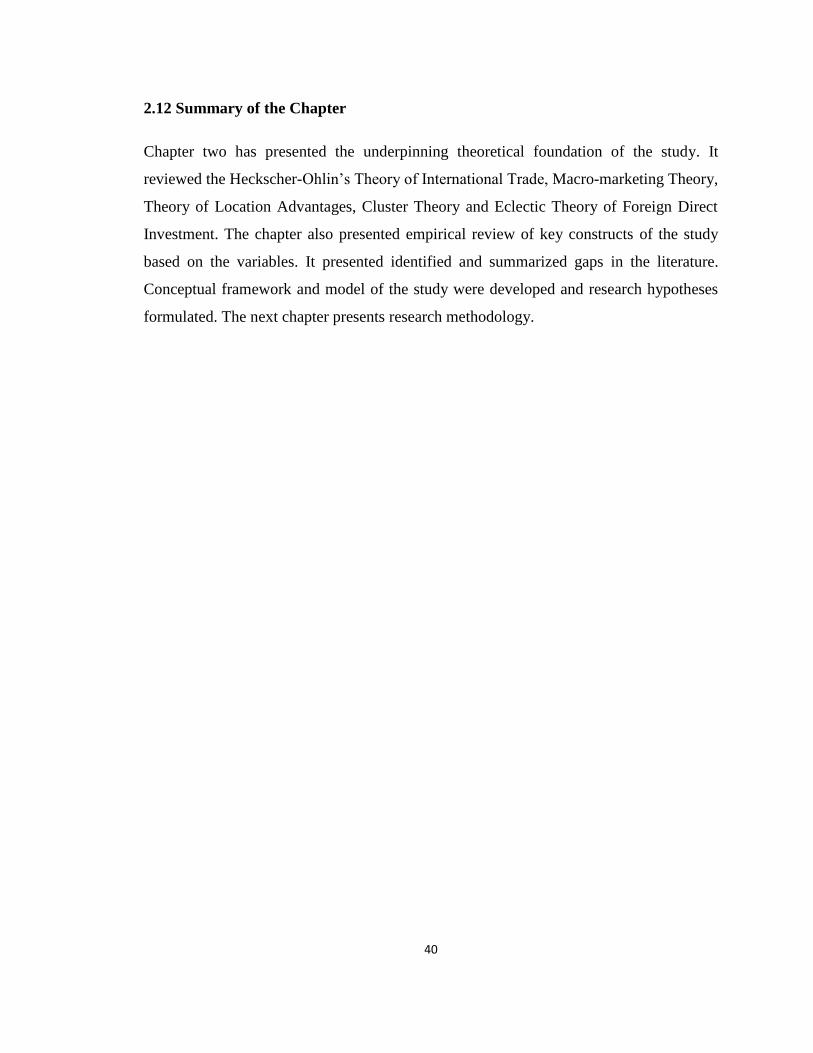
40
2.12 Summary of the Chapter
Chapter two has presented the underpinning theoretical foundation of the study. It
reviewed the Heckscher-Ohlin’s Theory of International Trade, Macro-marketing Theory,
Theory of Location Advantages, Cluster Theory and Eclectic Theory of Foreign Direct
Investment. The chapter also presented empirical review of key constructs of the study
based on the variables. It presented identified and summarized gaps in the literature.
Conceptual framework and model of the study were developed and research hypotheses
formulated. The next chapter presents research methodology.

41
CHAPTER THREE: RESEARCH METHODOLOGY
Introduction
The chapter discusses the methodology used in the study. It outlines the philosophy of the
study, the design, and the population. It also discusses the method employed in data
collection, the tests carried out in measuring the reliability and validity of the
instruments. The chapter further discusses the operationalization of the research variables
and presents a summary of the analytical models.
Research Philosophy
There are two fundamental research philosophies broadly viewed as subjectivist or
objectivist (Saunders, Lewis &Thornhill, 2009). The subjectivist in research philosophy
includes the phenomenologist whose work is based on qualitative, humanistic and
interpretivistic approach where the emphasis is on immediate experience using human
characteristics and holistic analysis. The method allows for natural and participatory
observation. In the objectivist category, there are the positivists whose research
philosophy is based on quantitative, experimental, scientific and traditionalist approach.
In the positivist approach, the researcher is distanced from the object of study so that
knowledge is established through observation and measurement of the phenomena
(Krauss, 2005).
Hunt (1991) emphasizes the relevance of positivist philosophy to marketing observing
that marketing is a discipline of dynamic nature that is not dominated by one particular
philosophy. “No single philosophy dominates marketing” (ibid. p. 398). It borrows from
economics, sociology, mathematics and anthropology among other disciplines. Economic
and social environmental dominance of marketing discipline indicates the relevance of
positivist philosophy in relation to this study.
The study is anchored on positivist philosophy, which seeks to expand knowledge, reality
and reason through scientific research method. The philosophy is premised on the values
of reason, truth and validity. It focuses on facts gathered through direct observation,

42
experience and empirical measurements with the use of quantitative methods. The study
embraces the positivist characteristics of independence, value freedom, causality and
hypothetico-deductive method that involve quantitative operationalization of concepts
(Saunders, Lewis &Thornhill, 2009).
Research Design
The study adopted descriptive cross-sectional survey. Survey is a design commonly used
in business and management research (Saunders, Lewis &Thornhill, 2009). It allows for
collection of data that can be quantitatively analyzed using descriptive and inferential
statistics to help deduce relationships among variables. Zikmund, Babin, Carr and
Griffin, (2010) define research design as a master plan specifying the methods and
procedures for collecting and analyzing the needed information. Namada (2013) used the
survey method arguing that the design enables the researcher to capture data at a given
point in time of the study with minimal temporal effect of the variables.
The design was appropriate for the current study as it allows for description of
relationships, factors and direction among variables. It was therefore possible to perform
descriptive analyses through cross-tabulation, regression and moderation path which
included perceived value of investment promotion incentives, organizational
characteristics, macro-marketing environment and firm performance. Secondly, cross-
sectional survey was applicable as the study was time constraint hence longitudinal study
was not appropriate. Cross-sectional survey method provides comparable data across
respondents, which allows for interpretation of the study variable relationships and
associations for statistical conclusions to be drawn.
Population of the Study
The population of the study involved all the 86 firms operating in the EPZs in Kenya in
March 2014 obtained from EPZA offices (EPZA, 2014). Census survey was used in the
study because the population investigated was small (Zikmund, Babin, Carr & Griffin,
2010). Namada (2013) recently used this approach in a study on strategic planning

43
systems, organizational learning, strategy implementation and performance of firms in
export processing zones in Kenya.
The sectors in the EPZ firms covered in the study were manufacturing, commercial and
services. Sector distribution of the population in 2012 was made up of 63 manufacturing,
14 service and 9 commercial firms. The firms were 25.6% local, 24.4% joint ventures and
50% foreign owned (EPZA, 2012).
Data Collection
Data were collected from both secondary and primary sources. Secondary data were
collected through review of documents. Primary data were collected on investment
promotion incentives, organizational characteristics, macro-marketing environment and
EPZ firm performance by use of structured questionnaire administered to all operating
EPZ firms (Appendix IV) except those that were found to have closed, and zone
developers who were not engaged in processing or manufacturing activities.
Before data collection exercise, requisite approvals were obtained. A letter of self -
introduction was prepared by the researcher (Appendix I). An approval letter from the
University was obtained (Appendix II) which further introduced the researcher to the
EPZA management. The EPZA management consequently issued a letter introducing the
researcher to the EPZ firms (Appendix III) to allow access and collection of data.
The questionnaire was divided into five sections to capture data on key variables based
on the objectives of the study. The questionnaire used a rating scale of 1 to 5, reflecting
the intensity of the particular judgment involved (Nachmias & Nachmias, 2009). Scale 1
(not at all) denoted the lowest intensity and 5 (very large extent) showed the highest or
strongest intensity of preference (Vigoda, 2000; Fraj-Andres, Martinez-Salinas, &
Matute-Vallejo, 2009). Ratio scale was also used where quantitative responses were
required especially in section 5. The target respondents for the study were the chief
executives, general managers and departmental managers of the firms. This provided
responses from senior officials. Some of the respondents were owners of the firms. The
upper echelons theory guided the choice of top management as respondents. The theory

44
proposes that top management shapes the destiny of an organization. Namada (2013)
observes that top management decisions play crucial role in defining organizational
position. The choice of the respondents for this study was therefore valid and credible.
The questionnaire was pre-tested on EPZ firms and adjustments made to the instrument
based on the outcome of the pilot study. The final instrument was distributed to the
respondents in the months of May and June, 2015 using email and drop and pick up later
method. Data collection was done by help of research assistants who were inducted on
purpose and objectives of the study. They were also inducted on how to engage with the
target respondents. The respondents took an average of three weeks to return the filled in
questionnaires through pick up by research assistants or by e-mail as the instrument was
self-administered.
Reliability and Validity Tests
3.6.1 Reliability Tests
Reliability is the consistency of measurement and concerned with estimates of the degree
to which a measurement is free of random or unstable error (Cooper & Schindler, 2006).
It is stability of measurement over various conditions. Several methods to estimate
reliability tests include test-retest for stability, split-half for equivalence, and Cronbach’s
alpha for internal consistency. Studies also use factor analysis, which is a statistical
method for data reduction and removal of redundancies in correlated variables.
All completed questionnaires were cross - checked for data integrity, completeness and
consistency. This study used Cronbach’s alpha coefficient reliability tests for internal
consistency. The Cronbach’s alpha reliability coefficient ranges from 0 to 1 where the
closer it is to 1, the greater the internal consistency of the items in the scale. Nunnaly
(1978) has proposed a cut-off point coefficient of 0.7 and above as being strong measure
of reliability. It is argued that when different researchers on similar study achieve similar
results with consistency over time, the instrument is considered accurate representation of
the population under similar methodology.

45
However, Drost (2011) opines that coefficients of internal consistency increases as the
number of items goes up, to a certain point. She argues that a five-item test might
correlate at .40 while a twelve-item test might correlate at .80 with true scores (ibid.
p.111). Schmitt (1996) postulates that the relationship between test length and reliability
may affect the acceptable level of consistency coefficient. When test items are few or
short, a low level of alpha would be expected and therefore the researcher should be
allowed to use and interpret the findings (ibid. 352). He concludes, “There is no
acceptable or unacceptable level of alpha” (p.353). Gliem and Gliem (2003) argue that
Cronbach’s alpha value of 0.70 is desirable but also indicates that 0.60 can be considered
lower limit. The alpha is largely affected by sample size; hence it is not yet agreed on the
exact value of alpha that is applicable as most desirable (Iacobucci & Duhachek, 2003).
The current study had reliability cut-off point of coefficient at 0.6. In order to test the
instrument for internal consistency, a pilot study was conducted on six EPZ firms to
establish reliability of the instrument. The data were obtained from chief executives,
general managers or managers of these firms. The results indicated that a number of
variables had acceptable levels of alpha values.
From the outcome of the pilot study, the questionnaire was revised and used in collecting
the survey data for the study. The summary of reliability tests is given in Table 3.1.
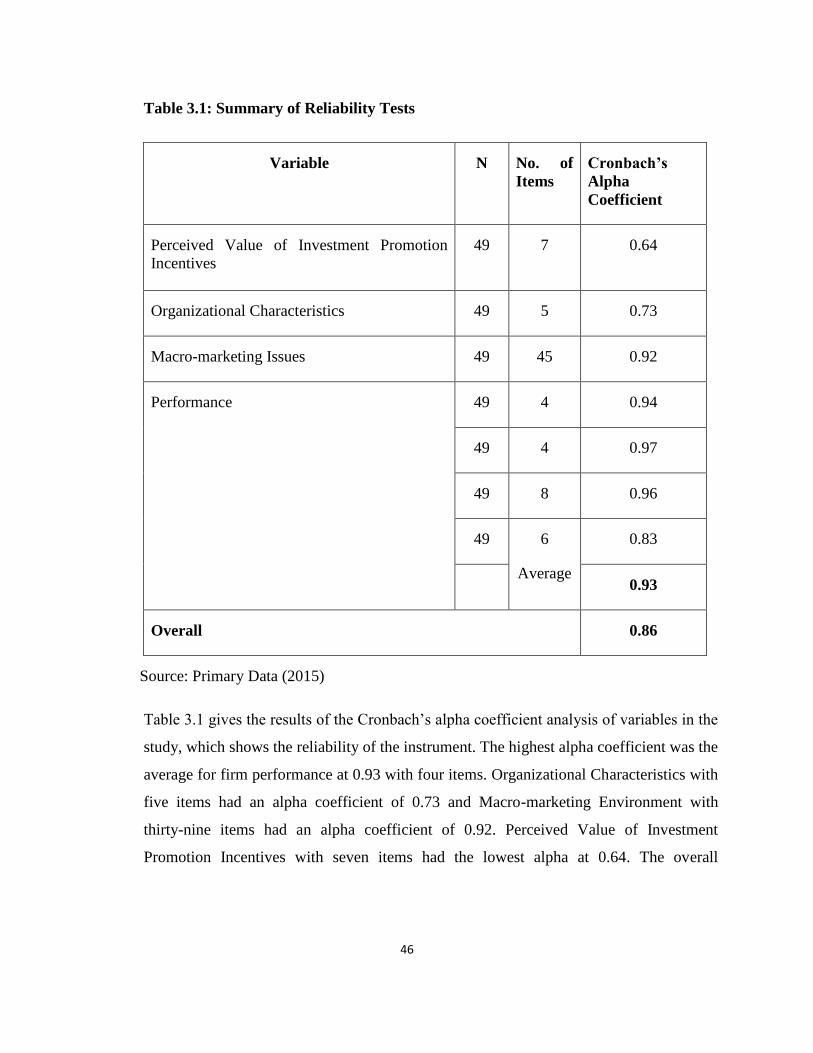
46
Table 3.1: Summary of Reliability Tests
Variable N No. of
Items
Cronbach’s
Alpha
Coefficient
Perceived Value of Investment Promotion
Incentives
49 7 0.64
Organizational Characteristics 49 5 0.73
Macro-marketing Issues 49 45 0.92
Performance 49 4 0.94
49 4 0.97
49 8 0.96
49 6
Average
0.83
0.93
Overall 0.86
Source: Primary Data (2015)
Table 3.1 gives the results of the Cronbach’s alpha coefficient analysis of variables in the
study, which shows the reliability of the instrument. The highest alpha coefficient was the
average for firm performance at 0.93 with four items. Organizational Characteristics with
five items had an alpha coefficient of 0.73 and Macro-marketing Environment with
thirty-nine items had an alpha coefficient of 0.92. Perceived Value of Investment
Promotion Incentives with seven items had the lowest alpha at 0.64. The overall

47
reliability was 0.86, which was above the proposed cut-off point coefficient of 0.6 (Drost,
2011; Schmitt, 1996). The instrument was therefore reliable.
3.6.2 Validity Tests
Validity test shows how closely a measure correctly represents the concept of the study.
Saunders, Lewis, and Thornhill (2009) define validity as the extent to which data
collection method accurately measures what was intended to be measured. Various types
of validity include statistical conclusion, internal, external and construct validity
(Oluwatayo, 2012). Construct validity is of two types namely, translation validity
comprised face and content validity; and criterion related validity composed of
predictive, concurrent, discriminant and convergent validity. In this study, convergent
validity where scores were derived from the measuring instrument correlate with scores
from similar variables was determined by use of secondary data such as annual reports
and other document reviews. Face validity was tested by engagement and discussing the
questionnaire with industry players that included experts in trade and investment
promotion agencies and marketing consultants. Content validity was assessed through
pre-testing the questionnaire to identify deficiencies in the construction, through
comments and suggestions from the respondents to enrich the actual data collection
instrument. The respondents involved were the lecturers, supervisors, and students. The
feedback from the respondents was used to review the quality of the instrument in terms
of quantity of questions, clarity and coverage based on study variables and objectives.
Tests of Assumptions of Regression Analysis
In this study, assumptions associated with regression analysis were met. The focus was on
those assumptions that are not highly robust to violations and a researcher can easily deal
with them through the design of the study (Osborne & Elaine, 2002). To test these
assumptions a number of tests and examinations were carried out.

48
The assumptions tested for regression analysis included absence of outliers, normality,
linearity, homoscedasticity and collinearity (Appendix VI). To conduct a regression
analysis with a valid outcome, there should be no outliers in the data. In the current study,
there were no outliers in the data. This confirmation was done through Cook’s Distance
measurement test. Cook's distance is a common test used to provide an overall measure of
the impact of an observation on the estimated regression coefficient (Walfish, 2006).
Cook’s distance and Z-scores were calculated on the composite scores of all the variables.
Cook’s distance for the interaction among perceived value of investment promotion
incentives and firm performance was 0.187, which was below the maximum limit of 1. In
the interaction among perceived value of investment promotion incentives, macro-
marketing environment and firm performance, Cook’s distance was 0.514. In the
interaction among perceived value of investment promotion incentives, organizational
environment and firm performance, Cook’s distance was 0.929. Finally, in the interaction
among perceived value of investment promotion incentives, organizational characteristics,
macro-marketing environment and firm performance, Cook’s distance was 0.81. In all the
interactions, the values were below the cut-off point of one. Z-scores for all the variables
were also within the respective minimum and maximum limits of -3 and + 3.
The dependent variable is assumed to have normally distributed data indicated by a
histogram with a bell-shaped curve. Normality was tested by exploring the nature of
dependent variable and observing the shape of both the histogram and the frequency
curve. The histograms showed normal shapes with the frequency curve also fitting
normally.
It is assumed that the relationship between variables is linear. Although it is not practically
possible to completely confirm this assumption, multiple regression procedures are not
greatly affected by minor deviations from this assumption (Osborne &Elaine, 2002). In
the current study, linearity was tested by plotting the independent variable(s) against the
dependent variable and checking the concentration of the residuals along the diagonal line
in the normal P-P plots.

49
The standardized residuals of independent and dependent variables must also show a
homoscedastic relationship by exhibiting a concentration of the residuals along the line of
best fit. A scatter plot of the independent and dependent variables was generated and a line
of best fit added to test the homoscedasticity of the data. Osborne and Elaine (2002)
explain that homoscedasticity can be checked by visually examining a plot of the
standardized residuals (the errors) by the regression standardized predicted value. A little
heteroscedasticity however has a slight effect on the significance tests. Marked
heteroscedasticity however can cause a marked distortion of findings and seriously
weaken the analysis thus increasing the possibility of a Type I error. A visual examination
of the spread of regression standardized residuals along this line revealed that the residuals
were equidistant and within the limits of -3 and +3.
Multicollinearity was tested using collinearity diagnostics for three separate interactions.
The first interaction was between composite scores of perceived value of investment
promotion incentives (dimension 1 = .01, dimension 2 = .38) and organizational
characteristics (dimension 1 = .01, dimension 2 = .73). Each of these variables was high
on only one dimension, which were .38 and .73 respectively. The second interaction was
between composite scores of perceived value of investment promotion incentives
(dimension 1 = .01, dimension 2 = .85, dimension 3 = .14) and macro-marketing
environment (dimension 1= .01, dimension 2 = .45 and dimension 3 = .54). Each
variable was high on only one dimension, which was .85, .45 and .54 respectively.
The last interaction was among composite scores of perceived value of investment
promotion incentives (dimension 1 = .00, dimension 2 = .37, dimension 3 = .48,
dimension 4 = .16) and organizational characteristics(dimension 1= .00, dimension 2 =
.30, dimension 3= .06 and dimension 4 = .64) and macro-marketing environment
(dimension 1 = .00, dimension 2 = .02, dimension 3 = .03, and dimension 4 = .95). Each
variable was high on only one dimension, which was .48, .64 and .95 respectively.

50
Operationalization of Study Variables
The study variables were operationalized using methods and recommendations in similar
studies (Njuguna, 2013). Attitudinal items in the variables (investment promotion
incentives, organizational characteristics, and macro-marketing environment) were
measured on a rating scale ranging from 1 to 5. Items in each variable were measured and
composite scores calculated to measure the variables. This was consistent with Vinoda
(2000) who used a rating scale ranging from 1 (strongly disagree) to 5 (strongly agree) to
represent degrees of respondent preference in a study on organizational politics, job
attitudes, and work out-comes in the public sector in Israel. Other previous studies have
used this rating method to obtain respondent preference (Wei, Samiee & Lee, 2013).
Njeru (2013) applied the method when measuring firm size and age in a study on market
orientation, marketing practices, firm characteristics, external environment and
performance of tour firms in Kenya. In contrast, Lapierre (2000) used seven-point rating
scale arguing the suitability of the range was consistent with the knowledge of the target
population of the study.
Bland (2008) explains that sometimes when there are several outcome variables there
might be interest in the effect of treatment on all of them. Other studies have previously
used composite scores. He asserts that the approach was used by Motallebzadeh et al.
(2007) in an operation whose aim was to find a combination of 21 variables which
contained as much of the available information as possible. The danger in using each
individual sub-variable is that it contains only a small part of the information thus
reducing the statistical power. It may also increase the possibility of type 1 error
This study had four specific variables, some of which had many sub-variables measured
on an ordinal scale. Others had been measured on an interval scale. The predictor and
moderator variables had been measured on an ordinal, likert scale. Performance items had
been measured on both ordinal, likert and interval scales. Therefore, it was necessary to
firstly, standardize the scores of the performance item, and secondly to transform all the
four variables into an interval numeric scale. The next step was to derive a combination

51
variable for each of the four variables that would retain as much of the original
information as possible.
First, seven sub-variables in the predictor variable, perceived value of investment
promotion incentives were transformed into composite scores or numeric averages. using
SPSS Compute Variable functionality. Next, the two sets of sub-variables, each
constituting either organizational characteristics or macro-marketing environment were
computed into numeric averages. The resultant score from each set was labelled as a
composite of the corresponding moderator variable. Lastly, four items in firm
performance, namely, foreign exchange earnings, direct local jobs, skills transfer and
backward linkages were transformed into numeric averages by the same SPSS
functionality used for the predictor and moderator variables. These averages were
labelled composite scores of firm performance.
The basic mathematical function for the transformation was SUM (Var1, Var2,
Varn…)/N, where Var1 = First sub-variable in the list; Var2 = Second sub-variable in the
list; and N = Number of variables whose averages are being computed (DeCoster, 2012).
The four composite scores one for the predictor variable, two for the moderator
variables and one for the dependent variable were then used in subsequent analyses
particularly for hypothesis testing.
The operationalization and measurement of the variables are summarized in Table 3.2

52
Table 3.2: Operationalization of Study Variables
Variable Type of
Variable
Indicators Measurement Scale Supporting
Literature Question
Perceived
Value of
Investment
incentives
Independent Fiscal policies:
- Foreign exchange rates
-Duty and tax exemptions,
repatriation of capital and
profits
-Quota-free import of capital
and intermediate goods
Non-fiscal policies:
-Land use policy
-One-stop shop operations,
-Foreign exchange accounts
Rating Scale:
1. Not at all
2. Small extent
3. Moderate extent
4. Large extent
5. Very large extent
Interval Njuguna (2013),
Yang et al.
(2011), Engman,
Onodera & Pinali
(2007), FIAS
(2008), Jenkins
(2005), Wells &
Wint (2000),
Section 2
Question
12a & b

53
Variable Type of
Variable
Indicators Measurement Scale Supporting
Literature Question
Organizational
Characteristics
Moderating Structure, culture and
design
-Age – Years in operation
Size – level of investment
Ownership – foreign or
local/ wholly foreign or joint
venture
Rating Scale
1. Not at all
2. Small extent
3.Moderate extent
4. Large extent
5.Very large extent
Interval Njuguna, (2013),
Katou &
Budhwar (2009),
Aggarwal (2008),
Barney (1986)
Section 3
Question
13a & b
Macro-
marketing
environment:
joint political,
economic,
social,
technology,
ecological,
legislation,
Moderating Political issues: -Political
climate, workers’ political
freedom, international
political relations
Economic issues: Economic
environment
- factors for competitiveness
Socio-cultural issues:
Managerial team,
Expatriates, Workers’
benefits
Rating Scale
1. Not at all
2. Small extent
3. Moderate extent
4. Large extent
5. Very large extent
Interval Njeru (2013),
Hollensen (2007),
Dibb,Simkin,
Pride & Ferrel
(2006), Radelet
(2004), Frey
(2003)
Section 4
Questions
14 - 21

54
Variable Type of
Variable
Indicators Measurement Scale Supporting
Literature Question
Technological issues: -
Technology capacity,
Capital equipment,
Management technology,
Technology and skills
transfer capacity
Legal issues: -Application
of legal and statutory
provisions,
Confidence in legal
provisions
Ecological issues: -
Existence of environmental
policy
Performance of
EPZ firms in
Kenya
Dependent Performance: Foreign
exchange earnings, local
employee taxes,
Employment creation,
Technology and skills
transfer, backward linkages
Ratio scale Ratio scale
Namada, Aosa,
Awino &
Wainaina (2014),
EPZA (2012),
Bontis (2001), Sit
(1985), Yang et
al. (2011)
Section 5
Questions
22 - 25
Source: Researcher (2015)

55
Data Analysis
The unit of analysis of the study was the firm. Performance measurements were foreign
exchange earnings, local employee taxes, employment creation, technology/skill transfer,
and backward linkages. Performance parameters of firms in the EPZs were compared
against the perceived value of investment promotion incentives. The data was analyzed
using descriptive and inferential statistics. Machuki (2011) used descriptive statistics to
provide a profile of organizational demographics with fundamental statistical measures
including averages and measures of dispersion. In this study, descriptive statistics gave
information on the main demographic characteristics of the population such as mean,
median, and other measures of dispersion. Inferential statistics determined the
relationships between variables through hypothesis testing.
The statistical tests included Pearson’s Product Moment Correlation and regression
analysis. Regression analysis was relevant to this study as the main objective was to
investigate strength of relationships in respect of the influence the various variables had
on each other. Due to multiple sub-variables in the main study variables, composite
scores were calculated and used in order to ensure reliability and validity in the measures.
The composite scores for each of the three sets of independent variables were calculated
separately since each set had many sub-variables. This was the same case for the
dependent variable. It was possible to use composite scores because each set of both
independent and dependent variables loaded in to the same construct, and they were both
measured on a ratio scale.
Hypothesis 1 was tested using simple linear regression analysis. Hypotheses 2 and 3 were
tested through correlation while hypotheses 4 and 5 were tested by way of hierarchical
multiple linear regression. Stepwise multiple regression analysis technique was used to
test Hypothesis 6. The tests were computed using statistical tools such as Software
Package for the Social Sciences (SPSS) and Microsoft Excel. Data diagnostics was
performed for normality, multi-collinearity, homoscedasticity and outliers.
Coefficient of determination (R2) explained the significance of the influence of
independent variable(s) on the dependent variable. The F-Statistic showed the

56
significance of the model. In order to test causal relations, path analysis technique was
used as additional technique. Path analysis is both bivariate and multivariate linear
regression analysis technique, which makes it possible to test causal relations among
variables (Nachmias & Nachmias, 2009). Ndungu (2013) and Njeru (2013) used the
technique to analyze the moderating and mediating relationships in their studies.
The general model for testing the hypotheses was in the form of:
P1= β01+ β11Xii+β2Xoc XII+….βnXn+ ε
Where:
P = Firm performance (dependent variable)
β0 =Regression Constant
β1-n= Coefficients denoting a change in the dependent variable caused by a unit change in
the predictor (independent) variable
ε = Error term that accounted for the unspecified variables or unexplained variables in
the model
The regression model for testing the influence of predictor variables on firm performance
was:
P6 = β06+ β16Xii+β26Xmm+ β36XocXII+ ε
Where:
P = Composite score of Firm performance
XII =Composite score of Perceived value of investment promotion incentives
Xoc = Composite score of Organizational characteristics
Xmm = Composite score of Macro-marketing environment
Summary of analytical models is shown in Table 3.3.

57
Table 3.3: Summary of Data Analysis Based on Objectives, Hypotheses, Analysis Techniques, Model Estimation and
Interpretation of Results
Objectives Hypotheses Analysis
Technique
Model Estimation Interpretation of Results
1.To determine
the influence of
Xii on P1
H1:Perceived Value
of Investment
Incentives (ii) have
statistically
significant
influence on
performance of
EPZ firms
Linear
regression
analysis
P1= β01+ β11Xii + Ԑ1
P = performance of EPZ
firms
β01 = beta constant of H1
β11 = beta coefficient of H1
Xii = Investment Incentives
ε= error term unexplained
- Coefficient of determination (R2) is
to explain the variation in the
dependent variable in terms of its
relationship with the independent
variable (relationship between Xii
and P1)
- F statistic will show significance of
the model
2.To assess the
relationship
between Xoc
and P2.
H2: Organizational
characteristics have
statistically
significant positive
relationship with
performance of
EPZ firms.
Correlation -
Pearson’s
Product
Moment
Correlation
- Pearson’s correlation coefficient (R)
is to determine the significance of
the relationship between Xoc and P2
- Crammer’s V will be used to test the
strength of the relationship between
Xoc and P2

58
Objectives Hypotheses Analysis
Technique
Model Estimation Interpretation of Results
3. To establish
the relationship
between Xmm
and P3.
H3: Macro-
marketing
environment has a
statistically
significant positive
relationship with
performance of
EPZ firms.
Correlation-
Pearson’s
Product
Moment
Correlation - Pearson’s correlation coefficient (R)
is to determine the significance of
the relationship between Xoc and P3
- Crammer’s V will be used to test the
strength of the relationship between
Xoc and P3
4.To investigate
the influence of
Xmm on the
relationship
between Xii and
P4
H4: Macro-
marketing
environment has
statistically
significant
moderating
influence on the
relationship
between perceived
value of investment
incentives and the
performance of
EPZ firms.
Hierarchical
multiple linear
regression
P4 = β04+ β14Xii+β24Xmm+
β34Xiimm+ Ԑ4
- R2 is to explain the variation of the
moderating influence of Xmm on the
relationship between Xii and P4
- F statistic will show significance of
the model
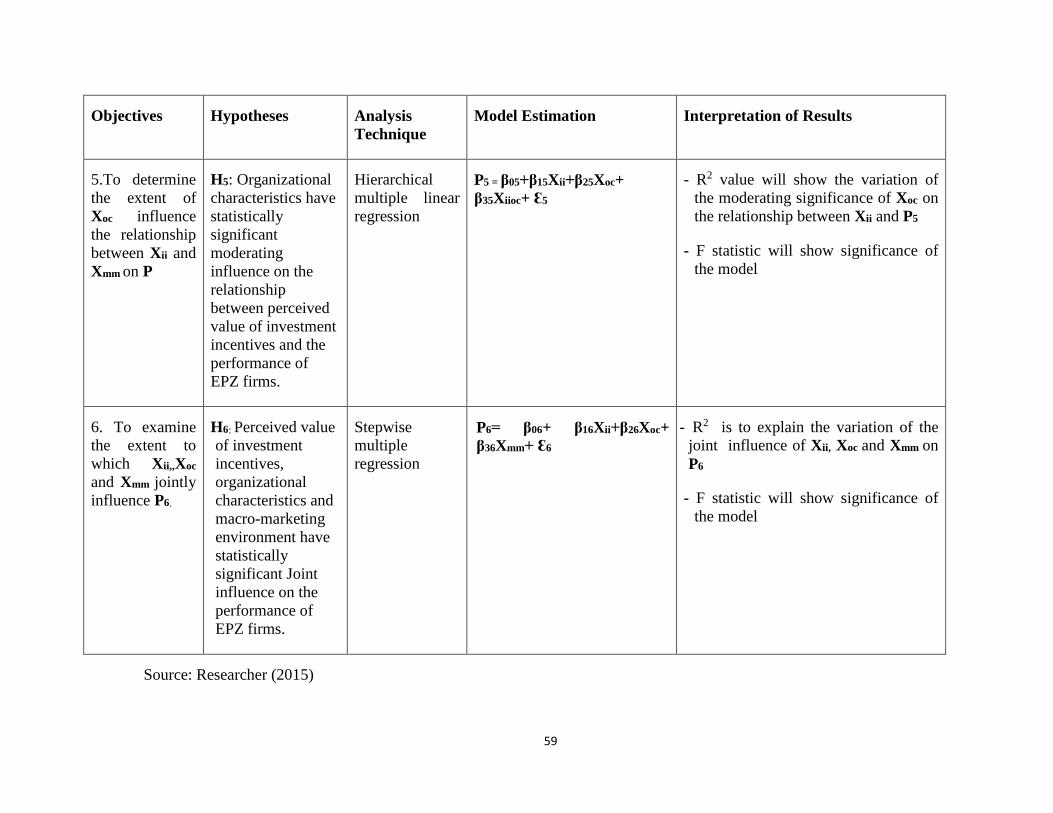
59
Objectives Hypotheses Analysis
Technique
Model Estimation Interpretation of Results
5.To determine
the extent of
Xoc influence
the relationship
between Xii and
Xmm on P
H5: Organizational
characteristics have
statistically
significant
moderating
influence on the
relationship
between perceived
value of investment
incentives and the
performance of
EPZ firms.
Hierarchical
multiple linear
regression
P5 = β05+β15Xii+β25Xoc+
β35Xiioc+ Ԑ5
- R2 value will show the variation of
the moderating significance of Xoc on
the relationship between Xii and P5
- F statistic will show significance of
the model
6. To examine
the extent to
which Xii,,Xoc
and Xmm jointly
influence P6.
H6: Perceived value
of investment
incentives,
organizational
characteristics and
macro-marketing
environment have
statistically
significant Joint
influence on the
performance of
EPZ firms.
Stepwise
multiple
regression
P6= β06+ β16Xii+β26Xoc+
β36Xmm+ Ԑ6
- R2 is to explain the variation of the
joint influence of Xii, Xoc and Xmm on
P6
- F statistic will show significance of
the model
Source: Researcher (2015)

60
Moderation Tests
Moderation test was performed through hierarchical multiple regression. Subsequently,
path analysis was done to determine the causal influence between perceived value of
investment promotion incentives and firm performance.
Moderation is an interaction in which there are different predictions of a dependent
variable by an independent variable across levels of a third variable (Baron & Kenny,
1986). The third variable affects both strength and direction of the relationship or either.
It could enhance, reduce or influence the predictor.
Figure 3.1: Path Analysis Diagram for Moderating Influence Tests
Source: Source: Adopted from Baron and Kenny (1986)
Where:
ii = Independent variable
mm = Macro-marketing environment
P = Dependent variable
βi = Beta coefficients
β1
β3
β2
p
iimm
ii
mm

61
Summary of the Chapter
This chapter has presented the research methodology adopted in the study. It presented
research philosophy, population of the study and data collection method used. The
chapter also explained reliability and validity of the data instruments. It dealt with the
operationalization of study variables, and statistical data techniques namely, descriptive
and inferential. The chapter also provided the models used for data analysis, hypotheses
testing and moderation tests. The next chapter presents data analysis, findings and
discussion.

62
CHAPTER FOUR: DATA ANALYSIS, FINDINGS AND DISCUSSION
Introduction
This chapter presents the results of response rate, and detailed results of analysis of the
respondents’ data on variables classified as socio-demographics, perceived value of
investment promotion incentives, organizational characteristics, macro-marketing
environment and firm performance. The results are presented in form of both descriptive
and inferential statistics. There is also a section-by-section discussion, interpretation of
the results and conclusions based on the hypotheses testing.
Response Rate
This study adopted a descriptive cross-sectional survey of firms operating in the Export
Processing Zones in Kenya as at March 2014. The study targeted eighty-six (86) firms in
the 50 zones spread across the country. However, only 70 (81.4%) firms participated due
to a number of reasons. Six (6) establishments were purely zone developers, which were
not engaged in the business of processing and exports. Nine (9) had closed down and one
(1) was a subsidiary consultancy firm of one of the companies. Of the 70 participating
firms, 49 (70%) returned duly filled questionnaires.
The response rate is consistent with previous studies. For instance, Namada (2013) had a
response rate of 62.5% from the same target EPZ firms. Njeru (2013) studying marketing
in the tourism sector in Kenya had a response rate of 60%. Nilsson (2008) undertook a
study on the impact of pro-social attitudes and perceived financial performance on
socially responsible investment behaviour in Sweden with a response rate of 24%. In
China, Wei, Samiee and Lee (2014) studied the influence of organic organizational
cultures, market responsiveness, and product strategy on firm performance in an
emerging market and had a response rate of 60%.

63
Respondent Characteristics
Descriptive statistics were used to analyze characteristics of the respondents in terms of
their gender, age, level of education, position, and length of service in the firm. The
respondents were the chief executives/managing directors, general managers and other
managers who constitute top management in the EPZ firms in Kenya. Descriptive
statistics were also used to analyze firm characteristics in terms of sector, year of
incorporation, value of investments, employee complement and category. The relevant
results are presented in the subsequent sections.
4.3.1 Gender
The study had sought information on the respondents’ gender in order to determine its
spread in the top management of the assessed firms in the Kenyan EPZ. The spread of
gender is shown in Table 4.1.
Table 4.1: Respondent Distribution by Gender
Gender Frequency Percent
Male
31
63.3
Female 18 36.7
Total 49 100.0
Source: Primary Data (2015)
The results in Table 4.1 show that 63.3% top managers were male and 36.7% female
staff. This ratio is consistent with European Union average of 67% male to 33% female
employment ratio (UK, 2013). Namada (2013) had a response rate of 75% male and 25%
female in top management of EPZ firms categorized as Managing Directors,
Accountants, Administrators and Human Resource Managers.

64
4.3.2 Age
Age is an important characteristic of management. Age, though not necessarily a
determinant of positions in the top management of firms, is a variable that may be
important in classifying or explaining the portfolio and/or hierarchical spread of
personnel. Information on the respondents’ age distribution is contained in Table 4.2.
Table 4.2 Distribution of Respondents by Age category
Source: Primary Data (2015)
The data in Table 4.2 indicate that majority of top managers (71.4%) in the EPZ firms in
Kenya are within the age bracket of between 31 and 45 years. The employment age
bracket in EPZs tend to be relatively young; hence, top management age is within the
trend. In Costa Rica, 40.2% of EPZ work force is between 18 and 25 years while ages
between 26 and 30 years make up 25% of the work force (Jenkins, 2005). In India, the
age range of EPZ work force is concentrated between 20 and 29 years with male workers
at 61% and female workers at 71.4% (Aggarwal, 2007). In developing countries, most
EPZ firms are low-technology labour-intensive industries that require low skill workforce
(ibid, p.5). It means that first time or younger job seekers without experience tend to have
employment opportunity in the EPZ firms. Only 4.1% of the top management executives
was 61 years and above. This might mean that after gaining skills and experience the
managers could be moving out to other jobs in the domestic market or starting own
enterprises after gaining technological experience.
Age Frequency Percent
Up to 30 years 4 8.2
31-45 35 71.4
46-60 8 16.3
Above 60 2 4.1
Total 49 100.0

65
4.3.3 Respondents’ Highest Level of Education
The respondents’ level of education is both a key determinant of the positions occupied in
firms and influences significantly social upward mobility. High level of educational
attainment is generally equated with both expertise and subsequent high and improved
performance. It is therefore a key variable assessed to establish the possible level of
qualification of the top management and the inferred expertise. Table 4.3 shows the
distribution of the respondents by highest level of education attained.
Table 4.3: Distribution of Respondents by Highest Level of Education Attained
Level Frequency Percent
Secondary
1 2.0
Diploma 16 32.7
Bachelor’s Degree 19 38.8
Master’s Degree 13 26.5
Total 49 100.0
Source: Primary Data (2015)
The results summarized in Table 4.3 reveal that 38.8% of top managers had Bachelor’s
Degree; 32.7% had Diploma and 26.5% had Master’s Degree. Education consideration
thus seems to be critical in engaging top management cadres. The result is almost similar
to Namada (2013) which found out that Bachelor’s Degree level of education among top
management at the EPZ firms in Kenya was 47.5% comprising 42.5% male and 5%
female.
The high level of education with majority at Bachelor’s Degree for top management
enables them to easily learn and acquire knowledge that can eventually be transferred to
domestic firms through copying, reverse engineering and movement of managers

66
between foreign and domestic companies (Aggarwal, 2005). The level of knowledge also
points out to the ability of the managers to make informed managerial decisions.
4.3.4 Respondents’ Position in the Firm
Position occupied in a firm in the EPZ was a critical aspect of this study. The suitability
of a respondent to participate in filling the questionnaire actually depended on his or her
position in the assessed firm. The basis for this decision was that certain positions meant
that one was a custodian of and had access to the information at the firm’s disposal. In
this study, these positions were Chief Executive Officer/Managing Director, General
Manager and other managers. Table 4.4 contains results of the assessment of the
distribution of the respondents’ positions in the firm.
Table 4.4: Distribution of Respondents by Position in the Firm
Position Frequency Percent
Chief Executive Officer/Managing
Director
11 22.4
General Manager 6 12.2
Manager 32 65.3
Total 49 100.0
Source: Primary Data (2015)
The results in Table 4.4 indicate that 65.3% are ordinary managers and 22.4% are Chief
Executives/Managing Directors. The results show that people at the rank of managers
form the topmost executives in the management of many EPZ firms in Kenya. It also
indicates the level of confidence EPZ firm ownership has in their managers by allowing
them to give important company information. It might also suggest possibility of
ownership of many firms delegating some responsibility to their managers. The result
may further suggest that many EPZ firms being foreign owned may have their top

67
management stationed in foreign headquarters leaving daily management responsibility
to locally hired managers.
4.3.5 Respondents’ Distribution by Length of Service in the Firm
The length of time for which the respondents had served in their respective firms had
been one of the variables on which information was sought. Duration of service is an
important factor in determining who assumes a top managerial position in a firm. It is
also often equated with expertise and competencies accumulated overtime. Therefore,
length of service was one of the key demographic variables measured in the study. Table
4.5 presents a summary of the results drawn from that assessment.
Table 4.5: Distribution of Respondents by Length of Service in the Firm
Source: Primary Data (2015)
The results in Table 4.5 show that 57.1% of top managers had served in the firms for up
to five years. Only 20.5% had served for between 6 and 10 years. This may indicate that
there is a high top management turnover. As observed in the general age brackets, the
youthful nature of managers might be inspiring vertical and horizontal job mobility to
other enterprises within and outside the EPZs.
Length of Service Frequency Percent
0-5 years 28 57.1
6-10 years 10 20.5
11-15 years 11 22.4
Total 49 100.0

68
4.3.6 Respondents’ Gender, Duration and Position in the Firm
Distribution of positions in the firms along the lines of gender and duration of service
was assessed. Both gender and duration of service can be significant variables for
classifying the distribution of top managerial positions in a company. At times, these two
may actually influence such a distribution. Table 4.6 is a cross tabulation of gender,
duration of service and position in the Company.
Table 4.6: Distribution of Respondents by Gender, Duration and Position in the
Firm
Gender Duration n Position in the company Total
(%)
Years
(Age)
Chief Executive
Officer/Managing
Director (%)
General
Manager
(%)
Manager
(%)
Male 0-5 20 8.16 6.12 26.53 40.81
6-10 5 0 0 10.20 10.2
11-15 6 4.08 4.08 4.08 12.24
Female 0-5 8 2.04 0 14.29 16.33
6-10 5 0 2.04 8.16 10.2
11-15 5 8.16 0 2.04 10.2
Total 49 22.44 12.24 65.30 100
Source: Primary Data (2015)
Table 4.6 shows that majority of the male (40.1%) against female (16.33%) had served in
the top management of firms for a period of below five years. Fewer top management
executives had worked for a period between 6 and 15 years. However, fewest of top
managers, male or female at an equal score of 10.2% had served for a period between 6
to 10 years. Across gender and duration, there was a wide spread of manager positions
(65.30%) compared to the others. This could be attributed to the ten-year tax holiday as
an incentive for EPZ firms which mean many firms do opt out of the zone programme by

69
closing down and relocating. Many top managers therefore tend to leave the firms before
expiry of the tax holiday period.
4.3.7 Gender, Position in the Firm and Level of Education
The respondents had been asked to provide information on their gender, position in the
firm and education. Based on this information cross tabulation was computed to help
reveal details of the spread of educational levels or qualifications across gender and
position. The result of the cross tabulation is shown in Table 4.7.
Table 4.7: Distribution of Respondents by Gender, Positon in the Firm and Level of
Education
Source: Primary Data (2015)
Gender Position n Level of Education Total
(%) Secondary
(%)
Diploma
(%)
Bachelor’s
Degree
(%)
Master’s
Degree
(%)
Male Chief
Executive
Officer/
Managing
Director
6 0 4.08 2.04 6.12 12.24
General
Manager
5 0 0 4.08 6.12
10.2
Manager 20 0 10.20 22.44 8.16
40.8
Female Chief
Executive
Officer/
Managing
Director
5 2.04 6.12 0 2.04 10.2
General
Manager
1 0 0 0 2.04 2.04
Manager 12 0 12.24 10.20 2.04 24.48
Total 49 2.04 32.64 38.76 26.52 100

70
The results in Table 4.7 indicate that 6.12% of the males who responded are Chief
Executives/Managing Directors with Master’s Degree against 2.04 % of the females in a
similar position and with a similar qualification. There were more male top managers
across the different managerial positions with either Master’s Degree (20.40%) or
Bachelor’s Degree (28.56%) than their female counterparts were with 6.16% Master’s
Degree and 10.2% Bachelor’s Degree. Only female top managers (2.04%) had secondary
level education.
Overall, more respondents had either Master’s Degree (26.52%) or Bachelor’s Degree
(38.76%) compared to the other levels of education. This shows that academically
capable people who can make responsible decisions to enhance firm performance manage
the EPZ firms.
4.3.8 Gender, Age and Duration of Service
Information had been sought on the respondents’ gender, age and duration of service. The
purpose of this information was to determine how long the respondents had worked in the
respective firm and the status of this aspect based on their gender and age. Age especially
can be a critical determinant of the duration of service of an employee in a firm. The
relevant data were analyzed and the results presented in Table 4.8.

71
Table 4.8: Distribution of Respondents by Gender, Age and Duration
Source: Primary Data (2015)
Table 4.8 shows that the highest percentage of top managers, male (48.97%) and female
(22.44%), aged between 31 and 45 years, had served the EPZ firms for a period less than
five years. In total, across all age categories, 57.14% had served in top management for a
period less than five years. Some 20.41% had served for between 6 and 10 years and
22.45% had served for periods between 11 and 15 years. This indicates that most top
executives in the EPZ firms are at formative stage of their management career, which
may translate to creative, energetic and active approach for superior firm performance.
4.4 Firm Characteristics
This study considered sector categories, ownership structure, age of firm, and year of
incorporation in Kenya as important factors for firm performance. The respondents had
therefore, been asked to provide information on these items.
Gender Age
(years)
n Length of service in the firm Total
(%)
0-5 years
(%)
6-10 years
(%)
11-15 years
(%)
Male 31-45 24 30.61 10.20 8.16 48.97
46-60 6 8.16 0 4.08 12.24
Above
60
1 2.04 0 0 2.04
Female Upto 30 4 6.12 2.04 0 8.16
31-45 11 10.20 6.12 6.12 22.44
46-60 2 0 2.04 2.04 4.08
Above 60 1 0 0 2.04 2.04
Total (%) 49 57.14 20.41 22.45 100

72
4.4.1 Sector of Firm
Information on the sector had been sought to help in categorizing the respondents’ firms.
Such categorization was important in validating the choice of the key variables.
Identification of the category was necessary in analyzing popular sectors, which investors
tend to be attracted to in the EPZ programme. The relevant information is provided in
Table 4.9.
Table 4.9: Distribution of Firm Characteristics by Sector
Sector Frequency Percent
Manufacturing/Processing 43 87.8
Commercial 4 8.2
Service 2 4.1
Total 49 100.0
Source: Primary Data (2015)
Results in Table 4.9 indicate that EPZ firms in Kenya are concentrated in manufacturing
and processing, constituting 87.8% of the total firms in the study. This can be attributed
to the investment incentives offered to manufacturers for exports. Incentives in the EPZ
programme are more skewed towards manufacturing activities where investors enjoy
duty and tax exemptions, quota-free import of capital and intermediate goods.
4.4.2 Firm Ownership
Ownership of the firm was considered in terms of whether Kenyan owned, foreign owned
or both. Firm ownership in the Kenyan EPZs takes the forms stated above and may have
a bearing on the type of investment promotion incentives and macro-marketing
environment issues considered critical for performance. Table 4.10 shows the distribution
of the firm ownership in the EPZs.

73
Table 4.10: Distribution of Firm Characteristics by Ownership
Ownership Frequency Percent
Wholly Kenyan 15 30.6
Wholly foreign 23 46.9
Majority Kenyan 6 12.2
Majority foreign 5 10.2
Total 49 100.0
Source: Primary Data (2015)
Results in Table 4.10 reveal that wholly foreign owned firms were the majority (46.9%).
while 30.6% were wholly Kenyan owned. This may be explained by the fact that foreign
firms, due to theory of location advantages, move to locations with improved
infrastructure, market access opportunities and institutional incentives. Most of foreign-
owned manufacturing/processing firms have set up operations in the EPZs to take
advantage of the incentives the Country provides and market access provisions of the
African Growth and Opportunities Act (AGOA) of the United States of America (USA)
and other regional market access preferences to Kenya is a signatory.
The 46.9% foreign ownership may also be attributed to the earlier notion by Kenyans that
EPZ programme was focused on foreign investors. The EPZ Authority undertakes
investment promotion in foreign countries; hence, the more attraction of foreign investors
into the programme compared to local Kenyans. This result is different from Namada
(2013) which had 42.5% of the firms being wholly Kenyan and 40% wholly foreign
owned.
4.4.3 Firm Ownership and Sector
The spread of sector in which the respondents’ firms operated across different categories
of ownership was assessed to determine any notable patterns. The relevant results are
contained in Table 4.11.

74
Table 4.11: Distribution of Firm Characteristics by Ownership and Sector
Ownership
(%)
n Sector Total
(%) Manufacturing/
Processing (%)
Commercial
(%)
Service
(%)
Wholly Kenyan 15 26.53
2.04 2.04 30.61
Wholly foreign 23 42.5
4.26 0 46.76
Majority Kenyan 6 8.61
2.04 2.04 12.69
Majority foreign 5 10.20 0 0 10.20
Total (%) 49 87.84 8.34 4.08 100
Source: Primary Data (2015)
Table 4.11 indicates that majority (87.84%) of the firms across the ownership category
are concentrated in the manufacturing sector. Only Kenyan owned firms operate in all the
sectors. The results therefore show that foreigners are mainly interested in the
manufacturing/processing sector, which happens to have good incentive packages such as
quota-free imports of capital and intermediate goods, and duty and VAT exemptions.
EPZ programme is typically meant for export product manufacturing and processing;
hence commercial and service sectors are supposed mainly to support the industries.
4.4.4 Age of the Firm
Age of the firm had been defined in terms of the number of years for which the firm had
operated in Kenya. The age of a firm significantly determines the evaluation of its
success. It is also a criterion for the relevance of the information solicited for eventual
analysis. Table 4.12 presents the pertinent results.
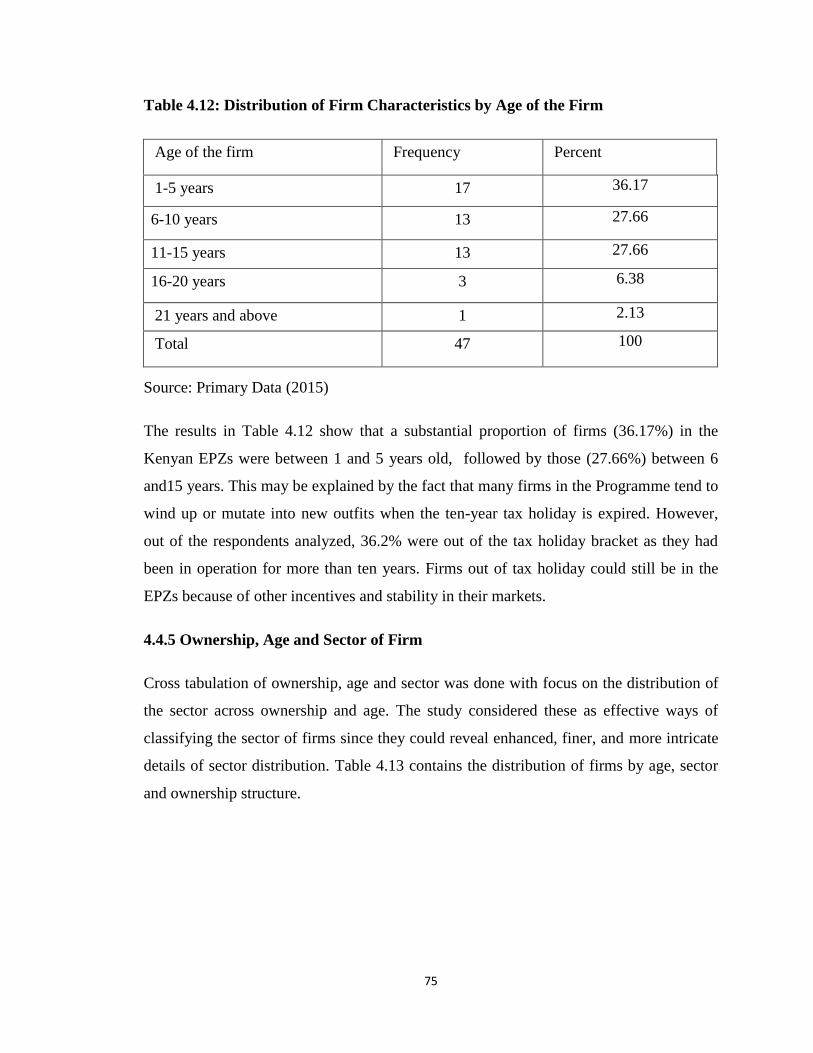
75
Table 4.12: Distribution of Firm Characteristics by Age of the Firm
Age of the firm Frequency Percent
1-5 years 17 36.17
6-10 years 13 27.66
11-15 years 13 27.66
16-20 years 3 6.38
21 years and above 1 2.13
Total 47 100
Source: Primary Data (2015)
The results in Table 4.12 show that a substantial proportion of firms (36.17%) in the
Kenyan EPZs were between 1 and 5 years old, followed by those (27.66%) between 6
and15 years. This may be explained by the fact that many firms in the Programme tend to
wind up or mutate into new outfits when the ten-year tax holiday is expired. However,
out of the respondents analyzed, 36.2% were out of the tax holiday bracket as they had
been in operation for more than ten years. Firms out of tax holiday could still be in the
EPZs because of other incentives and stability in their markets.
4.4.5 Ownership, Age and Sector of Firm
Cross tabulation of ownership, age and sector was done with focus on the distribution of
the sector across ownership and age. The study considered these as effective ways of
classifying the sector of firms since they could reveal enhanced, finer, and more intricate
details of sector distribution. Table 4.13 contains the distribution of firms by age, sector
and ownership structure.

76
Table 4.13: Distribution by Ownership, Age and Sector
Ownership n Age of
firm in
years
Sector Total
(%) Manufacturing/
Processing
(%)
Commercial
(%)
Service
(%)
Wholly
Kenyan
6 1-5 12.7 0 0 12.7
4 6-10 6.38 0 2.13 8.51
3 11-15 6.38 0 0 6.38
1 21 and
above
0 2.13 0. 2.13
Wholly
Foreign
8 1-5 14.89 2.13 0 17.02
4 6-10 8.51 0 0 8.51
7 11-15 12.77 2.13 0 12.77
3 16-20 6.38 0 0 6.38
Majority
Kenyan
3 1-5 6.38 0 0 6.38
2 6-10 0 2.13 2.13 4.26
1 11-15 2.13 0 0 2.13
Majority
Foreign
3 6-10 6.38 0 0 6.38
2 11-15 4.25 0 0 4.25
Total (%) 47 87.15 8.52 4.26 100
Source: Primary Data (2015)
The results in Table 4.13 show that majority of the firms irrespective of type of
ownership are mainly in the manufacturing sector. They were also mostly in the age
bracket of between 1 and 5 years. Although the dominance and spread of the
manufacturing/firms across periods of operation and ownership is observable throughout
the distribution, wholly foreign owned firms were the most evenly spread throughout the
period. This indicates that foreigners pioneered investments and continue to operate in
the Kenyan EPZ programme.

77
Overall, manufacturing sector accounts for the most number of firms across the different
ownership categories and periods of operation. This indicates that foreign-owned firms
were also more grounded in the manufacturing sector than local firms. The spread across
the years may also be considered as a strong factor in sustainable firm performance.
Investments in the commercial and service sectors seemed not to be popular. This may be
explained by the fact that the two sectors merely offer support facilities for the EPZ
enterprises. Furthermore, the two sectors do not attract the traditional incentives offered
to the manufacturing/processing sector.
4.4.6 Year of Incorporation
Information on the respondent firms’ year of incorporation was necessary to assess
whether the time lapse since their incorporation had qualified them as participants in the
EPZ programme. It would also help in assessing if the firms were beneficiaries of the
investment promotion incentives and exposed to the relevant organizational and macro-
marketing issues under investigation. The necessary information is contained in Table
4.14.
Table 4.14: Year of Incorporation in Kenya
Source: Primary Data (2015)
The data summarized in Table 4.14 indicate that 85.7% of firms in the Kenyan EPZs were
incorporated within the last fourteen years although the Programme has been in existence
for 24 years. Only 14.3% of the firms were incorporated in the first ten years of the
Programme. This shows the slow uptake of the EPZ concept in the Country and, possibly,
initial low confidence level of the foreign investors in the Kenyan investment climate.
Year Frequency Percent
1990-1994 3 6.1
1995-1999 4 8.2
2000-2004 8 16.3
2005-2009 18 36.7
2010-2014 16 32.7
Total 49 100.0

78
4.4.7 Year of Incorporation and Sector
Cross tabulation was computed to find out the distribution of firm sector across years of
incorporation in Kenya. The information on such a distribution would help in
determining which sector, for example, had the oldest or newest firms since
incorporation. The results are summarized in Table 4.1.
Table 4.15: Distribution of Firm Characteristics by Year of Incorporation and
Sector
Year Sector Total
(%) n Manufacturing/Processing
(%)
Commercial
(%)
Service
(%)
1990-1994 3 4 2 0 6
1995-1999 4 8.16 0 0 8.16
2000-2004 7 14.28 2 0 16.28
2005-2009 18 30.61 2 4 36.61
2010-2014 17 30.61 2 0 32.61
Total (%) 49 87.66 8 4 100
Source: Primary Data (2015)
The results presented in Table 4.15 indicate that majority (61.22%) of the firms were
incorporated in the last ten years (2005 to 2014). These firms are in the manufacturing
sector. Between the years 2000 and 2014, only three commercial, and two service sector
firms were established. Between the years, 1990 and 1994 only one commercial sector
firm was established. This suggests that the two sectors (commercial and service) were
not common in the activities of the EPZ programme. This could have been due to lack of
economies of scale that could justify their establishment, as firms were still few in the
programme.

79
4.4.8 Current Investment Value of the Firm
It had been necessary to seek information on the current investment values of the firms.
This information was to help get an idea and make inferences on the status of the firms’
investment value i.e. size of firm by level. Table 4.16 summarizes the relevant investment
value information.
Table 4.16: Distribution of Firm Characteristics by Current Investment Value of the
Firm ('Million US. Dollars)
Values in $ Frequency Percent
100 & Below 29 70.7
101-500 5 12.2
501-1000 4 9.8
5001 & above 3 7.3
Total 41 100.0
Source: Primary Data (2015)
The results in Table 4.16 show that 70.7 % of the investment values in the EPZ firms in
Kenya are worth US.$ 100 million and below. The values decrease from 12.2% for
investment values between US.$101 to 500 million to 9.8% and 7.3% for investment
values US.$ 5001 and above. This implies that the consequence of exemptions and other
investment attraction incentives could be reducing investment expenses leading to lower
costs for investors. The other reason for low values may be that most investments in the
Kenyan EPZs are not of high capital expenditure. They are mainly in the labour intensive
sectors such as textile and apparels for the AGOA market in the USA.

80
4.4.9 Firm Characteristics by Number of Employees 2011-2014
The study had also intended to get information on the composition of the employment
structure in the respondent firms from 2011 to 2014. The structure had to be classified in
three different categories namely locals (permanent), expatriates and casuals. The
pertinent results are contained in Table 4.17.
Table 4.17: Distribution of Firm Characteristics by Number of Employees 2011-2014
(Employment Generation)
Employee
Category
Year
2011 2012 2013 2014
Frequency Percent Frequency Percent Frequency Percent Frequency Percent
Locals
(Permanent
16786
85.2 22874
85.2 28646
84.7 28317
79.0
Expatriates 209
1.1 265
1.0 343
1.0 370
1.0
Casuals 2701
13.7 3704
13.8 4838
14.3 7160
20.0
Total 19696 100 26843 100 33827 100 35847 100
Source: Primary Data (2015)
The results in Table 4.17 show that locals comprised 85.2% in the permanent
employment category in the years 2011 and 2012. However, there was a drop in the next
three years with the biggest drop (79.0%) being in 2014. Expatriate employment was
only 1.1% in 2011 and remained largely the same in the subsequent years. Casual
employment had a steady rise from 13.7% in 2011 to 20% in 2014. It is evident that
whenever there was an increase in the number of permanent and casual employees, there

81
was corresponding increase in the number of expatriates. Another trend was that
whenever there was a decrease in permanent employment, there was an increase in casual
employment. This trend may be attributed to market behaviour in EPZ product orders
especially the textile and apparels. When the demand drops and the market future is
uncertain, investors tend to reduce permanent employees considered expensive and
replace them with casuals who are considered affordable under the difficult
circumstances.
4.5 Descriptive Statistics for the Independent and Dependent Variables
Mean score is the average of all the scores in a given variable while standard deviation is
a measure of dispersion of the values from a central point. The mean and standard
deviations however, cannot be compared in a meaningful way, as they greatly vary in
their occurrence in the different variables. Coefficient of variation (Cv) is a standardized
measure of dispersion of probability or frequency distribution. It thus depicts the extent
of variability in respect the population mean. It is computed as a ratio of standard
deviation to the mean. Due to the limitation of the mean for comparison of the items in
the variables, Cv was computed to get values that were as close as possible to the actual
values. This made clear the true nature of dispersion of the items and their contribution to
performance. For purposes of this study, the coefficient of variation ratings were
determined as 0 to 25% very good, 26 to 50% good, 51 to 75% fair and 76 to 100% poor.
a. Perceived Value of Investment Promotion Incentives
Descriptive statistics for Perceived Value of Investment Promotion Incentives are shown
in Table 4.18. It comprises seven item incentive measurements. The incentives were
measured using a rating scale of 1 to 5 where 1 represented a response of “Not at all” and
5 represented “Very large extent”. The respondents were asked to indicate the extent to
which the enlisted incentives contributed to the performance of their firms. They were
also asked to specify any other factor they considered important in their firm
performance. The results were measured using mean scores and coefficient of variation.

82
Table 4.18: Mean Scores, Standard Deviations and Coefficient of Variation (Cv) for
Perceived Value of Investment Promotion Incentives
Perceived Value of
Investment Promotion
Incentives
N Mean Std. Deviation Cv (%)
Stability of foreign exchange 48 2.17 1.00
46
Free repatriation of capital and
profits
47 3.19 1.10 34
Allowance to own foreign
currency accounts
48 2.83 1.10 38
Quota-free imports 47 2.60 1.33 51
Land use policy 44 2.91 1.38 47
Duty & VAT 47 1.62 0.68 41
One-stop shop 48 2.73 1.23 45
Overall 2.58
1.12 43.14
Source: Primary Data (2015)
Sub-variables of perceived value of investment promotion incentives were used to
determine the extent to which they contributed as incentives to the performance of firms
in the EPZs in Kenya. The overall mean score was 2.58 and a coefficient of variation
(Cv) = 43%. The standard deviation and mean of a variable are expressed in the same
units, so taking the ratio of these two allows the units to cancel. The results in all the
variables indicate that investors consider stability of foreign exchange, free repatriation
of capital and profits, allowance to own foreign currency accounts, land use policy in
Kenya, duty and VAT exemptions, and one-stop shop operations as good contributing
incentives to their firm performance. However, quota-free imports of capital and
intermediate goods (mean score of 2.60 and Cv = 51%) had little contribution as an
incentive to firm performance.

83
b. Descriptive Statistics for Organizational Characteristics
Organizational characteristics was a moderating variable having six measurement items
with the last item soliciting for an open opinion from respondents. Using the same rating
method as in 4.4.1 above, respondents were asked to indicate the extent to which the
items in the measurement influenced their firm performance. The results are shown in
Table 4.19.
Table 4.19: Mean Scores, Standard Deviations and Coefficient of Variation (Cv) for
Organizational Characteristics
Organizational Characteristics N Mean Std. Deviation Cv (%)
Industry Experience 48 2.8125 1.39 49
Business Culture 49 2.8980 1.36 46
Satisfied with the quality of our
human resources
49 3.2653 1.04 31
Size of investment influences the
performance
48 3.2500 0.98 30
Ownership structure of our firm gives
us advantage over competitors
47 3.5532 1.14 32
Overall 3.16 1.18 37.6
Source: Primary Data (2015)
The result of industry experience indicates a mean score of 2.8 and a Coefficient of
Variation = 49%. This explains that investors consider industry experience as a good
influence in their firm performance. The ratings of the other measurements (business
culture, quality of human resource, size of investment, and ownership structure as an
advantage over competitors) ranged from means of 0.98 to 1.36, and Cv ranging from 30

84
to 46%. Organizational characteristics were therefore considered good indicators
affecting firm performance.
c. Descriptive Statistics for Macro-marketing Environment
Descriptive statistics for macro-marketing environment covers political issues, economic
issue in general, economic issues related to cost, social issues, legal issues, technology
issues and ecological issues. The issues were constructed as opinion statements, and
measured using a rating scale of 1 to 5 where 1 represented a response of “not at all” and
5 represented “very large extent”. The coefficient of variation rating were determined as
0 to 25% very good, 26 to 50% good, 51 to 75% fair and 76 to 100% not good.
For all the statements, the respondents had been asked to indicate the extent to which they
agreed with the statements as presented in respect to the influence macro-marketing
environment had on firm performance.
i) Macro-marketing Environment: Political issues
The respondents’ opinion had been sought on a number of political issues as part of a
wider macro-marketing environment with postulated influence on firm performance. The
results are depicted in Table 4.20.
Table 4.20: Mean Scores, Standard Deviations and Coefficient of Variation (Cv) for
Macro-marketing Environment (Political Issues)
Political Issues N Mean Std. Deviation Cv
(%)
The prevailing political climate is good for
our firm performance.
49 2.61 1.21 46
We are satisfied with government effort in
supporting investments in the country.
49 2.94 0.80 27
Kenya has good international political
relations that is good for investment.
49 2.97 0.96 28
Overall 2.84 0.99 34

85
Source: Primary Data (2015)
Results in Table 4.20 indicate that all the political issues on average are significant aspect
of macro-marketing environment with ability to influence firm performance with overall
mean=2.84 and Cv =34%. However, the respondents seemed to consider prevailing
political climate (mean 2.61 and Cv = 46%) as less significant for investments compared
to either satisfaction with government effort in supporting investments (mean 2.94 and
Cv = 27%) or the status of Kenya’s good international political relations (mean 2.97 and
Cv = 28%).
ii) Macro-marketing Environment: Economic Issues
A number of sub variables on economic issues were used to solicit the opinion of the
respondents on their firm performance. The study hypothesized these as determinants of
factors that influence firm performance despite the incentives offered by the host country.
The results are presented in Table 4.21.
Table 4.21: Mean Scores, Standard Deviations and Coefficient of Variation (Cv)
for Macro-marketing Environment (Economic Issues In General)
Economic Issues N Mean Std. Deviation Cv
(%)
Allocation of industrial land for EPZ
investors has improved firm performance.
49 2.93 1.68 42
Industrial linkages with the domestic
economy has helped us in addressing inputs
including raw materials.
49 2.96 1.46 45
Rate of minimum wage in Kenya negatively
affects performance of our firm.
49 2.63 1.41 53
We are satisfied with the services at the
customs management offices in supporting
our performance.
49 2.94 0.80 27
Overall 2.87 1.34 42
Source: Primary Data (2015)

86
Depicted in Table 4.21 are the statistics on the respondents’ opinions. The issue statement
“We are satisfied with the services at the customs management offices in supporting our
performance”, observably, had the highest considered significant influence on firm
performance at mean 2.94, Cv = 27%. The issues had an average of mean = 2.87 and Cv
= 42%. Based on the Cv interpretation criterion by the current study that 26-50% is a
rating of “good”, the result leads to a conclusion that the economic issues in general were
considered to carry significant weight as contributory factors in firm performance.
iii) Macro-marketing Environment: Economic Issues related to Cost
The respondents were asked to determine the extent of cost effect of listed items as a
challenge in their firm performance. To make the determination thirteen items were used
to solicit the respondents opinion in a rating scale of 1 (not at all) to 5 (very large extent).
The results are in Table 4.22.
Table 4.22: Economic Issues Related to Cost
Economic Issues N Mean Std.
Deviation
Cv (%)
Land 44 3.18 1.17 36
Road transport 49 3.88 0.93 23
Rail transport 44 2.64 1.42 53
Air transport 45 3.71 1.24 33
Shipping(Sea
Transport)
47 3.79 1.16 30
Power/electricity 49 4.35 0.78 17
Water/Sewerage 47 3.70 1.06 28
Warehousing 47 3.43 1.10 32
Human
capital/labour
47 3.81 1.08 28
Information
Communication
Technology
48 3.46 1.05 30
Licenses, permits 48 3.75 0.91 24
Taxes and levies 48 3.44 1.37 39
Raw materials 47 4.06 1.01 24
Overall 3.63 1.10 30.54
Source: Primary Data (2015)

87
Results in Table 4.22 show that the cost variables rated at an average of mean = 3.63 and
Cv = 30.54% had influence that challenge the performance of EPZ firms.
iv) Macro-marketing Environment: Social Issues
In order to find out the significance of social issues in firm performance, the respondents
were asked to rate their opinions on a number of issues based on a five-point rating scale.
Descriptive statistics were then computed to determine relevant statistics such as mean
and coefficient of variance. The results are indicated in Table 4.23.
Table 4.23: Mean Scores, Standard Deviations and Coefficient of Variation (Cv) for
Macro-marketing Environment (Social Issues)
Social Issues N Mean Std.
Deviation
Cv (%)
The cost of welfare contributions affects the
performance of our firm.
43 2.14 1.04 48
We have been able to source our technical staff
locally.
48 3.69 1.17 31
Our wage/salary scales are competitively
comparable to those in the domestic.
49 3.22 1.01 31
Our wage/salary scales comparatively are
higher than those in the domestic economy.
46 2.80 1.29 46
Activities of trade union movement in EPZ
affects performance of our firm.
43 2.35 1.31 55
The attitude of the local community towards
EPZ scheme affects performance of our firm.
42 2.05 1.06 51
Overall 2.71 1.15 43
Source: Primary Data (2015)
The results in Table 4.23 show that ability to source technical staff locally (mean 3.69
and Cv = 31%), and competitiveness on wage and salaries (mean 3.22 and Cv = 31%)
influenced firm performance were considered the best contributors to firm performance.
The combined score of all the pertinent social issues within macro-marketing
environment was mean of 2.71 and Cv = 43 %, indicating a rating of “good” for the
ability of these factors to influence firm performance.

88
v) Macro-marketing Environment: Technological Issues
Respondents were asked to give their opinion on the extent to which they agree with
some technological issues as they affect firm performance. Ratings of the respondents’
opinions were then computed into relevant statistics including mean and coefficient of
variance and the results displayed in Table 4.24.
Table 4.24: Mean Scores, Standard Deviations and Coefficient of Variation (Cv) for
Macro-marketing Environment (Technological Issues)
Technological Issues N Mean Std. Deviation Cv
(%)
Good technology uptake is important in the
performance of our firm.
43 3.74 1.09 29
High cost of technical machinery and
equipment negatively affects our firm
performance.
49 3.61 1.19 32
Rapid changes in technology influences the
performance of our firm.
42 3.24 1.25 38
Technological environment affects quality of
factors of production in our firm.
48 3.29 1.22 37
Overall 3.47 1.19 34
Source: Primary Data (2015)
The results in Table 4.24 indicated that statements on the ability of the country on good
technology uptake (mean 3.74 and Cv = 29%), negative effect of apparent high cost of
technical machinery and equipment (mean 3.61 and Cv = 32%) and rapid changes in
technology (mean 3.24 and Cv = 38%). The other statement was technological effects on
the quality of factors of production (mean 3.29 and Cv = 37%) on firm performance. On
average technology issues had a mean score of 3.47 and Cv = 34%, which demonstrates
that they are important aspects of macro-marketing environment due to their considered
influence on firm performance.
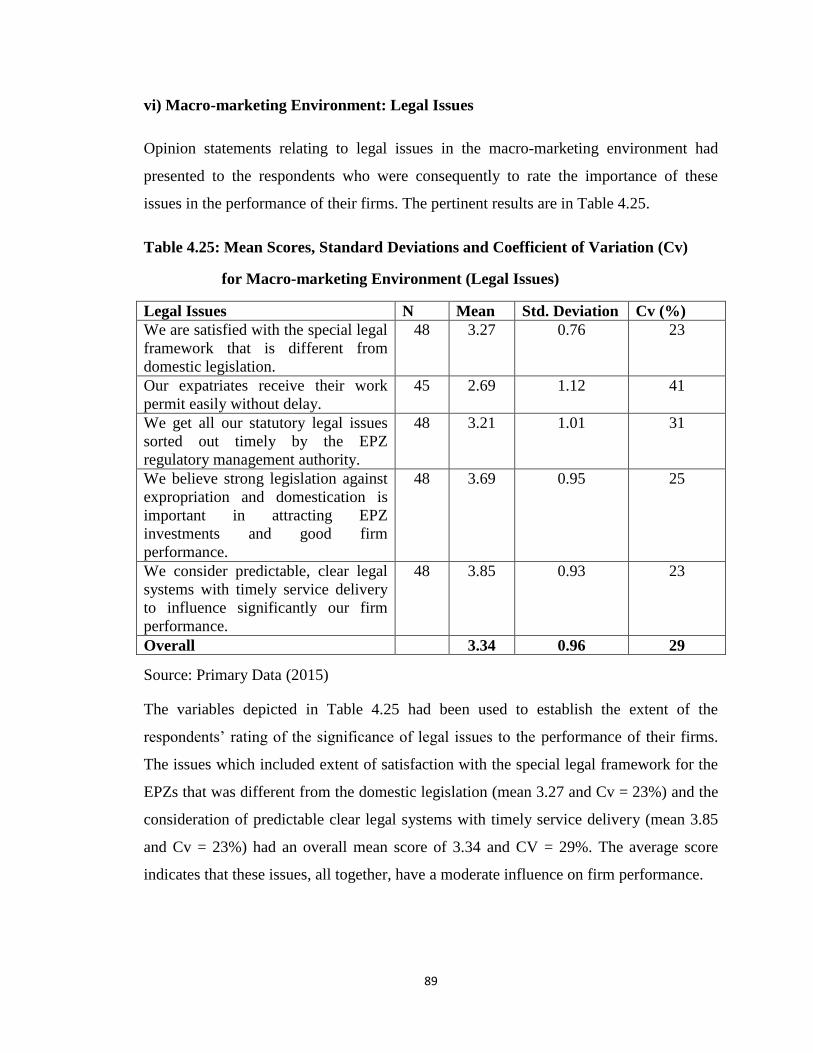
89
vi) Macro-marketing Environment: Legal Issues
Opinion statements relating to legal issues in the macro-marketing environment had
presented to the respondents who were consequently to rate the importance of these
issues in the performance of their firms. The pertinent results are in Table 4.25.
Table 4.25: Mean Scores, Standard Deviations and Coefficient of Variation (Cv)
for Macro-marketing Environment (Legal Issues)
Legal Issues N Mean Std. Deviation Cv (%)
We are satisfied with the special legal
framework that is different from
domestic legislation.
48 3.27 0.76 23
Our expatriates receive their work
permit easily without delay.
45 2.69 1.12 41
We get all our statutory legal issues
sorted out timely by the EPZ
regulatory management authority.
48 3.21 1.01 31
We believe strong legislation against
expropriation and domestication is
important in attracting EPZ
investments and good firm
performance.
48 3.69 0.95 25
We consider predictable, clear legal
systems with timely service delivery
to influence significantly our firm
performance.
48 3.85 0.93 23
Overall 3.34 0.96 29
Source: Primary Data (2015)
The variables depicted in Table 4.25 had been used to establish the extent of the
respondents’ rating of the significance of legal issues to the performance of their firms.
The issues which included extent of satisfaction with the special legal framework for the
EPZs that was different from the domestic legislation (mean 3.27 and Cv = 23%) and the
consideration of predictable clear legal systems with timely service delivery (mean 3.85
and Cv = 23%) had an overall mean score of 3.34 and CV = 29%. The average score
indicates that these issues, all together, have a moderate influence on firm performance.

90
vii) Macro-marketing Environment: Ecological Issues
The respondents’ opinions had also been sought on ecological issues and the results
presented in Table 4.26.
Table 4.26: Mean Scores, Standard Deviations and Coefficient of Variation (Cv) for
Macro-marketing Environment (Ecological Issues)
Ecological Issues N Mean Std.
Deviation
Cv (%)
Our firm undertakes energy-conserving
production processes.
49 3.20 1.24 38
We observe good waste disposal practice 49 4.10 0.85 20
Our firm supports environmental
protection activities in the community.
49 3.84 1.09 28
Our firm has overall environmental
policy observed by all employees
49 4.02 1.01 25
Overall 3.79 1.05 28
Source: Primary Data (2015)
Four variables were used to solicit opinions on ecological issues as part of the macro-
marketing environment and the results shown in Table 4.26 indicate that the statements,
“We observe good waste disposal practice (mean 4.10 and Cv = 20%)” and “Our firm has
overall environmental policy observed by all employees (mean 4.02 and Cv 25%)” had
the highest scores. This implies that the respondents considered these two issues to have
the greatest influence on firm performance compared to all the other ecological issues.
The aggregated score of the issues had a mean of 3.79 and Cv =28%, suggesting a
substantial cumulative effect on firm performance.
d. Descriptive Statistics for Firm Performance
Descriptive statistics for the dependent variable (firm performance) comprised four-
variable measurements. The variables were measured using a rating scale of 1 to 5 after
reduction of results into composite scores where 1 represented a response of “not at all”
and 5 represented “very large extent”. The coefficient of variation ratings were
determined as 0 to 25% very good, 26 to 50% good, 51 to 75% fair and 76 to 100% not
good. The results of the analysis are presented in Table 4.27.

91
Table 4.27: Mean Scores, Standard Deviations and Coefficient of Variations (Cv)
for Firm Performance
Performance Indicators N Mean Std. Deviation Cv (%)
Direct local jobs 49 2.45 0.82 33
Average foreign exchange 49 2.53 1.24 49
Technology/Skill transfer 49 2.10 1.10 52
Backward Linkages 49 1.88 0.70 37
Overall 2.24 0.97 43
Source: Primary Data (2015)
The results in Table 4.27 show that 1 sought to establish the number of direct jobs each
firm had created between the years 2011 and 2014 and had a mean score of 2.45 and Cv
=33%. Item 2 sought to establish the amount of foreign exchange the firms had earned for
the country between the years 2011 and 2014. The result was a mean score of 2.53 with
Cv = 49%. Item 3 was to find out the rate of transfer of technology/skill transfer to the
local employees between the years 2011 and 2014. The result was a mean score of 2.10
and Cv = 52%. Item 4 sought to determine the ratios of cost incurred in backward linkage
activities such as payments of local employee salaries, local employee statutory
deductions (PAYE, NSSF, NHIF), local purchases of raw materials, local utilities (water,
power, telecommunications), local transportation (maritime, land , air, rail) and local sub-
contracting. The result was a mean score of 1.88 and Cv =37%.
The performance indicators had a mean score 2.24 and Cv = 43% indicating good
performance of the firms in the EPZs in Kenya.
4.6 Screening for Outliers
General preliminary cleaning was done for wrong or missed entries in the questionnaire.
This process was followed by more screening tests the data analysis tool, SPSS. Cook’s
Distance and Z-score tests were done to identify outliers in the data. These residual
statistics were computed through regression analysis and descriptive statistics.

92
The first screening was done to detect outliers in the interaction between perceived value
of investment promotion incentives and firm performance. The results of the test showed
that there were no outliers with the maximum value of Cook's Distance at 0.187, below
the cut-off mark of 1.00. Values below this cut-off mark indicate absence of outliers in
the data while those ones above it indicate possibility of extreme values. The residuals of
Z-scores were also shown to be within the limits of -3 and +3 for minimum and
maximum values, and within a standard deviation of 1.0. Again, this showed that there
were no extreme values at either end of the data. Table 4.28 summarizes the pertinent
results.
Table 4.28: Results of Cook's Distance and Z-score Tests for Outliers in the
Interaction between Perceived Value of Investment Promotion
Incentives and Firm Performance
Residuals Statistics N Minimum Maximum Mean Std.
Deviation
Cook's Distance 49 .000 .187 .020 .031
Z-score:
Composite scores
of perceived value
of investment
promotion
incentives
49 -2.83656
1.64703
1.0
Z-score:
Composite scores
of firm
performance
49 -2.38259 1.64317 1.0
a. Dependent Variable: Composite scores of firm performance
Source: Primary Data (2015)

93
The second screening was done to detect outliers in perceived value of investment
promotion incentives and firm performance. The results of the test showed that there
were no outliers with Cook's Distance at 0.514, which is below the cut-off mark of 1.00.
Values below this cut-off mark indicate absence of outliers in the data. Besides, the Z-
scores of the composite scores of both perceived value of investment promotion
incentives and firm performance fell well within the specified boundaries of -3 and +3 for
minimum and maximum scores respectively. All the values were also within a standard
deviation of 1.00. The relevant results are in Table 4.29.
Table 4.29: Results of Cook's Distance and Z-score Tests for Outliers in the
Interaction among Perceived Value of Investment Promotion Incentives,
Macro-marketing Environment and Firm Performance
Residuals
Statistics
N Minimum Maximum Mean Std. Deviation
Cook's Distance 49 .000 .514 .030 .080
Z-score:
Composite scores
of Perceived
Value of
investment
promotion
incentives
49 -2.83656 1.64703 1.0
Z-score:
Composite scores
of macro-
marketing
environment
49 -1.97949 1.48461 1.0
Z-score:
Composite scores
of firm
performance
49 -2.38259 1.64317 1.0
a. Dependent Variable: Composite scores of firm performance
Source: Primary Data (2015)

94
The third screening was done to detect outliers in the interaction among perceived value
of investment promotion incentives, organizational characteristics and firm performance.
The results of the test indicated were no outliers, with Cook's Distance, based on the
bottom line of 1.00, returning a value of 0.929—below the cut-off mark. The Z-scores
computed for the composite scores of each of the variables equally showed lack of
extreme values, falling within the standard limits of -3 minimum and +3 maximum. The
standard deviation was 1.00 in each case. The pertinent results are contained in Table
4.30.
Table 4.30: Results of Cook's Distance and Z-scores Tests for Outliers in the
Interaction among Perceived Value of Investment Promotion Incentives,
Organizational Characteristics and Firm Performance
Residuals Statistics N Minimum Maximu
m
Mean Std.
Deviation
Cook's Distance 49 .000 .929 .047 .147
Z-score: Composite
scores of perceived
value of investment
promotion
incentives
49 -2.837 1.647 1.0
Z-score: Composite
scores of
organizational
characteristics
49 -2.397 1.618 1.0
Z-score: Composite
scores of firm
performance
49 -2.383 1.643 1.0
a. Dependent Variable: Composite scores of firm performance
Source: Primary Data (2015)
The fourth screening was done to detect outliers in the interaction among perceived value
of investment promotion incentives, organizational characteristics, macro-marketing

95
environment and firm performance. The results of the test showed that there were no
outliers with Cook's Distance at 0.81, which is below the cut-off mark of 1.00. The Z-
scores for all the composite scores for all the variables fell well within the specified
boundaries of -3 and +3 for minimum and maximum in that order, and 1.00 standard
deviation in each case. The results revealed no extreme values in the data. The results are
summarized in Table 4.31.
Table 4.31: Results of Cook's Distance and Z-score Tests for Outliers in the
Interaction among Perceived Value of Investment Promotion Incentives,
Organizational Characteristics, Macro-marketing Environment and
Firm Performance
Residual Statistics N Minimum Maximum Mean Std. Deviation
Cook's Distance 49 .000 .81 .049 .143
Z-score: Composite
scores of Perceived
value of Investment
Promotion
Incentives
49 -2.84 1.647 1.00
Z-score:
Organizational
characteristics
49 -2.43 1.618 1.00
Z-score: Composite
scores of Macro-
marketing
environment
49 -1.979 1.485 1.000
Z-score: Composite
scores of firm
performance
49 -2.383 1.643 1.000
a. Dependent Variable: Composite scores of firm performance
Source: Primary Data (2015)

96
4.7 Correlation Analysis
Correlation analysis was performed using Pearson Product Moment Correlation
Coefficient technique. This was to establish the extent of relationship between perceived
value of investment promotion incentives, organizational characteristics, macro-
marketing environment and firm performance. Table 4.32 shows the results of the
analysis.
Table 4.32: Correlation Analysis
Source: Primary Data (2015)
The results in Table 4.32 indicate that the relationship between perceived value of
investment promotion incentives and firm performance is weak, positive and statistically
significant (R = .340, p = .017). The relationship between organizational characteristics
and firm performance is strong, positive and statistically significant (R = .674, p = .000).
Macro-marketing environment is positively strongly related to firm performance. The
relationship is also statistically significant (R= .439, p = .002)
Variable 1 2 3 4
1. Composite scores of
perceived value of
investment promotion
incentives
Pearson
Correlation
1
Sig. (2-tailed)
2. Composite scores of
organizational
characteristics
Pearson
Correlation
.115 1
Sig. (2-tailed) .430
3. Composite scores of
macro-marketing
environment
Pearson
Correlation
.335*
.662**
1
Sig. (2-tailed) .019 .000
4. Composite scores of
firm performance
Pearson
Correlation
.340*
.674**
.439**
1
Sig. (2-tailed) .017 .000 .002
*. Correlation is significant at the 0.05 level (2-tailed).
**. Correlation is significant at the 0.01 level (2-tailed).

97
4.8 Tests of Hypotheses
The hypotheses were tested through inferential statistics to establish the statistical
significance using linear, multiple and stepwise regression analyses at 95% confidence
level. The moderation effect was tested using path analysis to establish the causal
relationships (Baron & Kenny, 1986). Apart from the design of the hypotheses, the study
objectives, typology of the data (for example, reduction of the data into composite scores)
and the measurement scales informed the type of the analytical tools used.
4.8.1 Perceived Value of Investment Promotion Incentives and Firm Performance
The first objective of this study was to determine the influence of perceived value of
investment promotion incentives on firm performance. Respondents had been asked to
indicate using a rating scale ranging from 1 (not at all) to 5 (very large extent) the extent
to which investment promotion incentives contributed to their firm’s performance.
To determine the relationship, the study had developed the following hypothesis:
H1: Perceived value of investment promotion incentives have statistically significant
influence on Firm Performance.
The results of the regression test are presented in Table 4.33.

98
Table 4.33(a): Regression Results for the Influence of Perceived Value of Investment Promotion Incentives on Firm
Performance
Model R R2 Adjusted
R2
Std. Error of
the Estimate
Change Statistics
R Square Change F Change df1 df2 Sig. F Change
1 .340a .115 .096 .94445 .115 6.126 1 47 .017
a. Predictors: (Constant), Composite scores of perceived value of investment promotion incentives
Source: Primary Data (2015)
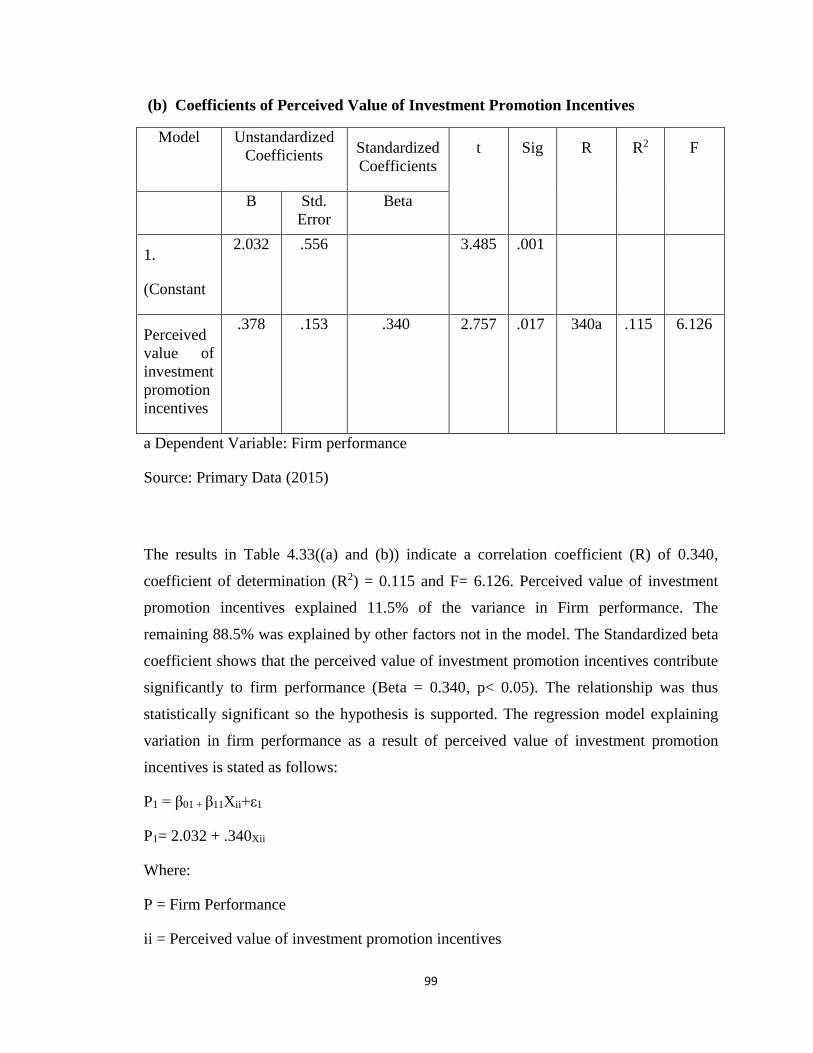
99
(b) Coefficients of Perceived Value of Investment Promotion Incentives
Model Unstandardized
Coefficients Standardized
Coefficients
t Sig R R2 F
B Std.
Error
Beta
1.
(Constant
2.032 .556 3.485 .001
Perceived
value of
investment
promotion
incentives
.378 .153 .340 2.757 .017 340a .115 6.126
a Dependent Variable: Firm performance
Source: Primary Data (2015)
The results in Table 4.33((a) and (b)) indicate a correlation coefficient (R) of 0.340,
coefficient of determination (R2) = 0.115 and F= 6.126. Perceived value of investment
promotion incentives explained 11.5% of the variance in Firm performance. The
remaining 88.5% was explained by other factors not in the model. The Standardized beta
coefficient shows that the perceived value of investment promotion incentives contribute
significantly to firm performance (Beta = 0.340, p< 0.05). The relationship was thus
statistically significant so the hypothesis is supported. The regression model explaining
variation in firm performance as a result of perceived value of investment promotion
incentives is stated as follows:
P1 = β01 + β11Xii+ε1
P1= 2.032 + .340Xii
Where:
P = Firm Performance
ii = Perceived value of investment promotion incentives

100
The regression equation above shows that a unit change in perceived value of investment
promotion incentives causes an increase of 0.340 in firm performance. This implies that
when a country offers investment promotion incentives the investors in the EPZs achieve
an increase of 0.340 in their firm’s performance.
4.8.2 Organizational Characteristics and Firm Performance
The second objective of the study was to assess the extent to which organizational
characteristics is related to firm performance. In order to assess the significance of the
relationship between organizational characteristics and firm performance the following
hypothesis was formulated:
H2: Organizational characteristics have statistically significant influence firm
performance.
The respondents had been asked to state their opinions using a scale of 1 to 5 with 1
denoting “not at all” and 5 denoting “very large extent”. The five items in the variable
included views on how experience in the industry positively affected performance,
quality of human resource, influence of investment size on performance and the effect of
ownership structure on competitive advantage over competitors. The hypothesis was
tested using bivariate correlation analysis. Further analysis was done to determine the
strength of the relationship established in hypothesis 2. This was because the correlation
model did not provide the option for testing the strength of the relationship. The value of
Crammer’s V was thus computed through cross tabulation and the strength of the
relationship determined. Table 4.34 presents the correlation results for the relationship
between organizational characteristics and firm performance.
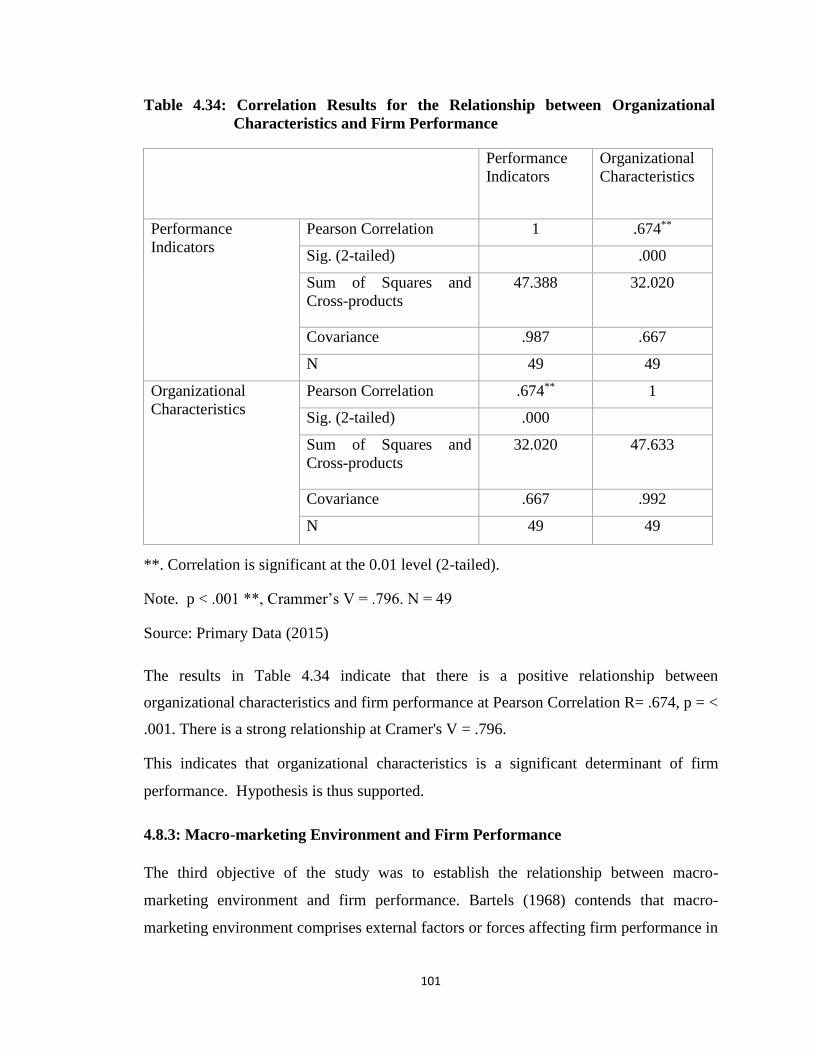
101
Table 4.34: Correlation Results for the Relationship between Organizational
Characteristics and Firm Performance
Performance
Indicators
Organizational
Characteristics
Performance
Indicators
Pearson Correlation 1 .674**
Sig. (2-tailed) .000
Sum of Squares and
Cross-products
47.388 32.020
Covariance .987 .667
N 49 49
Organizational
Characteristics
Pearson Correlation .674** 1
Sig. (2-tailed) .000
Sum of Squares and
Cross-products
32.020 47.633
Covariance .667 .992
N 49 49
**. Correlation is significant at the 0.01 level (2-tailed).
Note. p < .001 **, Crammer’s V = .796. N = 49
Source: Primary Data (2015)
The results in Table 4.34 indicate that there is a positive relationship between
organizational characteristics and firm performance at Pearson Correlation R= .674, p = <
.001. There is a strong relationship at Cramer's V = .796.
This indicates that organizational characteristics is a significant determinant of firm
performance. Hypothesis is thus supported.
4.8.3: Macro-marketing Environment and Firm Performance
The third objective of the study was to establish the relationship between macro-
marketing environment and firm performance. Bartels (1968) contends that macro-
marketing environment comprises external factors or forces affecting firm performance in

102
its interaction with each marketing system. This study was driven by the premise that
macro-marketing environment has moderating influence on the performance of firms in
the EPZs. To test the relationship between macro-marketing environment and firm
performance the following hypothesis was formulated:
H3: Macro-marketing environment has statistically significant relationship with firm
performance.
The respondents had been asked to state their opinions or perceptions about the relevant
attributes using a scale ranging from 1 (not at all) to 5 (very large extent). Correlation
analysis was used to test the hypothesis. The strength of the relationship was then tested
by computing the value of Crammer’s V through cross tabulation. The pertinent results
are contained in Table 4.35.
Table 4.35: Correlation Results for the Relationship between Macro-marketing
Environment and Firm Performance
Firm Performance Macro-
Marketing
Environment
Firm performance Pearson Correlation 1 .439**
Sig. (2-tailed) .002
Sum of Squares and
Cross-products
47.388 18.143
Covariance .987 .378
N 49 49
Macro-marketing
environment
Pearson Correlation .439** 1
Sig. (2-tailed) .002
Sum of Squares and
Cross-products
18.143 36.000
Covariance .378 .750
N 49 49
**. Correlation is significant at the 0.01 level (2-tailed).
Note. p < .01**. Cramer's V = .546. N = 49
Source: Primary Data (2015)

103
The results in Table 4.35 imply that macro-marketing environment and firm performance
are positively significantly correlated (R = .439, p < .01). The relationship is a strong one
(Cramer's V = .546). Macro-marketing environment is therefore an important factor in
firm performance in the EPZs. The hypothesis is therefore supported.
4.8.3 Macro-marketing Environment, Perceived Value of Investment Promotion
Incentives and Firm Performance
The fourth objective of the study was to investigate the influence of macro-marketing
environment on the relationship between perceived value of investment promotion
incentives and firm performance. Thirty-nine macro-marketing environment items were
used in the study.
To test the influence of macro-marketing environment on the relationship between
perceived value of investment promotion incentives and firm performance the following
hypothesis was formulated:
H4: Macro-marketing environment has statistically significant moderating influence on
the relationship between perceived value of investment promotion incentives and
firm performance.
The respondents had been asked to state their opinions or perception about the issues
using a scale of 1 (not at all) to 5 (very large extent). All the relevant sub-variables had
their averages computed into composite scores before being regressed against the
composite scores of organizational performance. To test for moderating effect, Baron and
Kenny’s (1986) four-step method was used. It includes computing two regression models
using hierarchical multiple linear regression method. In the first step, the main effects of
perceived value of investment promotion incentives (independent variable) and macro-
marketing environment (moderating variable) on firm performance were tested. The next
step involved testing the interaction between the independent and moderating variables.
The significance of the independent variable and the moderator is not particularly
relevant in determining moderation (Njeru, 2013). There is assumed a moderation effect

104
if the interaction between perceived value of investment promotion incentives and macro-
marketing environment is statistically significant.
To create an interaction term, the product of perceived value of investment promotion
incentives and macro-marketing environment was calculated. The multiplicative term had
the risk of multicollinearity so the two variables had their z-scores calculated and used to
derive an interaction variable. The pertinent results are contained in Table 4. 36.
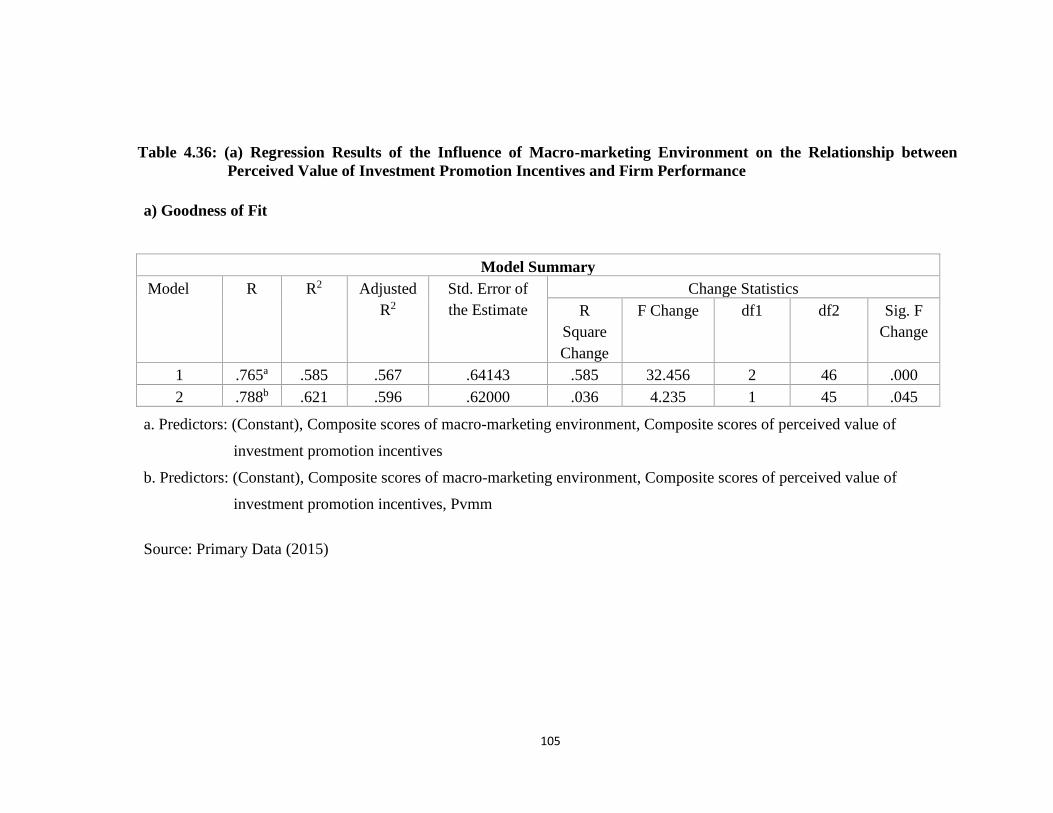
105
Table 4.36: (a) Regression Results of the Influence of Macro-marketing Environment on the Relationship between
Perceived Value of Investment Promotion Incentives and Firm Performance
a) Goodness of Fit
Model Summary
Model R R2 Adjusted
R2
Std. Error of
the Estimate
Change Statistics
R
Square
Change
F Change df1 df2 Sig. F
Change
1 .765a .585 .567 .64143 .585 32.456 2 46 .000
2 .788b .621 .596 .62000 .036 4.235 1 45 .045
a. Predictors: (Constant), Composite scores of macro-marketing environment, Composite scores of perceived value of
investment promotion incentives
b. Predictors: (Constant), Composite scores of macro-marketing environment, Composite scores of perceived value of
investment promotion incentives, Pvmm
Source: Primary Data (2015)

106
Table 4.36 (b) Overall Significance of the Influence of Macro-marketing
Environment on the Relationship between Perceived Value of Investment
Promotion Incentives and Firm Performance
Model Sum of
Squares
df Mean
Square
F Sig.
1 Regression 26.707 2 13.353 32.456 .000b
Residual 18.926 46 .411
Total 45.633 48
2 Regression 28.335 3 9.445 24.571 .000c
Residual 17.298 45 .384
Total 45.633 48
a. Dependent Variable: Composite scores of firm performance
b. Predictors: (Constant), Composite scores of macro-marketing environment, Composite
scores of perceived value of investment promotion incentives
c. Predictors: (Constant), Composite scores of macro-marketing environment, Composite
scores of perceived value of investment promotion incentives, Pvmm
Source: Primary Data (2015)

107
Table 4.36 (c) Individual Significance of the Influence of Perceived Value of
Investment Promotion Incentives, Macro-marketing Environment and the
Interaction Term on Firm Performance
Model Unstandardized
Coefficients
Standardized
Coefficients
t Sig.
B Std. Error Beta
1 (Constant) -.021 .442 -.047 .963
Composite scores of
perceived value of
investment
promotion incentives
.261 .100 .263 2.607 .012
Composite scores of
macro-marketing
environment
.696 .111 .635 6.296 .000
2 (Constant) -.094 .429 -.218 .828
Composite scores of
perceived value of
investment
promotion incentives
.230 .098 .232 2.349 .023
Composite scores of
macro-marketing
environment
.757 .111 .691 6.827 .000
Product of composite
scores of perceived
value of investment
promotion incentives
and macro-marketing
environment
-.138 .067 -.197 -
2.058
.045
a. Dependent Variable: Composite scores of firm performance
Source: Primary Data (2015)
The results in Table 4.36 reveal a correlation coefficient (R) = .765, coefficient of
determination, R2 = .585 and F = 32.456. Perceived value of investment promotion
incentives and macro-marketing environment explained 58.5% of the variance in
performance. The results also reveal that R2 value changed by 3.6 % from .585 to .621
with the addition of the multiplicative term (perceived value of investment promotion
incentives*macro-marketing environment). Besides, the result was statistically significant,

108
at p = .045. The overall significance results also reveal a statistically significant
relationship between perceived value of investment promotion incentives, macro-
marketing environment, interaction term and firm performance (F =24.571, p =.000),
explaining the fitness of the model.
The results in model 2, Table 4.36(c) shows a statistically significant relationship between
perceived value of investment promotion incentives and firm performance (β =.232, p =
.023). The relationship between macro-marketing environment and firm performance is
also statistically significant (β = .691, p = .000). The interactive term also had a
statistically significant relationship with firm performance. There was a statistically
significant relationship between the interaction term and firm performance (β = -.197, p =
.045). The results indicate that moderates the relationship between perceived value of
investment promotion incentives and firm performance. The hypothesis is therefore
supported. It means that certain changes in the macro-marketing environment may
negatively affect the relationship between perceived value of investment promotion
incentives and firm performance.
Moderation path diagram is contained in Figure 4.1.

109
Figure 4.1: Moderation Path Diagram of the Effect of Macro-marketing
Environment
(a)Conceptual Diagram
b) Statistical Diagram
Source: Primary Data (2015)
The multiple regression equation for estimating the moderation effect of macro-
marketing environment on the relationship between perceived value of investment
promotion incentives and firm performance is as follows:
P4 =β04+ β14X ii + β24Xmm+ β24XiiXmm + ε4
P = -.094+ .232Xii + .691Xmm -.197Xiimm
Where:
P = Firm performance
ii= Perceived value of investment promotion incentives
mm = Macro-marketing environment
iimm = Interaction term
P = Performance
ii = Independent variable
mm = Moderating variable
iimm =the interaction term
Ԑ = Error term
β1 = .232
β2 = .691
β3 = -.197
p
Ԑ
ii
H4
mm
p
iimm
ii
mm

110
The regression equation shows that a unit change in perceived value of investment
promotion incentives results in an increase of 0.232 in firm performance. A unit change
in macro-marketing environment results in an increase of 0.691 in firm performance.
Conversely, a unit change in the product of perceived value of investment promotion
incentives and macro-marketing environment leads to a decrease of 0.197 in firm
performance. The equation gives empirical validity to the hypothesis that macro-
marketing environment plays a significant moderating role on the relationship between
perceived value of investment promotion incentives and firm performance.
4.8.4 Organizational Characteristics, Perceived Value of Investment Promotion
Incentives and Firm performance
The fifth objective of the study was to determine the extent to which organizational
characteristics affect the relationship between perceived value of investment promotion
incentives and firm performance. To test the moderation effect, the following hypothesis
was formulated:
H5: Organizational characteristics have statistically significant moderating effect on the
relationship between perceived value of investment promotion incentives and firm
performance.
The respondents had been asked to state their opinions or perceptions about the issues
using a scale of 1 (not at all) to 5 (very large extent). All the sub-variables then had their
averages computed into composite scores. The scores were then entered, at the same
time, in a regression model and used to test for the moderating influence of
organizational characteristics on the relationship between perceived value of investment
promotion incentives and firm performance. Hierarchical multiple linear regression
analysis based on Baron and Kenny’s (1986) four-step method was used to test the
hypothesis. The results are contained in Table 4.37.

111
Table 4.37: Regression Results of the Moderating Influence of Organizational Characteristics on the Relationship
between Perceived Value of Investment Promotion Incentives and Firm Performance
(a) Goodness of Fit
Model Summary
Model R R2 Adjusted
R2
Std. Error
of the
Estimate
Change Statistics
R Square
Change
F Change Df
1
Df
2
Sig. F
Change
1 .725a .525 .504 .68641 .525 25.427 2 46 .000
2 .763b .582 .554 .65144 .056 6.071 1 45 .018
a. Predictors: (Constant), Composite scores of organizational characteristics, Composite scores of perceived value of
investment promotion incentives
b. Predictors: (Constant), Composite scores of organizational characteristics, Composite scores of perceived value of
investment promotion incentives, iioc
Source: Primary Data (2015)

112
(b) Overall Significance of the Influence of Organizational Characteristics on the
Relationship between Perceived Value of Investment Promotion Incentives
and Firm Performance
Model Sum of
Squares
df Mean Square F Sig.
1 Regression 23.960 2 11.980 25.427 .000b
Residual 21.673 46 .471
Total 45.633 48
2 Regression 26.536 3 8.845 20.843 .000c
Residual 19.097 45 .424
Total 45.633 48
a. Dependent Variable: Composite scores of firm performance
b. Predictors: (Constant), Composite scores of organizational characteristics, Composite
scores of perceived value of investment promotion incentives
c. Predictors: (Constant), Composite scores of organizational characteristics, Composite
scores of perceived value of investment promotion incentives, iioc
Source: Primary Data (2015)

113
(c) Individual Significance of the Influence of Perceived Value of Investment
Promotion Incentives, Organizational Characteristics and the Interaction Term
on Firm Performance
Model Unstandardized
Coefficients
Standardized
Coefficients
t Sig.
B Std.
Error
Beta
1 (Constant) -.173 .510 -.340 .736
Composite scores
of perceived value
of investment
promotion
incentives
.378 .103 .380 3.685 .001
Composite scores
of organizational
characteristics
.623 .116 .554 5.365 .000
2 (Constant) .026 .491 .053 .958
Composite scores
of perceived value
of investment
promotion
incentives
.330 .099 .332 3.324 .002
Composite scores
of organizational
characteristics
.606 .111 .538 5.480 .000
Product of
composite scores
of perceived value
of investment
promotion
incentives and
organizational
characteristics
.197 .080 .244 2.464 .018
a. Dependent Variable: Composite scores of firm performance
Source: Primary Data (2015)
The results in Table 4.37(a) reveal coefficient of determination (R2 = .525) and F =
25.427. Perceived value of investment promotion incentives and organizational
characteristics explained 52.5% of the variance in firm performance. The results also
reveal that R2 value changed by 5.7% from .525 to .582 of the multiplicative term

114
(perceived value of investment promotion incentives* organizational characteristics). The
change was statistically significant, at p = .018
The overall results also reveal the relationship between perceived value of investment
promotion incentives, organizational characteristics, interaction term and firm
performance is statistically significant (F = 20.843; p = 0.000), explaining the fitness of
the model.
In model 2, Table 4.37(c) the results show that there is a statistically significant
relationship between perceived value of investment promotion incentives and firm
performance (β = .332, p = .002). There is a statistically significant relationship between
organizational characteristics and firm performance (β = .538, p =.000). The interaction
term and firm performance had a statistically significant relationship (β = .244, p = .018).
The result implies that organizational characteristics moderate the relationship between
perceived value of investment promotion incentives and firm performance. The
hypotheses is therefore supported. This means that changes in organizational
characteristics may positively affect the relationship between perceived value of
investment promotion incentives and firm performance.
Figure 4.2 contains the path diagram illustrating the moderation effect.

115
Figure 4.2: Moderation Path Diagram of the Effect of Organizational
Characteristics
(a)Conceptual Diagram
b) Statistical Diagram
Source: Primary Data (2015)
The multiple regression equation for estimating the moderating effect of organizational
characteristics on the relationship between perceived value of investment promotion
incentives and firm performance is as follows:
P5 = β05 +β15Xii + βXoc + β25Xiioc + ε5
P = .026+ .332Xii + .538Xoc + .244Xiioc
Where:
P = Firm performance
ii= Perceived value of investment promotion incentives
oc = organizational characteristics
Ԑ5 = Error term
The regression equation suggests that a unit change in perceived value of investment
promotion incentives causes an increase of 0.332 in firm performance. A unit change in
ii = Independent variable
oc = Moderating variable
iioc =The interaction term
Ԑ = Error term
β1 = .332
β2 = .538
β3 = .244
p
Ԑ
ii
H5
oc
p
iioc
ii
oc

116
organizational characteristics causes an increase of 0.538 in firm performance. However,
a unit change in the product of perceived value of investment promotion incentives and
organizational characteristics causes an increase of 0.244 in firm performance. The
equation lends credence to the hypothesis by illustrating that organizational
characteristics are significant moderating factors in firm performance.
4.8.5 Perceived Value of Investment Promotion Incentives, Organizational
Characteristics, Macro-marketing Environment and Firm Performance
The last objective of the study was to examine the extent to which perceived value of
investment promotion incentives, organizational characteristics and macro-marketing
environment jointly influence firm performance.
To test the significance of joint influence of perceived value of investment promotion
incentives, organizational characteristics and macro-marketing environment on firm
performance the following hypothesis was formulated.
H6: Perceived value of investment promotion incentives, organizational characteristics
and macro-marketing environment have statistically significant joint influence on
firm performance.
Stepwise multiple regression was conducted to establish the joint effect of perceived
value of investment promotion incentives, organizational characteristics and macro-
marketing environment on firm performance. The pertinent results are contained in Table
4. 38.

117
Table 4.38: Regression Results of the Test of the Joint Influence of Perceived Value of Investment Promotion
Incentives, Organizational Characteristics and Macro-marketing Environment on Firm Performance
(First Analysis)
(a) Goodness of Fit
Model R R2 Adjusted
R Square
Std. Error of
the Estimate
Change Statistics
R Square
Change
F
Change
df1 df2 Sig. F
Change
1 .674a .454 .443 .74180 .454 39.118 1 47 .000
2 .724b .524 .503 .70045 .070 6.713 1 46 .013
a. Predictors: (Constant), Composite scores of organizational characteristics
b. Predictors: (Constant), Composite scores of organizational characteristics, Composite scores of perceived value of
investment promotion incentives
Source: Primary data (2015)

118
(b) Overall Significance of the Joint Influence of Perceived Value of Investment
Promotion Incentives, Organizational Characteristics and Macro-marketing
Environment on Firm Performance
Model Sum of Squares Df Mean Square F Sig.
1 Regression 21.525 1 21.525 39.118 .000b
Residual 25.862 47 .550
Total 47.388 48
2 Regression 24.819 2 12.409 25.293 .000c
Residual 22.569 46 .491
Total 47.388 48
a. Dependent Variable: Composite scores of firm performance;
b. Predictors: (Constant), Composite scores of organizational characteristics
c. Predictors: (Constant), Composite scores of organizational characteristics, Composite
scores of perceived value of investment promotion incentives
Source: Primary Data
(c) Individual Significance of the Influence of Perceived Value of Investment
Promotion Incentives, Organizational Characteristics and Macro-marketing
Environment on Firm Performance
Model Unstandardized
Coefficients
Standardized
Coefficients
T Sig.
B Std. Error Beta
1 (Constant) 1.090 .379 2.874 .006
Composite scores
of organizational
characteristics
.672 .107 .674 6.254 .000
2 (Constant) .150 .510 .294 .770
Composite scores
of organizational
characteristics
.642 .102 .643 6.281 .000
Composite scores
of perceived
value of
investment
promotion
incentives
.296 .114 .265 2.591 .013
Source: Primary Data (2015)

119
The results in Table 4.38 indicate perceived value of investment promotion incentives,
organizational characteristics and macro-marketing environment were regressed against
firm performance. Organizational characteristics was entered first into the regression
equation and was significantly related to firm performance (F = 39.118, p = .000). The
multiple coefficient of determination (R2) was .454 thus accounting for 45.4 % of the
variation in firm performance.
Second, perceived value of investment promotion incentives was entered in the equation
and was statistically significantly related to firm performance (R2 = .524; F = 25.293; p =
.000). Lastly, macro-marketing environment was removed from the analysis, retaining
only organizational characteristics and perceived value of investment promotion
incentives, with coefficient of determination = .524, explaining 52.4% of the variation in
firm performance. The coefficient of determination (R2) when firm performance was
regressed on perceived value of investment promotion incentives alone was .115 (Table
4.33). This result meant that there was a considerable change of 40.9% (.524 - .115)
Overall, the model showed statistical significance at p = <.001. The joint influence was
thus statistically significant and as such, the hypothesis is supported.
Joint Influence Test (Second Analysis)
In the second analysis, multiple linear regression was computed to test the contributory
effect of only perceived value of investment promotion incentives and organizational
characteristics on firm performance. This is because the other variable, macro-marketing
environment, had been excluded in the stepwise multiple regression in the first analysis.
Firm performance was thus regressed on these two variables and the relevant results
presented in Table 4.39.

120
Table 4.39: Regression Results of the Joint Influence of Perceived Value of Investment Promotion Incentives,
Organizational Characteristics and Macro-marketing Environment on Firm Performance (Second
Analysis)
(a) Goodness of Fit
Model R R2 Adjusted R
Square
Std. Error of
the Estimate
Change Statistics
R Square
Change
F Change df1 df2 Sig. F Change
1 .724a .524 .503 .70045 .524 25.293 2 46 .000
a. Predictors: (Constant), Composite scores of organizational characteristics, Composite scores of perceived value of
investment promotion incentives
Source: Primary Data (2015)

121
(b) Overall Significance of the Joint Influence of Perceived Value of Investment
Promotion Incentives and Organizational Characteristics on Firm Performance
Model Sum of Squares Df Mean Square F Sig.
1 Regression 23.747 1 23.747 46.729 .000b
Residual 23.885 47 .508
Total 47.633 48
2 Regression 27.856 2 13.928 32.397 .000c
Residual 19.776 46 .430
Total 47.633 48
a. Dependent Variable: Performance Indicators
b. Predictors: (Constant), Organizational Characteristics
c. Predictors: (Constant), Organizational Characteristics, Perceived value of performance
incentives
Source: Primary Data (2015)
(c) Individual Significance of Perceived Value of Investment Promotion Incentives
and Organizational Characteristics on Firm Performance
Model Unstandardized
Coefficients
Standardized
Coefficients
T Sig. R2
B Std.
Error
Beta
(Constant) .996 .364 2.732 .009
Organizational
Characteristics
.706 .103 .706 6.836 .000
(Constant) -.054 .477 -.114 .910
Organizational
Characteristics
.672 .096 .672 7.026 .000
Perceived value
of performance
incentives
.330 .107 .296 3.092 .003 .524
a Dependent Variable: Firm performance
Source: Primary Data (2015)
The results in Table 4.39 reveal that perceived value of investment promotion incentives
and organizational characteristics jointly have a statistically significant influence firm
performance at F statistic (25.293) p = .000.

122
The coefficient of determination (R2) = .524, accounting for 52.4% of the variation in
firm performance. The coefficient of determination (R2) when firm performance was
regressed on perceived value of investment promotion incentives alone was .115 (Table
4.33). This result meant that there was a considerable change of 40.9% (.524 - .115) in
the variation in performance with the addition of organizational characteristics to the
regression model.
The results also confirm the variation explained in the first analysis (stepwise multiple
regression) with the exclusion of macro-marketing environment. Moreover, it implies that
47.6 % of variation in firm performance was unexplained (explained by other factors).
The standardized coefficients indicate that organizational characteristics and perceived
value of investment promotion incentives have a joint significant contribution to firm
performance (Perceived value of investment promotion incentives, Beta = 296;
organizational characteristics, Beta = 672; R2 = .524, p < 0.01). F statistic (32.397) was
significant at .000 explaining fitness of the regression model.
It is evident that the overall significance (F = 25.293; p = .000) is different from the one
in the second analysis (F = 32.397; p = .000). The result implies that although macro-
marketing environment was excluded in the first analysis, it contributes to the overall
significance. The joint influence of the three variables on firm performance was thus
statistically significant and the hypothesis is supported.
The multiple regression equation for the joint significance test is as follows:
P= β06 + β6Xii+β6Xoc +ε6
P=- .-054 + .296Xii +.672Xoc
Where:
P = Firm performance
Xii = Investment Incentives
Xoc = Organizational Characteristics
The regression equation gives an indication that a unit change in perceived value of
investment promotion incentives causes an increase of 0.296 in firm performance.

123
However, one unit change in organizational characteristics causes a change of 0.672 in
firm performance. The equation is an empirical validation and support of the hypothesis
that jointly, perceived value of investment promotion incentives, organizational
characteristics and macro-marketing environment significantly influence firm
performance.
4.8.6 Summary of Research Objectives, Hypotheses, Results and Interpretation
The overarching objective of the study was to make inferences on the moderating
influence of organizational characteristics and macro-marketing (each one separately) on
the relationship between perceived value of investment promotion incentives and firm
performance. All the hypotheses tested were supported. Table 4.40 summarizes the
research objectives, hypotheses, results and interpretation.
Table 4.40: Summary of Research Objectives, Hypotheses, Results and
Interpretation
Objectives Hypotheses R2 p-
value
F-statistic Interpretation Conclusion
1. To
determine
the influence
of perceived
value of
investment
promotion
incentives
on firm
performance
H1: Perceived
value of
investment
promotion
incentives
have
statistically
significant
influence on
firm
performance
.115 .017 6.126 -Perceived
value of
investment
promotion
incentives is a
statistically
significant
predictor of
firm
performance
-Hypothesis 1 is
supported
H1 is
supported

124
Objectives Hypotheses R2 p-
value
F-statistic Interpretation Conclusion
2. To assess
the extent of
to which
organization
characteristi
cs relate to
firm
performance
H2: Organizational
characteristics
have a
statistically
significant
relationship
with firm
performance
.674 .000 -Organizational
has a strong
relationship
with firm
performance at
Crammer’s V =
.796
H2 is
supported
3. To establish
the extent to
which
macro-
marketing
environment
relates to
firm
performance
H3: Macro-
marketing
environment
has
statistically
significant
relationship
with firm
performance
.439 .002 -Macro-
marketing
environment
has a strong
relationship
with firm
performance at
Crammer’s V =
.546
H3 is
supported
4. To
investigate
the influence
of macro-
marketing
environment
on the
relationship
between
perceived
value of
investment
promotion
incentives
and firm
performance
H4: Macro-
marketing
environment
has
statistically
significant
moderating
influence on
the
relationship
between
perceived
value of
investment
promotion
incentives and
Firm
Performance.
.621 .045 24.571 -Macro-
marketing
environment
has a significant
moderating
influence on the
relationship
between
perceived value
of investment
promotion
incentives and
firm
performance
H4 is
supported
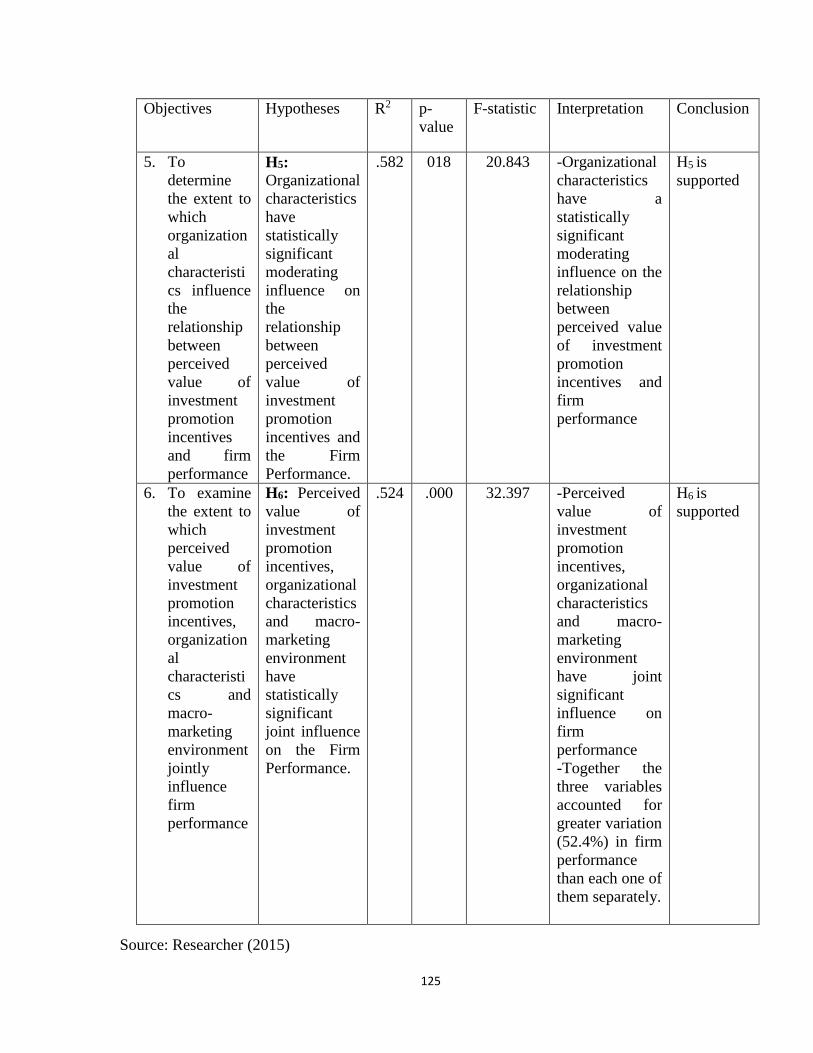
125
Objectives Hypotheses R2 p-
value
F-statistic Interpretation Conclusion
5. To
determine
the extent to
which
organization
al
characteristi
cs influence
the
relationship
between
perceived
value of
investment
promotion
incentives
and firm
performance
H5:
Organizational
characteristics
have
statistically
significant
moderating
influence on
the
relationship
between
perceived
value of
investment
promotion
incentives and
the Firm
Performance.
.582 018 20.843 -Organizational
characteristics
have a
statistically
significant
moderating
influence on the
relationship
between
perceived value
of investment
promotion
incentives and
firm
performance
H5 is
supported
6. To examine
the extent to
which
perceived
value of
investment
promotion
incentives,
organization
al
characteristi
cs and
macro-
marketing
environment
jointly
influence
firm
performance
H6: Perceived
value of
investment
promotion
incentives,
organizational
characteristics
and macro-
marketing
environment
have
statistically
significant
joint influence
on the Firm
Performance.
.524 .000 32.397 -Perceived
value of
investment
promotion
incentives,
organizational
characteristics
and macro-
marketing
environment
have joint
significant
influence on
firm
performance
-Together the
three variables
accounted for
greater variation
(52.4%) in firm
performance
than each one of
them separately.
H6 is
supported
Source: Researcher (2015)

126
4.8.7 Empirical Model
Empirical model of the study was developed based on the key variables used to construct
the conceptual framework. The model provides an enhancement of the framework by
linking the variables to the results of the hypotheses tested. Figure 4.3 depicts the
empirical model of the study variables.

127
Figure 4.3: Empirical Model of the Study Variables
+.218Xi
Source: Researcher (2015)
Moderating Variable H4 = P4 = -.094+ .232Xii + .691Xmm -.197Xiimm
Independent Variable Dependent Variable
H6:
P6=
-.0
54+
.296X
ii +
.672X
oc
H2: R =. 674
H3:
R =
.439
Moderating Variable H5: P5= .026+ .332Xii + .538Xoc + .244Xiioc
H1: P1 = 2.032 + .340Xii
Perceived Value of Investment
Promotion Incentives
Forex rates
Duty & tax exemptions
Repatriation of capital & profits
Forex account maintenance
Quota-free import of capital &
intermediate goods
Land use policy
One-stop shop
Firm Performance
Financial
Foreign exchange
earnings
Local employee levies
Non-financial
Employment generation
Backward linkages
Technology/Skills
transfer
Organizational Characteristics
Size, Ownership & Age
Macro-marketing Environment
Political, economic, social, technological,
ecological, legal

128
4.9 Discussion of the study Findings
This section discusses the results of the tests based on the objectives and hypotheses of
the study. A conceptual framework was developed from the existing literature and
relationships between variables tested.
4.9.1 Perceived Value of Investment Promotion Incentives and Firm Performance
The current study has shown that perceived value of investment promotion incentives
make significant contribution to the performance of firms in the EPZs (Beta = 0.340, R2 =
.115, p< .05). This is consistent with the study by Mayende (2013) which found that tax
incentives were positive and significant in making firms more productive than firms
without such incentives. The results of the current study are also consistent with the study
by Jenkins (2005) which concluded that EPZ regime had significant impact on the Costa
Rican economy with an average increment in FDI by 19%, employment by 11.8% and
gross exports by 32.3% within a period of ten years.
The positive contribution of incentives to firm performance is however disputed by other
studies. In a study on Export Processing Zones in Namibia, it was argued that the
incentives the Namibian Government offered investors did not result in better firm
performance (LaRRI, 2000). Engman, Onodera and Pinali (2007) argue that although
incentives attract foreign investors, they are not substitute to policy measures for sound
investment environment. Therefore, they should be given for a limited period time due to
revenue implications to the Country. Results from a study by Akhtar (2003) also indicate
that growth and development of linkages were inconsistent in the countries where quality
of raw material was poor. The study argued that poor quality of local raw materials could
affect the contribution of incentives to the performance of EPZ firms. This is because the
EPZ firms may resort to using foreign exchange earned from their exports for the country
to import raw materials thus compromising the gains for the domestic economy.
Although perceived value of investment promotion incentives is significantly related to
firm performance, failure could be experienced. Such failures could be caused by
cumbersome bureaucracy, poor planning and provision of overfriendly fiscal incentives

129
(Engman, Onodera & Pinali, 2007). Poor location of an EPZ and erosion of the effect of
incentives due to policy changes including frequent changes in minimum wage
declarations, statutory levies, increased trade union activities, and unpredictable political
environment could also be a source of failure. In China EPZs are mainly located along
the coast where they have easy access to port facilities making them convenient to
international trade (Sit, 1985). Therefore, in designing an EPZ, it is important to consider
location that is accessible to raw materials and export-import outlet especially along the
coast. Other infrastructural facilities and sustainable economic policies are equally
important factors in determining the location of an EPZ.
4.9.2 Organizational Characteristics and Firm Performance
The relationship between organizational characteristics and firm performance has been
widely studied (Wei, Samiee & Lee, 2014; Machuki, Aosa & Letting, 2012; Barney,
1986). In this study, organizational characteristics were considered in terms of age, size
and ownership structure of the firms.
The result indicated a strong positive relationship between organizational characteristics
and firm performance (R = .674, p< .001, Cramer’s V = .796). This result shows
concurrence with other studies which found that organizational size, age and capital
intensity have positive effect on firm performance (Katou & Budwar, 2009). The
implication of these results is that improved state of organizational characteristics is
linked to improved firm performance. Aggarwal (2007) posits that incentive-based
compensation plans are central to firm performance. The result is further consistent with
Ling (2011) supporting the direct positive relationship between intellectual capital
(quality of human and structural capital) and organizational multiple dimensions of
performance including financial performance and global initiatives. Intellectual capital is
critical to firm performance as it provides applied experience, organizational technology,
customer relationships and professional skills necessary for competitive advantage in the
market (Bontis, 2001).

130
4.9.3 Macro-marketing Environment and Firm Performance
The results of the current study indicated a strong positive relationship between macro-
marketing environment and firm performance (R = .439, p < .01, Cramer's V = .546). On
their part, Yang, Chen and Yuan (2011) argue that the aim of investment attraction
policies is to provide investors with an environment that allows them to conduct business
freely, profitably and without unnecessary risks. A conducive macro-marketing
environment seeks to provide predictable and non-discriminatory legal or regulatory
environment, stable macro-economic environment, socially friendly environment with
pragmatic cultural environment. Hollensen (2007) opines that types of actions that can
affect macro-marketing environment include import restrictions, exchange controls,
market controls, price controls, tax controls, labour restrictions and expropriation.
The result of this study is further consistent with other studies (Njeru, 2013; Wang, 2010;
Engman, Onodera & Pinali, 2007) which concluded that external environmental factors
had statistically significant relationship with firm performance. Engman, Onodera and
Pinali (2007) also conclude in their study that a number of external factors necessary for
attraction of FDI and good firm performance are reliable infrastructure (energy, transport
logistics, telecommunications), adequate supply of labour, well-functioning legal
environment and access to local suppliers. Dependency on tax incentives is however
discouraged as it is considered unsustainable in the long term. Akhtar (2003) suggests
that success of EPZs requires economic environment with lowest risk, liberal foreign
exchange regime and currency stability among others.
4.9.4 Macro-marketing Environment, Perceived Value of Investment Promotion
Incentives and Firm Performance
The current study has empirically established that macro-marketing environment has
statistically significant moderating effect on the relationship between perceived value of
investment promotion incentives and firm performance (Beta = - .197; R2 = .621; p <
.05). This result is consistent with Njeru (2013) which established significant moderating
effect of external environment on the relationship between market orientation and firm
performance. The implication of the current result is that even though a country may

131
offer lucrative incentives to attract investments, the macro-marketing environment
significantly influences the performance of such investments. As the quality of macro-
marketing environment improves, so does the outcome of the interaction between
perceived value of investment promotion incentives and firm performance. This may
include establishment of stable political climate in the country, sound economic policies,
favorable social environment and a level of technological capacity that can be attractive
to investors. Legal and ecological environment should also be responsive and conducive
to the expectation of investors (Hollensen, 2007; Radelet, 2004; Bartels, 1968).
The results of the current study are also consistent with and largely corroborate the
observations of Yang et al. (2011) asserting that performance of EPZ firms are
significantly affected by the investment climate comprising resource availability,
infrastructure, governance, geographical location, market potential and political/legal
stability. Preferential tax policy may have close relationship with the probability that
firms will invest for resource seeking purposes in order to improve firm performance.
However, LaRRI (2000) maintains that promotion policies for the attraction and
performance of EPZ firms should not dilute quality of the environment and labour
standards.
4.9.5 Organizational Characteristics, Perceived Value of Investment Promotion
Incentives and Firm Performance
The fifth objective of the study was to determine the extent to which organizational
characteristics affect the relationship between perceived value of investment promotion
incentives and firm performance. The pertinent results revealed that organizational
characteristics had a significant moderating influence on the relationship between
perceived value of investment promotion incentives and firm performance (Beta = .244,
R2 = 582, p <.05). These results are consistent with Yang et al’s. (2011) assertion that
decisions of the firms on investment are affected by their characteristics and stage of
development. At the early stage investors prefer incentive policies that reduce the cost of
investment expenditure while at the expansion stage, they prefer incentives associated
with profits and tax. Previous studies (Ibrahim & Shah, 2012; Jones, 2010; Barney, 1986)
concluded that organizational structure, design and culture have influence on firm

132
performance. On their part, Ibrahim and Shah (2012) emphasized that improved
performance was influenced by country of origin, ownership, age, and size of the firm.
4.9.6 Perceived Value of Investment Promotion Incentives, Organizational
Characteristics, Macro-marketing Environment and Firm Performance
The final objective of the study was to examine the extent to which perceived value of
investment promotion incentives, organizational characteristics and macro-marketing
environment jointly influence firm performance. The test results were statistically
significant (Beta = .265, R2 = .524, p< 0.01). Compared to the single influence perceived
value of investment promotion incentives exerts on firm performance, notable variation
was evident. The change in the coefficient of determination, R2 = .409 (.524 - .115),
meant the variables (organizational characteristics and macro-marketing environment)
explain 40.9 % of variation in firm performance. Therefore, the three variables together
significantly influence how a firm performs. Firstly, an attractive investment location is
characterized by a macro-marketing environment that is predictable, with clear
procedures and business operations backed by law where dispensation of justice is quick
and transparent (Aggarwal, 2007; Engman, Onodera & Pinali, 2007; Yang et al., 2011).
Secondly, previous studies have observed that organizational characteristics have
influence on firm performance (Akhtar, 2003; Barney, 1986). Previous authors have
equally discussed the contributory aspect of macro-marketing environment in a joint
interaction involving both organizational characteristics and perceived value of
investment incentives and firm performance. Finally, Njeru (2013) concluded that
different market orientation components interact with diverse external environmental
factors, marketing practices and firm characteristics in facilitating superior firm
performance.
4.10 Summary of the Chapter
This chapter has presented results of various analyses performed on the study variables
including the descriptive statistics and hypotheses testing through linear, hierarchical and
stepwise multiple regression techniques. The results presented were demographic profiles

133
and respondent firm characteristics. There is also a presentation of the various hypotheses
tested and the results thereof.
The chapter has shown how the direct relationships were tested through simple linear
regression and correlation. It has also shown how indirect relationships (moderation)
were tested through hierarchical multiple regression. Finally, it has shown how the joint
influence was tested through stepwise multiple regression technique.

134
CHAPTER FIVE: SUMMARY, CONCLUSION AND RECOMMENDATIONS
Introduction
This chapter provides summary, conclusions and recommendations of the study. It also
discusses the theory contribution to the academia, the implications to the policy makers,
and the industry stakeholder. It further observes the limitations and proposes areas of
future research.
Summary
The purpose of this study was to establish the influence of perceived value of investment
promotion incentives, organizational characteristics and macro-marketing environment
on the performance of firms in the export processing zones in Kenya. Six objectives and
six hypotheses were developed to guide the study. The data for the study were generated
from both secondary and primary sources. Secondary data were accessed from various
reports and bulletins. Primary data were obtained using structured questionnaires self-
administered by top management in the EPZ firms. Top management included chief
executive officers/managing directors, general managers and departmental managers who
were in decision-making position and privy to the relevant information in the firms.
Descriptive statistics analyzed respondent and firm characteristics while inferential
statistics dealt with hypotheses testing. The data were analyzed using cross tabulations.
Inferential statistics were used to test the relevant hypotheses. Tests were administered
using various methods such as regression analysis (linear, multiple and stepwise) at 95%
confidence level.
The study established that male executives manage most of the EPZ firms in Kenya. The
executives are relatively young and mostly work for a period of one to five years before
moving to other positions or organizations. Most of the executives have highest level of
education at Bachelor’s Degree. It means that they are able to make reliable decisions.
Perceived value of investment promotion incentives were found to contribute
significantly to the performance of firms in the Kenyan EPZs. By use of bivariate

135
correlation analysis, the study showed that there was a significant positive relationship
between organizational characteristics and firm performance. The study also established
that organizational characteristics contributed significantly in moderating, the
relationship between perceived value of investment promotion incentives and firm
performance. A significant positive relationship was observed between macro-marketing
environment and firm performance. Finally, it was established that there was statistically
significant joint influence of perceived value of investment promotion incentives,
organizational characteristics and macro-marketing environment on firm performance.
However, the study indicated that macro-marketing environment had minimal
contribution on the joint influence as a single item.
Conclusion
This study was based on country marketing concept and theories related to international
trade. Heckscher-Ohlin’s Theory of International Trade, Macro-marketing Theory,
Theory of Location Advantages, Cluster Theory, and Eclectic Theory of Foreign Direct
Investment specifically guided it. The study was to establish the influence of
organizational characteristics and macro-marketing environment on the relationship
between perceived value of investment promotion incentives and firm performance. All
the hypotheses formulated to test the relationships were supported. The relationships
among variables were found to be statistically significant implying that the incentives
Kenya offers investors are relevant and need to be maintained. It confirmed that
investment promotion incentives have strong positive influence on firm performance. It
further established that the influence is significantly moderated by both macro-marketing
environment and organizational characteristics. Each of the two moderating variables
independently correlate positively and significantly with firm performance.
The joint influence of perceived value of investment promotion incentives, organizational
characteristics and macro-marketing environment on firm performance was also found to
be statistically significant. This implies that investment promotion incentives are
effective tools for marketing a country as an investment destination.

136
Implications of the Study
This study contributes to the knowledge on the relationship between perceived value of
investment promotion incentives and the performance of firms in the Kenyan export
processing zones.
5.4.1 Theory Implications
The findings of the study showed that perceived value of investment promotion
incentives are significant contributing factors in country marketing theory. Investors
considered incentives explained in the study as good contributors to their firm
performance. This supports Heckscher Ohlin’s Theory of International Trade on
comparative cost whose advantage may be achieved through development of attractive
incentives (Bartels, 1968). Previous studies indicated that investment promotion
incentives were important in attracting investments to a country offering them (Mayende,
2013; FIAS, 2008; Wells & Wint, 2000). In testing the joint influence of perceived value
of investment promotion incentives, organizational characteristics and macro-marketing
environment on firm performance, the results showed that there was significant
contribution of the joint variables on performance. The results have therefore, supported
the Theory of Location Advantage affirming that societal, economic and procedural
advantages are contributing factors in firm performance (Yang et al., 2011; Engman,
Onodera & Pinali, 2007).
The moderating influence of organizational characteristics and macro-marketing
environment on the relationship between perceived value of investment promotion
incentives and firm performance confirms findings of previous studies (Ibrahim & Shah,
2012; Akhtar, 2003). A dichotomy however exists in the behaviour of macro-marketing
environment in its relationship with firm performance when combined with other
variables. It indicated very negligible contribution to the joint influence but showed a
positive statistically significant relationship when tested directly with firm performance.
Its moderation effect is also statistically significant. The fact that the variable accounts
for negligible variation when tested on performance jointly with other variables could be
due to a reduced influence in a joint relationship. Perceived value of investment

137
promotion incentives and organizational characteristics may be exerting a stronger effect
and accounting for relatively greater variation in firm performance.
Country marketing theory would contribute greatly in harnessing and consolidating
concepts that focus on the marketing of countries as preferred investment and business
destinations. Country marketing theory will seek to address the current approach by
countries based on un-coordinated policy configurations that do not take into account the
uniqueness of a country as a marketing product.
5.4.2 Policy Implications
The results of the study provide evidence that EPZ firms significantly contribute to the
Kenyan economy. The firms generate employment, foreign exchange earnings, transfer
of technology / skill, and create backward linkage with the domestic economy through
local purchases of raw materials, consumables, salaries and other utilities. Increased
results in these performance indicators might be achievable if the country addressed the
shortcomings observed by the respondents. The study indicated that investors considered
issues of political climate, and economic issues such as high cost of energy, frequent
economic policy changes, cost of labour and other utilities as factors affecting their
performance. Kenya should therefore, consider developing sustainable policies and enact
strong laws that protect investment activities in order to attract more international
investors.
The study has revealed need for policy makers to consider laying emphasis on the
promotion of high capital-intensive investments into the zones to enhance the rate of
technology/skill transfer as the results showed that sub-contracting activities were still
minimal in the programme. Policy intervention is also required in the service sector,
which had the lowest investor participation.
5.4.3 Implications for Marketing Practice
The results of this study demonstrate that although perceived value of investment
promotion incentives significantly influence the performance of firms in the Kenyan
EPZs, they are moderated by macro-marketing environment and organizational

138
characteristics. Managers must therefore, recognize this interaction and formulate their
promotion strategies accordingly.
First, the study showed that the incentives offered were not the only drivers of firm
performance hence managers must continuously monitor any changes in the macro-
marketing environment. Political climate, economic policy changes, social dynamics,
legal provisions and ecological environment changes are underlying environmental
conditions managers must regularly analyze and adapt to in order to sustain their firm
performance.
Secondly, the results are consistent with previous studies, which indicate that the
incentives offered by the host country may not be of permanent feature and often have
limitations (Yang et al., 2011; FIAS, 2008; Engman, Onodera & Pinali, 2007). For
example, incentives especially tax holidays are usually time-bound. This study therefore,
provides understanding to the managers for the need to strategize on what other
alternatives may make their firm performance sustainable.
Third, the results confirmed that organizational characteristics significantly moderate the
relationship between perceived value of investment promotion incentives and
performance of firms in the Kenyan EPZs. It therefore contributes to the understanding of
managers in developing marketing strategies that recognize their firm characteristics in
terms of the structure, size, age and ownership as factors that affect performance.
5.5 Limitations of the Study
The study had a number of methodological, operational and technical limitations due to
its magnitude. These limitations however did not significantly affect the overall design
and the outcome of this research.
Being a cross-sectional survey, the current study had latent difficulty in predicting causal
relationships among variables. Longitudinal study would therefore, be best option to
determine the causal relationships.

139
Second, the study focused on top management (Chief executive/managing directors,
general managers, and managers) as respondents. Application of single respondent per
firm using self-administered instrument in collecting data had the inherent concern on the
quality of the information given. Furthermore, the data provided were from the
perceptions or opinions of the respondents. The study excluded general employees, the
EPZA management, zone developers, and local community despite being relevant
stakeholders. Their inclusion could have given a balanced opinion from all categories of
people who interact with EPZ investments across the country. However, due to the scope
of the study and its objectives this was not possible. The limited choice of top
management had a basis in the ability of the respondent to provide the relevant
information to which they were relatively more privy in view of the research design. This
approach might have had limited the outcome of the study. A more inclusive study needs
to be undertaken and results compared with the ones of the current study for coherent
understanding of the programme.
The final limitation was that the construction of organizational characteristics as a study
variable was not exhaustive. This could have affected the results especially on the
strength of relationships. However, this limitation did not have an adverse effect on the
results because age, size and ownership are important aspects of any organization,
providing an adequately summative way of looking at and providing critical bases upon
which firm performance can be evaluated either directly or indirectly. Future study needs
to include all aspects of culture, design and structure in constructing organizational
characteristics as a study variable to provide additional findings.
The limitations observed above did not however, compromise the overall quality of the
study.
5.6 Recommendations
This study has looked at the influence of organizational characteristics and macro-
marketing environment on the relationship between perceived value of investment
incentives and firm performance. From the results, the following recommendations may
be considered:

140
First, the current policies on investment promotion incentives need to be reviewed to
enhance country-marketing activities. The review should take into account issues related
to incentives being offered such as tax holiday or exemption. The literature available
provide arguments about their sustainability in the long-term. Tax incentives may be
considered a compensation to deficient policies. They are like rewarding or cushioning
inefficiency to the detriment of economic development. Policy makers should therefore,
focus on formulation of policies aimed at creating efficient administrative and
infrastructural incentives that are long-term and sustainable.
Second, the power of Cluster theory advancing spatial concept that defines geographic
concentration of interconnected industries was evident in the EPZ firms studied. The
firms were concentrated in specific sites with only a few in standalone locations. Athi
River and Mombasa had the highest concentration. This study therefore recommends that
the government and private developers should consider developing EPZ firms in
concentrated clusters to create economies of scope. This approach will encourage
emergence of service sector industries, which the study observed, had not picked up well
in the EPZs programme. Clustering will create cost effective operations with higher
returns to investors, government and the EPZ regulatory authority.
Third, the results show that macro-marketing environment is a significant moderator in
the relationship between perceived value of investment promotion incentives and firm
performance. The current study therefore recommends that the government formulates
and implement policies that encourage conducive business environment. This may be
done through ensuring stable political environment, efficient infrastructural facilities,
predictable legislative framework and investment in technological facilities.
5.7 Suggestion for Future Research
While the study focused on the influence of perceived value of investment promotion
incentives on performance, its scope did not involve the use of quantitative values of the
incentives Kenya offers to investors in the specialized EPZ programme. This is despite
firm performance (dependent variable) indicators having been in actual figures and ratios.
This gap calls for future research to analyze quantitative cost and benefits of EPZs in the

141
country. It would be important to determine the quantitative value of the perception of
investment promotion incentives and compare that with the performance of firms
benefitting from the incentives. This would produce conclusive evidence on the
relationship between the investment promotion incentives as country marketing policy
option and the actual benefits the country receives in return.
Secondly, firm performance indicators included number of direct jobs generated, and the
rate of technology/skill transferred from expatriates to locals. However, the scope of the
investigation did not consider the quality, value and type of employment generated and
technology transferred. Further research is required to determine empirically the actual
composition, quality and type of employment created, quality of technology and skill
transfer in real values, and the resources generated by the firms in EPZs. These statistics
are lacking in the realm of empirical studies, making it difficult to quantify real benefits
or losses the country might be experiencing by operating the EPZ programme.
Finally, the significance of backward linkage by way of sourcing of raw materials,
consumables, local payments and other utilities is also of research interest. Research
needs to be undertaken to identify the sectors that have high potential in the linkage with
domestic economy so that marketing efforts are focused on them. The reason for this is
the significant impact backward linkage has on the host economy. The indicator has
direct connection with the local economy where various raw materials and other utilities
are sourced.

142
REFERENCES
Aggarwal, A. (2007). Impact of Special Economic Zones: Unemployment, Poverty and
Human Development. Indian Council for Research on International Economic
Relations, 194, 1-53.
Ahuja, H.L. (2010). Modern Economics. 15th Edition. S. Chand & Co. Ltd: New Delhi.
Akhtar, H.M. (2003). An Evaluation of Karachi Export Processing Zone: A preliminary
Investigation. The Pakistan Development Review. (42), 4 (II), 927 – 940.
Angko, W. (2014). Analysis of the Performance of Export Processing Zones in Ghana.
Journal of Business Administration and Education, 5(1), 1-43.
Barney, J. B. (1986). Organizational Culture: Can It Be a Source of Sustained
Competitive Advantage? The Academy of Management Review, 11 (3), 656 –
665.
Baron, R.M. & Kenny, D.A. (1986). The Moderator – Mediator Variable Distinction in
Social Psychological research: Conceptual, Strategic, and Statistical
Considerations. Journal of Personality and Social Psychology, 51 (6), 1173 –
1182.
Bartels, R. (1968). Are Domestic and International Marketing Dissimilar? Journal of
Marketing, 32 (3), 56 – 61.
Bland, M. J. (2008). Measurement in Health and Disease Composite Scales and Scores.
Retrieved on 9th September, 2015 from www-users.york.ac.uk.
Bontis, N. (2001). Assessing Knowledge Assets: A Review of the Models used to
Measure Intellectual capital. International Journal of Management Review, 3
(1), 41 – 60.
Brown, C.K. & Reilly, F.K. (2009). Analysis of Investments and Management Portfolios.
9th Edition. South Western, CENGAGE Learning.

143
Cling, J.P., Razafindrakoto, M., & Roubaud, F (2007). Export processing Zones in
Madagascar: The impact of the dismantling of clothing quotas on employment
and labour standards. Institut de Rechercher pour Development, DIAL, Paris.
Cooper, D & Schindler, P. (2006). Business Research Methods. 9th. Edition. McGraw Hill
International Edition.
DeCoster, J. (2012). Data Preparation in SPSS. Retrieved on 8th September, 2015
from http://www.stat-help.com/notes.html
Denisia, V. (2010). European Journal of Interdisciplinary Studies, 2(2), 104 – 110.
Dibb, S., Simkin, L., Pride, M.W., & Ferrell, O.C. (2006). Marketing Concepts and
Strategies. Fifth European Edition. Houghton Mifflin. Boston MA, USA.
Drost, E.A. (2011). Validity and Reliability in Social Science Research. Education
Research and perspectives, 38(1), 105 - 123
Eklund, J.E. (2013). Theories of Investment: A Theoretical Review with Empirical
Applications. Swedish Entrepreneurship forum, 2013 (22), 1 – 15.
Engman, M., Onodera, O, & Pinali, E (2007). Export Processing Zones. Past and Future
Role in Trade and Development .OECD Trade Policy Papers, (53), 1 – 70.
OECD Publishing.
EPZA (2012). Export Processing Zones Authority Annual Report for the year ended 31st
December, 2012. Nairobi, Kenya. EPZA Management.
EPZA (2013). Export Processing Zones Authority Annual Report for the year ended 31st
December, 2013. Nairobi, Kenya. EPZA Management.
EPZA (2014). Export Processing Zones Authority Annual Report for the year ended 31st
December, 2014. Nairobi, Kenya. EPZA Management.

144
EPZ Act (1990). Export Processing Zones Act of 1990, Laws of Kenya. Government of
Kenya Publication.
FIAS (2008). Special Economic Zones: Performance, Lessons Learned, and Implications
for Zone Development .Office of the Publisher, The World Bank, Washington
D.C., USA.,9 –53.
Fraj-Andres, E., Martinez-Salinas, E., & Matute-Vallejo, J. (2009). A Multidimensional
Approach to the Influence of Environmental Marketing and Orientation on the
Firm’s Firm Performance. Journal of Business Ethics. (88), 263 -286.
Frey, R. S. (2003). The Transfer of core-based hazardous production processes to the
Export Processing Zones of the Periphery: The Maquiladora Centers of Northern
Mexico. Journal of World-Systems Research, IX, 317-354.
Ge, W. (1999). The Dynamics of Export Processing Zones. UNCTAD/OSG/DP/144.
Ghosal, S. (1987). Global Strategy: An Organizing Framework. Strategic Management
Journal, 8 (5) 425 – 440. John Wiley & Sons.
Gliem, A.J. & Gliem, R.R. (2003, October 8-10). Calculating, Interpreting, and
Reporting Cronbach’s Alpha Reliability Coefficient for Likert-Type Scales. Paper
presented at Midwest Research Practice Conference in Adult, Continuing, and
Community Education, Midwest. Columbus, OH: The Ohio State University.
Grubel, G.H. (1982). Towards a Theory of Free Economic Zones. Weltwirtschaftliches
Archiv. Bd. 118 (H.1), 39– 61. Springer.
Hofer, C. W. (1983). ROVA: A New Measure for Assessing Firm Performance. In R.
Lamb (Ed.), Advances in Strategic Management, 2, 43-55. New York: JAI Press.
Hollensen, S. (2007). Global Marketing: A decision oriented approach. 4th Edition.
Pearson Education Limited. Essex, England.

145
Hunt, S.D. (1991). Modern Marketing Theory: Critical Issues in the Philosophy of
Marketing Science. South Western Publishing Co, Cincinnati, Ohio.
Iacobuccci, D. & Duhachek, A. (2003). Advancing Alpha: Measuring Reliability with
Confidence. Journal of Consumer Pyschology, 13(4), 478 - 487
Ibrahim, H.I. & Shah, M.K. (2012). Strategic HRM Practices: Investigating
Organizational Characteristics Influence. Journal of WEI Business and
Economics, 1(1), 21.
Jayanthakumaran, K. (2003). Benefit-Cost Appraisals of Export Processing Zones: A
Survey of the Literature. Development Policy Review, 2003, 21(1), 51-65.
Jenkins, M. (2005). INCAE Business School. Economic and Social Effects of Export
Processing Zones in Costa Rica. International Labour Organization, Geneva.(97)
2 – 35.
Jones, G. R. (2010). Organizational Theory, Design, and Change (7th ed.). Upper Saddle
River, NJ: Prentice Hall. UK.
Kaplan, R.S. & Norton, D.P. (1992). The Balanced Scorecard – Measures that Drive
Performance. Harvard Business Review. January-February 1992. 71-79.
Katou, A.A. & Budhwar, P.S. (2009). Causal Relationship between HRM Policies and
Firm Performance: Evidence from the Greek Manufacturing Sector. European
Management Journal (2009). 1 – 15, Retrieved from Journal Home page:
www.elsevier.com/locate/emj.
Kennerly, M. & Neely, A. (2003). International journal of Operations & Production
Management. 23(2). 213 – 229.
Krauss, S. (2005). Research Paradigms and Meaning Making: A Primer. The Qualitative
Report 10 (4).

146
Lapierre, J. (2000).Customer-Value in Industrial Contexts. Journal of Business and
Industrial Marketing. 15 (2) 122-140. University Press.
LaRRI (2000). Export processing zones in Namibia: Taking a closer look. 17 – 55,
Publication of Labour Resource and Research Institute, Windhoek, Namibia.
Ling, S. & Hung, L. (2010). How Intellectual Capital performance Affects Organization
performance: Using Intellectual Capital as Mediating Variable. Journal of Human
Resource Management, 10 (1), 1-27.
Ling, Y. (2011). The influence of intellectual capital on firm performance–Knowledge
management as moderator. Asia Pacific Journal of Management (2013) (30), 937
– 964.
Machuki, V.N. (2011). External Environment-Strategy Co-Alignment, Firm-Level
Institutions and Performance of Publicly Quoted Companies in Kenya.
Unpublished PhD. Thesis. School of Business, University of Nairobi.
Machuki, V.N., Aosa, E.O., & Letting’ N.K. (2012). Firm-Level Institutions and
Performance of Publicly Quoted Companies in Kenya. International Journal of
Humanities and Social Science. 2 (21), 298-312.
Madani, D. (1999). A Review of the Role and Impact of Export Processing Zones. 17-.83
Washington D.C. World Bank. Retrieved from
http//ideas.repec.org/p/wbk/wbrwps/2238.html.
Marhoz, J.P. & Szymanski, M. (1996). Trade Union Campaign for a Social Clause:
Behind the wire, anti-Union Repression in the Export Processing Zones.
Retrieved from http://actrav.itcilo.org/actrav-english.
Mayende, S. (2013). The Effects of Tax Incentives on Firm Performance: Evidence from
Uganda. Journal of Politics and Law. 6 (4), 95 – 107.
Nachmias, C.F. & Nachmias, D. (2009). Research Methods in the Social Sciences.
(5thed.). St. Martins Press: London.

147
Namada, J.M. (2013). Strategic Planning Systems, Organizational Learning, Strategy
Implementation and Performance of Firms in Export Processing Zones in
Kenya. Unpublished PhD Thesis. School of Business, University of Nairobi.
Namada, J.M., Aosa, E., Awino, Z., & Wainaina, G. (2014). Management Participation
and Firm Performance. American Journal of Industrial and Business
Management. Scientific Research. Published Online. Retrieved from
http://www.scirp.org/journal/ajibm.
Ndungu, K. (2013). Quality Drivers, Managerial Focus, Customer perception and
Satisfaction in Large Maize Flour Mills in Nairobi, Kenya. Unpublished PhD
Thesis. School of Business, University of Nairobi.
Nilsson, J. (2008). Investment with a Conscience: Examining the Impact of Pro-Social
Attitudes and Perceived Financial Performance on Socially Responsible
Investment Behaviour. Journal of Business Ethics, 83 (307 – 325).
Njeru, W.G. (2013). Market Orientation, Marketing practices, Firm Characteristics,
External Environment and performance of Tour Firms in Kenya. Unpublished
PhD Thesis. School of Business, University of Nairobi. pp.54 – 58.
Njuguna, J. (2013). Strategic Social Marketing, Operating Environment and
Performance of Community based HIV and Aids Organizations in Nairobi
County, Kenya. Unpublished PhD Thesis. School of Business, University of
Nairobi.pp.50 – 53.
Nunnally, J. C. (1978). Psychometric theory (2nded.). New York: McGraw-Hill.
Oluwatayo, J.A. (2012). Validity and Reliability Issues in Education Research. Journal of
Educational and Social Research, 2(2), 391- 400.
Osborne, J & Elaine, W. (2002). Practical Assessment Research and Evaluation.
Retrieved on 9th September, 2015 from www. pareonline.net.

148
Radelet, S (2004). .A Framework for supporting sustainable economic development.
Center for global development. Retrieved from
www.wdi.bus.umich.edu/global_conf/papers/radelet.pdf.
Sanchez-Fernandez, R. &Iniesta-Bonilo, M.A. (2007).The Concept of Perceived value: a
systematic review of the research. Marketing Theory. 7(4), 427 - 451. SAGE
Publications.
Saunders, M., Lewis, P. & Thornhill, A. (2009).Research methods for business students.
Fifth Edition. Pearson Professional limited. Essex, England.
Sit, V.F.S (1985). The Special Economic Zones of China: A new type of export
processing zone? The developing economies, XXIII(1), 71.
Schmitt, N. (1996). Uses and Abuses of Coefficient Alpha. Psychological assessment, 8
(4), 350 - 353
UK. (2013). Office for National statistics. Full Report: Women in the Labour Market.
UNCTAD (1998).Trade and Development Board.TD/B/COM.3/EM.5/2. 26 United
Nations publication.
Venkatraman, N. & Ramanujam, N. (1986). Measurement of Business Performance in
Strategy and Research: A Comparison of Approaches. The Academy of
Management Review. 11(4). 801-814.
Vigoda, E. (2000). .Journal of Vocational Behaviour (57), 326 – 347.
Walfish, S. (2006). PharmTech - A Review of Statistical Outlier Methods. Retrieved on
9th September, 2015 from http://statisticaloutsourcingservices.com/Outlier2.pdf
Wang, J (2010). The Economic Impact of Special Economic Zones: Evidence from
Chinese Municipalities. Hong Kong University of Science and Technology.

149
Wei,Y., Samiee S. & Lee, R.P. (2014). The influence of organic organizational cultures,
market responsiveness, and product strategy on firm performance in an
emerging market. Journal of the Academy of Marketing Science (42), 49 – 70.
Wells, L.T. & Wint, A.G. (2000). Marketing a country. Promotion as a tool for attracting
foreign investment. FIAS Occasional Paper (13), 2 – 93.
Yang X., Wang Z., Chen Y., & Yuan F. (2011).Factors affecting firm-level Investment
and Performance in border Economic Zones between the People’s Republic of
China and its neighbouring GMSs countries. Research Report Series Vol.1 Issue
No.1Greater Mekong Sub-region – Phnom Penh Plan for Development
Management. Asian Development Bank.
Zikmund, G.W., Babin, B.J., Carr, J.C. & Griffin, M. (2010). Business Research
Methods. Eighth Edition. South Western CENGAGE Learning.
Zhang, X. G., Lin, T.H., & Lin, Y. S. (n.d.).The Study of EPZ Satisfaction and Firm
Performance in Taiwan. Department of International Master of Business
Administration, National Kaohsiung First University of Science and Technology,
Kaohsiung, Taiwan.

150
APPENDICES
Appendix I: Researcher’s Letter of Introduction
Dear Sir/Madam,
THE INFLUENCE OF ORGANIZATIONAL CHARACTERISTICS AND MACRO-
MARKETING ENVIRONMENT ON THE RELATIONSHIP BETWEEN THE
PERCEIVED VALUE OF INVESTMENT INCENTIVES AND PERFORMANCE OF
FIRMS IN EXPORT PROCESSING ZONES IN KENYA
I am student at the School of Business, University of Nairobi pursuing a Doctor of Philosophy
studies in Business Administration, Marketing. Part of the requirements for the award of the
degree is to undertake a research study in the area of interest. I am therefore, carrying out a
survey intended to assess the influence of organizational characteristics and macro-marketing
environment on the relationship between the perceived value of investment incentives and
performance of firms in export processing zones in Kenya. The survey is only for academic
purpose and policy enrichment. The outcome of the research will therefore be used for academic
purposes and policy recommendations to improve the performance of the EPZs scheme in Kenya
in view of the current policy debate on the transformation of EPZ scheme into the wider Special
Economic Zones Programme.
I am therefore seeking for your kind participation in the study by taking a bit of your time to fill
in the attached questionnaire.
All the information gathered will be treated with confidentiality and in aggregated form without
revealing identity of the respondent. Your contribution to this research by way of response in
such a timely manner is highly appreciated. If you wish to have a summary of the findings of the
study, kindly indicate at the end of the questionnaire.
Yours faithfully,
Joseph N. Kosure
Tel. +254-725620610

151
Appendix II: University Letter of Introduction
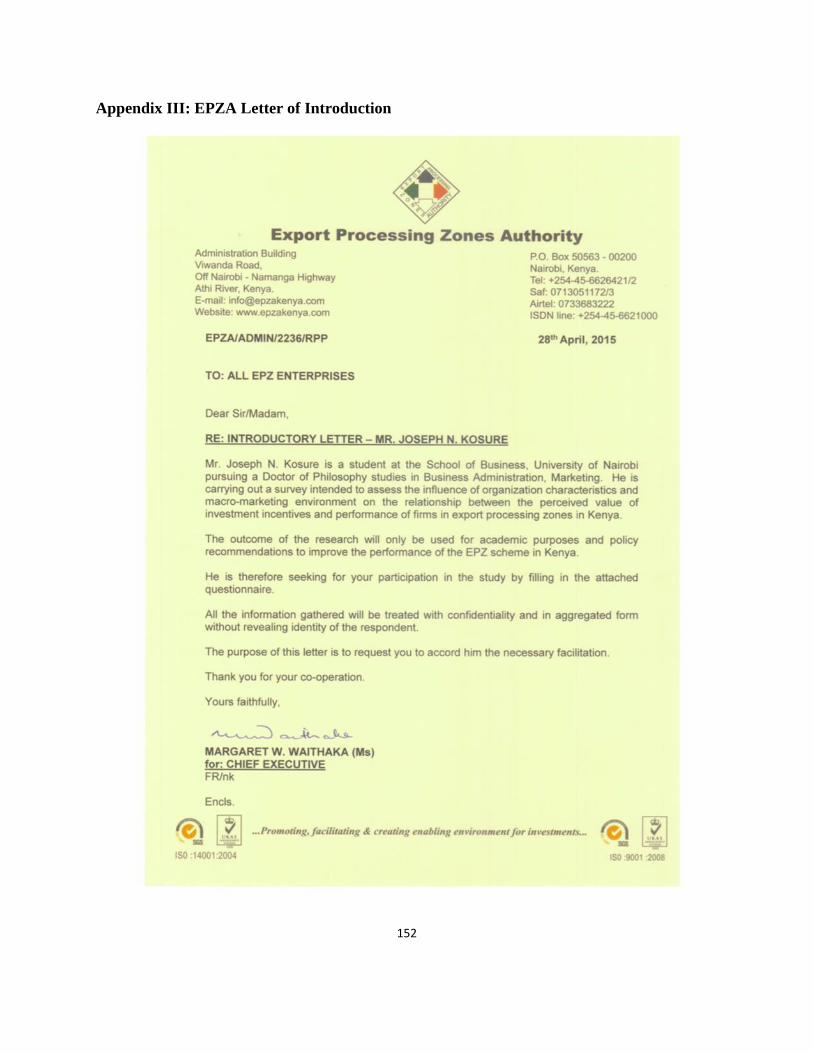
152
Appendix III: EPZA Letter of Introduction

153
Appendix IV: Questionnaire
Introduction
This questionnaire is designed for collection of data from all firms in the Export Processing Zones
in order to contribute to the study on the influence of perceived value of investment promotion
incentives on the performance of the EPZ firms in Kenya. Your participation and accurate
response to the questions is therefore, very important for the kind of data required for the study.
The data will be treated with utmost confidentiality.
Note: The questionnaire is divided into five (5) sections. Each section has questions dealing with
a specific issue. The instruction on how to answer each question is supplied beside the question.
You may seek clarification from the researcher in case there is an area you do not understand.
SECTION 1: DEMOGRAPHICS
(Tick ONE BOX as appropriate)
Respondent:
1. Gender: Male Female
2. How old are you?
No. of years in age Up to 30
years
31 - 45
years
46 - 60
years
61 & Above
years
Tick one box as applicable
3. Highest level of education attained:
Secondary Diploma
Bachelor’s Degree Master’s Degree PhD Degree

154
4. Position in the company:
Chief Executive/Managing Director
General Manager Manager
5. How long have you worked in this firm?
No. of years 0 – 5
6 – 10
11 – 15
16 - 20
21 & Above
Tick one box as applicable
6. Which sector is the firm in? Manufacturing/Processing
Commercial Service
Other (Specify)………………….................
7. Ownership: Wholly Kenyan Majority Kenyan
Wholly Foreign Majority Foreign

155
8. How old is the firm?
No. of years
1– 5
6- 10
11–15
16- 20
21 & Above
Tick one box as appropriate
9. When was the firm incorporated in Kenya?
10. State the current investment value of the firm
Investment level
(‘Million US Dollars)
100 & Below
101-500
501-1000
1001-5000
5001 & Above
Tick one box as appropriate
11. State the number of employees in the firm during the years indicated
Year
Number of Employees
Permanent
Casual
Local Expatriates
2011
2012
2013
2014

156
SECTION 2: PERCEIVED VALUE OF INVESTMENT PROMOTION INCENTIVES
12 a. Please indicate the extent to which the following incentives contribute to the
performance of your firm by ticking in the appropriate box.
Perceived Value of Investment
Promotion Incentives
Not at all
Small
extent
Moderate
extent
Large
extent
Very
large
extent
1 Stability of foreign exchange rate
2 Free repatriation of capital and
profits
3 Permission to maintain foreign
currency accounts
4 Quota - free imports on capital and
intermediate goods
5 land use policy of country
6 Duty & VAT exemptions
7 One-stop shop operations
8 Other (Please specify)
12b. Following your response in 12a, please indicate the extent to which the incentives contribute
to the performance of your firm by ticking the appropriate box.
Perceived Value of Investment
Promotion Incentives
Not at all
Small
extent
Moderate
extent
Large
extent
Very
large
extent

157
SECTION 3: ORGANIZATIONAL CHARACTERISTICS
13a. Please indicate the extent to which the following organizational characteristics influence the
performance of your firm (Tick the appropriate box for each statement).
Organizational Characteristics
Not
at
all
Small
extent
Moderate
extent
Large
extent
Very
large
extent
1 Our experience in the industry affects our
performance positively
2 Our business culture built over time makes
us a leading firm in the export market
3 We are satisfied with the quality of our
human resources
4 The size of investment influences the
performance of our firm positively
5 Ownership structure of our firm gives us
advantage over competitors
6 Other (specify)
13b.Following your response in 13(a), please indicate the extent to which the organizational
characteristics contribute to the performance of your firm. (Tick the appropriate box)
Organizational Characteristics
Not at all
Small
extent
Moderate
extent
Large
extent
Very
large
extent

158
SECTION 4: MACRO-MARKETING ENVIRONMENT
Macro-marketing environment has influence on the performance of EPZ firms.
14. To what extent do you agree with the following statements? (Tick the appropriate box for
each statement)
Political issues
Not
at all
Small
extent
Moderate
extent
Large
extent
Very
large
extent
1 The prevailing political climate is good
for our firm performance
2 We are satisfied with government effort
in supporting investments in the country
3 Kenya has good international political
relations that is good for investment
4 Other (specify)
15. To what extent do you agree with the following statements? (Tick the appropriate box for each
statement)
Economic issues
Not at
all
Small
extent
Moderate
extent
Large
extent
Very
large
extent
1 Allocation of industrial land for EPZ
investors has improved firm performance
2 Industrial linkages with the domestic
economy has helped us in accessing inputs
including raw materials
3 Rate of minimum wage in Kenya
negatively affects performance of our firm

159
4 We are satisfied with the services at the
customs management offices in
supporting our performance
5 Other (specify)
16. Costs are major economic factors in business competitiveness. Success of EPZ firm performance
world over depends on competitiveness of costs of factors of production. How do you rate the
elements of costs of the following as challenges to the performance of your firm?
(Tick the appropriate box for each statement).
Economic issues contd.
Not at
all
Small
extent
Moderate
extent
Large
extent
Very
large
extent
1 Land
2 Road transport
3 Rail transport
4 Air transport
5 Shipping (Sea transport)
6 Power/Electricity
7 Water/Sewerage
8 Warehousing
9 Human capital/labor
10 Information Communication Technology
11 Licenses, permits
12 Taxes and levies
13 Raw materials

160
17. Please indicate the extent to which the following factors influence the performance of your firm
by ticking the appropriate box for each statement.
Social issues
Not at
all
Small
extent
Moderate
extent
Large
extent
Very
large
extent
1 The cost of welfare contributions to
society affects the performance of our
firm
2 We have been able to source our
technical staff locally
3 Our wage /salary scales are competitively
comparable to those in the domestic
economy
4 Our wage/salary scales are higher than
those in the domestic economy
5 Activities of trade union movement in
EPZ affects performance of our firm
6 The attitude of the local community
towards EPZ scheme affects performance
of our firm
7 Other (specify)
18. Please indicate to what extent the following statements are true by ticking the appropriate box for
each statement.
Technology issues
Not at
all
Small
Extent
Moderate
Extent
Large
extent
Very
Large
extent
1 Good technology uptake in the country is
important in the performance of our firm
2 High cost of technical machinery and
equipment negatively affects our firm
performance
3 Rapid changes in technology influences the

161
performance of our firm
4 Technological environment affects quality
of factors of production in our firm
5 Other (specify)
19. Please state the extent to which the following statements are significant in the performance of
EPZ firms in Kenya by ticking the appropriate box.
Legal issues
Not at all
Small
extent
Moderate
extent
Large
extent
Very
Large
extent
1 We are satisfied with the special legal
framework that is different from domestic
legislation
2 Our expatriates receive their work permits
easily without delay
3 We get all our statutory legal issues sorted out
timely by the EPZ regulatory management
authority
4 We believe strong legislation against
expropriation and domestication is important
in attracting EPZ investments and good firm
performance
5 We consider predictable clear legal systems
with timely service delivery significantly
influence our firm performance.
6 Other (specify)

162
20. Please state the extent to which the following statements are true of your firm by ticking the
appropriate box.
Ecological issues
Not
at all
Small
extent
Moderate
extent
Large
extent
Very
large
extent
1 Our firm undertakes energy conservation
production processes
2 We observe good waste disposal practice
3 Our firm supports environmental protection
activities in the community
4 Our firm has overall environmental policy
observed by all employees
5 Other (specify)
21. Having considered all the stated political, economic, social, technological, ecological, legal and
issues in questions 14 to 21, to what extent do you think these issues affect the performance of
EPZ firms? (Tick the appropriate box)
Macro-Marketing Environment
Not at all
Small
extent
Moderate
extent
Large
extent
Very large
extent

163
SECTION 5: PERFORMANCE OF EPZ FIRMS IN KENYA
22. How many new direct local jobs has your firm created in the years indicated?
No. of Jobs
1 – 1000
1001 – 2000
2001 – 3000
3001 – 4000
4001 & Above
Year 2011
Year 2012
Year 2013
Year 2014
23. How much foreign exchange earnings has your firm generated through exports in the years
indicated?
Foreign
exchange
earnings
(‘000 US.
Dollars)
1000 & Below
1001 -2000
2001 -3000
3001 – 4000
4001 & Above
Year 2011
Year 2012
Year 2013
Year 2014
24(a). Has your firm transferred technology and skills in terms of number of expatriates to locals?
(Tick the appropriate box).
Yes No

164
24b. Incase question 24 above is Yes, at what rate has your firm transferred technology and skill in
terms of number of expatriates to local employees during the years indicated?
Year Expatriates to locals
Managerial
%
Technical
%
Not applicable
2011
2012
2013
2014
25. We spend the following ratios (%) of our operating expenses on:
(Tick appropriate column for each statement)
Item of domestic (backward) linkage 2011
%
2012
%
2013
%
2014
%
1 Local employee salaries
2 Local employee levies (PAYE, NSSF, NHIF)
3 Local purchases of raw material
4 Local Utilities (water, power, telecommunications)
5 Local transportation (maritime, land, air and rail)
6 Local sub-contracting
7 Other (specify)
Thank you very much for our time and contribution.

165
Appendix V: List of Operational EPZ Firms
Company Name &
Contacts
Licensed Activity Location
1. Africa Apparel EPZ Ltd.
Manufacturing – Garments –Ladies
woven bottoms
Sunflag, Runyenjes
Rd, Nairobi
2. All Fruit EPZ Ltd.
Manufacturing – frozen passion
fruit juice concentrate & mango
puree & concentrate.
Kingorani,
Changamwe,
Mombasa
3. Alpha Logistics EPZ Ltd.
Developer/operator and Service.
Marine logistical support services
in gas and oil exploration projects
Alpha Logistics,
Mombasa
4. Alltex EPZ Ltd. Manufacturing – Woven & Knitted
Garments
Athi River EPZ – Athi
River
5. Asante Gifts & Souvenirs
EPZ Ltd.
Manufacturing – curios &
handicrafts
Athi River EPZ
6. Ashton Apparel EPZ Ltd. Zone Developer/ Operator &
Manufacturing – Garments
Ashton Apparels EPZ
- Mombasa
7. Avenue Fresh Produce
EPZ Ltd.
Manufacturing – Assorted fruits &
vegetables.
Athi River EPZ
8. Balaji EPZ Ltd. Manufacturing – Garments Balaji EPZ Ruaraka
9. Barnes EPZ Ltd.
Developer/Operator—
Manufacturing-chewing tobacco :-
poanmasala ,khaini Gutka
Athi River

166
10. Belat EPZ Ltd.
Manufacturing – Fruit juices and
wine
Athi River EPZ
11. Blue Sky Films EPZ Ltd. Service – Film Production Athi River EPZ – Athi
River
12. Botanical Extracts EPZ
Ltd.,
Manufacturing – Plant Extract
(Artemisinin)
Athi River EPZ – Athi
River
13. Brilliant Garments EPZ
Ltd.
Manufacturing- Garments Talab EPZ - Mtwapa
14. Capital Industrial Park EPZ
Ltd.
Service – Leasing out industrial
buildings
Athi River EPZ – Athi
River
15. Celebrity Fashions K. EPZ
Ltd.
Manufacturing – Garments Athi River EPZ
16. Central Africa Trading
EPZ Ltd.,
Commercial- General merchandise
(Kenyan coffee, Kenyan tea, UHT
Milk, soap, Kenyan beef and, pork
products, electronic goods and
appliances & toilet paper
Athi River EPZ
17. De La Rue Currency and
Security Print EPZ Ltd.
Zone Developer/ Operator &
Manufacturing – Currency and
Security Documents Production
De La Rue Security
Print EPZ – Ruaraka,
Nairobi
18. Earth Oil Kenya
Proprietary EPZ Ltd.
Manufacturing – Natural products
derived from Plant extracts
Athi River EPZ – Athi
River
19. Emrok Tea Factory (EPZ)
Ltd.
Manufacturing – Tea Nandi – Keben
Business Park EPZ
Ltd

167
20. Erdemann (EPZ) Ltd.
Manufacturing – wines and spirits
& Mineral water
Erdemann Industrial
Park Beijing Rd.
Mlolongo, Mavoko
21. ET Elasto Tech (EPZ) Ltd.
Commercial – O-rings German Kilifi EPZ -
Kilifi
22. Exotic EPZ Ltd.
Manufacturing— Processed
macadamia Nuts
Sameer Industrial
Park EPZ
23. Forest Gate EPZ Ltd.
Developer/Operator And Enterprise
Manufacturing–Processed
Horticultural Produce and flowers
Laikipia
24. Ginger InkFilms EPZ Ltd. Service – Film & TV Production Athi River EPZ - Athi
River
25. Global Apparels (K) EPZ
Ltd.
Manufacturing – Garments Athi River EPZ - Athi
River
26. Gokal Beverages (EPZ)
Ltd.
Manufacturing— Blended Teas,
Packet Teas and Tea Bags
Emirate Agencies
EPZ - Changamwe,
Mombasa
27. Gold Crown Foods EPZ
Ltd.,
Manufacturing – Tea Blending and
packaging
Gold Crown Foods
EPZ – Shimanzi,
Mombasa
28. Hantex Garments EPZ Ltd. Manufacturing- Garments Mazeras EPZ -
Mombasa
29. Halai Brothers (EPZ) Ltd. Developer /Operator Changamwe,
Mombasa

168
30. Hui Commercial EPZ K.
Ltd.
Manufacturing - Plastic bottle
flakes
Kingorani,
Changamwe –
Mombasa
31. Imperial Teas (EPZ) Ltd.
Manufacturing - Tea King’orani EPZ –
Changamwe,
Mombasa.
32. Indu Farm EPZ Ltd. Manufacturing - Packaged
horticulture
Sameer Industrial
Park EPZ - Nairobi
33. Insta Products EPZ Ltd. Manufacturing – Food Products Athi River EPZ - Athi
River
34. Ivee Aqua EPZ Ltd. Manufacturing - Pharmaceuticals Athi River EPZ -
Athi River
35. Ivee Infusions EPZ Ltd.
Manufacturing – Infusion fluids,
water for injections, Eye/Ear/Nose
Drops, Inhalations and small
volume Injectables
Athi River EPZ – Athi
River
36. Jungle Cashews EPZ Ltd. Manufacturing – Cashew nuts Saw Africa EPZ –
Thika
37. Jungle Mac EPZ Ltd. Manufacturing – Macadamia nuts Saw AfricaEPZ –
Thika
38. Kapric Apparels EPZ
Ltd.
Manufacturing – Garments Pwani Industrial Park
EPZ – Changamwe,
Mombasa
39. Katchy Kollections EPZ
Ltd.
Manufacturing- fashion
accessories, shoes, leather bags,
sisal clutch bags & fabric bags
Athi River EPZ
40. Kencall EPZ Ltd. Service - Call Centre/Back Office
Operations
Sameer Industrial
Park EPZ

169
- Nairobi
41. Kensis EPZ Ltd. Manufacturing – Refined sisal fibre Athi River
42. Kenya Fluorspar EPZ Ltd.
Zone Developer /Operator &
Manufacturing - Processing of
Fluorspar
Kenya Fluorspar EPZ
- Kimwarer, Kerio
Valley
43. Kenya Marine Contractors
EPZ Ltd.
Services - Fabrication of sea going
vessels
Comarco Properties
EPZ -Liwatoni,
Mombasa
44. Kikoy Mall EPZ Ltd.,
Manufacturing – Kikoy towels,
Bags, and bath robes
Athi River EPZ
45. Kenya Trading EPZ Ltd.
Manufacturing – Garments Sameer Industrial
Park EPZ
46. Leatherlife EPZ Ltd. Manufacturing - Plant Extract
(wattle tannin) Leather tannin
powder, Mimosa Powder
Athi River EPZ - Athi
River
47. Life Sciences Consultants
EPZ Ltd.
Service – Provision of
Pharmaceutical Project
Consultancy Services
Athi River EPZ
48. Longyun Garments Kenya
EPZ Ltd.
Manufacturing- Garments Zois , Miritini,
Mombasa
49. Lycan (EPZ) Enterprises
Ltd.
Manufacturing- Horticultural
products
Athi River EPZ
50. Mac Nut International EPZ
Ltd.
Manufacturing- Processing
macadamia nuts
Athi River EPZ

170
51. Mega Garments EPZ Ltd. Manufacturing -Garments MJP EPZ - Mombasa
52. Middle East Texco EPZ
Ltd.
Commercial – Garment washing
chemicals
Athi River EPZ - Athi
River
53. Mohazo EPZ (K) Ltd.
Manufacturing- Commercial crafts,
bags & baskets, soapstone items,
Interior decorative items
Athi River
54. Mombasa Apparels EPZ
Ltd.,
Manufacturing- Garments Emirates EPZ -
Mombasa
55. New Wide Garments (K)
EPZ Ltd.
Manufacturing – Knit Garments Transfleet – Athi
River Zone
56. Nodor Kenya EPZ Ltd. Manufacturing – Dart board/Cut
sisal fibre/Darts
Athi River EPZ -
Athi River
57. Olivado EPZ Ltd. Manufacturing – Avocado,
macadamia nut oils
Hopetoun EPZ Ltd.
Murang’a
58. Pure Fry EPZ Ltd. Manufacturing – crude palm oil Athi River EPZ - Athi
River
59. P.J. Dave EPZ Ltd.,
Manufacturing – Dried Herbs and
Roses
PJ Dave EPZ – Isinya,
Kajiado
60. Premium Machinery
Distributor EPZ Ltd.
Commercial Activity—
Importation and Sale of Sewing
Machines and spare parts.
Athi River EPZ – Athi
River

171
61. Real Beverages EPZ Ltd. Manufacturing – wines and spirits Sandton Park EPZ Ltd
62. Red Dot Distribution EPZ
Ltd.
Commercial – computers, printers,
laptops, LCD monitors, servers, ink
(black), ink (others), toners
Athi River EPZ - Athi
River
63. Redington EPZ Ltd.
IT Hardware i.e. Desktops,
Monitors, scanners
Projectors, switches
Athi River EPZ
64. Reltex Tarpaulins Africa
EPZ Ltd.
Manufacturing – polyethylene
tarpaulins
Athi River EPZ - Athi
River
65. Revital Healthcare EPZ
Ltd.
Manufacturing – Plastic Disposable
Syringes
Ashton Apparel EPZ -
Changamwe,
Mombasa
66. Ricardo EPZ International
Co. Ltd.
Manufacturing – Garments Athi River EPZ - Athi
River
67. Royal Garments EPZ Ltd.
Manufacturing - Garments Athi River EPZ - Athi
River, Transfleet
godown
68. Rupa Cotton Mills EPZ
Ltd.
Manufacturing - Cotton Yarn Athi River EPZ - Athi
River
69. Sameer Industrial Park
EPZ Ltd.
Developer/ operator Sameer; Nairobi
70. Sajan Trading EPZ Ltd., Commercial - Textile Apparel
Consumables, Supplies, Machinery
Kipevu EPZ -
Mombasa

172
and Wastes
71. Sandton Park EPZ Ltd.
Service – Zone operator for
Sunflag (i) EPZ, Leasing out
industrial space
Sunflag (i) EPZ – off
Enterprise Rd.,
Nairobi
72. Savannah Cement (EPZ)
Ltd.
Manufacturing - Cement Athi River EPZ – Athi
River
73. Saw Africa EPZ Ltd. Zone Developer / operator Saw Africa EPZ -
Thika
74. Solitaire Gems EPZ Ltd.
Manufacturing – processed & cut
diamonds & gems, gold bars &
ingots Ordered
Sameer Industrial
Park EPZ
75. Soko EPZ Ltd.
Manufacturing – Woven and
knitted women’s Jackets, Dresses,
Skirts and Trousers
Wild Life Works EPZ
- Voi
76. Suman Shakti EPZ Ltd.
Manufacturing- Garments for
Ladies, men and children
Balaji EPZ - Baba
Dogo Ruaraka
Nairobi (former Apex
Apparels EPZ Ltd)
77. Spartan Relief EPZ Ltd.
Commercial -Refugee kits, Fishing
kits ,Agricultural kits, School kits,
Household kits, Hygiene kits,
Shelter kits, Packaging material,
Water and sanitation, Hospital
items, Therapeutic foods, Aquatabs
and Bladder Tanks
Erdemann Industrial
Park – Beijing Rd.
Mlolongo, Mavoko
78. Tailormade Jeanswear
(EPZ) Ltd.
Manufacturing - Athi River EPZ
79. Techno Relief Services Commercial – Emergency Relief Sameer Industrial
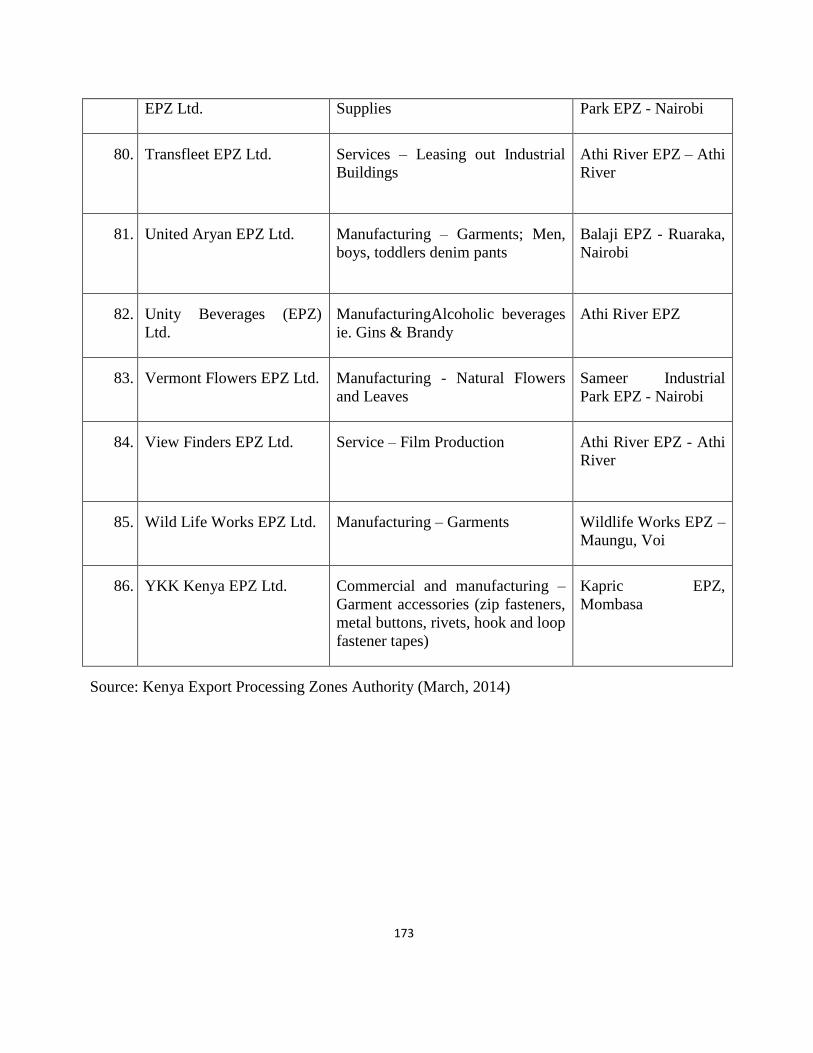
173
EPZ Ltd. Supplies Park EPZ - Nairobi
80. Transfleet EPZ Ltd.
Services – Leasing out Industrial
Buildings
Athi River EPZ – Athi
River
81. United Aryan EPZ Ltd.
Manufacturing – Garments; Men,
boys, toddlers denim pants
Balaji EPZ - Ruaraka,
Nairobi
82. Unity Beverages (EPZ)
Ltd.
ManufacturingAlcoholic beverages
ie. Gins & Brandy
Athi River EPZ
83. Vermont Flowers EPZ Ltd. Manufacturing - Natural Flowers
and Leaves
Sameer Industrial
Park EPZ - Nairobi
84. View Finders EPZ Ltd.
Service – Film Production Athi River EPZ - Athi
River
85. Wild Life Works EPZ Ltd. Manufacturing – Garments Wildlife Works EPZ –
Maungu, Voi
86. YKK Kenya EPZ Ltd. Commercial and manufacturing –
Garment accessories (zip fasteners,
metal buttons, rivets, hook and loop
fastener tapes)
Kapric EPZ,
Mombasa
Source: Kenya Export Processing Zones Authority (March, 2014)

174
Appendix VI: Tests of Regression Analysis Assumptions
Chart A1: Normality Test for Firm Performance

175
Plot A 1: Normality Test for Firm Performance

176
Chart B1: Normality Tet for the Influence of perceived Value of Investment
Promotion Incentives on Firm Performance

177
Plot B 1: Linearity Test for the Influence of Perceived Value of Investment
Promotion Incentives on Firm Performance

178
Plot B 2: Homoscedasticity Test for the Influence of Perceived Value of Investment
Promotion Incentives on Firm Performance

179
Chart B 2: Normality Test for the Influence of Organizational Characteristics on
the Relationship between Perceived Value of Investment Promotion
Incentives and Firm Performance

180
Plot B 3: Linearity Test for the Influence of Organizational Characteristics on the
relationship between Perceived Value of Investment Promotion Incentives
and Firm Performance

181
Plot B 4: Homoscedasticity plot for Influence of Organizational Characteristics on
the relationship between Perceived Value of Investment Promotion
Incentives and Firm Performance

182
Chart B 3: Normality Test for the Influence of Macro-marketing Environment on
the Relationship between Perceived Value of Investment Promotion
Incentives and Firm Performance

183
Plot B 5: Linearity Test for the Influence of Macro-marketing Environment on the
Relationship between Perceived Value of Investment Promotion Incentives
and Firm Performance

184
Plot B 6: Homoscedasticity Test for the Influence of Macro-marketing Environment
on the Relationship between Perceived Value of Investment Promotion
Incentives and Firm Performance
Scatterplot
Dependent Variable: Composite scores of firm performance

185
Chart B 4: Normality Test for the Influence of Macro-Marketing Environment on
the Relationship between Perceived Value of Investment Promotion
Incentives and Firm Performance

186
Plot B 7: Linearity Test for the Joint Influence of Perceived Value of Investment
Promotion Incentives, Organizational Characteristics and Macro-
marketing Environment on Firm Performance
Normal P-P Plot of Regression Standardized Residual
Dependent Variable: Composite scores of firm performance

187
Plot B 8: Homoscedasticity Test for the Joint Influence of Perceived Value of
Investment Promotion Incentives, Organizational Characteristics and
Macro-marketing Environment on Firm Performance

188
Table A 1: Collinearity Diagnostics for the Interaction between Composite Scores of Perceived Value of
Investment Promotion Incentives and Organizational Characteristics
Model
1
Dimension Eigenvalue Condition
Index
Variance Proportions
(Constant) Composite scores of
perceived value of
investment promotion
incentives
Composite scores
of organizational
characteristics
1 2.913 1.000 .00 .01 .01
2 .062 6.875 .01 .38 .73

189
Table A 2: Collinearity Diagnostics for the Interaction between Composite Scores of Perceived Value of
Investment Promotion Incentives and Macro-marketing Environment
Model Dimension Eigenvalue Condition Index Variance Proportions
(Constant) Composite scores of
perceived value of
investment promotion
incentives
Composite scores of
macro-marketing
environment
1
1 2.939 1.000 .00 .01 .01
2 .037 8.919 .03 .85 .45
3 .024 10.988 .97 .14 .54
a. Dependent Variable: Composite scores of firm performance

190
Table A 3: Collinearity Diagnostics for the Interaction among Composite Scores of Perceived Value of Investment
Promotion Incentives, Organizational Characteristics and Macro-marketing Environment
Model Dimension Eigenvalue Condition
Index
Variance Proportions
(Constant) Composite scores
of perceived value
of investment
promotion
incentives
Composite scores of
organizational
characteristics
Composite
scores of macro-
marketing
environment
1 3.892 1.000 .00 .00 .00 .00
2 .064 7.780 .02 .37 .30 .02
3 .026 12.336 .96 .48 .06 .03
4 .018 14.841 .01 .16 .64 .95
a. Dependent Variable: Composite scores of firm performance