Embed Size (px)
Citation preview

1
Perceived Returns to Job Search Overseas: Evidence from a Randomized Control Trial
in the Philippines
Emily A. Beam1
Version: July 31, 2011
PRELIMINARY AND INCOMPLETE: PLEASE DO NOT CITE
Abstract:
The Philippines is one of the world’s largest exporters of labor; it deploys roughly 1.5
million workers overseas each year, who send back remittances that account for 10 percent
of GDP. Migration can bring large income gains for migrants and their families, but the
benefits of migration have been more difficult to access for rural Filipinos, who face
relatively high informational and financial overseas search costs. I conduct a randomized
control trial to evaluate the impact of providing rural Filipinos with information about
average overseas wages and directly subsidizing job search. I find that reducing the cost of
job search directly increases the likelihood of search, but induces negative selection.
Updating individuals’ expectations about average wages has heterogeneous effects,
reducing job search effort on the extensive margin among individuals who with low
perceived probabilities of job finding.
1 Department of Economics and Gerald R. Ford School of Public Policy, University of Michigan. E‐mail: [email protected]. This project is supported with research grants from the Gerald R. Ford School of Public Policy, Population Studies Center, International Policy Center, Center for International Business Education, and the Rackham School of Graduate Studies. I thank Jeff Smith, Rebecca Thornton and Dean Yang for their excellent and helpful comments. Jaye Stapleton, Jose Marie Gonzalez and the SWAP team provided outstanding fieldwork and project management assistance. All omissions and errors are my own.
2
I. Introduction
High job‐search costs and limited screening opportunities are characteristic of many formal
labor markets. A substantial body of research focuses on imperfect information among
employers making hiring decisions (Spence 1973, Aigner and Cain 1977), but jobseekers
also may face information gaps about the job opportunities and corresponding wages
available to them. Imperfect information about job prospects may keep qualified applicants
from the job market and may result in unnecessary costs for unqualified applicants.
The Philippines is one of the world’s largest exporters of labor; 350,000 overseas Filipino
workers (OFWs) leave for new jobs annually. Although migration can bring enormous
income gains for migrants and their families (Clemens, Montenegro, and Pritchett 2008;
Adams and Page 2005), but the benefits of migration have been more difficult to access for
rural Filipinos, who face higher informational and financial overseas search costs than their
urban counterparts. For example, the Bicol Region, the focus of this study, accounts for 5.6
percent of the national population, but only 2.5 percent of the current outflow of OFWs. This
paper focuses on the role of reducing search costs and improving imperfect information on
the decision to look for work. Through the implementation of a randomized controlled trial,
I examine whether search costs and imperfect information may explain why so few
interested rural Filipinos apply for overseas work.2 I evaluate the impact of improving rural
Filipinos’ information about overseas opportunities on job search effort, and eventually on
employment outcomes.
This paper reports the results of the first randomized assessment of the role of imperfect
information among applicants on job‐search effort and employment outcomes. I conduct a
survey assessing the perceived and actual likelihood of being hired for work overseas
among rural Filipinos aged 20‐35. Randomly selected respondents receive information
about the average wages Filipinos earn abroad. I assess the impact of this information on
job search effort measured in three ways: through attendance and participation at a job fair
2 Other explanations include the credit constraints and bureaucratic barriers (Beam, McKenzie, and Yang 2011). Additionally, rural Filipinos may be less skilled or less willing to work overseas than their urban counterparts.

3
and through the willingness to commit windfall consumption to paying for the processing of
a passport.
I find that reducing the cost of search increases the likelihood of job‐search effort, but that
those induced to search have, on average, lower education and less interest in working
abroad. I find that providing information about average wages reduces the likelihood of job
fair attendance, but that this effect is concentrated among those with a low prior expected
probability of job finding. I find no relationship between prior expected wages and
treatment response. Using willingness to commit windfall consumption to purchasing a
passport as a proxy for intent to search yields consistent results, in which only those
respondents who are most confident about their likelihood of being offered a job increase
their demand for assistance as a result of the wage treatment.
These results are consistent with a model in which individuals search for work only if the
perceived benefits, which are increasing in ability, are greater than search costs.
Additionally, information about average wages updates individual expectations about
expected wages and the minimum qualifications needed to find work overseas. Lowering
search costs increases the number of searchers, but those induced to search are of lower
ability on average. Information that updates expectations about wages increases their
expected wages conditional on being offered a job, but also reduces their expected
likelihood of being offered such a job, conditional on ability.
The following section provides background on the overseas Philippine labor market and
motivation for this study. In section 3, I build a simple static model to explore how updating
information about expected wages may have heterogeneous impacts on job search effort.
Section 4 outlines the study design, and Section 5 presents the short‐term impact of these
informational interventions on job‐search effort on the extensive margin. Section 6 reports
a series of robustness checks, and Section 7 concludes.
II. Background
Migration in the Philippines

4
For decades, politicians and government officials have heralded overseas Filipino workers
(OFWs) as the “bagong bayani,” or “modern‐day heroes,” of the nation (E.O.446 2005)3. The
pool of OFWs is large and growing: approximately ten percent of Filipinos are living
overseas, nearly half of those on temporary work contracts, and the Philippines deploys an
average of 1.5 million temporary workers annually (Commission on Overseas Filipinos,
2008). These OFWs send back remittances worth 10 percent of the Philippines’ GDP
annually (Banko Sentral ng Pilipinas 2011).4
The overseas labor market in the Philippines is largely formal and highly regulated.
Clustered in major urban areas, recruitment agencies account for 93 percent of new
contracts (POEA 2009). 5 These agencies are licensed by the Philippine Overseas
Employment Administration (POEA), which establishes guidelines on recruitment practices,
placement fees, and wages. Agencies fill orders from overseas employers by finding and
pre‐screening interested applicants. The overseas employers typically conduct final
interviews with those pre‐selected applicants and make final offers. If the applicant accepts
the offer, she then completes the necessary medical examination, pre‐deployment
orientation, visa application, and final POEA exit clearance before paying her placement fee
and deploying overseas.
In the provincial areas, however, access to these agencies is limited. In Sorsogon Province,
the location of this study, the nearest recruitment agency branch office is a two‐hour bus
ride away; anecdotally, most interested applicants choose to travel ten to twelve hours to
Manila in order to search for work. As a result of this limited access to recruiting
institutions, the job search process is particularly costly for rural applicants, and there may
be few opportunities for applicants to learn about potential returns to job search.
Sorsogon Province presents an ideal context in which to examine the role of imperfect
information among applicants for overseas work: ongoing research in the province
indicates that non‐migrants are highly interested in working overseas. 37 percent of
province residents age 20‐35 who have never worked abroad are interested or strongly
interested in doing so (Beam, McKenzie, and Yang 2011), yet 75 percent of interested
3 The term “modern‐day heroes” was first used by President Corazon Aquino in a 1998 speech to Filipino domestic helpers working in Hong Kong. 4 In 2010, remittances totaled $US 18.8 billion, compared with GDP of $US 188.7 billion. 5 This figure reflects all land‐based contracts, which includes all overseas workers except those working on fishing vessels or ships.

5
residents have never taken steps to apply. Applicants may learn about job opportunities
from social networks or personal experience, but this information may be limited because
of Sorsogon's relative isolation.
Although the Filipino overseas labor market is in many ways unique, the decision to look for
work abroad has several features that resemble other economic decisions, namely that
applicants face costly searches and have limited information about opportunities and their
own qualifications. For example, Avery and Kane (2004) find suggestive evidence that many
students from low‐income backgrounds interested in attending college do not apply
because they believe they will be rejected. Accounting for imperfect information among
applicants is important to understanding how matching processes work in labor, education,
and other settings.
The impact of imperfect information on economic decision‐making
Little research exists about the perceived returns to job search and the effect of these
perceived returns on search effort and employment outcomes. However, researchers have
explored the role of imperfect information on a variety of individual‐level decisions
including education (Jensen 2010, Nguyen 2008), migration (McKenzie, Gibson, and
Stillman 2007), and retirement plan enrollment (Duflo and Saez 2003).
The related literature on the expected returns to education has found that parents and
children may underestimate the true returns to education and under‐invest as a result.
Jensen (2010) finds that eighth‐grade boys in the Dominican Republic substantially
underestimate the wages they would earn by completing high school and college, and that
providing information about average wages increases schooling by 0.20 years over four
years. Nguyen (2008) similarly finds that providing information to parents about the
average returns to schooling raises test scores for those who underestimate the returns to
schooling, and lowers scores for those who overestimate.
These studies suggest that potential jobseekers may also make sub‐optimal decisions in the
presence of imperfect information. Though not as costly as education, job search may be
expensive and time‐consuming. Limited social networks and opportunities for low‐cost
search may lead to substantial biases in individuals’ perceived returns to search.
6
The impact of lowering job‐search costs on entry and selection into search
Obtaining causal empirical evidence about the impact of lowered search costs on labor‐
market participation and job search has been more difficult, as there is little data available
linking job‐search effort to employment outcomes. Large‐scale changes, such as the
introduction of new Internet search technologies, operate multiple through multiple
channels, affecting both applicant and employer search costs6. Although lowering labor
market entry costs will increase the number of participants in the market, labor market
frictions could lead to worse matches if these new entrants are adversely selected and take
up slots that higher productivity applicants would have obtained. Recent evidence on the
impact of relatively low‐cost Internet job search on unemployment suggests that these
online jobseekers may be negatively selected on unobservable characteristics7. (Kuhn and
Skuterud 2004, Hadass 2004). Duflo and Saez (2003) provide causal estimates of the impact
of paying university employees to attend a benefit fair, which they find is successful in
increasing attendance but has no direct impact on benefits enrollment. In the context of fair
attendance, however, opportunity costs and credit constraints may be less of a factor.
III. Theoretical Framework
A Simple Model of Job Search Effort
First, I build a simple static model to provide insight into how shocks to the cost of search
and to expected wages may impact job‐search effort, where searching is a binary choice. I
derive comparative statics to illustrate how a reduction of search costs will lead to
increased search among relatively low‐ability workers. Additionally, I demonstrate how
providing information about average wages can have heterogeneous effects, depending on
where an individual falls in the distribution of ability and the distribution of prior
expectations. In this exposition, I only consider a positive shock to expected wages,
consistent with McKenzie, Gibson, and Stillman’s (2007) findings that individuals 6 For example, a reduction in search costs in aggregate should lead to increased labor market efficiency through better matching, increasing firms’ reservation productivity and in turn individuals’ reservation wages (Pissarides 1990, Autor 2001).
7 An alternative interpretation of Hadass’s finding, that employees matched to jobs via internet search technologies have shorter job duration, may be that those who are matched are skilled at doing so, and are more likely to leave because they found an even better match (Ellison and Ellison 2005).

7
underestimate the returns to migration. However, the intuition could be adapted easily to
account for negative adjustments to expectations. In the analysis, I will allow for
heterogeneous treatment effects based on expected wages.
Prior to searching, an individual faces uncertainty about his likelihood of being hired and
the wages he would earn if hired. I assume that a unitary firm offers a job with certainty to a
worker if his ability is at least equal to a certain threshold. An individual chooses to search if
his expected benefits to searching exceed the cost, which could include the opportunity
costs of search as well as any financial or psychological costs. For simplicity, I assume that
search costs are constant across individuals, though this framework could easily be
adjusted to account for heterogeneity in cost. I assume that wages are also constant.
Equation 1 indicates that individual i is hired if and only if his ability, ai, is greater than an
threshold level x, which the individual cannot observe.
(1) The individual has prior expectations about the threshold, , and the wage, . These
expectations are unbiased, such that the true threshold is equal to the expected threshold
plus some unobserved mean‐zero error with distribution . Similarly, the true wage is
equal to the expected wage plus a mean‐zero error with distribution
(2)
Consequently, the expected gains from search are equal to the expected probability that the
worker is offered a job times the wage, conditional on his ability and expectations, minus
the search cost c.
(3
)
To simplify exposition, I limit my analysis to the case in which individuals have
heterogeneous ability ai and homogeneous expectations, which can be interpreted as
allowing a to vary conditional across individuals on expectations. Alternatively, I could

8
imagine that conditional on ability, individuals have heterogeneous expectation . Because
both search costs and wages are constant across expectations and ability, these
interpretations are interchangeable, and empirically, I will not be able to distinguish
between ability and the expected threshold. The search condition holding expectations
constant across individuals while varying baseline expectations is given in equation 4, and
the search condition holding ability across individuals is given in equation 5. The subscript
R refers to the minimum threshold at which the individual will search.
(4)
(5)
Figure 1a presents a diagram of the expected benefits of search against the expected cost for
a range of abilities. For a given set of expectations and cost, individuals with abilities greater
than , located at the intersection between the benefit and cost curve, will search.
Decrease in cost: In Figure 1a, the cost line is shifted downward from co to c1. This leads to
an unambiguous increase in the number of individuals who choose to search, and those who
search are of lower ability that those who are already searching.
Increase in expected wages: I consider two ways in which individuals may incorporate new
information about expected wages. In Case 1, individuals update their expected wages only.
This leads to an upward shift in the expected benefit function, depicted in Figure 1b.
Case 1: cov(εx, εw) = 0; εw>0; εx=0
=
In Case 2, individuals also update their expected threshold as a result of the update to
expected wages. I assume that when an individual learns that the wage is higher than
expected, she infers that the threshold is also higher than expected. That is, , where

9
Case 1 is a special case where is equal to zero. As shown in Figure 1c, this leads to
the same upward shift as in Figure 1b along with an inward shift.
Case 2 :
=
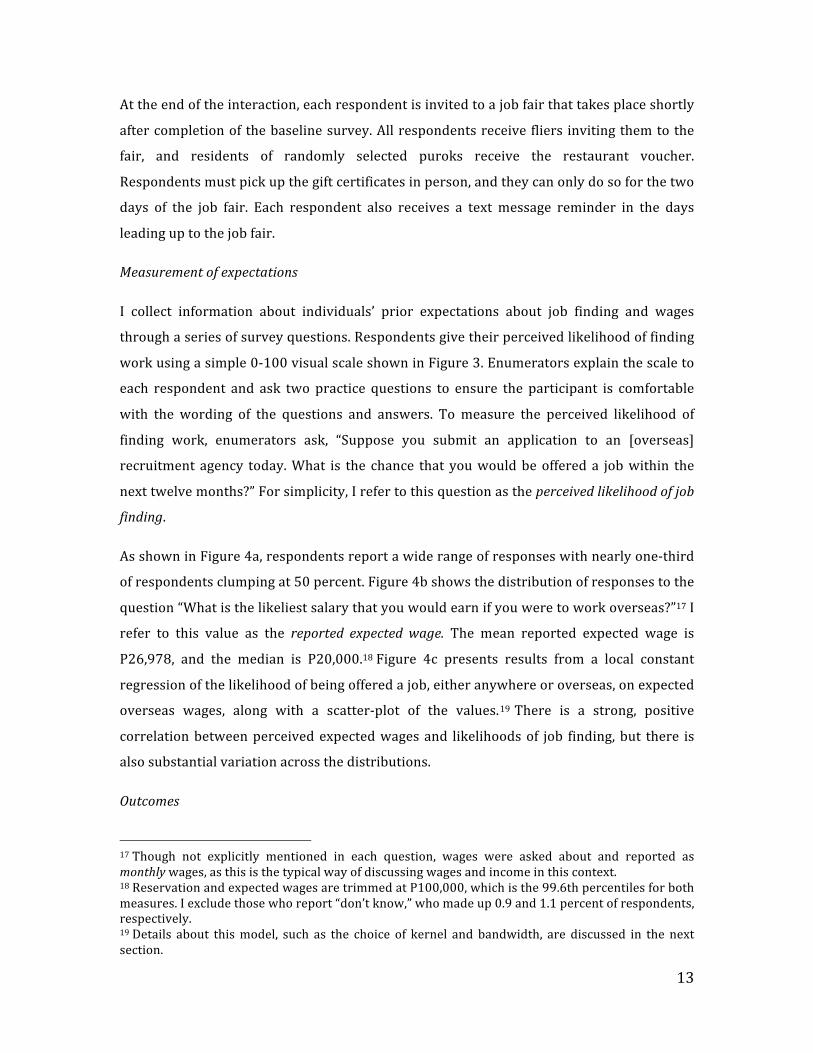
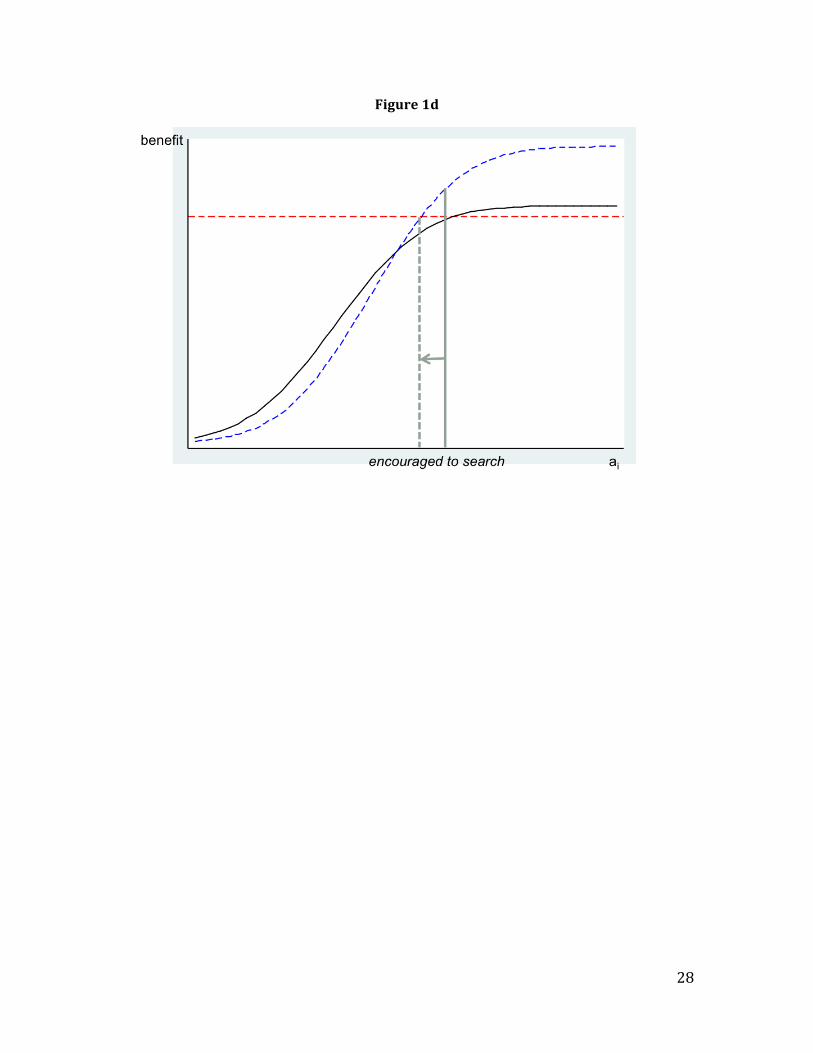
Hence, the effects of the update to expected wages are ambiguous. Figure 1c shows an
example in which the information shock discourages search among low‐ability applicants.
Figure 1d shows an example in which the change in expectations encourages search. In both
cases, the applicants are relatively low‐ability relative to the prior search population.
This basic model generates three testable predictions:
Prediction 1: Lowering job search costs will increase the likelihood of job search.
Prediction 2: Lowering search costs will induce negative selection. Individuals induced to
search by lower job search costs will have lower expected benefits than those already
searching, which could be due to lower ability or lower perceptions about the likelihood of
being hired conditional on ability.
Prediction 3: A positive shock to expected wages will have ambiguous effects on job search
effort, and those influenced by a change in expected wages will have relatively low ability or
prior perceptions about job finding.
In the following sections, I test each of these predictions. I manipulate the cost of search by
providing respondents with a restaurant voucher for attending a job fair, allowing me to
test predictions 1 and 2. In order to test prediction 3, I provide individuals with information
about average overseas wages conditional on employment, which in turn should update
individuals’ expected wages and expected likelihood of being hired conditional on applying.
The next section lays out the experimental design.
IV. Methodology
10
My sample consists of 66 puroks, or districts, from 17 barangays from the municipality of
Bulan in Sorsogon Province. While the barangay is smallest official administrative level in
the Philippines, each barangay is divided into three to ten puroks, or districts, with an
average of 6.5 puroks per barangay. These puroks typically represent the local
neighborhoods and communities in which people interact daily. I select all ten barangays
that are either classified by the Philippine National Statistics Office as urban or that
compose the central downtown (población) areas. Seven are drawn randomly from the
remaining 53 rural and outlying barangays. The puroks are randomly selected from the 107
total puroks in those barangays. 8
Because respondents may have strong social networks within their nearby communities, I
randomize at the purok level to reduce contamination from information spillovers. To
increase power, I generate eleven stratification cells of six puroks each based on purok
density and distance from the location of the job fair. This procedure minimizes the
likelihood of spurious correlations due to an unbalanced sample (Bruhn and McKenzie
2008).
Using household rosters provided by each barangay captain, I randomly select five
households with men aged 20‐35 and five households with women aged 20‐35. I randomly
select one member of the selected gender to be the target respondent in cases where there
are several potentially eligible members of our study sample. A number of individuals were
ineligible because (a) they were currently living in another municipality or (b) they had no
contact cell phone numbers. The number of individuals dropped as a result of having moved
elsewhere is particularly high because the rosters provided by local barangays included
household members living outside of the municipality at the time of collection.9 In some
instances, the team exhausted the barangay rosters before reaching the target five men or
five women, so the total number of survey individuals in a purok is lower than the target of
8 Some rural barangays had to be substituted due to safety and logistical concerns. 9 As many as 40 percent of originally selected respondents were living outside the municipality. When possible, out‐of‐town respondents were replaced with the next randomly selected eligible household member of the same gender. Otherwise, the next randomly selected respondent from another household was used. Therefore, this sample is not representative of all members of Bulan households, but should be representative of all 20‐35‐year‐old current Bulan residents.

11
ten.10 Overall, 87 percent of puroks have at least eight respondents, and 53 percent have at
least ten respondents11.
Each purok is randomly assigned to receive one of four treatments: no additional treatment,
information about average overseas wages, a voucher to attend a local job fair, or both
information and the incentive. I randomly select 537 individuals from these puroks, each of
whom receives his pre‐assigned treatment. To be eligible, a respondent must be aged 20‐35,
have a cell phone number, and have never worked abroad. She completes a brief survey
about her work experience, interest and exposure to overseas work, and expectations about
possible wages within and outside the Philippines.
After the survey, interviewers read and explain the wage information treatment flier to the
information respondents. Next, all respondents participate in a discrete choice exercise in
which they select between a cash prize and a coupon good for a discount on a passport at a
variety of prices. Respondents have a ten percent chance of winning one of their choices.
Finally, all respondents are invited to attend an upcoming job fair, and incentive
respondents each receive a coupon that can be redeemed at the fair for a P150 gift
certificate to a popular local fast food restaurant12.
Table 1 presents descriptive statistics of the sample of 537.13 Column 1 reports mean
demographic characteristics for the control group. By design, approximately half of the
sample is female. Three‐fourths of respondents have completed high school, and 15 percent
have completed college.14 These education completion rates are consistent with ongoing
work by Beam, McKenzie, and Yang (2011) in other parts of Sorsogon Province. About 38
percent of respondents report being currently employed; this includes anyone who worked
for pay in the past month, regardless of whether it was in the formal or informal sector.15
10 While this procedure ensures that we interview no more than one individual per household for a given gender, there are cases in which we may interview one man and one woman in the same household. 11 In one purok, surveyors accidentally interviewed an eleventh respondent. 12 The gift certificate is good for P150 at Jollibee, a popular Filipino fast‐food chain, which covers the cost of a meal for two to four people. Local government officials were hesitant to give cash as an incentive, and the Jollibee gift certificate was a well‐received compromise. 13 This imbalance is mostly to the sampling procedure and high out‐migration rates described earlier. These numbers may adjust slightly once data entry is completed. 14 Students graduate from high school after ten years of schooling, so members of this sample could have completed college by age twenty. 15This includes self‐employed farmers, fisherman, and shop‐owners. However, some respondents may have worked in these capacities without pay, and would not be recorded as employed.

12
Mean household income is P5,700 per month, approximately US$133 per month. The 71
percent who report being “interested” in working abroad consist of all those who answered
that they were “strongly interested,” “somewhat interested,” “neutral,” or “slightly
interested.”16 Among all respondents, only 27 percent had ever taken steps to apply for
work overseas in the past.
Columns 2 through 4 report the mean difference from the control group for each of the
three treatment groups. I run t‐tests of the equality of means between each treatment group
and the control group separately, clustering standard errors at the purok level, and any
results that are significantly different from the control group at the 10‐percent level are
marked with one star, at the 5‐percent level with two stars, and at the 1‐percent level or
less with three stars. Only two demographic measures are statistically different from the
control group; the average longest employment spell for the wage information group is 0.73
years, and members of the voucher only group are 15 percentage points less likely to be
interested in working abroad than the control group. This second difference is substantial,
so the main results will control for baseline covariates.
Column 5 reports the F‐statistics from a joint test of the equality of means between the
control group and each treatment group, clustering standard errors at the purok level. Only
the F‐statistic for the interested in working abroad variable is large enough to reject
equality at the 10 percent level, and this is driven by the large difference in average interest
between the voucher only group and the other three groups.
Interventions
The wage information treatment, shown in Figure 2, consists of a single flier that compares
the average earnings of overseas workers from the Philippines with the average reported
income of families in Sorsogon Province. Wage data for OFWs is taken from a Philippine
Overseas Employment Administration (POEA) dataset of all new overseas contracts from
2008‐2009 (McKenzie, Theoharides, and Yang 2011), and data for Sorsogon families comes
from a survey of approximately 5,000 households across the province in other
municipalities (Beam, McKenzie, and Yang 2011). In addition to giving the flier to the
respondent, the enumerators read a short script describing the information it contains.
16 Not reported in the table, 26 percent of respondents said they were “strongly interested” in working overseas
13
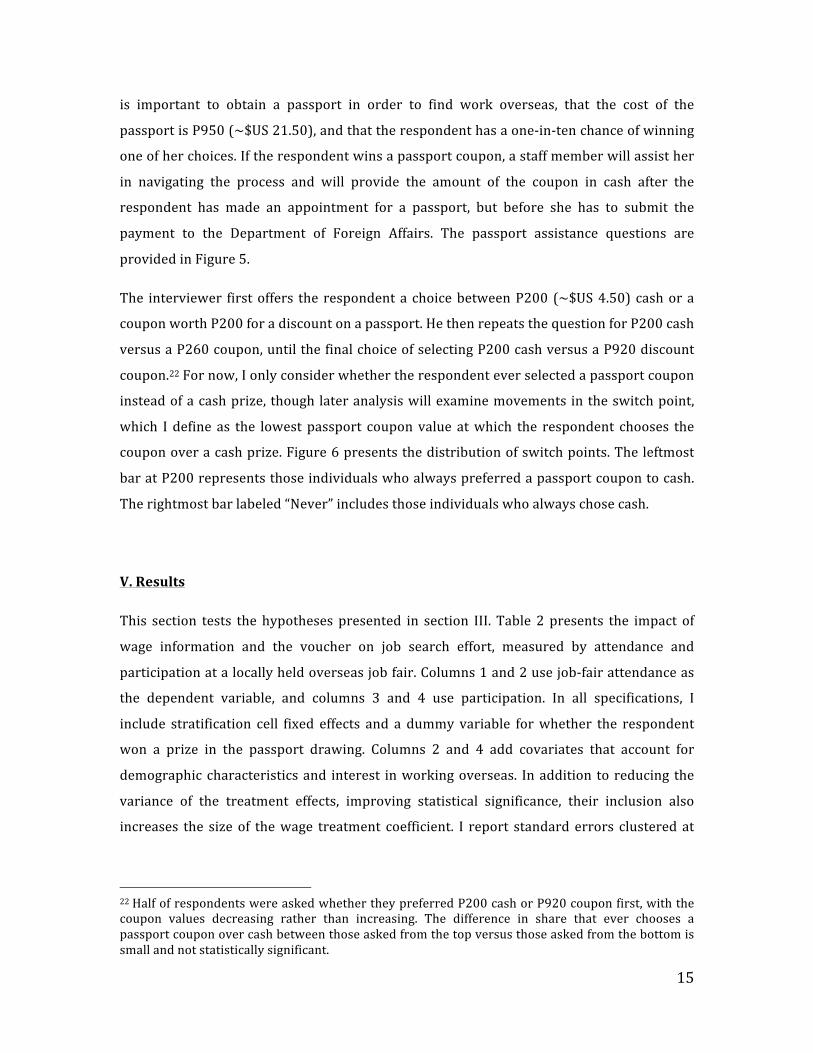
At the end of the interaction, each respondent is invited to a job fair that takes place shortly
after completion of the baseline survey. All respondents receive fliers inviting them to the
fair, and residents of randomly selected puroks receive the restaurant voucher.
Respondents must pick up the gift certificates in person, and they can only do so for the two
days of the job fair. Each respondent also receives a text message reminder in the days
leading up to the job fair.
Measurement of expectations
I collect information about individuals’ prior expectations about job finding and wages
through a series of survey questions. Respondents give their perceived likelihood of finding
work using a simple 0‐100 visual scale shown in Figure 3. Enumerators explain the scale to
each respondent and ask two practice questions to ensure the participant is comfortable
with the wording of the questions and answers. To measure the perceived likelihood of
finding work, enumerators ask, “Suppose you submit an application to an [overseas]
recruitment agency today. What is the chance that you would be offered a job within the
next twelve months?” For simplicity, I refer to this question as the perceived likelihood of job
finding.
As shown in Figure 4a, respondents report a wide range of responses with nearly one‐third
of respondents clumping at 50 percent. Figure 4b shows the distribution of responses to the
question “What is the likeliest salary that you would earn if you were to work overseas?”17 I
refer to this value as the reported expected wage. The mean reported expected wage is
P26,978, and the median is P20,000.18 Figure 4c presents results from a local constant
regression of the likelihood of being offered a job, either anywhere or overseas, on expected
overseas wages, along with a scatter‐plot of the values.19 There is a strong, positive
correlation between perceived expected wages and likelihoods of job finding, but there is
also substantial variation across the distributions.
Outcomes
17 Though not explicitly mentioned in each question, wages were asked about and reported as monthly wages, as this is the typical way of discussing wages and income in this context. 18 Reservation and expected wages are trimmed at P100,000, which is the 99.6th percentiles for both measures. I exclude those who report “don’t know,” who made up 0.9 and 1.1 percent of respondents, respectively. 19 Details about this model, such as the choice of kernel and bandwidth, are discussed in the next section.

14
I measure job search on the extensive and intensive margin through participation in a local
job fair organized in partnership with the local government of Bulan.20 Four overseas
recruitment agencies and one local employer from another province participated in the fair.
Although specific recruitment procedures vary by firm, participants typically visited
agencies of interest to apply and undergo a pre‐screening interview that day. Job fair
participants could also enroll in an online job‐finding website or visit a booth to learn how
to apply for a passport. The fair was advertised through fliers and radio in the days before
the fair, and all survey respondents received two text message reminders on the day of the
job fair. Overall attendance was 767, with many participants attending both days. Survey
respondents made up 29 percent of all attendees.21
Survey staff assigned each participant a unique identifier upon arrival, and this number was
recorded when participants visited a recruitment agency booth, enrolled in an online job‐
finding website, visited a passport information booth, retrieved their restaurant voucher,
and exited. A survey respondent is recorded as “attending” the fair if he registered his name
at the entrance and received a number. Some simply exchanged their vouchers for the
restaurant gift certificates and left; others attended both days of the fair and applied at
several recruitment agencies.
If he also applied at a recruitment agency, visited a booth to enroll in a job‐finding website,
or visited a passport information booth, then he is recorded as “participating.” 56.8 percent
of all respondents who attended the job fair also participated; 87.5 percent of the control
group attendees also participated, as did 16.8 percent of the voucher recipients.
The third measure of job search is the willingness to commit windfall consumption to a
passport. After the information treatment, but prior to the job fair invitation, the survey
concludes with a series of choices about whether the respondent would prefer a cash prize
or a coupon for a discount on a passport. The interviewer explains to the respondent that it
20 Although participants were aware that researchers were tracking their numbers, they likely perceived the job fair as a “normal job fair”. Their first interaction was with staff members of the municipal Public Employment Service Office (PESO), which typically coordinates local recruitment activities. Receiving numbers and filling out forms before entering the fair is common at most job fairs – the PESO officers also distributed numbers and a bio‐data sheet – and the remaining post‐registration activities were typical of other local job fairs. The local PESO office also claimed full credit for the implementation of the job fair – both during and after the fair – further reducing any perceptions that this was a “research” job fair. 21 40 percent of attendees said they heard about the fair through radio, 11 percent through a flier, and 16 percent through a friend.
15
is important to obtain a passport in order to find work overseas, that the cost of the
passport is P950 (~$US 21.50), and that the respondent has a one‐in‐ten chance of winning
one of her choices. If the respondent wins a passport coupon, a staff member will assist her
in navigating the process and will provide the amount of the coupon in cash after the
respondent has made an appointment for a passport, but before she has to submit the
payment to the Department of Foreign Affairs. The passport assistance questions are
provided in Figure 5.
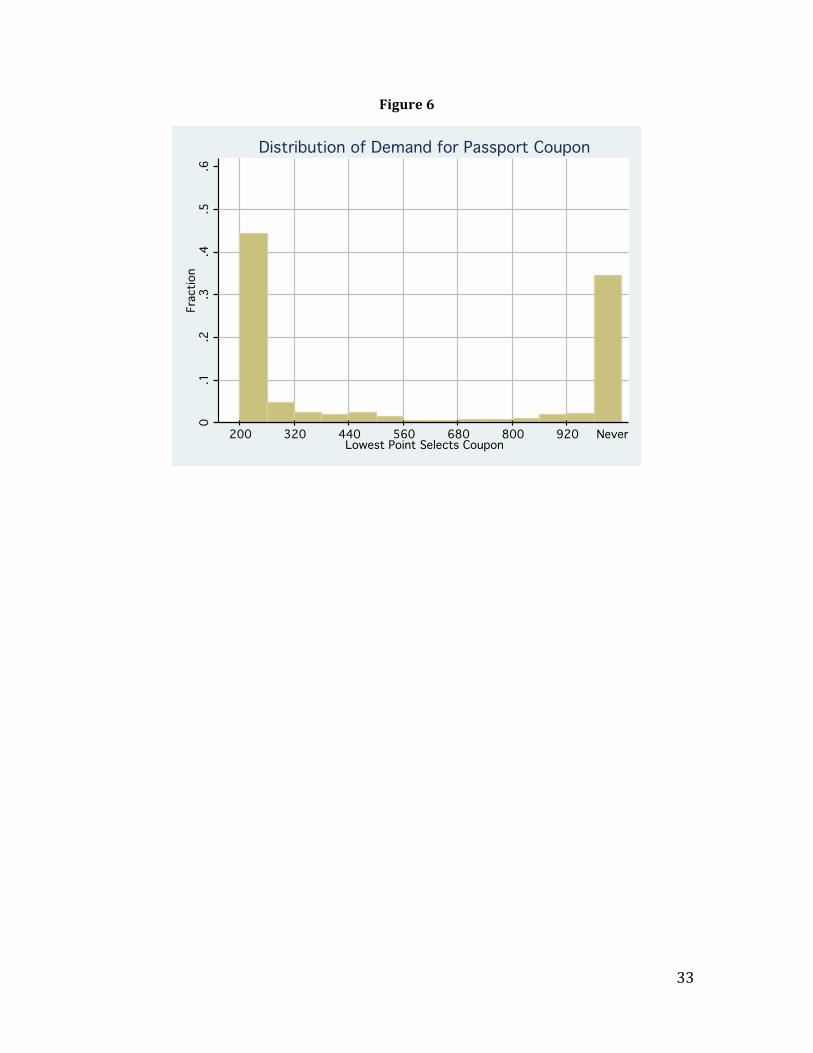
The interviewer first offers the respondent a choice between P200 (~$US 4.50) cash or a
coupon worth P200 for a discount on a passport. He then repeats the question for P200 cash
versus a P260 coupon, until the final choice of selecting P200 cash versus a P920 discount
coupon.22 For now, I only consider whether the respondent ever selected a passport coupon
instead of a cash prize, though later analysis will examine movements in the switch point,
which I define as the lowest passport coupon value at which the respondent chooses the
coupon over a cash prize. Figure 6 presents the distribution of switch points. The leftmost
bar at P200 represents those individuals who always preferred a passport coupon to cash.
The rightmost bar labeled “Never” includes those individuals who always chose cash.
V. Results
This section tests the hypotheses presented in section III. Table 2 presents the impact of
wage information and the voucher on job search effort, measured by attendance and
participation at a locally held overseas job fair. Columns 1 and 2 use job‐fair attendance as
the dependent variable, and columns 3 and 4 use participation. In all specifications, I
include stratification cell fixed effects and a dummy variable for whether the respondent
won a prize in the passport drawing. Columns 2 and 4 add covariates that account for
demographic characteristics and interest in working overseas. In addition to reducing the
variance of the treatment effects, improving statistical significance, their inclusion also
increases the size of the wage treatment coefficient. I report standard errors clustered at
22 Half of respondents were asked whether they preferred P200 cash or P920 coupon first, with the coupon values decreasing rather than increasing. The difference in share that ever chooses a passport coupon over cash between those asked from the top versus those asked from the bottom is small and not statistically significant.

16
the purok level, which are robust to heteroskedasticity and allow for correlation between
individuals in the same purok.
Impact of reducing search costs on job search effort (Prediction 1)
Consistent with prediction 1, reducing the cost of search by providing a voucher has a large,
positive effect on the likelihood of attendance and participation. The voucher increased the
likelihood of attendance by 34 to 36 percentage points, an approximately 260‐percent
increase from a control attendance rate of 13.7 percent. Similarly, it increased the likelihood
of participation by 8 to 10 percentage points, or by roughly 80 percent from the control
group participate rate of 12.3 percent.
Conversely, the wage information treatment appears to have no effect on job‐search effort;
the coefficients are close to zero and not statistically significant. There appears to be a
negative interaction effect, but this is small and imprecisely estimated. That the information
treatment does not affect the likelihood of attendance or participation on average is not
surprising, given that the model suggests there may be ambiguous effects.
Impact of reducing search costs on selection into job search (Prediction 2)
Prediction 2 indicates that individuals induced to search as a result of lower search costs
will be of lower ability compared with other searchers. As a first pass, Table 3a presents
descriptive means among job‐fair attendees, broken into treatment subgroups. Because
selection effects may go in different directions, I keep the wage/voucher treatment group
separate from the other two. Although the sample sizes are small, with only 24 individuals
in the control group and 125 respondents overall, there are some clear patterns. Members
of the voucher treatment group who attend the job fair have much lower educational
attainment. Nearly one‐third have not completed high school, compared with 8 percent of
control group attendees, and only 20 percent have completed college, compared with 29
percent. Additionally, voucher attendees are less likely to be interested in working abroad,
are less likely to have plans to apply, and report a much lower expected likelihood of hiring.
Perhaps most convincingly, only 40 percent of the voucher only group participates
conditional on attending.
Table 3b presents similar descriptive means among those who participate in the job fair,
broken into treatment subgroups. Here, the sample sizes are even smaller, making

17
statistical comparisons difficult. However, after the least interested applicants leave the fair,
the voucher participants who stay to participate are still less qualified, less interested, and
less confident compared with control group participants. In both tables, the wage treatment
group (column 2) appears relatively similar to the control group, and the wage/voucher
group resembles the voucher‐only group in its demographic characteristics., suggesting the
voucher effect still dominates in that group.
While these results suggest that respondents induced to search because of reduced costs
are less qualified and less interested, they should be interpreted with caution. Tables 3a and
3b represent means only and do not account for correlations between explanatory variables
or adjust for the sample imbalances across treatment groups seen in Table 1. Table 4
presents regression results of a model that predicts the likelihood of attendance and
participation, with the voucher treatment dummy interacted with each of the covariates.
The left‐most column of each equation presents the coefficients on each non‐interacted
covariate, which represent the demographic determinants of job‐fair attendance. The right‐
most column presents the interaction term. Because selection appears to be similar
between the wage/voucher and the voucher only treatment groups, I present results
comparing members of both groups to the control and wage groups, including wage
treatment and wage interaction effects. These results are robust to restricting the sample to
include to just the voucher recipients.
Independent of covariates, the voucher treatment dummy has a large statistically significant
effect on the likelihood of attendance. As would be expected, those with higher levels of
education, particularly vocational training or a college degree, with greater interest in
working abroad, and with a greater expected likelihood of being hired are more likely to
attend and more likely to participate. Those who receive the voucher and attend, however,
have lower education overall (though not to a statistically significant degree), and are less
interested in working abroad. Conditional on education (as a proxy for ability) and interest,
the interaction between the likelihood of being hired and the voucher is close to zero and
statistically insignificant. These results are repeated among participants, though the college
interaction term is marginally statistically significant. Those who stay and participate are
marginally more likely to be interested in working abroad in the voucher group compared
to the control group, though this coefficient is imprecise.
Impact of updating information on job search effort and selection (Prediction 3)

18
The model indicates that responses to additional information about overseas wages may
vary depending on individual ability and perceived value of the threshold. I do not observe
these parameters directly; rather, I know the respondents’ expected overseas wages as well
as their perceived likelihood of job finding conditional on applying for work. Table 5
reports a series of tests for heterogeneous information treatment effects; here I interact the
information treatment with prior expectations of the likelihood of job finding and overseas
wages. Each specification A‐E reports the results from a separate regression, each of which
includes demographic covariates and a treatment dummy variable for the voucher. In
specifications C and E, I omit the wage treatment dummy, preferring the fully saturated set
of interaction terms instead. Results from columns 1 and 2 in specification A are identical to
columns 2 and 4 of Table 2 and demonstrate that, on average, the information treatment
has no effect on attendance or participation.
Specifications B and C interact the wage treatment dummy with the perceived likelihood of
job finding, first with a linear interaction and secondly with a series of categorical dummy
variables. The wage treatment reduces the likelihood of job‐fair attendance by 11.9
percentage points, which is significant at the 10‐percent level. Because the likelihood is
scaled to be a fraction between zero and one, every 10‐percent increase in the likelihood of
job finding is associated with 1.9 percentage‐point differential in attendance among those
who receive the wage treatment. For specification C, I break the perceived likelihood of job
finding into rough quintiles, separating individuals who report a 50‐percent likelihood into
their own category. I do this because it is not clear whether respondents who report a 50‐
percent likelihood do so because they truly believe they have a 50‐percent chance of being
offered a job, or whether they are uncertain. The wage treatment reduces job‐search effort
by between 8 and 16 percentage points for all respondents who report a job‐finding
likelihood of less than 75 percent, with the exception of the 50‐percent respondents, for
whom there is no overall treatment effect. The most confident respondents, those with a
perceived likelihood of at least 75 percent, are actually more likely to attend the job fair as a
result of the wage treatment. The treatment increases their probability of attendance by 16
percentage points, which is significant at the 10‐percent level.
In column 2, I use job‐fair participation as the dependent variable, which is equal to zero for
non‐attendees and those who attend the job fair but do not engage in any search activity. As
shown in Table 3a, this variable primarily eliminates those respondents who only came to

19
pick up their restaurant voucher, who are less qualified and less motivated to find work
overseas. Here, the results are similar to those in column 1, though my estimates are not
statistically significant. Unsurprisingly, the magnitudes of the estimates drop the most for
individuals in the bottom two quintiles, who would also be least likely to participate.
The third column predicts the willingness to commit windfall consumption to a passport,
which serves as an alternative measure of interest in job‐search, though not a direct
measure. Interest in the passport coupon may vary substantially across individuals based
on their interest in applying for a passport, their trust of the enumerator, and their
understanding of the program and the questions. However, the only difference, on average,
between the treatment and control groups should be that induced by the informational
treatment. Still, for this to be an effective measure of interest in working abroad,
respondents who perceive themselves as less likely to work overseas should require a
higher coupon value to be induced to choose a coupon over a cash prize. I expect that this
relationship would be less true for individuals who already have a passport; while the
coupon could be used to renew a passport, it likely would be less valuable. Indeed, I find
that 60 percent of those with a valid passport never choose a coupon over cash, compared
with just 36 percent of those with no valid passport.
Perhaps because this variable measures intent to search rather than search itself, the
effects of the wage treatment are much stronger but consistent with the patterns in columns
1 and 2. The wage treatment causes individuals with the lowest confidence in their ability to
find work overseas to be 11.2 percentage points less likely ever to select the passport
coupon over cash, while those with the highest confidence are 25.2 percentage points more
likely to ever choose the coupon. This latter result is significant at the one‐percent level.
Figures 7a and 7b present semi‐parametric estimates of the impact of the wage treatment
by the perceived likelihood of job finding. In Figure 7a, I plot the results of a local second‐
order polynomial regression of attendance on the likelihood of job finding separately for
members of the treatment and control group. In Figure 7b, I take the difference between
treatment and control groups at each point of the grid. In order to generate confidence
intervals, I bootstrap my sample, clustering by purok, with 1000 repetitions and plot the 2.5
and 97.5 percentiles. While results are not statistically significant at any individual point,
they plot the general reduction in the likelihood of attendance induced by the wage
treatment for those with the lowest confidence in their likelihood of being offered work.
20
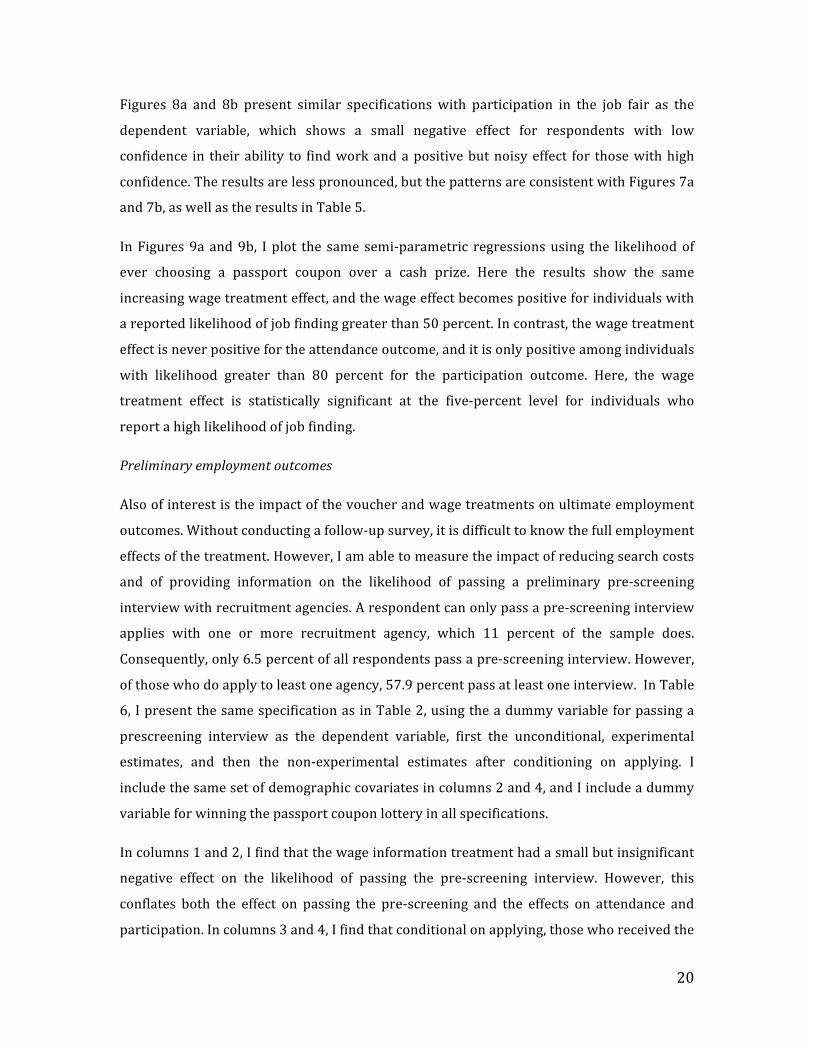
Figures 8a and 8b present similar specifications with participation in the job fair as the
dependent variable, which shows a small negative effect for respondents with low
confidence in their ability to find work and a positive but noisy effect for those with high
confidence. The results are less pronounced, but the patterns are consistent with Figures 7a
and 7b, as well as the results in Table 5.
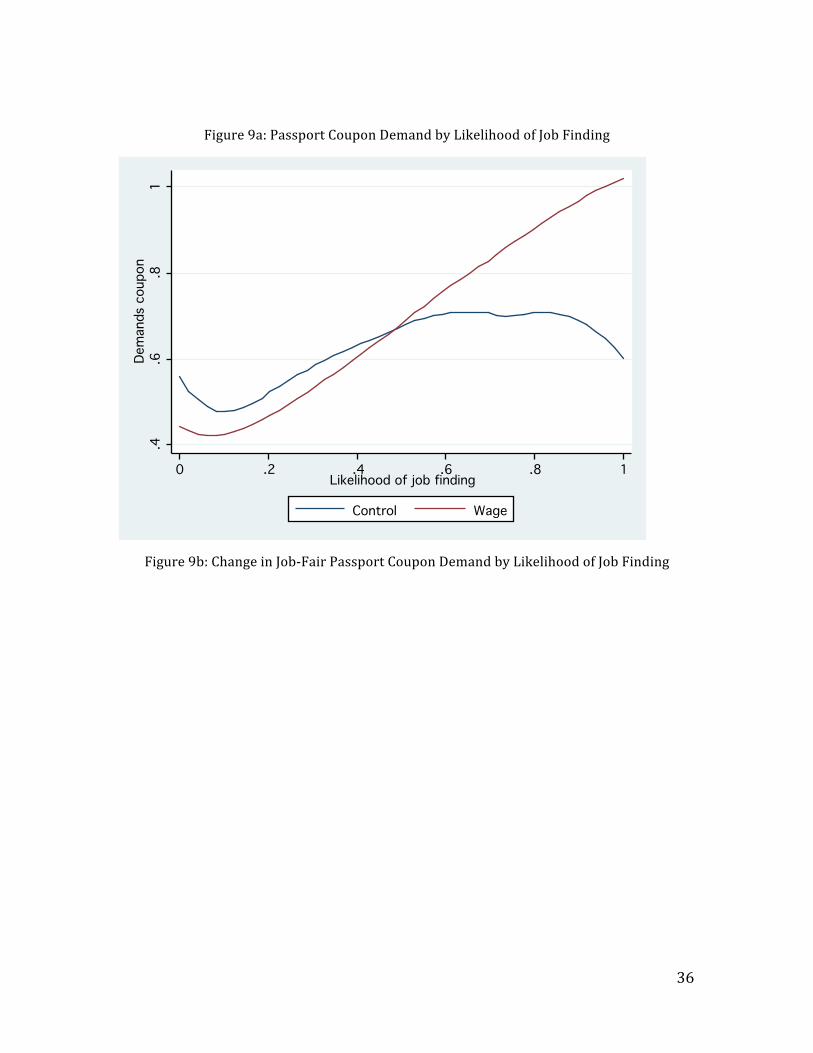
In Figures 9a and 9b, I plot the same semi‐parametric regressions using the likelihood of
ever choosing a passport coupon over a cash prize. Here the results show the same
increasing wage treatment effect, and the wage effect becomes positive for individuals with
a reported likelihood of job finding greater than 50 percent. In contrast, the wage treatment
effect is never positive for the attendance outcome, and it is only positive among individuals
with likelihood greater than 80 percent for the participation outcome. Here, the wage
treatment effect is statistically significant at the five‐percent level for individuals who
report a high likelihood of job finding.
Preliminary employment outcomes
Also of interest is the impact of the voucher and wage treatments on ultimate employment
outcomes. Without conducting a follow‐up survey, it is difficult to know the full employment
effects of the treatment. However, I am able to measure the impact of reducing search costs
and of providing information on the likelihood of passing a preliminary pre‐screening
interview with recruitment agencies. A respondent can only pass a pre‐screening interview
applies with one or more recruitment agency, which 11 percent of the sample does.
Consequently, only 6.5 percent of all respondents pass a pre‐screening interview. However,
of those who do apply to least one agency, 57.9 percent pass at least one interview. In Table
6, I present the same specification as in Table 2, using the a dummy variable for passing a
prescreening interview as the dependent variable, first the unconditional, experimental
estimates, and then the non‐experimental estimates after conditioning on applying. I
include the same set of demographic covariates in columns 2 and 4, and I include a dummy
variable for winning the passport coupon lottery in all specifications.
In columns 1 and 2, I find that the wage information treatment had a small but insignificant
negative effect on the likelihood of passing the pre‐screening interview. However, this
conflates both the effect on passing the pre‐screening and the effects on attendance and
participation. In columns 3 and 4, I find that conditional on applying, those who received the

21
wage information were 42 percentage points less likely to pass the pre‐screening interview.
This result stands out for its direction and magnitude. The negative sign suggests that while
the wage information reduced job‐search effort among the least confident and increased it
among the most confident, that selection may have actually resulted in a negatively selected
pool of applicants. Consistent with earlier findings, it appears that the voucher treatment
group members also performed worse conditional on applying, though this estimate is
imprecise. Both these results should be interpreted with caution, as the sample sizes in each
treatment group are very small. Among the 57 applicants, 19 received the wage only
treatment, 8 respondents received the wage treatment and the voucher, and 11 received the
voucher only.
VI. Robustness Checks
Income
Another possible confounding factor is that the wage information treatment actually
provides two pieces of information: it tells respondents the average wages of overseas
workers, and it tells them the average income of Sorsogon residents. The second piece of
information was included simply to frame the wage information in a more salient manner,
but it may have inadvertently impacted respondents’ beliefs about their own possible
earnings locally or about their position in the wage distribution based on differences in
local earnings, which in turn may have influenced job search behavior.
This concern is also salient because a coding error I made in compiling the wage
information led to an overstatement of average local wages. Coded properly, the true
measured average wage of a Sorsogon family is P7,850, as opposed to the average wage of
P12,000 reported on the intervention fliers. This overstatement of average wages by more
than 50 percent may have had several unintended effects that could confound analysis. A
follow‐up survey will enable direct estimation of the effect of wage information on beliefs
about expected wages locally and overseas, as well as beliefs about expected job‐finding
probabilities locally and overseas. For now, I use those indicators I do have to determine
whether the treatment effects I see are a result of the local wage component of the
information treatment, as opposed to the overseas wage component.
If individuals with household incomes lower than the reported mean average household
income were discouraged, and hence less likely to search, because of the comparison

22
between overseas wages and local household income, then the wage treatment should have
had a more negative effect on the attendance of poorer individuals relative to wealthier
individuals. I test for this in Table 7 by interacting income quintiles with the wage
treatment variable. I include the same interaction with perceived likelihood quintiles.
As shown in specification F, the interaction of household income with the wage treatment
yields estimates that are not negative across all quintiles and not statistically significant.
There appears to be no positive trend in income interaction effects that one would expect if
the wage information instead discouraged the poorest individuals. In columns 1 and 3,
coefficients are negative for the highest quartiles, the opposite of what would be expected if
the treatment discouraged the poorest respondents. The same is true for columns 2 and 3,
though the coefficient for highest quintile individuals in column 2 is positive. The
interaction effects of wage with perceived likelihood do not change substantially. These
results suggest that it is unlikely the wage intervention inadvertently discouraged job
search among those with lower incomes and affirm that the perceived likelihood of finding a
job is actually driving the results.
VII. Conclusions
In the Philippines, the decision to search for work overseas may be just the first step of a
difficult and costly process of migrating abroad. Yet at this stage, interested applicants have
limited information about wages and work opportunities that leads to inefficient sorting
into search. In a unique field experiment, this paper examines the impact of job‐search costs
and perceptions on job‐search effort. I find evidence that reducing the cost of search
increases search effort, but also induces negative selection. These results are consistent
with a simple model in which job search behavior depends on the perceived benefits to
search, which are increasing with ability. Policy interventions that reduce the cost of search
may be successful in increasing the number of applicants, but it appears that the applicants
it induces to search are of relatively lower quality.23 Although the voucher increased
attendance dramatically, it had a much smaller effect on participation, and no effect on the
likelihood of passing the pre‐screening interview.
23 This also is consistent with results from Duflo and Saez (2003), who find that university employees who were incentivized to attend a health benefits fair were no more likely to enroll in the tax‐differed accounts being promoted there.

23
This paper also tests how individuals respond to new information about the returns to job
search by randomly assigning respondents to receive information about average wages
overseas. When only considering treatment effects on average, the wage information
appears to have no impact. However, those with low confidence in their ability to find jobs
overseas were discouraged from searching for work. A slight modification of the simple
model explains how this result could arise. If individuals update their likelihood of being
offered a job conditional on ability, modeled in this case as a minimum threshold, in
response to information that updates expected wages, then the information treatment could
have ambiguous effects. Individuals with low perceived benefits to search are discouraged
from searching.
Still left relatively unexamined is the impact of these shocks to job‐search effort on job‐
finding outcomes. I find suggestive evidence that reducing search costs yields no increase in
employment, because those individuals induced to apply from the reduction are of lower
ability. Additionally, it appears that updating individuals’ expectations about overseas
wages using national averages may not increase overall employment, and may result in a
pool of applicants that is less successful compared to those not given information. However,
these findings should be interpreted with caution due to very small sample sizes and limited
data. I plan to follow‐up with respondents to gain better information about ultimate
employment outcomes and beliefs about the returns to job search, which have now been
updated both by the information treatment, the job‐fair, and the respondents’ subsequent
job‐search behavior.

24
References
Adams, Richard H. and John Page (2005). “Do International Migration and Remittances Reduce Poverty in Developing Countries?” World Development, 33(10), 1645‐69. Aigner, Dennis J. and Glen G. Cain. “Statistical Theories of Discrimination in Labor Markets.” Industrial and Labor Relations Review, 30(2), 175‐187. Ang, Alvin. (2009). “Worker Remittances and its Impact on Rural Development in the Philippines.” Asia‐Pacific Social Science Review, 9(2), 63‐77. Attanasio, Orazio P., and Katja Maria Kaufmann. (2008). “School Choices, Subjective Expectations and Credit Constraints,” Bocconi University and University College London Working Paper. Autor, David. 2001 “Wiring the Labor Market.” The Journal of Economic Perspectives. 15(1): 25‐40.
Avery, Christopher and Thomas J. Kane. (2004). Student perceptions of college opportunities: The Boston COACH program. In Caroline M. Hoxby, editor, College Choices: The Economics of Where to Go, When to Go, and How to Pay For It. University of Chicago Press. Bangko Sentral ng Pilipinas. (2009). “Overseas Filipinos’ Remittances.” http://www.bsp.gov.ph/statistics/keystat/ofw.htm. Accessed April 5, 2011. Beam, Emily, David McKenzie, and Dean Yang. (2010). “Financial and Informational Barriers to Migration: A Field Experiment in the Philippines.” Ongoing study, University of Michigan and World Bank. Bruhn, Miriam and David McKenzie. (2008). “In Pursuit of Balance: Randomization in Practice in Development Field Experiments.” World Bank Working Paper 4752. Clemens, Michael, Claudio Montenegro and Lant Pritchett (2008). “The Place Premium: Wage Differences for Identical Workers across the U.S. border,” Center for Global Development Working Paper No. 148. Commission on Filipinos Overseas. (2008). “Stock Estimates of Overseas Filipinos.” Accessed Oct. 3, 2010. Delavande, Adeline, Xavier Gine and David McKenzie. (2010). “Eliciting Probabilistic Expectations with Visual Aids in Developing Countries.” World Bank Policy Research Working Paper 5458. Duflo, Esther and Emmanuel Saez. (2003). “The Role of Information and Social Inter‐ actions in Retirement Plan Decisions: Evidence from a Randomized Experiment,” Quarterly Journal of Economics, 118, 815–842.

25
Ellison, Glenn and Sara Fisher Ellison. 2005. “Lessons about Markets from the Internet.” The Journal of Economic Perspectives. 19(2): 139‐158.
Haddass, Yael. 2004. “The effect of Internet Recruiting on the Matching of Workers and Employers. “ Mimeo, Harvard University.
Kuhn, Peter, and Skuterud, Mikal. 2004. Internet Job Search and Unemployment Durations. The American Economic Review. 94(1): 218‐232.
Jensen, Robert. (2010). “The (Perceived) Returns to Education and the Demand for Schooling”. Quarterly Journal of Economics, 125(2), 515–548.
McKenzie, David, John Gibson, and Steven Stillman. (2007). “A land of milk and honey with streets paved with gold: Do emigrants have over‐optimistic expectations about incomes abroad?” CReAM Discussion Paper Series, CDP No 09/07.
Nguyen, Trang. (2008). “Information, Role Models and Perceived Returns to Education: Experimental Evidence from Madagascar.” Mimeo, Massachusetts Institute of Technology.
Philippine Overseas Employment Agency. (2009). “2009 Overseas Employment Statistics.” http://www.poea.gov.ph/stats/2009_OFW%20Statistics.pdf. Last accessed April 6, 2011. Pissarides, Christopher A. (1990) Equilibrium Unemployment Theory. Oxford: Basil Blackwell.
Spence, Michael. (1973). “Job Market Signaling.” Quarterly Journal of Economics. 87(3): 355‐374.

26
Figure 1a
Figure 1b

27
Figure 1c
28
Figure 1d

29
Figure 2
Ang normal na sahod ng mga OFWs ay
P28,500 kada buwan.
Ang normal na sahod ng pamilya ng mga
Sorsoganon ay P12,000 kada buwan.
Ang normal na sahod ng OFW ay dalwang beses na mataas kaysa sa normal na sahod ng pamilya ng mga
Sorsoganon!
Did you know? The average monthly income of an OFW is two times higher than the total income of a Sorsoganon family! The average monthly income of an OFW is P28,500 per month.
The average monthly income of a Sorsoganon family is P12,000 per month.

30
Figure 3
F1 100F2 90F3 80F4 70F5 60F6 50F7 40F8 30
2010
0
LIKELIHOOD SCALE
Fifty‐fifty For SureNo Chance
Figure 4a 0
0
0.05
.05
.05.1
.1
.1.15
.15
.15.2
.2
.2.25
.25
.25.3
.3
.3Fraction
Fra
cti
on
Fraction0
0
020
20
2040
40
4060
60
6080
80
80100
100
100Likelihood offered a job overseas
Likelihood offered a job overseas
Likelihood offered a job overseas Distribution of Perceived Likelihood of Job Offers
Distribution of Perceived Likelihood of Job Offers
Distribution of Perceived Likelihood of Job Offers

31
Figure 4b 0
0
0.05
.05
.05.1
.1
.1.15
.15
.15.2
.2
.2.25
.25
.25.3
.3
.3Fraction
Fra
cti
on
Fraction0
0
020
20
2040
40
4060
60
6080
80
80100
100
100Reported Expected Wage
Reported Expected Wage
Reported Expected WageDistribution of Prior Expected Wages
Distribution of Prior Expected Wages
Distribution of Prior Expected Wages
Figure 4c 0
0
0.2
.2
.2.4
.4
.4.6
.6
.6.8
.8
.81
1
1Likelihood offered a job overseas
Lik
elih
ood o
ffere
d a
job o
vers
eas
Likelihood offered a job overseas0
0
010
10
1020
20
2030
30
3040
40
40Likeliest wage overseas
Likeliest wage overseas
Likeliest wage overseaskernel = epanechnikov, degree = 0, bandwidth = 3.27
kernel = epanechnikov, degree = 0, bandwidth = 3.27
kernel = epanechnikov, degree = 0, bandwidth = 3.27Likeliest wage vs.
Likeliest wage vs.
Likeliest wage vs.Likelihood job offer overseas
Likelihood job offer overseas
Likelihood job offer overseas

32
Figure
5
!"
!"#$%
!!"#$"%$&'&() !!"#$"%$*##)
&'()'*+,-./*0,-*1234325
6 #$
7 #$
8 #$
9 #$
: #$
; #$
< #$
= #$
> #$
6? #$
66 #$
67 #$
68 #$
+
%&''()*+,(%-./0(((1(234536(73-(*(%8&'(9.+2346:;(1(5*++53-:(
<34=9(23+:(>34(%?'@
%,"-.!$+*"(-) ./%!$/0,/1%
%&''()*+,(%-./0(((1(234536(73-(*(%A"'(9.+2346:;(1(5*++53-:(
<34=9(23+:(>34(%&!'@
%&''()*+,(%-./0(((1(234536(73-(*(%B''(9.+2346:;(1(5*++53-:(
<34=9(23+:(>34(%!C'@
%&''()*+,(%-./0(((1(234536(73-(*(%BD'(9.+2346:;(1(5*++53-:(
<34=9(23+:(>34(%8'@
%&''()*+,(%-./0(((1(234536(73-(*(%CD'(9.+2346:;(1(5*++53-:(
<34=9(23+:(>34(%?8'@
%&''()*+,(%-./0(((1(234536(73-(*(%D&'(9.+2346:;(1(5*++53-:(
<34=9(23+:(>34(%??'@
%&''()*+,(%-./0(((1(234536(73-(*(%DB'(9.+2346:;(1(5*++53-:(
<34=9(23+:(>34(%&A'@
%&''()*+,(%-./0(((1(234536(73-(*(%?B'(9.+2346:;(1(5*++53-:(
<34=9(23+:(>34(%CA'@
%&''()*+,(%-./0(((1(234536(73-(*(%""'(9.+2346:;(1(5*++53-:(
<34=9(23+:(>34(%C!'@
%&''()*+,(%-./0(((1(234536(73-(*(%C''(9.+2346:;(1(5*++53-:(
<34=9(23+:(>34(%"C'@
%&''()*+,(%-./0(((1(234536(73-(*(%&''(9.+2346:;(1(5*++53-:(
<34=9(23+:(>34(%AC'@((((((((
%&''()*+,(%-./0(((1(234536(73-(*(%&D'(9.+2346:;(1(5*++53-:(
<34=9(23+:(>34(%D8'@
%&''()*+,(%-./0(((1(234536(73-(*(%?&'(9.+2346:;(1(5*++53-:(
<34=9(23+:(>34(%D?'@
#"@A$BC*DE*FG##FB!A*GC%*"C%
E.6*==>F(<0(<34=9(=.G0(:3(3770-(>34(:,0(2,*620(:3(5*-:.2.5*:0(.6(*(-*77=0@(H34(<.==(,*I0(*(2,*620(:3(<.6(
0.:,0-(*(2*+,(3-(*(234536(:,*:(2*6(J0(4+09(:3(-020.I0(*(9.+2346:(36(:,0(5*++53-:@(KL1%(90I0=3509(
:,.+(234536(:3(,0=5(>34(*55=>(73-(*(5*++53-:@(1(5*++53-:(23+:+(%8C'F(*69(>34(<34=9(,*I0(:3(I.+.:(:,0(
ME1(.6(N0O*+5.(:3(*55=>@(E3-(0P*Q5=0F(.7(>34(-020.I0(*(%&''(234536F(>34(<34=9(7.-+:(*++0QJ=0(>34-(
9324Q06:+F(*69(J-.6O(4+(:,0(234536@(L0(<34=9(I0-.7>(>34-(9324Q06:+(*69(O.I0(>34(%&''(.6(
0P2,*6O0(73-(:,0(234536@(H34(<34=9(*99(%AC'(37(>34-(3<6(Q360>(*69(O3(:3(N0O*+5.(:3(*55=>@(R,.+(
234536(2*6(36=>(J0(4+09(J>(>34@(E.-+:F(S(<.==(*+G(>34(+3Q0(T40+:.36+(*J34:(<,0:,0-(>34(<34=9(5-070-(
*(2*+,(5-./0(3-(*(5*++53-:(234536(.7(>34(<.6(:,0(-*77=0@(H34(+,34=9(:-0*:(0*2,(902.+.36(=.G0(.:(.+(*(-0*=(
2,3.20F(*+(:,*:(2,3.20(.+(+0=02:09F(>34(<.==(<.6(<,*:(>34(+0=02:@(((((((((((((((((((
$4*0,-*+(H*I'3*),-1,HJ*0,-*+(..*K3*23L1,HL(K.3*4,2*I'3*),LIL*,4*,KIM(H(HN*MH0*M//(I(,HM.*/,)-O3HILP*
Q,-*+(..*H33/*M*C#BR)32I(4(3/*K(2I'*)32I(4()MI3*MH/*M*C#BR)32I(4(3/*OM22(MN3*),HI2M)I*(4*0,-*M23*M*
OM22(3/*+,OMHP*Q,-*)MH*,KIM(H*I'3L3*/,)-O3HIL*4,2*F88?*3M)'*-L(HN*I'3*(HI32H3IP*Q,-*+(..*M.L,*
H33/*,H3*,2*I+,*4,2OL*,4*1',I,*(/3HI(4()MI(,HP*A'3*),-1,H*)MHH,I*K3*3S)'MHN3/*4,2*)ML'P*
22$%-/3-$/-$-*+ 22$%-/3-$/-$4*--*5
/%6$7(-"0$.*7+*($%&0&.-&#
33
Figure 6 0
0
0.1
.1
.1.2
.2
.2.3
.3
.3.4
.4
.4.5
.5
.5.6
.6
.6Fraction
Fra
cti
on
Fraction200
200
200320
320
320440
440
440560
560
560680
680
680800
800
800920
920
920Lowest Point Selects Coupon
Lowest Point Selects Coupon
Lowest Point Selects CouponDistribution of Demand for Passport Coupon
Distribution of Demand for Passport Coupon
Distribution of Demand for Passport CouponNever
Never
Never

34
Figure 7a: Job‐Fair Attendance by Likelihood of Job Finding .1
.1
.1.2
.2
.2.3
.3
.3.4
.4
.4.5
.5
.5Attend job fairA
ttend job f
air
Attend job fair0
0
0.2
.2
.2.4
.4
.4.6
.6
.6.8
.8
.81
1
1Likelihood of job finding
Likelihood of job finding
Likelihood of job findingControl
Control
ControlWage
Wage
Wage
Figure 7b: Change in Job‐Fair Attendance by Likelihood of Job Finding -.4
-.4
-.4-.2
-.2
-.20
0
0.2
.2
.2.4
.4
.4Attend job fair
Att
end job f
air
Attend job fair0
0
0.2
.2
.2.4
.4
.4.6
.6
.6.8
.8
.81
1
1Likelihood of job finding
Likelihood of job finding
Likelihood of job finding95% CI
95% CI
95% CIDifference
Difference
Difference

35
Figure 8a: Job‐Fair Participation by Likelihood of Job Finding 0
0
0.1
.1
.1.2
.2
.2.3
.3
.3.4
.4
.4Participate in job fair
Part
icip
ate
in job f
air
Participate in job fair0
0
0.2
.2
.2.4
.4
.4.6
.6
.6.8
.8
.81
1
1Likelihood of job finding
Likelihood of job finding
Likelihood of job findingControl
Control
ControlWage
Wage
Wage
Figure 8b: Change in Job‐Fair Participation by Likelihood of Job Finding -.4
-.4
-.4-.2
-.2
-.20
0
0.2
.2
.2.4
.4
.4Participate | Attend = 1
Part
icip
ate
| A
ttend =
1
Participate | Attend = 10
0
0.2
.2
.2.4
.4
.4.6
.6
.6.8
.8
.81
1
1Likelihood of job finding
Likelihood of job finding
Likelihood of job finding95% CI
95% CI
95% CIDifference
Difference
Difference
36
Figure 9a: Passport Coupon Demand by Likelihood of Job Finding .4
.4.4.6
.6.6.8
.8.81
11Demands coupon
Dem
ands c
oupon
Demands coupon0
0
0.2
.2
.2.4
.4
.4.6
.6
.6.8
.8
.81
1
1Likelihood of job finding
Likelihood of job finding
Likelihood of job findingControl
Control
ControlWage
Wage
Wage
Figure 9b: Change in Job‐Fair Passport Coupon Demand by Likelihood of Job Finding

37
-.5
-.5
-.50
0
0.5
.5
.51
1
1Demands coupon
Dem
ands c
oupon
Demands coupon0
0
0.2
.2
.2.4
.4
.4.6
.6
.6.8
.8
.81
1
1Likelihood of job finding
Likelihood of job finding
Likelihood of job finding95% CI
95% CI
95% CIDifference
Difference
Difference

38
Table 1: Summary Statistics
Mean Difference from Control Group F‐Stat
Control
Wage Only
Wage + Voucher
Voucher Only
(1) (2) (3) (4) (5) Female 49.35% ‐0.61% ‐1.84% 2.12% 0.34 Age (mean) 26.83 (0.83) (0.14) 0.02 0.86 Married 52.89% ‐9.33% ‐0.47% ‐9.19% 1.16 With children 54.19% ‐6.55% 2.36% ‐0.19% 0.81
Less than HS 26.44% ‐3.64% 1.94% 3.90% 0.57 HS Only 31.10% 3.41% 6.37% ‐1.98% 0.56 Some College 18.44% ‐0.60% ‐4.09% ‐1.67% 0.19 Vocational 7.26% 1.01% ‐0.47% ‐3.40% 1.12 College graduate 15.08% 0.30% ‐3.31% 1.62% 0.20 Currently Enrolled 6.54% 3.70% 3.99% 2.10% 0.69 Currently employed 37.80% ‐2.99% 4.81% ‐0.15% 0.95 Longest employment spell 3.14 (0.73)* (0.47) 0.12 1.40 Ever worked in Manila 39.66% 7.36% ‐2.33% ‐2.25% 0.40
Mean household income 5.72 (0.06) 0.48 (1.28) 1.30 Interested in working abroad 71.14% ‐0.89% ‐1.84% ‐15.5%*** 2.61* Currently has passport 4.84% ‐2.56% 2.90% ‐1.22% 1.03 Ever applied abroad 26.82% 4.89% 0.00% 1.32% 0.35 Any family abroad since 2005 71.51% ‐3.22% ‐2.48% ‐5.49% 0.26 Friends in social network 3.67 0.14 (0.19) 0.23 0.61
Plan to apply in next 12 months 31.10% 2.99% ‐3.49% ‐7.85% 0.76 Chance offered job abroad if applied 48.47% 1.18% ‐3.09% ‐3.28% 0.82
Distance to job fair (meters) 3,244.91
1,239.63 692.14 801.99 0.61
N 184 174 84 95 537
Means reported using unweighted data, standard errors clustered by purok. Mean household income reported in thousands, trimmed those with reported monthly incomes greater than
P40,000 (US$909) per month.

39
Table 2: Impact of Interventions on Job Fair Attendance and Participation
Likelihood Attend Job Fair Likelihood Participate
(1) (2) (3) (4)
Wage ‐0.00107 ‐0.0111 0.00559 ‐0.00736
[0.0354] [0.0369] [0.0300] [0.0308]
Voucher 0.343*** 0.356*** 0.0773** 0.0974**
[0.0555] [0.0596] [0.0376] [0.0382]
Wage X Voucher ‐0.0794 ‐0.0574 ‐0.0586 ‐0.0458
[0.0815] [0.0812] [0.0545] [0.0562]
Constant 0.111*** 0.0796 0.137*** 0.0811
[0.0374] [0.143] [0.0251] [0.134]
Individual Characteristics
YES
YES Observations 537 537 537 537 R‐squared 0.167 0.224 0.030 0.128 Control dependent variable mean 13.7% 12.3% *** p<0.01, ** p<0.05, * p<0.10
Notes: Robust standard errors clustered at the purok level reported in brackets. Stratification cell fixed effects included, but not reported. Individual characteristics include age, gender, educational attainment, whether married, whether has any family members working overseas since 2005, income and income squared, whether currently or ever
employed, whether ever worked in Manila, whether interested in working abroad, whether ever applied overseas, whether plans to apply in next 12 months, whether currently has a passport, expected wage overseas, and expected likelihood of job finding overseas. A dummy variable for whether won the passport/cash drawing is included in all
specifications.

40
Table 3a: Descriptive Means ‐ Attend Job Fair
Attend Job Fair Control Wage Only
Wage + Vouch.
Voucher Only
(1) (2) (3) (4) Female 45.83% 43.48% 57.58% 57.78% Age (mean) 26.21 25.52 27.18 26.71 Married 41.67% 34.78% 69.70%** 48.89% With children 41.67% 43.48% 66.67%* 60.00%
Less than HS 8.33% 4.35% 24.24% 31.11*% HS Only 25.00% 30.43% 27.27% 31.11% Some College 25.00% 30.43% 24.24% 15.56% Vocational 12.50% 13.04% 12.12% 2.22% College graduate 29.17% 21.74% 12.12% 20.00% Currently Enrolled 8.33% 4.35% 9.09% 4.44% Currently employed 33.33% 30.43% 36.36% 40.00% Longest employment spell 2.92 2.35 2.36 3.38 Ever worked in Manila 41.67% 39.13% 27.27% 37.78%
Mean household income (thousands) 7.40 5.35 7.52 4.33 Interested in working abroad 95.83% 100.00% 69.70% 62.22%*** Currently has passport 4.17% 4.35% 6.06% 4.44% Ever applied abroad 20.83% 43.48*% 24.24% 31.11% Any family abroad since 2005 62.50% 69.57% 69.70% 73.33% Friends in social network 4.50 4.65 3.24* 3.42* Plan to apply in next 12 months 54.17% 56.52% 24.24%** 24.44%* Chance offered job abroad if applied 63.33% 69.35% 52.42%** 45.89%** Distance to job fair (meters) 1,662.31 3967.77* 2,617.22 3,652.78 English ability [1=low to 4 = high] 2.67 2.61 2.58 2.36
Participate in Job Fair 87.50% 86.96% 36.36%*** 40.0%*** Passes Pre‐Screening Interview | Apply 50.00% 34.78% 6.06% 15.56% N 24 23 33 45

41
Table 3b: Descriptive Means ‐ Participate in Job Fair
Participate in Job Fair Control Wage Only Wage + Vouch.
Voucher Only
(1) (2) (3) (4) Female 42.86% 50.00% 33.33% 50.00% Age (mean) 26.14 25.65 26.25 26.11 Married 42.86% 40.00% 58.33% 38.89% With children 42.86% 45.00% 58.33% 44.44%
Less than HS 4.76% 0.00% 16.67% 22.22% HS Only 23.81% 25.00% 33.33% 38.89% Some College 28.57% 35.00% 33.33% 22.22% Vocational 14.29% 15.00% 8.33% 5.56% College graduate 28.57% 25.00% 8.33% 11.11% Currently Enrolled 9.52% 5.00% 16.67% 5.56% Currently employed 33.33% 30.00% 58.33% 44.44% Longest employment spell 2.62 2.50 2.50 4.56 Ever worked in Manila 42.86% 45.00% 33.33% 33.33%
Mean household income (thousands) 6.90 5.71 10.71 4.11 Interested in working abroad 100.00% 100.00% 100.00% 77.78%* Currently has passport 4.76% 5.00% 8.33% 5.56% Ever applied abroad 23.81% 50.00%* 33.33% 44.44% Any family abroad since 2005 61.90% 75.00% 66.67% 77.78% Friends in social network 4.67 3.80 3.67 3.83 Plan to apply in next 12 months 57.14% 65.00% 41.67% 33.33% Chance offered job abroad if applied 66.67% 69.25% 59.17% 51.39%*
Distance to job fair (meters) 1,525.47 3899.06*** 2,744.09
4310.42** English ability [1=low to 4 = high] 2.67 2.65 2.67 2.39
N 21 20 12 18

42
Table 4: Impact of Voucher Only on Selection into Job Search
Attend Participate
(1) (2) X X* VOUCH X X* VOUCH
Voucher
0.614***
0.273
[0.221]
[0.248]
Female
0.00774 0.107 0.0177 ‐0.0399
[0.0318] [0.0919] [0.0288] [0.0798]
Age
‐0.00317 ‐0.0106 ‐0.00360 ‐0.00557
[0.00458] [0.00784] [0.00399] [0.00893]
Married
‐0.0336 0.166* ‐0.0142 0.0380
[0.0408] [0.0943] [0.0406] [0.0777]
Education High School 0.0512 ‐0.0484 0.0395 0.0207
[0.0323] [0.108] [0.0334] [0.0755]
Some College 0.0881* ‐0.0730 0.108** ‐0.0299
[0.0522] [0.161] [0.0506] [0.128]
Vocational 0.131* ‐0.152 0.122* ‐0.0745
[0.0709] [0.172] [0.0707] [0.146]
College 0.115* ‐0.102 0.111* ‐0.171*
[0.0599] [0.115] [0.0607] [0.101]
Interested in working abroad 0.0825*** ‐0.0796 0.0794*** 0.0594
[0.0217] [0.0648] [0.0203] [0.0520]
Likelihood offered job abroad 0.208*** ‐0.00859 0.195*** ‐0.0626
[0.0627] [0.176] [0.0691] [0.128]
Constant
‐0.0298
0.0139 [0.143] [0.125]
Observations
537 537 R‐Squared 0.229 0.124
Notes: Robust standard errors clustered at the purok level reported in brackets. Stratification cell fixed effects and a dummy variable for winning a prize during the passport question are included but not
reported.

43
Table 5: Impact of Information and Prior Expectations on Job Search
Attended Participated Coupon
(1) (2) (3) Specification A
Wage treatment ‐0.0281 ‐0.0199 0.0191
[0.0344] [0.0263] [0.0328]
Specification B Wage treatment ‐0.119* ‐0.0571 ‐0.233***
[0.0667] [0.0561] [0.0691]
Wage X Likelihood find job overseas 0.189 0.0771 0.521***
[0.139] [0.122] [0.128]
Specification C Wage X Likelihood < 25 ‐0.0800 ‐0.0203 ‐0.112*
[0.0541] [0.0448] [0.0651]
Wage X Likelihood >= 25 & < 50 ‐0.162* ‐0.0964 ‐0.0902
[0.0939] [0.0745] [0.103]
Wage X Likelihood = 50 ‐0.00298 ‐0.0233 ‐0.0399
[0.0586] [0.0499] [0.0695]
Wage X Likelihood >50 & <75 ‐0.0885 ‐0.0808 0.111*
[0.0687] [0.0607] [0.0658]
Wage X Likelihood >=75 0.158** 0.114 0.252***
[0.0760] [0.0702] [0.0588]
Specification D Wage treatment ‐0.0161 0.0269 0.0197
[0.0607] [0.0492] [0.0653]
Wage X Expected wage overseas ‐0.000543 ‐0.00180 0.000192
[0.00173] [0.00166] [0.00209]
Specification E Wage X Expected wage quintile 1 ‐0.0940 ‐0.0879** ‐0.122
[0.0621] [0.0354] [0.0745]
Wage X Expected wage quintile 2 0.0210 0.0927 ‐0.129
[0.110] [0.0749] [0.0914]
Wage X Expected wage quintile 3 0.00721 0.0139 0.0847
[0.0804] [0.0678] [0.0653]
Wage X Expected wage quintile 4 ‐0.0208 ‐0.0295 0.123*
[0.0594] [0.0579] [0.0621]
Wage X Expected wage quintile 5 ‐0.0732 ‐0.0843 0.00785 [0.0624] [0.0545] [0.0775] Observations 537 537 537
Notes: Stratification cell fixed effects included, but not reported. Robust standard errors clustered at the purok level reported in parentheses. See Table 3 for full list of covariates.

44
Wage treatment dummy omitted in specifications B, C, E, and F.
Table 6: Impact of Interventions on Early Employment Outcomes
Likelihood Pre‐screened
Likelihood Pre‐screened | Apply
(1) (2) (3) (4)
Wage ‐0.0232 ‐0.0347 ‐0.212 ‐0.424*
[0.0246] [0.0249] [0.182] [0.212]
Voucher 0.00652 0.0149 ‐0.262 ‐0.259
[0.0326] [0.0332] [0.218] [0.261]
Wage X Voucher ‐0.0349 ‐0.0218 0.0484 0.169
[0.0414] [0.0419] [0.286] [0.385]
Constant 0.0600** 0.0655 0.518** 0.481
[0.0243] [0.0765] [0.222] [0.870]
Individual Characteristics
YES
YES Observations 537 537 58 58 R‐squared 0.030 0.117 0.289 0.656 Control dependent variable mean 6.5% 57.9% *** p<0.01, ** p<0.05, * p<0.10
Notes: Robust standard errors clustered at the purok level reported in brackets. Stratification cell fixed effects included, but not reported. See Table 2 notes for list of included individual
characteristics.

45
Table 7: Robustness Checks of Differential Impacts of Wage Information
Attended Participated Chose Coupon
(1) (2) (3) Specification F
Wage X Income quintile 1 omitted
Wage X Income quintile 2 ‐0.0965 ‐0.0817 ‐0.0819
[0.125] [0.106] [0.138]
Wage X Income quintile 3 0.00911 0.0183 0.0512
[0.114] [0.0888] [0.125]
Wage X Income quintile 4 ‐0.0508 ‐0.0388 0.0412
[0.155] [0.109] [0.127]
Wage X Income quintile 5 ‐0.0265 0.0721 ‐0.169
[0.130] [0.102] [0.128]
Wage X Likelihood >25 ‐0.0145 0.0159 ‐0.132
[0.0992] [0.0868] [0.113]
Wage X Likelihood >= 25 & < 50 ‐0.128 ‐0.0797 ‐0.0714
[0.152] [0.0970] [0.143]
Wage X Likelihood = 50 0.0173 ‐0.0256 0.00281
[0.109] [0.0868] [0.124]
Wage X Likelihood >50 & <75 ‐0.0603 ‐0.117 0.133
[0.144] [0.109] [0.123]
Wage X Likelihood >=75 0.0941 0.0657 0.285** [0.136] [0.102] [0.123]
Observations 537 537 537