Embed Size (px)
DESCRIPTION
Assessing Environment's Contribution in Poverty Reduction
Citation preview


Disclaimer
This publication is a joint product of staff from UNDP, UNEP, IIED, IUCN and WRI, prepared on behalf of thePoverty-Environment Partnership. The views expressed herein do not necessarily reflect those of their respectivegoverning bodies, or when applicable, the countries there represented.
Other Poverty-Environment Partnership publications
1. Linking Poverty Reduction and Environmental Management: Policy Challenges and Opportunities (2002)2. Poverty and Climate Change: Reducing the Vulnerability of the Poor through Adaptation (2003)3. Environmental Fiscal Reform for Poverty Reduction (2005)
Available at www.povertyenvironment.net/pep
Assessing Environment’s Contribution to Poverty Reduction
Designed by Kimberly Soffar, First Kiss Creative LLCPrinted by Printech
First printing September 2005All rights reserved
United Nations Development ProgrammeOne United Nations PlazaNew York, NY 10017

Contents
Foreword
About the Poverty-Environment Partnership
Acknowledgements
Executive Summary
Chapter 1The Need to Include Environmental Information in Making Decisions to Reduce Poverty and CreateWealth for the Poor
Chapter 2Country Experiences with Assessing the Contribution of the Environment in Reducing Poverty andAchieving the Millennium Development Goals
Chapter 3Additional Approaches for Measuring Progress toward Millennium Development Goal 7, Target 9
Chapter 4Setting Priorities for Developing and Using Indicators and Assessments
Chapter 5Recommendations for Action
References
Annexes
Acronyms
List of Tables and Figures

2
Foreword
An historic opportunity—the eradication of poverty—is within reach of the 2005 World Summit. However, acritical barrier persists: progress on eliminating poverty will only be possible with expanded, more effectivelytargeted investments in environmental management as a means of achieving the Millennium DevelopmentGoals (MDGs).
Speeding progress towards the MDGs will require stepping up attention to and investment in the environment.Investing in sound and equitable environmental management makes good economic sense, and a majorscaling-up of worldwide investment in the environment is essential for creating the opportunities that peopleneed to lift themselves out of poverty. Increased investment alone is not enough, however. To be effective,investment must be accompanied by the empowerment of communities, local governments and the privatesector to lead local development efforts. Of particular importance is the need for governance and policy reformsthat extend to poor people secure property and user rights over the environmental assets that provide theirlivelihoods, and that ensure a greater voice in decisions affecting how these assets are managed.
To inform deliberations at the Summit, the Poverty-Environment Partnership (PEP)—a network of more than 30international development and environment agencies—launched the ‘Environment for the MDGs’ initiative togalvanize support for the significant scaling up of worldwide investment in environmental management to helpwin the fight against poverty and achieve the MDGs. The PEP commissioned two background reports—one onthe economic case for investing in the environment to reduce poverty and the other on tools andmethodologies for assessing environment’s contribution to poverty reduction and pro-poor growth. ThePartnership has also prepared a brief synthesis paper summarizing the key messages of the two longer, moretechnical reports.
The following report on Assessing Environment’s Contribution to Poverty Reduction looks at how developingcountries, with substantial constraints on funding and institutional and technical capacity, can use innovativeinformation and analytical tools to better capture the role of environment in reducing poverty and supportingpro-poor growth. It reviews recent experience with various kinds of environmental indicators and assessmentsfor tracking the contribution of environmental resources to poverty reduction and provides guidelines aimed athelping countries choose relevant information and assessment tools to shed light on optimal ways to enhancethe productivity of environmental assets as a key strategy for reducing poverty. Finally, the authors presentrecommendations for actions to encourage moves toward broad-based targets, indicators and assessment thatcan help guide and support sound, equitable environmental management for poverty reduction.
The 2005 World Summit provides a critical opportunity to mobilize a much wider ‘coalition’ of interestedgovernments, inter-governmental organizations, research institutes, businesses and civil society organizations totake this agenda forward, as an essential component of global action to end poverty and secure the benefits ofhealthy ecosystems for all the Earth’s inhabitants, now and in generations to come.

3
About the Poverty-Environment Partnership
The Poverty-Environment Partnership (PEP) is a network of bilateral aid agencies, multilateral developmentbanks, UN agencies and international NGOs that aims to address key poverty-environment issues within theframework of international efforts to achieve the Millennium Development Goals. Analytical work andknowledge-sharing activities undertaken by the PEP since 2001 points to three broad, fundamental lessons thatunderpin efforts to link poverty reduction and environmental management:
• The environmental quality of growth matters to people living in poverty;• Environmental management cannot be treated separately from other development concerns;• People living in poverty must be seen as part of the solution rather than part of the problem.
PEP Member Organizations: Bilateral Agencies: Belgium, Canada, Denmark, Finland, France, Germany, Ireland,Japan, Netherlands, Norway, Sweden, Switzerland, United Kingdom, United States. Multilateral/UN Agencies:African Development Bank, Asian Development Bank, European Commission, UN Food and AgricultureOrganization, Inter-American Development Bank, International Fund for Agricultural Development, InternationalMonetary Fund, Organization for Economic Cooperation and Development, UN Department for Economic andSocial Affairs, UN Development Programme, UN Environment Programme, The World Bank, World HealthOrganization. International NGOs: International Institute for Environment and Development, IUCN-The WorldConservation Union, World Resources Institute, WWF International.
More information on the PEP can be found at www.povertyenvironment.net/pep.

4
Acknowledgements
The Steering Committee for the PEP “Environment for the MDGs” initiative includes UNDP (Peter Hazlewood andCharles McNeill), UNEP (Esther Reilink and David Smith), DFID (Helen O’Connor), IIED (Steve Bass and Tom Bigg),IUCN (Joshua Bishop and Andrew Deutz), SEI (Johan Rockström), WRI (Dan Tunstall) and WWF (Dawn Montanyeand David Reed). The supporting paper on tools and methodologies for assessing environment’s contribution topoverty reduction and pro-poor growth was led by WRI.
The Steering Committee is grateful to many PEP members for contributing valuable insights and information.Special thanks for work on “Assessing Environment’s Contributions to Poverty Reduction” go to: Dan Tunstall,Emily Cooper, Christian Layke and Norbert Henninger (WRI); Barry Dalal-Clayton (IIED); Linda Ghanimè (UNDP);and Karen Holmes (Consultant).
Kimberly Soffar, First Kiss Creative LLC, guided publication design and production.

5
Executive Summary
The following report, Assessing Environment’s Contributions to Poverty Reduction, examines how countries can useinformation and assessment methods to measure and report on progress towards Millennium DevelopmentGoal 7, “Ensure Environmental Sustainability.” The intended audience is decision-makers, at all levels of society,who require information to identify problems, develop and implement plans, and assess results.
The need to integrate environmental information in decision-making for poverty reduction andpro-poor wealth creation
The message of the Poverty-Environment Partnership is that natural resources can become the wealth the poorneed to lift themselves out of poverty. However, the path is difficult and, without substantive changes ingovernance and investments, the results will neither satisfy the dreams and aspirations of the poor nor meet thegoals and targets of the world community.
The global framework of targets and indicators for the Millennium Development Goals (MDGs) emphasizesnational-level statistical indicators to examine the extent, condition, and use of natural resources. Much of thesedata are available and useful. But to achieve MDG goals and targets, there is a growing consensus that we needto examine the links between sound, equitable environmental management and poverty reduction. And this willentail expanding the development of indicators to link environmental resources, or what the MillenniumEcosystem Assessment calls “ecosystem services,” with opportunities for improving household and communitylivelihoods.
A fundamental challenge for achieving the MDGs is to get the right information into the hands of the rightpeople at the right time. Decisions about environmental conditions and trends that affect people andecosystems are made by farmers, policy makers, business entrepreneurs, and other groups in society. All thesegroups need information about environment, poverty, and governance.
Country experiences with assessing environment’s contribution to reducing poverty andachieving the MDGs
Only 10 years remain until countries are expected to achieve the MDGs. So, how is the world faring with theseefforts? (See Table 2.) Many countries have not reported on how well they are doing to achieve the eight goalsand 18 targets. Many lack the data or the resources to adequately monitor their progress. Others may choose notto report because it would reveal a lack of progress. Whatever the reasons – and there are many – withouttimely, reliable reporting within and among countries it becomes difficult to assess progress, learn the lessons ofsuccess and failure, and hold leaders accountable.
Reporting on MDG 7 on ensuring environmental sustainability has been particularly weak. And, this poses aserious problem for countries. It is evident that environmental sustainability is a cross-cutting issue that impactsmany economic sectors and plays an important role in meeting all the other MDGs, especially those related tohealth, poverty, gender, education, and governance. If reporting on environmental sustainability is weak or non-existent, it is very likely that countries are not making the investments in environmental resources andenvironmental governance that are needed to reduce poverty, particularly in rural areas where more than threequarters of the world’s poor live.

6
As part of the MDG reporting process countries have been encouraged to modify the global targets and selectindicators relevant to those targets. (See Table 5.) Of the 100 countries that submitted reports about halfreported exclusively on the global targets. Among the 50 that did set one or more targets adjusted to meetspecific national conditions, most made adjustments to Target 10 dealing with access to water and sanitation.Only 18 of 100 set one or more national targets for Target 9 on “reversing the loss of environment resources.”
So, what can be done to help countries get the information they need to address the underlying problems thatlead to poverty, environmental degradation, and weak governance? More specifically, what can be done to helpcountries interpret MDG 7 and address Target 9?
Strengthening current indicators to assess environmental sustainability
This study reviews the five indicators of the global MDG framework that measure progress toward reversing theloss of environmental resources – that is, indicators of forest cover, biodiversity, energy use, emissions of carbondioxide and ozone-depleting substances, and use of solid fuels. In each case improvements are recommended indefining the indicators, focusing greater attention on the development of national-level indicators, andimproving the data.
Suggestions have been made for expanding the list to include additional key indicators addressing fish stocksand sustainable fishery yields, land degradation, persistent organic pollutants, air and water quality, and solidwastes. Rethinking some of the traditional indicators and adding new ones could go a long way towardproviding countries with meaningful measures of progress toward reversing the loss of environmentalresources.
Additional approaches for measuring progress toward MDG 7, Target 9
One of the major problems with measuring country progress towards Target 9 is that it is neither time-boundnor quantitative. Furthermore, the Target combines two distinct objectives: to “integrate the principles ofsustainable development into country policies and programs” and to “reverse the loss of environmentalresources.” These are very different tasks requiring different strategies, policies, and practices at global, national,and sub-national levels. They may also require different sets of indicators. As a result, this report recommendsthe establishment of separate targets or sub-targets for these two important aspects of MDG 7.
The report also identifies a number of additional approaches that can be used to measure progress towards oneor both of the sub-targets.
1. Using an ecosystem-based approach to interpret targets and identify and develop indicators
The sub-target, “reverse the loss of environmental resources,” can be interpreted as the equivalent of“maintaining or restoring the capacity of ecosystems to provide ecosystem services to people.” Thisinterpretation encourages countries to take a comprehensive approach to assessing environmental problemsand linking them to social and economic well-being. Furthermore, the ecosystem-based approach to developingtargets and indicators can be used to examine the important connections between ecosystem services and theother MDGs, such as security, basic material for a good life, health, and social relations. (See Figure 2.)

7
Countries can usefully conduct an audit of ecosystem services to identify the most important and relevantenvironmental resources for achieving one or more targets under the MDGs. If data are missing, a qualitativetarget may be established.
One important feature of an ecosystems-based approach is the attention paid to examining the “regulating”services and “cultural” services provided by ecosystems. Often these services are poorly monitored and thereforeoverlooked and not valued economically until the service is disrupted (coastal fisheries), degraded (soils,wetlands), or destroyed (forest cover, biodiversity). (See Figure 1.) Developing targets and measures for theseservices may be a priority, as has been demonstrated by a regional ecosystem assessment of the Gariep RiverBasin in southern Africa, which provides a model for how ecosystem services can be measured.
2. Indicators for integrating environment into the MDGs
A number of indices have been developed to increase public and policymaker awareness of the value ofenvironmental resources and how they may be incorporated in larger models of well-being. These include theEnvironmental Sustainability Index (Table 6), the Ecological Footprint (Table 7), Adjusted Net Savings (Figure 3and Table 8) and a Measure of Comprehensive Wealth (Table 9). Ecosystem service indicators are also reviewedfor their capacity to integrate social and ecological values. (See Figure 4.)
Analyzing these approaches shows that each clearly has substantial value for providing decision-makers withpolicy-relevant information, including highlighting specific environmental problems, showing the relativestrength of country policies and practices, measuring natural resource wealth compared to produced capital andintangible sources of wealth, documenting the extent to which some countries are using and consuming moreresources than others, and revealing the kinds of tradeoffs made when a community chooses to protect orsustain one kind of ecosystem service over another.
Our analysis also shows that none of these approaches fully meets the criteria for integrating environmentalresources (ecosystem services) within a sustainable development context. This is a new area of research and theresults to date are just beginning to help policy makers become aware of the consequences of their decisions inusing and consuming resources. Further research in this area promises to bring exciting and importantdevelopments.
3. Assessment methods for integration
In 1992, Agenda 21 called for all countries to develop national sustainable development strategies (NSDSs). ThePlan of Implementation agreed to at the World Summit on Sustainable Development in Johannesburg in 2002recommitted governments to take action on NSDSs, calling for “immediate steps to make progress in theformulation and elaboration of national strategies for sustainable development and begin their implementationby 2005.” Although countries have been provided with considerable guidance, few now prepare NSDSs on aregular basis.
8
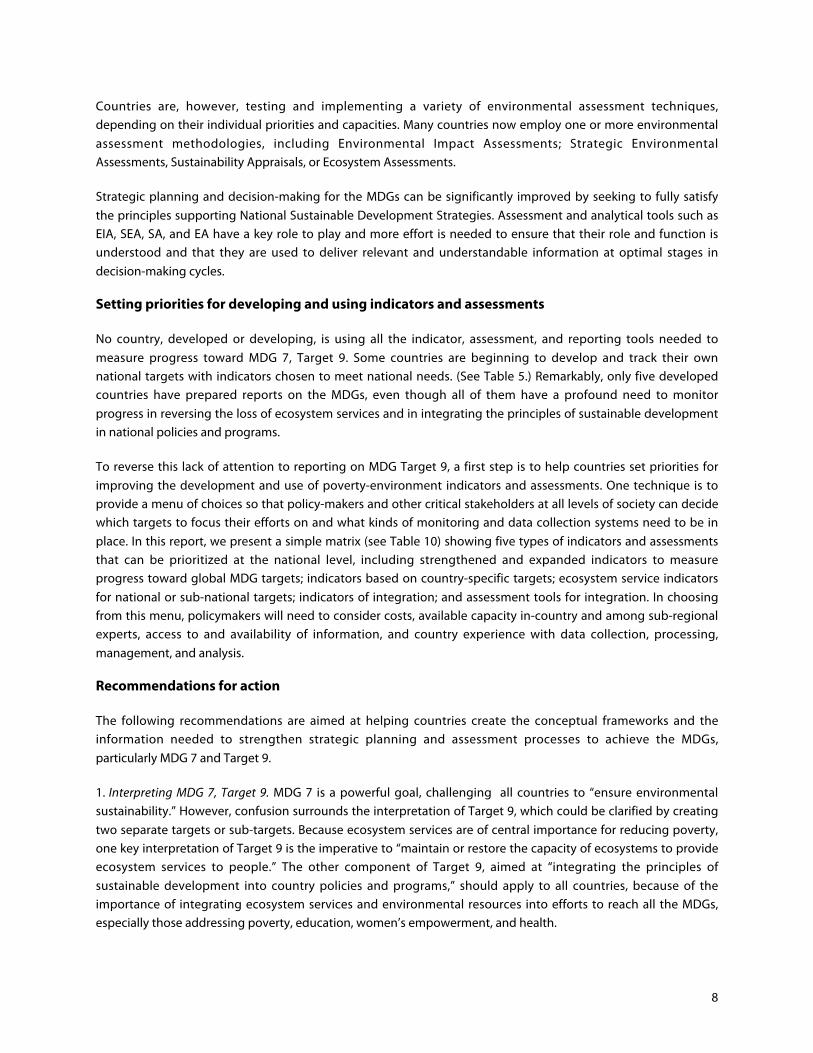
Countries are, however, testing and implementing a variety of environmental assessment techniques,depending on their individual priorities and capacities. Many countries now employ one or more environmentalassessment methodologies, including Environmental Impact Assessments; Strategic EnvironmentalAssessments, Sustainability Appraisals, or Ecosystem Assessments.
Strategic planning and decision-making for the MDGs can be significantly improved by seeking to fully satisfythe principles supporting National Sustainable Development Strategies. Assessment and analytical tools such asEIA, SEA, SA, and EA have a key role to play and more effort is needed to ensure that their role and function isunderstood and that they are used to deliver relevant and understandable information at optimal stages indecision-making cycles.
Setting priorities for developing and using indicators and assessments
No country, developed or developing, is using all the indicator, assessment, and reporting tools needed tomeasure progress toward MDG 7, Target 9. Some countries are beginning to develop and track their ownnational targets with indicators chosen to meet national needs. (See Table 5.) Remarkably, only five developedcountries have prepared reports on the MDGs, even though all of them have a profound need to monitorprogress in reversing the loss of ecosystem services and in integrating the principles of sustainable developmentin national policies and programs.
To reverse this lack of attention to reporting on MDG Target 9, a first step is to help countries set priorities forimproving the development and use of poverty-environment indicators and assessments. One technique is toprovide a menu of choices so that policy-makers and other critical stakeholders at all levels of society can decidewhich targets to focus their efforts on and what kinds of monitoring and data collection systems need to be inplace. In this report, we present a simple matrix (see Table 10) showing five types of indicators and assessmentsthat can be prioritized at the national level, including strengthened and expanded indicators to measureprogress toward global MDG targets; indicators based on country-specific targets; ecosystem service indicatorsfor national or sub-national targets; indicators of integration; and assessment tools for integration. In choosingfrom this menu, policymakers will need to consider costs, available capacity in-country and among sub-regionalexperts, access to and availability of information, and country experience with data collection, processing,management, and analysis.
Recommendations for action
The following recommendations are aimed at helping countries create the conceptual frameworks and theinformation needed to strengthen strategic planning and assessment processes to achieve the MDGs,particularly MDG 7 and Target 9.
1. Interpreting MDG 7, Target 9. MDG 7 is a powerful goal, challenging all countries to “ensure environmentalsustainability.” However, confusion surrounds the interpretation of Target 9, which could be clarified by creatingtwo separate targets or sub-targets. Because ecosystem services are of central importance for reducing poverty,one key interpretation of Target 9 is the imperative to “maintain or restore the capacity of ecosystems to provideecosystem services to people.” The other component of Target 9, aimed at “integrating the principles ofsustainable development into country policies and programs,” should apply to all countries, because of theimportance of integrating ecosystem services and environmental resources into efforts to reach all the MDGs,especially those addressing poverty, education, women’s empowerment, and health.

9
2. Setting country priorities for Target 9. When the Millennium Declaration was agreed, it was understood thateach signatory country would review and refine the targets for making progress. Much greater effort should bemade by the international community to support developing-country processes for setting targets anddeveloping indicators tailored to specific national needs.
3. Strengthening and integrating environmental assessment processes. It is essential to mainstream environmentand ecosystems thinking in all MDG development strategies, particularly those addressing health, water andsanitation, poverty, gender, and governance. Investments in environmental assets and ecosystem restorationgenerate substantial economic and social benefits, and the success rate is growing.
4. Strengthening the information base. If bankers, business leaders, and finance ministers are to recognizeecosystems and environmental assets as worthy of investment, much more attention will need to be paid todeveloping core datasets for decision-making. Every country needs a timely, high-resolution map documentingthe geospatial dimensions of poverty, in terms of absolute numbers of the poor, the percentage of thepopulation living in poverty, and the poverty gap. Each country also needs a high-resolution map of itsecosystem services that can support the poor. To be successful every country needs to compile and maintainrecords on rights to resources. This information is essential if a country is to establish legal and regulatoryregimes to ensure that the rights to land, water, and other natural resources are protected and enforced atcommunity, individual, and household levels.
5. Involving developed countries in setting targets, establishing indicators, and reporting on progress. The developedcountries should continue to expand their monitoring of such key environmental issues as climate change,biodiversity, energy production and use, agricultural production and trade, fishing effort and catch, and theregulating services of ecosystems, which reduce threats from floods and other natural disasters. The developedcountries will be much better placed to assist the developing world when they first examine their owndevelopment trajectories for environmental sustainability, and then share their experiences collaboratively.

10
Chapter 1
The Need to Include Environmental Information in Making Decisions toReduce Poverty and Create Wealth for the Poor
It is hard to believe that, in the 21st century, almost half of the world’s people live on less than $2 a day, and morethan 1 billion live on $1 or less a day. Although there have made many efforts over recent decades, progress tocombat such poverty has been particularly slow, especially in rural areas where the poor depend on naturalresources—soils, water, forests, wildlife—to make a living. Often, these people lack the skills, the infrastructure,and the markets they need to grow and sell enough crops and livestock to generate sufficient income to lift theirfamilies from poverty. They also often lack rights to the natural resources on which they depend. If rights tothese resources were theirs, investments they make in soil improvements and water management wouldbecome long-term assets that would not only help them take that first step out of poverty but also give themthe ability to better provide for their families in the future.
The message of the Poverty and Environment Partnership (Managing Environmental Wealth for PovertyReduction) is that natural resources could become the wealth the poor need to work their way out of poverty.However, the path is difficult and, without substantive changes in governance and investments, the results willneither satisfy the dreams and aspirations of the poor, (Nayaran et al. 2002) nor meet the goals and targets of theworld community.
There is, therefore, great need to strengthen the capacity of developing countries for sound, equitablemanagement of their environmental assets to support pro-poor growth and expand opportunities for the poor.The Millennium Development Goals (MDG) process creates an unprecedented opportunity to focus attention onpoverty reduction and to mobilize private investment and development assistance to help countries developand implement effective poverty-reduction strategies.
Reporting on Progress
However, there is little evidence, five years into the 15-year MDG campaign, that countries are making muchprogress in managing their environmental assets for wealth creation and poverty reduction. Reporting andevaluation are scant. Because natural resources are typically the principal assets of developing countries,effective management of a portfolio of these assets is a must if a developing country is to grow economicallyand meet the MDG targets for reducing poverty and improving the well-being of its people.
Country reporting on progress in reaching environmental sustainability (MDG 7) suggests that countries are notyet adopting the kinds of national and sub-national targets and indicators that would enable them to plan forand assess whether they are achieving sound, equitable natural resources management for poverty reduction.
The Need for New Types of Indicators and Assessments
The larger issue, however, is not that countries are failing to report progress, but that we are failing to capturewhat really matters in assessing a country’s management of its environmental assets that support wealthcreation and pro-poor growth.

11
The MDG framework of goals, targets, and indicators emphasizes measures that look at the extent of naturalresources or their uses and conditions, such as forest cover or area protected to maintain biodiversity. Thesemeasures can be useful, but we need to go beyond them to fashion new types of indicators that help us examinethe links between sound, equitable environmental management and poverty reduction.
Given the substantial constraints on funding and institutional and technical capacity, how can developingcountries create new indicators and conduct assessments that capture the role of environment in reducingpoverty and supporting pro-poor growth?
To begin to answer this question, we reviewed recent experience with four key tools that we believe have thegreatest relevance to developing-country efforts to measure, track, and assess the contribution of environmentalresources to poverty reduction. These four tools are:
Expanding and strengthening the current set of indicators that have been used to evaluate progress inenvironmental protection and health.
Developing geospatial indicators that examine the linkages between ecosystem services and human well-beingat various scales, from local to national.
Constructing indices of progress toward environmental sustainability that integrate information on conditionsand trends across environmental, social, and economic sectors.
Developing measures of institutional environmental performance. Such indicators would focus on the processesof public decision-making related to the environment, such as rules and procedures for preparing environmentalimpact assessments (EIAs) or indicators to gauge civil society’s access to information, participation, and justice inpublic decisions concerning environmental resources.
The Right Information
Getting the right information into the hands of the right people at the right time is a tremendous challenge.
Just getting the right information is costly. It requires investments in social, economic, and environmentalmonitoring, household surveys and censuses, access to administrative and legal information, and the collectionof bio-geophysical measurements, using a variety of instruments, including satellites. The information requiresdata processing, analysis, and reporting. In the case of an assessment, it requires including data from otherdisciplines to better understand what kinds of change are influenced by what policies and what policies couldbe modified to improve a situation. Reporting requires that a special effort be made to communicate to eachgroup the information they want to know, whether they are farmers, fishers, business owners, local officials,national officials, U.N. officials, or the public.
This list of potential information users is multiplied by many factors depending on the scale of the issue and thescale of those who have a stake in the outcome of the decisions made. ---Gathering, processing, managing,analyzing, and reporting on information to the public and policy-makers foremost requires a set of institutions(at local, provincial, and national scale) that have or are developing sets of rules and standards by which themany data collectors and managers can organize their information so the results are compatible.

12
What Farmers Need to Know
The rural poor raise crops and livestock. They also haul water, hunt and gather wild animals and plants, andoften fish. In many villages one or more family members work away from home, sending back remittances tohelp sustain the household and the community. Rural farmers harvest what they can and manage surviving withthe information and resources available, most of it indigenous knowledge built up over generations. Daily, theytrade off-time on one activity with another, based on patterns of experience, knowledge of the localenvironment, household size, the capacities of individual members, and many other factors.
To be more productive and develop the natural wealth around them, farmers need more specific andsophisticated information. They need information on soils, crops, livestock breeds, wildlife populations, habitats,nutrients, pests, weather, labor availability, labor prices, management techniques, transportation, harvests, post-harvest losses, markets, and prices. They usually need this information at the scale of their village or localcommunity.
A poor household also needs to know about its rights to the land, to what grows on it, to surface andgroundwater, to what they plant or what grows naturally, and to what they build on it. For the poor, it is theirrights and the enforcement of those rights within the law that usually determine whether they will plant,husband, harvest, and successfully manage the natural resource base for environmental income andenvironmental wealth or work on the margin of subsistence. (See USAID et al. 2002; WRI et al. 2005)
What Policy-Makers Need to Know
The information that a farmer or a natural resource manager needs to know to be successful is often similar tothe information that a policy-maker needs, although at a different scale. The policy-maker needs to havestatistics and geospatial information on his or her jurisdiction, including land and water capacity, the number ofpeople and households and their livelihoods, major crops grown and livestock grazed, wildlife populations andhabitats, ownership and other rights, and infrastructure and markets.
Increasingly, policy-makers also need to know about what the Millennium Ecosystem Assessment (MA) hasidentified as ecosystem services (see MA 2005). Ecosystems provide three types of services: provisioningservices, regulating services, and cultural services.
Provisioning services are food production and availability of fresh water, wood, fiber, fuel, and wildlife.Regulating services are climate regulation, flood and drought regulation, disease regulation, and waterpurification. Cultural services are aesthetic, spiritual, educational, and recreational.
Not all members of a community will depend directly on all of these ecosystem services, but, over a larger area,most of these services will be valued by the community, and the quality and quantity of services will directlyinfluence their livelihoods.
It is important to understand that improved ecosystem services cannot only help poor communities andhouseholds generate more income but can have a direct bearing on many of the other MillenniumDevelopment Goals such as combating hunger and major diseases, achieving universal primary education,promoting gender equality, empowering women, reducing child mortality, improving maternal health, andaddressing institutional problems.

13
What Follows
In the following sections of the paper, we provide an overview of the findings concerning experiences with thefour types of indicators, indices, and environmental assessments described above. Drawing on these results, wethen present a menu and set of criteria that developing countries can use to select relevant information andassessment tools for examining environmental trends and poverty-environment linkages as well as to identifyoptimal ways to use their environmental wealth as a basis for poverty reduction and pro-poor growth.
We conclude the paper with a set of recommendations, aimed at various groups, including countries(developing and developed), donors, international institutions, civil society, private business, and more, foractions that will encourage countries to move from narrowly defined environmental targets to broad-basedtargets, indicators, and assessments that will contribute to sound environmental management for povertyreduction, informed policy decisions, and institutional accountability.

14
Chapter 2
Country Experiences with Assessing the Contribution of the Environmentin Reducing Poverty and Achieving the Millennium Development Goals
In September 2000, the largest-ever gathering of world leaders adopted the United Nations MillenniumDeclaration, whose cornerstone is a global agenda of eight development goals, known as the MillenniumDevelopment Goals (MDGs), for cutting world poverty in half by 2015. The MDGs have been described as “themost broadly supported, comprehensive, and specific poverty reduction targets the world has ever established”and the “fulcrum” on which international development policy pivots (UN Millennium Project 2005: 2-4).
The eight goals are a means to accelerate the pace of development and to continually measure the results. Theywill, directly or indirectly, influence the investment of billions of dollars in development over the next decadeand beyond, including domestic investment programs of poor countries, the development aid provided bywealthy countries, and private sector-led investment.
The MDGs address extreme poverty in many dimensions, including hunger, disease, and lack of adequateshelter, while also committing nations to take action to promote gender equality, education, and environmentalsustainability (see Table 1). The goals condense and refocus the anti-poverty commitments of the past severaldecades into a brief, action-oriented agenda. Reaching the MDGs and their associated development targetswould mean lifting 500 million of the world’s people out of extreme poverty, liberating 300 million from thesuffering of hunger, and providing 350 million additional people with a reliable, sustainable source of safedrinking water (UN Millennium Project 2005:1).
Reaching the MDGs: Progress in the First Five Years
How is the world faring with efforts to attain the MDGs? The results so far have been mixed. In early 2005, thefindings of several monitoring studies were published as part of a five-year stocktaking of progress on the MDGagenda, marking the earliest deadlines among the MDG targets as well as the start of the final, crucial decade ofaction to reach the Goals by 2015. These reports generally portray a track record that differs by region andacross the various Goals (see Table 2).
Much of the sub-Saharan region—faced with continuing hunger and malnourishment as well as heartbreakinglyhigh levels of child and maternal mortality—is significantly off track for reaching most of the goals. Even in Asia,where progress has been most rapid, hundreds of millions of people still live in extreme poverty. Other globalregions—such as Latin America, North Africa and the Middle East, and the transitional economies of the formerSoviet Union—have mixed records, with progress on some of the goals and with slow or no progress on others(UN Millennium Project 2005:9).

15
Table 1: The Millennium Development Goals
Goal 1:Eradicate extremepoverty and hunger
Target 1: Halve between 1990 and 2015 the proportion of people whose income is less than $1per day.
Target 2: Halve between 1990 and 2015 the proportion of people who suffer from hunger.
Goal 2:Achieve universalprimary education
Target 3: Ensure that by 2015 children everywhere, boys and girls alike, will be able tocomplete a full course of primary schooling.
Goal 3:Promote genderequality and empowerwomen
Target 4: Eliminate gender disparity in primary and secondary education, preferably by 2005,and in all levels of education, no later than 2015.
Goal 4:Reduce child mortality
Target 5: Reduce by two thirds, between 1990 and 2015, the under-five mortality rate
Goal 5:Improve maternalhealth
Target 6: Reduce by three-quarters, between 1990 and 2015, the maternal mortality ratio
Goal 6:Combat HIV/AIDS,malaria, and otherdiseases
Target 7: Have halted by 2015 and begun to reverse the spread of HIV/AIDS
Target 8: By 2015, have halted and begun to reverse the incidence of malaria and other majordiseases
Goal 7:Ensure environmentalsustainability
Target 9: Integrate the principles of sustainable development into country policies andprograms and reverse the loss of environmental resources
Target 10: Halve by 2015 the proportion of people without sustainable access to safe drinkingwater and basic sanitationTarget 11: Have achieved by 2020 a significant improvement in the lives of at least 100 millionslum dwellers
Goal 8:Develop a globalpartnership fordevelopment
Target 12: Develop further an open, rule-based, predictable, nondiscriminatory trading system(includes a commitment to good governance, development, and poverty reduction—bothnationally and internationally)
Target 13: Address the special needs of the Least Developed Countries (includes tariff- andquota-free access for Least Developed Countries’ exports, enhanced program of debt relief forheavily indebted poor countries [HIPCs] and cancellation of official bilateral debt, and moregenerous official development assistance for countries committed to poverty reduction)
Target 14: Address the special needs of landlocked developing countries and small islanddeveloping states (through the Program of Action for the Sustainable Development of SmallIsland Developing States and 22nd General Assembly provisions)
Target 15: Deal comprehensively with the debt problems of developing countries throughnational and international measures in order to make debt sustainable in the long term
Target 16: In cooperation with developing countries, develop and implement strategies fordecent and productive work for youth
Target 17: In cooperation with pharmaceutical companies, provide access to affordable drugsin developing countries
Target 18: In cooperation with the private sector, make available the benefits of newtechnologies, especially information and communications technologies
Source: United Nations 2000. Available online at http://www.un.org/millenniumgoals/.

16
Table 2: Major Trends in the MDGs, by Region

17
Environmental Sustainability and the MDGs
The seventh of the eight MDGs commits nations to “ensure environmental sustainability.”
Its purpose is to spur action on environmental priorities related to sustainable development and povertyreduction. The intent is to integrate environmental sustainability as a cross-cutting issue that impacts virtuallyall economic sectors and plays a role in meeting the other MDGs, especially MDG 1 on reducing hunger andextreme poverty (see Table 3).
Table 3: Key Links between the Environment and the MDGs
MDG Examples of Links to the Environment1. Eradicate extremepoverty and hunger
• Livelihood strategies and food security of the poor often depend directly on functioning ecosystemsfor goods and services.
• The poor often have insecure rights to environmental resources and inadequate access toenvironmental information, markets and decision-making – limiting their capability to protect theenvironment and to improve their livelihoods and well-being.
• Lack of access to energy services limits productive opportunities for the poorest, especially in ruralareas.
2. Achieve universalprimary education
• Time spent collecting water and fuel wood can reduce time available for schooling.• Lack of energy, water and sanitation services in rural areas deters qualified teachers from teaching in
poor villages.
3. Promote genderequality and empowerwomen
• Women and girls are especially burdened by water and fuel collection, which reduces their time andopportunity for education, literacy, and income-generating activities.
• Women often have unequal rights and insecure access to land and other natural resources, limitingtheir opportunities and ability to access other productive assets.
4. Reduce child mortality • Water and sanitation-related diseases (such as diarrhea) and pollution-related respiratory infectionsare two of the leading causes of under-five child mortality.
• Lack of clean water and adequate fuels for boiling water directly contribute to preventable water-borne diseases.
5. Improve maternalhealth
• Indoor air pollution and carrying heavy loads of water and fuel wood adversely affect women’s healthand can make women less fit for childbirth and at greater risk of complications during pregnancy.
• Lack of energy for illumination and refrigeration, as well as inadequate sanitation limit the quality ofhealth services delivered, especially in rural areas.
6. Combat major diseases • Up to one-fifth of the total burden of disease in developing countries may be associated withenvironmental risk factors (e.g., malaria, parasitic infections). Preventive measures to reduceenvironmental health hazards are as important and often more cost effective than treatment.
• New medicines derived from biodiversity hold promise to combat major diseases.
8. Global partnership fordevelopment
• Since the rich countries consume far more resources than poor countries, many global environmentalproblems (such as climate change, loss of species diversity, or the depletion global fisheries) can onlybe solved through partnerships between developed and developing countries.
• The burden of external debt, unfair terms of trade for primary products, and predatory investment innatural resources sectors can greatly increase the pressure to overexploit environmental assets indeveloping countries. These too can only be relieved through partnerships that lead to debt relief,and fair trade and investment rules.
Source: UK DFID et al. 2002.

18
MDG 7 is important because the degradation of ecosystems and the services they provide are significant barriersto achieving all the MDGs. A recent global, scientific assessment of the state of the world’s ecosystemsdetermined that, in all regions, and particularly in sub-Saharan Africa, the condition and management ofecosystems is a “dominant factor” affecting the chances of success in fighting poverty. Many of the regionsfacing the greatest challenges in achieving the MDGs also face significant problems of ecosystem degradation(MA 2005).
Moreover, the prospects for improving agricultural productivity, the foundation of many countries’ poverty-reduction strategies, are thrown into serious doubt by the impacts of overconsumption of particular ecosystemservices—impacts that include land and water degradation, growing susceptibility to crop diseases, buildup ofpest resistance, and erosion of genetic diversity.
Country Reporting on Environmental Sustainability
As part of the global MDG process, countries are required to prepare periodic reports on their national progressin meeting the MDGs. To date, more than 100 countries have submitted at least one MDG Report (MDGR), andas of February 2005, eight countries had submitted a follow-up report.
A recent United Nations Development Program (UNDP) review of 100 MDGRs showed that, overall, countrymonitoring and reporting on progress toward environmental sustainability is weak. Despite some worthyefforts, for the most part countries are not paying sufficient attention to developing and reporting on a broad setof targets and indicators that would accurately gauge their progress toward MDG 7’s goal of ensuringenvironmental sustainability. UNDP’s analysis suggests that, although lack of available data and indicators is asignificant constraint for some countries, many have not fully integrated existing data and indicators from othernational planning processes, such as National Strategies for Sustainable Development, State of the EnvironmentReports, and National Biodiversity Action Plans (UNDP 2005).
Moreover, environmental sustainability does not receive much attention in the MDGRs, outside reporting onMDG 7. The links between environment and efforts to meet the other MDGs often are not recognized, and, evenwhen mentioned, are rarely elaborated on.
Setting and Reporting on Country-Specific Targets
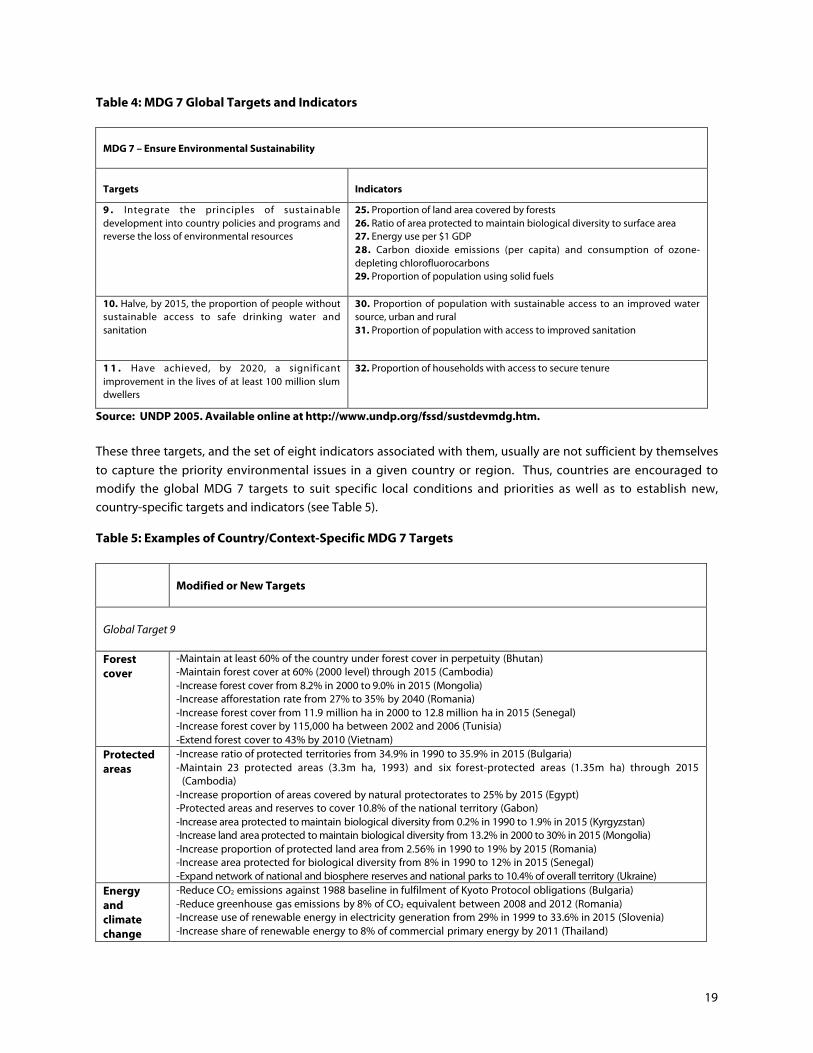
To track global progress toward MDG 7, the MDG framework establishes three global targets and eight globalindicators (see Table 4). Target 9, the first of the three MDG environmental targets, calls for countries to“Integrate the principles of sustainable development into country policies and programs and reverse the loss ofenvironmental resources.” Targets 10 and 11, the second and third MDG environmental targets, commit nationsto “halve by 2015 the proportion of people without sustainable access to safe drinking water and sanitation” andto “have achieved by 2020 a significant improvement in the lives of at least 100 million slum dwellers.”
19
Table 4: MDG 7 Global Targets and Indicators
MDG 7 – Ensure Environmental Sustainability
Targets Indicators
9 . Integrate the principles of sustainabledevelopment into country policies and programs andreverse the loss of environmental resources
25. Proportion of land area covered by forests26. Ratio of area protected to maintain biological diversity to surface area27. Energy use per $1 GDP28. Carbon dioxide emissions (per capita) and consumption of ozone-depleting chlorofluorocarbons29. Proportion of population using solid fuels
10. Halve, by 2015, the proportion of people withoutsustainable access to safe drinking water andsanitation
30. Proportion of population with sustainable access to an improved watersource, urban and rural31. Proportion of population with access to improved sanitation
1 1 . Have achieved, by 2020, a significantimprovement in the lives of at least 100 million slumdwellers
32. Proportion of households with access to secure tenure
Source: UNDP 2005. Available online at http://www.undp.org/fssd/sustdevmdg.htm.
These three targets, and the set of eight indicators associated with them, usually are not sufficient by themselvesto capture the priority environmental issues in a given country or region. Thus, countries are encouraged tomodify the global MDG 7 targets to suit specific local conditions and priorities as well as to establish new,country-specific targets and indicators (see Table 5).
Table 5: Examples of Country/Context-Specific MDG 7 Targets
Modified or New Targets
Global Target 9
Forestcover
-Maintain at least 60% of the country under forest cover in perpetuity (Bhutan)-Maintain forest cover at 60% (2000 level) through 2015 (Cambodia)-Increase forest cover from 8.2% in 2000 to 9.0% in 2015 (Mongolia)-Increase afforestation rate from 27% to 35% by 2040 (Romania)-Increase forest cover from 11.9 million ha in 2000 to 12.8 million ha in 2015 (Senegal)-Increase forest cover by 115,000 ha between 2002 and 2006 (Tunisia)-Extend forest cover to 43% by 2010 (Vietnam)
Protectedareas
-Increase ratio of protected territories from 34.9% in 1990 to 35.9% in 2015 (Bulgaria)-Maintain 23 protected areas (3.3m ha, 1993) and six forest-protected areas (1.35m ha) through 2015
(Cambodia)-Increase proportion of areas covered by natural protectorates to 25% by 2015 (Egypt)-Protected areas and reserves to cover 10.8% of the national territory (Gabon)-Increase area protected to maintain biological diversity from 0.2% in 1990 to 1.9% in 2015 (Kyrgyzstan)-Increase land area protected to maintain biological diversity from 13.2% in 2000 to 30% in 2015 (Mongolia)-Increase proportion of protected land area from 2.56% in 1990 to 19% by 2015 (Romania)-Increase area protected for biological diversity from 8% in 1990 to 12% in 2015 (Senegal)-Expand network of national and biosphere reserves and national parks to 10.4% of overall territory (Ukraine)
Energyandclimatechange
-Reduce CO2 emissions against 1988 baseline in fulfilment of Kyoto Protocol obligations (Bulgaria)-Reduce greenhouse gas emissions by 8% of CO2 equivalent between 2008 and 2012 (Romania)-Increase use of renewable energy in electricity generation from 29% in 1999 to 33.6% in 2015 (Slovenia)-Increase share of renewable energy to 8% of commercial primary energy by 2011 (Thailand)

20
Modified or New Targets
Pollution -Decrease total discharge of major pollutants by 10% between 2000 and 2005 (China)-Stabilize ambient air pollution from stationary and mobile sources by 2015 (Ukraine)-Attain national standards in air and water pollution by 2005 (Vietnam)
Global Target 10
Drinkingwater
-Reduce by two-thirds the proportion of the population without access to potable water by 2015 (Argentina)-Ensure that 78% of the population has access to safe drinking water by 2015 (Benin)-By end of Ninth Five-Year Plan 2007, 100 percent of population will have access to safe drinking water
(Bhutan)-Increase access of rural population to safe water source from 24% in 1998 to 50% in 2015 (Cambodia)-Increase access to safe drinking water to 75% by 2015 (Cameroon)-Supply water to 26m people in water-scarce areas and add 40b m3 water supply in the Tenth Five-Year Plan(China)-Increase the rate of access to potable water from 49% in 1999 to 90% by 2010 (Guinea)-Provide quality water to 95% of the population by 2010 (Guyana)-Reduce population without access to potable water from 15% to 6% (urban) and from 29% to 15% (rural) by
2015 (Kazakhstan)-90% of dwellings to have sustainable access to water by 2015 (Lebanon)-Increase proportion of population using improved water sources from 60% in 2000 to 80% by 2015 (Mongolia)-Provide 100% of population with sustainable sources of fresh water by 2015 (Syrian Arab Republic)-Increase proportion of population with access to clean drinking water by 12% from 2001 to 2015 (Ukraine)-Ensure 60% of rural population (80% of urban) has access to clean and safe water by 2005 (85% of ruralpopulation by 2010); Provide 93% of the population with access to safe water by 2015 (Vietnam)
Sanitation -Reduce by two-thirds the proportion of the population without access to basic sanitation by 2015 (Argentina)-Increase proportion of population covered by organized waste collection and disposal system from 80.2% in
2001 to 95% in 2015; increase proportion of towns (population greater than 2,000) served by wastewatertreatment from 40% in 2001 to 100% in 2015 (Bulgaria)
-Increase proportion of rural population with access to improved sanitation from 8.6% in 1996 to 30% in 2015 andproportion of urban population with access to improved sanitation from 49% in 1998 to 74% in 2015 (Cambodia)
-Provide three-quarters of the population with access to a better sanitation system by 2015 (Gabon)-Increase proportion of population using adequate sanitation facilities from 25% in 2000 to 50% by 2015(Mongolia)-Increase population with access to improved sanitation from 55% in 1990 to 85% in 2015 (Syrian ArabRepublic)-Ensure by 2010 that all wastewater in towns and cities is treated; ensure by 2010 that all solid waste iscollected and disposed of safely in all towns and cities (Vietnam)
Recycling -Full utilization of recycled wastewater at the expected level of 200,000 cubic m per day by 2010 (Bahrain)-Increase the share of municipal waste recycled to 30% by 2006 (Thailand)
Water use -Reduce by 30% to 35% the volume of irrigation water used per hectare of irrigated land by 2015; water savingsensured by 2015 up to 15% to 20% cubic km; ensure by 2010 water supply of 21to 23 cubic km per year to theAral Sea and nearby territories (Uzbekistan)
Global Target 11
Housing -Reduce by half the proportion of population living in irregular settlements and towns with extreme poverty(Argentina)-Increase the percentage of land parcels with secure title from 15% in 2000 to 60% in 2015 (Cambodia)-Reduce by half the number of under-developed areas by 2015; ensure the establishment of housing in cities of5,000 or more inhabitants by 2015 (Gabon)-Increase provision of housing from 22.6 sq m per capita in 2000 to 35 sq m in 2000; increase share of privatehousing to 97% by 2020; increase investment in housing and service sector by 430% from 2000 to 2020(Turkmenistan)-Ensure there are no slums and temporary houses in all towns and cities by 2010 (Vietnam)
Source: UNDP 2005. Available online at http://www.undp.org/fssd/sustdevmdg.htm#globtarg.
Of the 100 countries that have submitted reports on their progress in reaching the MDGs, about half reportedexclusively on the global targets, providing no indication of any effort to tailor these global targets to their

21
national priorities or circumstances. Among the 50 or so countries that did set one or more targets adjusted tomeet specific national conditions, most made modest adjustments to Target 10 on increasing access to waterand sanitation, such as simply modifying the percentage of the population that will be served or varying thedeadline for extending access (see Table 5).
Less than a fifth (18 of 100) set one or more national targets for reversing the loss of environmental resources(Target 9). Countries most frequently set national targets for increasing land area set aside to conservebiodiversity (13 countries) or to increase forest cover (11 countries). Other aspects of environmentalsustainability—such as maintaining the productivity of fisheries, promoting energy efficiency, and increasing theuse of renewable energy sources—received much less attention (UNDP 2005).
Indicators for Measuring Progress toward MDG 7, Target 9
Another troubling aspect of country reporting on progress toward meeting MDG 7 is the relatively small numberof indicators of environmental sustainability reported on by countries. Of 100 countries submitting MDGprogress reports, only four countries (Bangladesh, Brazil, Egypt, and Thailand) reported on all eight globalindicators established under the global framework for measuring progress toward MDG 7. Another 20 countriesreported on seven of the eight MDG 7 indicators.
The fact that few countries reported on all or almost all of the eight MDG 7 indicators is not, in and of itself, acause for concern. Developing countries have limited human and budgetary capacity to devote to internationalreporting on the MDGs, and it is in a country’s best interest to devote scarce resources to tasks that are of highpriority for the country itself.
More worrisome is the fact that across the board, relatively few countries have developed and reported on abroad set of indicators tailored to national circumstances and priorities. A majority of countries (65 of 100) reporton at least one indicator that goes beyond the eight indicators of the global MDG 7 framework. Among theissues highlighted by these 65 countries are: percentage of land that is arable, land area covered by mangroves,generation and management of solid waste, and access to and use of non-fossil fuels and renewable energysources. However, for most countries, the number and scope of context-specific indicators are not sufficient topresent a complete picture of conditions and trends relevant to high-priority issues of national environmentalsustainability.
Reasons for difficulties with reporting on MDG 7 and Target 9
Why are so many countries having problems with developing country-specific targets and indicators to measuretheir progress toward reaching MDG 7 and Target 9? There are many possible explanations, including:
• Lack of awareness of the importance of MDG 7 and Target 9;• Lack of interest in MDG 7 and Target 9;• Lack of involvement of concerned environmental stakeholders in reaching and/or reporting on
progress toward reaching MDG 7 and Target 9;• Lack of data, information, and/or indicators needed to assess progress toward meeting MDG 7 and
Target 9;• Missing or inadequate human and technical capacity to assess progress toward MDG 7 and Target 9;
and• Lack of resources, that is, a choice to direct limited country capacity to other priorities.
In any given country, several of these factors may come into play.

22
Strengthening current Indicators to assess environmental sustainability
The basic MDG framework assumes that global progress on environmental sustainability can be assessed bymeasuring progress on targets set in environment-related conferences that have been held over the past twodecades, such as those on forests, biodiversity and protected areas, energy, climate change, ozone- deletingsubstances, urban development, and water and sanitation. The indicators used to measure progress toward theachievement of goals and targets have been selected on the basis of a series of multilateral agreements to dealwith these issues and on whether or not databases for countries were available.
These tools can be used to measure progress toward “reversing the loss of environmental resources.” However,these indicators are often of limited relevance for developing countries as they do not often capture nationaland local priority issues and therefore cannot address any meaningful set of needs that reflect country-specifictargets.
A useful set of country-level indicators should be selected from country-led groups that would set targets,identify indicators, monitor change, and assess and report on progress over time. Fortunately, the results-oriented framework of the MDGs presents an opportunity for countries to set context-specific targets forenvironmental sustainability as well as to make use of the existing set of global indicators.
Other problems exist with measuring sustainability. First, there is no blueprint for assessing and measuring theintegration of the principles of sustainable development in country policies and programs. Progress onenvironmental sustainability requires responses at the appropriate scale. Second, MDG Target 9 emphasizes theneed to look beyond the environment, as progress toward MDG 7 will depend on policies and programs in otherdevelopment sectors such as agriculture, mining, construction, industry, and transportation.
Environmental resources are most often location-specific and unequally distributed and require context-specifictargets that address different development paths according to community priorities and capacities. Althoughthe MDG framework deals with global issues, countries need to take that framework a step further to makeprogress on issues best resolved with national and sub-national policies and practices. Opening the assessmentprocess to better match a country’s needs offers a better chance for global progress.
Target 9 indicators and proposed improvements
There are important issues involved in laying out a menu of indicators that countries may choose from tomonitor achievement of Target 9 goals at the country level. Below is an examination of commonly usedindicators and suggestions for their improvement.
Indicator 25. Forest Cover
Current indicator: Proportion of land covered by forest.
Issues to be addressed: There is currently no difference made between plantation forests and old growth forest.Additional indicators are needed to reflect forest quality and at least one or more elements of sustainable forestmanagement: biological diversity; forest health and vitality; protective functions; productive functions; socio-economic functions; and a legal, policy and institutional framework.
Lead organization: Food and Agriculture Organization of the United Nations (FAO)
23
Observations from the MDG Report:
Seventy-nine percent of countries reported on forest cover. Eleven countries set quantified and time-boundtargets for maintaining or increasing forest cover: Bhutan, Brazil, Cambodia, Costa Rica, East Timor, Lao PDR,Pakistan, Romania, Senegal, Tunisia, and Vietnam.
Proposal:
Global: New satellite imagery allows the calculation of tree cover on a timely basis for most countries, and forthe world as a whole. Field surveys and administrative information are required for measures of quality andbetter indicators of forest cover.
National: Indicators can be expanded to include area under sustainable forest management and/or proportionof forest that is certified.
Indicator 26. Biodiversity
Current indicator: Percent of national territory in Protected Area status based on World Conservation Union(IUCN) definitions, with UNEP/World Conservation Monitoring Center (WCMC) interpretation.
Issues to be addressed: This indicator should be aligned with the Convention on Biodiversity (CBD) 2010 targetof reversing the loss of biodiversity. Indicator coverage would then include CBD Conference of the Parties 7Goals and Targets such as trends in the extent of selected biomes, ecosystems, and habitat; trends in abundanceand distribution of selected species; coverage of protected areas; nitrogen deposition as a measure of potentialpollution changing the quality of aquatic ecosystems; marine trophic index; and status and trends of linguisticdiversity and numbers of speakers of indigenous languages.
Lead organization: UNEP/WCMC
Observations from the MDG Report:
71 percent of countries reported on the proportion of territory in protected area status. Ten percent setquantified targets for the extent of protected territory: Bulgaria, Cambodia, Egypt, Gabon, Kyrgyzstan, Romania,Senegal, and Ukraine.
Proposal:
Global: Add marine protected areas to the protected area indicator, which also responds to the WorldSummit on Sustainable Development (WSSD) target of establishing a network of marine protectedareas.
National: See the Millennium Ecosystem Assessment for other ecosystem indicators(www.millenniumassessment.org).

24
Indicator 27. Energy use
Current indicator: Energy use per unit of Purchasing Power Parity (PPP), which is a measure of efficiency.
Issues to be addressed:• Energy’s linkages with multiple development goals (the MDGs) are currently not captured: Energy is
related to all aspects of MDGs. It can be emphasized in its relation to poverty reduction, toconsumption, and to environmental sustainability. Yet, the current three energy-related indicators(among the 48 indicators) are solely grouped under MDG 7.
• Current energy-related MDG indicators provide a limited basis for devising a policy response at thenational level unless disaggregated.
• The lack of data at the national level presents a major challenge: In about half of the national MDGreports, energy-related indicators are left blank due to the lack of data or inaccessibility of the data.
• Incomplete data or data with some known margin of errors (as long as they are clearly stated so) canprovide a starting point for policy debates, a better situation compared with no reporting. For example,in the case of the use of solid fuels, reporting on traditional biomass use should be a good startingpoint.
The explanations provided in the MDG metadata recognize the limitations of the data for this indicator.However, two issues are still worth noting: First, the indicator does not tell us anything useful about thesources of energy–coal, wind, oil, etc. Thus, it does not indicate potential environmental impacts. Second,the heterogeneity in energy intensity among the sectors is so large that unless disaggregated by sector, themacro number can be misleading.
Lead organizations: World Bank and International Energy Agency (IEA)
Observations from the MDG Report:
Forty-three percent of countries reported on energy use. Only percent set time-bound targets: Thailand, Egypt,and Slovenia.
Proposal:
Global: Add energy use per manufacturing or other productive sector per unit of PPP. Focus on energy intensityin the productive sector or, where that is too difficult to define, use the manufacturing sector. Two reasons forthis selection: First, the productive sector (or manufacturing sector) consumes a large portion of commercialenergy consumption, so focusing on this sector makes sense when devising policy responses. Second,international comparisons can be a much more useful exercise by focusing on a single sector that is commonlydefined.
National: Disaggregate energy intensity by sector, complemented by data on energy sources. Additionalenergy-related indicators can be introduced such as:
An indicator related to MDG 1: percent of households with access to electricity and percent of those under thenational poverty line. This recognizes energy’s critical links to growth. Electricity data should be relativelyaccessible.
An indicator related to MDG 3: time spent by women on energy-intensive labor and transport activities. This is acritical indicator that connects energy, natural resources, and transport issues to gender empowerment andwell-being.

25
Indicator 28. Carbon dioxide emissions and ozone-depleting substances
Current indicator: Carbon dioxide emissions per capita and consumption of ozone-depletingchlorofluorocarbons.
Issues: Carbon dioxide emissions are not included for all major sources, including cement production and netchanges in biomass, nor do they represent all major greenhouse gases.
Lead organizations: United Nations Framework Convention on Climate Change (UNFCCC) (CO2), UNEP-Ozone,Ozone Depleting Substances (ODSs).
Observations from the MDG Report:
Fifty-four percent of countries reported the indicator on carbon dioxide emissions.
Proposal:
Global: Change from carbon dioxide emissions to greenhouse gas (GHG) emissions, adding methane and otherGHG, assuming data availability from national sources, UNFCCC, and CDIAC. This is an area where more globalindicators are relevant, including carbon dioxide concentrations, change in temperature, sea- level rise, changein other heat and water sensitive bio-geophysical phenomena (glaciers, ice flows, plant and animal distributions,disease vectors, etc.)
National: Use International Panel on Climate Change (IPCC) method and include all GHG from national statistics.
Proposal:
Global: Add other ozone-depleting substances to current indicator. Note: this indicator does not reflect impactsof climate change on other MDGs.
National: Depends on the country and the extent of CFC use and production.
Indicator 29. Use of solid fuels
Current indicator: Proportion of population using solid fuels. There appears to be a lack of standardized data fortraditional fuels.
Lead organizations: World Health Organization (WHO)
Observations from the MDG Report:
Only 24 percent of countries reported measures of solid fuel. Cambodia set targets to reduce fuel-wooddependency by 40 percent (from 92 percent in 1993 to 52 percent in 2015).
Lead organizations: WHO

26
Proposal:
Global: Maintain indicator but distinguish between fuel types or focus on traditional fuels only.
National: To improve data, include questions on use of fuels in national household surveys.
Proposed Additional Indicators
The following additional indicators are relevant for measuring targets emerging from global as well as fromcountry experiences.
1. To maintain and restore fish stocks to sustainable yields.
Indicators: Fisheries production measured in terms of sustainable yields. Aquaculture production.
2. To reverse land degradation.
Indicators: Change in productivity of cultivated lands. Proportion of cultivated land lost to degradation:desertification or salinization. Extent of arable land degraded from soil erosion.
3. To phase out by 2020 the production and use of harmful chemicals.
Indicators: See indicators for Persistent Organic Pollutants (POPs).
4. To improve air and water quality.
Indicators: For air quality: number of days with pollutant concentrations above WHO standards for major cities.For water quality: major rivers and river reaches with pollutant concentrations above WHO standards.
5. To reduce solid wastes.
Indicators: Trends in municipal and industrial solid waste production, collection, and sanitary disposal.
Rethinking some of the traditional indicators and adding new ones would go a long way toward providingdeveloping countries with meaningful measures of progress toward reversing the loss of environmentalresources.

27
Chapter 3
Additional Approaches for Measuring Progress toward MillenniumDevelopment Goal 7, Target 9
From a review of country reporting on MDG 7 Target 9, it is clear that countries are having trouble developingindicators and reporting on Target 9 progress. What can be done to help them?
There are definitely recognizable problems with developing indicators to measure progress in achieving MDG 7,Target 9.
First, the target, as stated, is neither clearly time-bound nor quantitative as most other targets are (except thoseunder MDG 8). The open-endedness of the goal makes it difficult to develop measures and to hold national andinternational institutions accountable for a specific time, such as 2015. Because Target 9 is worded in a broadand qualitative way, it is essential that it be interpreted as quantifiable and time-bound. Many experts believethat Target 9 can be made quantifiable and time-bound but not necessarily in the time frame of the other MDGs.
Time-bound or not, Target 9 has an extremely important role to play. In an ecosystem context, with ecosystemservices maintained and even improved, it becomes the most important integrating force within the entirebundle of MDGs. Instead of being the step-child of the targets, if interpreted in an ecosystem context it canbecome the standard by which countries and the international community can gauge the overall success inreaching the Millennium Development Goals.
Target 9 addresses the “integration of the principles of sustainable development into country policies andprograms” and separately calls for the reversal in “the loss of environmental resources.” These are very differenttasks requiring different strategies, policies, and practices at global, national, and sub-national levels. For thefuture success of the MDGs, it makes sense to interpret the main target as two sub-targets. Both are importantand critical if countries are to achieve success in reaching all the targets for the complete bundle of MDGs.
Target 9 addresses the need for global and national indicators, but national indicators are most important inmaking decisions on goals, targets, and actions within a country. National indicators are also useful for policy-makers and civil society to gauge performance for the goals and targets that have been agreed upon. But, toundertake substantial planning and investment strategies in a country, there need to be quantifiable and usefulindicators at the sub-national level. These can then be aggregated or summarized to provide national numbers.And, in most cases, national numbers can be summarized to create regional and world totals. (The exceptions, ofcourse, are those indicators that reflect truly global conditions such as green-house gas concentrations in the airand endangered and threatened species.)
Target 9 is relevant to all countries, meaning all countries have important natural resources and all countries canmonitor the quantity, quality, usefulness, and value of those resources. For this purpose, natural resources canbe defined as a set of ecosystems that provide people with services such as food, fuel, water, fish, fiber, waterregulation, climate regulation, aesthetic value, recreation, and more. Citizens of every country depend on theseecosystem services, but no two countries have exactly the same set nor are they dependent on the sameservices in exactly the same way. And, of course, no two countries invest and manage their ecosystem services inthe same manner and with the same results.

28
Because most countries do not adequately monitor and measure their regulating services (water, climate, biotic)and cultural services (recreation, education, aesthetic), they lack the indicators needed to measure progresstoward these targets, and in reality often neglect to identify these ecosystem targets as essential in the firstplace. If indicators are to be relevant to the measurement of the achievement of Target 9, new kinds ofinformation (along with existing data) will need to be gathered, analyzed, and reported periodically. Just aseconomists and statisticians spent years developing the National Income Accounts, which are used to calculateGross National Product and many other economic indicators, it now will be necessary to move in the direction ofproducing National Ecosystem Accounts to create the timely, useful, and useable indicators of ecosystemservices and the capacity of ecosystems to continue to produce these services over time.
Using an Ecosystem-Based Approach to Interpret Targets and Identify andDevelop Indicators
Target 9 is often narrowly defined and provides a limited set of indicators. As shown in Chapter 2, focusing solelyon the “loss of environmental resources” is conceptually narrow and limiting. It does not reflect the importanceof ecosystems to the poor or promote ecosystems as the foundation of human well-being and economicdevelopment.
Although the MDG framework of goals and targets is well established, like any conceptual construct it can becontinually improved through discussion, evaluation, and interpretation. It is not necessary to omit any of thegoals and targets, but how they are interpreted makes a difference in how strategies are developed and actionstaken.
In this study, the phrase “reverse the loss of environmental resources” is interpreted to mean “maintain orrestore the capacity of ecosystems to provide ecosystem services to people.” This interpretation encouragescountries to be more comprehensive in their approach to assessing environmental problems and linking themto social and economic well-being. Because many of the other MDG targets depend on sustaining ecosystemservices (poverty alleviation, women’s and children’s health, hunger alleviation, children’s education, diseasemanagement and reduction, global partnerships), it is essential that every country and community work tomaintain the capacity of ecosystem services. (See Table 3 in Chapter 2 for a more complete discussion of thelinks between the environment and all the Millennium Development Goals.)
This target also directly bears upon other goals. If the need to “maintain or restore the capacity of ecosystems toprovide ecosystem services to people” is combined with a focus on poverty alleviation (Goal 1, Target 1) andgood governance (Goal 8, Target 12), a much more powerful and focused “sub-target” is created that could read:“By 2015, more than half of rural inhabitants (including the poor) have their rights to ecosystem services codifiedthrough legal means and that more than half of rural inhabitants have access to information and are involved inmaking decisions about activities that affect the extent and condition of their ecosystems.”
The proposed indicators for Target 9 are not equally relevant to all countries. The environmental issues coveredby the five indicators for Target 9 were selected with a global perspective in mind and include forest loss, energyefficiency, carbon dioxide emissions and chlorofluorocarbon consumption, solid fuel use, and establishment ofprotected areas. Although important, these indicators are not sufficient to capture the national and sub-nationaldifferences in ecosystem services that are of value to the people.

29
Most importantly, the indicators will have to better capture to what degree the capacity of ecosystems canprovide a full bundle of ecosystem services over time. Data collection, analysis, and assessment of ecosystemsand ecosystem services will need to be carried out to measure and understand changes in ecosystem capacity.
An interpretation of Target 9 that equates using ecosystem services to help alleviate poverty and improvehuman well-being is a different problem from using ecosystems in a sustainable manner or putting an economyand society on a sustainable development path. Countries and communities can make progress on the first issuerelatively quickly (assuming motivation, sufficient resources, and knowledge). Achieving sustainability is a muchmore difficult (some would say ambiguous) goal that would require more time than the 2015 time horizon of theMDGs.
This section outlines how countries can develop indicators that support an ecosystem approach toenvironmental management. To do so, three questions need to be addressed:
1. How is the concept of ecosystem management operationalized?
2. What are the right indicators to measure the loss of ecosystem services and the capacity to generateecosystem services in countries, and how can countries go about developing these indicators?
3. What does it take to move from qualitative to quantitative time-bound targets to restore or maintainthe capacity of ecosystems?
Developing an ecosystem assessment framework
One way to assess ecosystems and to investigate changes in ecosystem services has been proposed in theconceptual framework of the Millennium Ecosystem Assessment (MA, 2005:vii).
The Millennium Ecosystem Assessment team developed a framework that highlights “Indirect drivers of change,”“Direct drivers of change,” “Ecosystem services,” and “Human well-being and poverty reduction.” The “arrows” inFigure 1 suggest the direction of influence and the “carrots” suggest strategies and interventions that bringabout change. The key to using the framework to guide thinking and action is to develop strategies, policies,and practices that lead to increases in ecosystem services, which in turn support improvements in human well-being without becoming drivers that degrade and destroy ecosystems. Note that these interventions can takeplace at local, national, regional, and global scales and can influence ecosystem services in the short and longterm.
For example, an increase in international demand for shrimp can lead to regional loss of mangroves, which areremoved to provide a special habitat shrimp ponds. The loss of mangroves leads to a decline in fish spawningareas and a decline in fish available for indigenous fishers, thus reducing available protein for local communities.
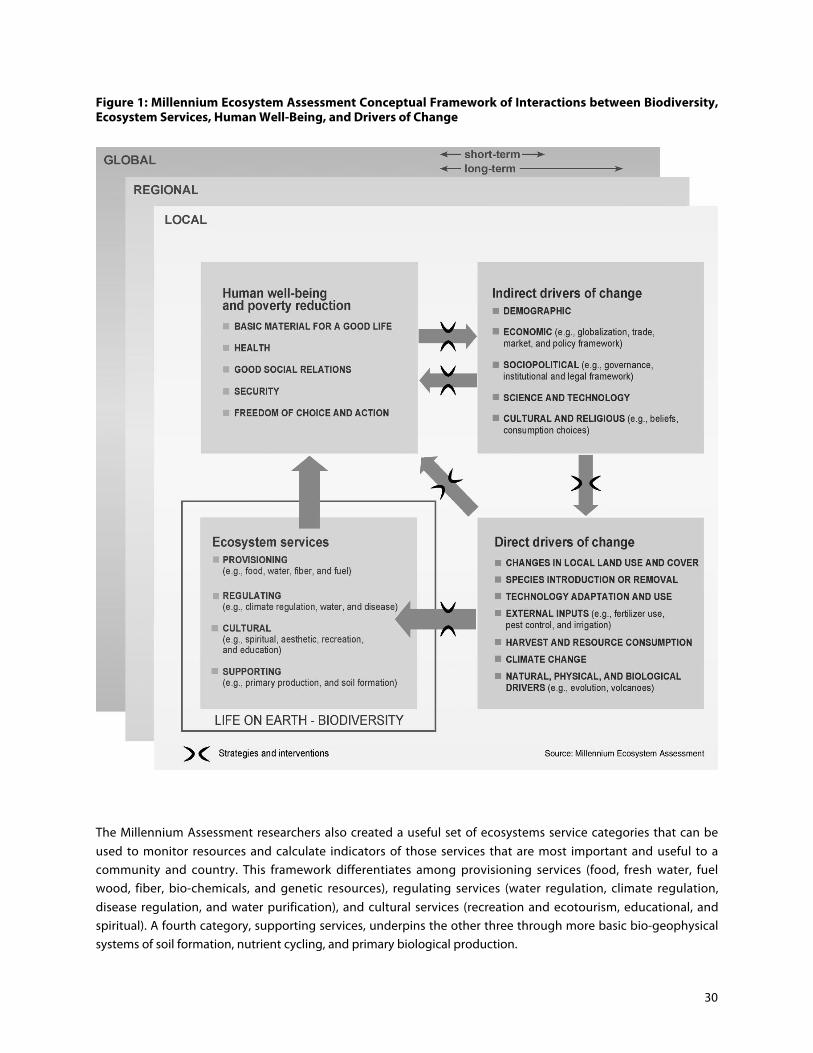
30
Figure 1: Millennium Ecosystem Assessment Conceptual Framework of Interactions between Biodiversity,Ecosystem Services, Human Well-Being, and Drivers of Change
The Millennium Assessment researchers also created a useful set of ecosystems service categories that can beused to monitor resources and calculate indicators of those services that are most important and useful to acommunity and country. This framework differentiates among provisioning services (food, fresh water, fuelwood, fiber, bio-chemicals, and genetic resources), regulating services (water regulation, climate regulation,disease regulation, and water purification), and cultural services (recreation and ecotourism, educational, andspiritual). A fourth category, supporting services, underpins the other three through more basic bio-geophysicalsystems of soil formation, nutrient cycling, and primary biological production.

31
Note that an ecosystem may in fact, and usually does, produce more than one service. Many of the provisioningservices are marketed, so their value to the community is known, at least in monetary terms. But the regulatingand cultural services are often not marketed or lack a market price that reflects the full ecosystem service value.As a result, their values are often not recognized until the service is degraded or destroyed and the communityhas to build man-made substitutes, if that is possible, at considerable cost. A forested watershed, for example,provides habitat for wildlife, retains water during heavy rains, and provides timber and non-timber products forharvesting by the community. Frequently, the regulating service is degraded (and some provisioning serviceslost) if timber harvests are done poorly or if extensive areas are cut all at the same time.
Figure 2: Linkages between Ecosystems Services and Human Well-Being
It is important to acknowledge that translating the ideas of an ecosystem approach into planning and policy-making will be a challenge—even in countries and communities with an abundance of resources and expertise.The goal of maintaining or restoring the capacity of ecosystems to provide ecosystem services applies to allnations. Leadership from higher-income countries to report on MDG 7, ideally with country-specific targets andindicators, and to share expertise will be important contributions to the global partnership to achieve the MDGs.
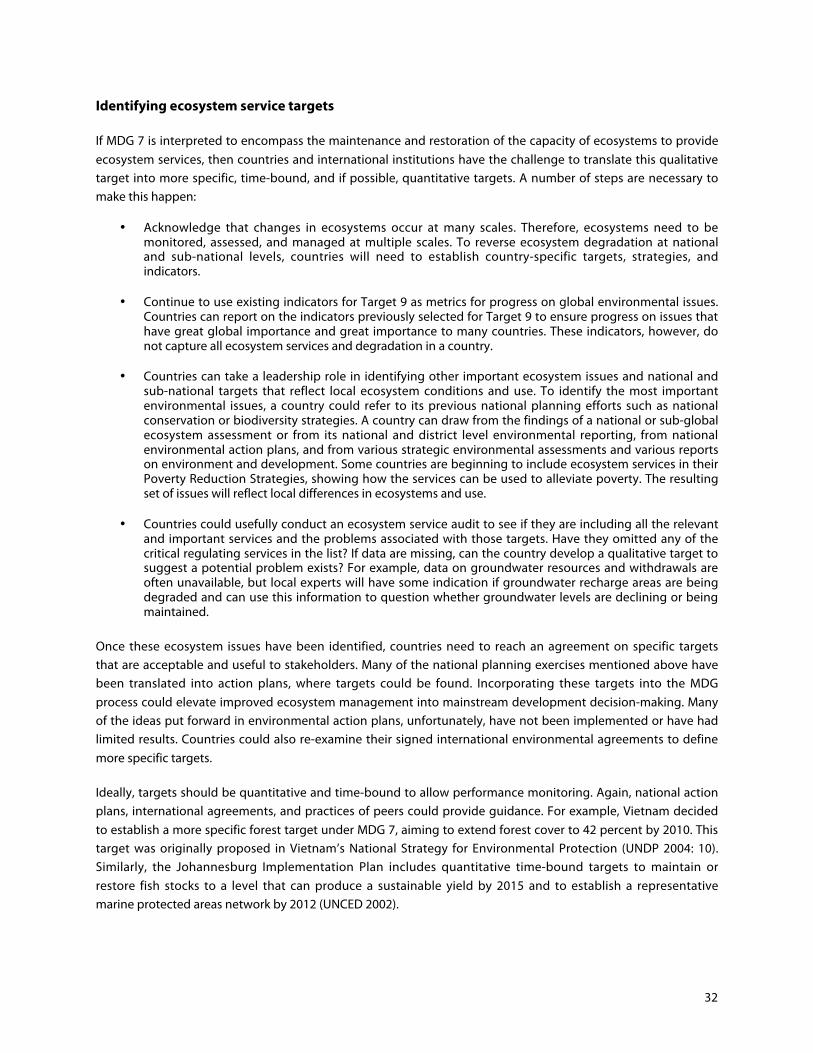
32
Identifying ecosystem service targets
If MDG 7 is interpreted to encompass the maintenance and restoration of the capacity of ecosystems to provideecosystem services, then countries and international institutions have the challenge to translate this qualitativetarget into more specific, time-bound, and if possible, quantitative targets. A number of steps are necessary tomake this happen:
• Acknowledge that changes in ecosystems occur at many scales. Therefore, ecosystems need to bemonitored, assessed, and managed at multiple scales. To reverse ecosystem degradation at nationaland sub-national levels, countries will need to establish country-specific targets, strategies, andindicators.
• Continue to use existing indicators for Target 9 as metrics for progress on global environmental issues.Countries can report on the indicators previously selected for Target 9 to ensure progress on issues thathave great global importance and great importance to many countries. These indicators, however, donot capture all ecosystem services and degradation in a country.
• Countries can take a leadership role in identifying other important ecosystem issues and national andsub-national targets that reflect local ecosystem conditions and use. To identify the most importantenvironmental issues, a country could refer to its previous national planning efforts such as nationalconservation or biodiversity strategies. A country can draw from the findings of a national or sub-globalecosystem assessment or from its national and district level environmental reporting, from nationalenvironmental action plans, and from various strategic environmental assessments and various reportson environment and development. Some countries are beginning to include ecosystem services in theirPoverty Reduction Strategies, showing how the services can be used to alleviate poverty. The resultingset of issues will reflect local differences in ecosystems and use.
• Countries could usefully conduct an ecosystem service audit to see if they are including all the relevantand important services and the problems associated with those targets. Have they omitted any of thecritical regulating services in the list? If data are missing, can the country develop a qualitative target tosuggest a potential problem exists? For example, data on groundwater resources and withdrawals areoften unavailable, but local experts will have some indication if groundwater recharge areas are beingdegraded and can use this information to question whether groundwater levels are declining or beingmaintained.
Once these ecosystem issues have been identified, countries need to reach an agreement on specific targetsthat are acceptable and useful to stakeholders. Many of the national planning exercises mentioned above havebeen translated into action plans, where targets could be found. Incorporating these targets into the MDGprocess could elevate improved ecosystem management into mainstream development decision-making. Manyof the ideas put forward in environmental action plans, unfortunately, have not been implemented or have hadlimited results. Countries could also re-examine their signed international environmental agreements to definemore specific targets.
Ideally, targets should be quantitative and time-bound to allow performance monitoring. Again, national actionplans, international agreements, and practices of peers could provide guidance. For example, Vietnam decidedto establish a more specific forest target under MDG 7, aiming to extend forest cover to 42 percent by 2010. Thistarget was originally proposed in Vietnam’s National Strategy for Environmental Protection (UNDP 2004: 10).Similarly, the Johannesburg Implementation Plan includes quantitative time-bound targets to maintain orrestore fish stocks to a level that can produce a sustainable yield by 2015 and to establish a representativemarine protected areas network by 2012 (UNCED 2002).

33
Countries can include new country targets in MDG progress reports, monitor changes, and communicate theresults.
Developing ecosystem service indicators
Indicators of ecosystem services have the same purpose as other MDG indicators: They are quantitativemeasures that bear upon a societal goal with an established target. The purpose of Target 9, however, isdifferent. Rather than just focusing on metrics that gauge the loss of natural resources, we are now seekingmeasures that show changes in the supply and use of ecosystem services and the capacity of ecosystems tosupply these services.
Societies are continually making conscious and unconscious tradeoffs among different ecosystems (for example,changing land use from natural forests to plantation forests) and among different services (for example,increasing timber production at the expense of biodiversity and water resource flows). Different uses andmodifications of ecosystems also vary in their impacts, ranging from local to national and regional scales. Thiscreates special challenges for indicator development.
Pressure indicators (i.e., measures of ecosystem use) alone do not reveal the actual state of the system. Withproper management, ecosystems can withstand significant pressures without losing their productivity. Similarly,changes in ecosystem extent—such as loss of forests and expansion of agriculture—do not reveal how well theremaining forest or the newly established agro-ecosystem is functioning, only that the land use has changed.
In addition, available data on ecosystems is biased toward the economically most important goods, or moreaccurately, the most valuable goods as traded in the market place and, therefore, priced. This approach oftenleaves out ecosystem services for which no functioning markets have been established. Information thatmeasures the value of these services is rarely available for the non-marketed commodities, such as waterfiltration or storm protection, which are sometimes the most valuable services of ecosystems. Most important,none of these traditional indicators provides information on the underlying condition or health of theecosystem—its capacity to maintain the production or supply of ecosystem services important for humandevelopment.
Scientists carrying out the Millennium Ecosystem Assessment – at local, river-basin, and global scales – relied onthe following approach to describe ecosystem change and develop appropriate indicators:
They first assessed the supply and use of various ecosystem services such as food, water, fiber, water regulation,recreation, etc. Indicators for these services follow traditional sector assessments. For example, production anduse data for the agriculture, forestry, water, or tourism sector assessments.
They assessed how humans are affecting the capacity of the system to provide each of these various services.Typical indicators in this category cover resource availability (in relationship to demand), resource productivity,or resource degradation. In many sector assessments, the information for these types of indicators is incompletein coverage, of poor or unknown quality, or missing entirely. For example, there are no global estimates for theextent of wetlands and only preliminary estimates for most countries, yet it is well documented that wetlands, soimportant for managing local fisheries, crops, wildlife, and water resources, are being drained for cropland andurban uses.

34
In a final step, they examined the bundle of services and evaluated the tradeoffs among them. Here, thescientists had to rely on a limited set of tools such as maps, summary matrices, and models. Describing theunderlying condition or health of ecosystems, that is, their capacity to maintain the production or supply of allecosystem services important for human development, turned out to be the most difficult task within theMillennium Ecosystem Assessment.
Building on the experiences of the MA, scientists suggested a step-by-step approach for indicator developmentin countries.
1. Compile a set of data and indicators reflecting natural resource use, i.e., different ecosystem services.These indicators will focus largely on provisioning services such as food production per capita, extentand change of certain ecosystem types or habitats.
2. Examine the set of indicators and work with experts (within and outside the country) to use existingdata (which may need to be reanalyzed or recombined) to develop indicators for important regulatingand cultural services.
3. Report information on these services and their value to human well-being on a regular basis. Suchreporting is essential for documenting progress under the MDG framework.
4. Finally, examine whether the more comprehensive set of indicators of ecosystem services (which willalready be useful for planning and decision-making) reveal important information about the capacity ofecosystems to provide these services into the future. A country may seek to develop better metricsreflecting this capacity for nationally important resource issues such as fisheries or water.
Ecosystem service indicators and their use at national and sub-national levels
The assessment of Ecosystem Services in the Gariep Basin, one of the sub-global assessments conducted withinsouthern Africa under the auspices of the Millennium Ecosystem Assessment (See SAfMA 2004) relied on thefollowing indicators organized by category:
Provisioning ServicesIndicators of available surface and groundwater water supply, water use, and water quality:
• Natural mean annual runoff (million cubic meters per year) by subcatchment;• Water availability per capita by subcatchment (cubic meters per person per year);• Exploitable groundwater potential (million cubic meters per year);• Groundwater use: total use and sectoral use (cubic meters per year);• Demand versus supply of groundwater (water balance showing areas with a deficit or surplus of water);• Average levels of heavy metal concentrations in selected rivers;• Water quality indicators for groundwater; and• Indicators of water access and use.
Indicators of food supply, production, and consumption:• Mean annual cereal production per capita per district;• Potential mean annual meat production; and• Daily calorie supply from cereal and meat production as a ratio of recommended dietary allowances.
Indicators of biodiversity (biodiversity is seen as an important underlying service linked to all ecosystemservices):
• Number of species or each taxon per quarter degree grid square;• Number of endemic species or each taxon per quarter degree grid square;
35
• Number of threatened species or each taxon per quarter degree grid square;• Location of threatened vegetation types;• Conservation status of “land-types”• Percent of “land-types” protected (gap analysis); and• Number of alien invasive species.
Regulating ServicesRegulating services include:
• Water regulation (timing and quantity of water delivery in freshwater systems);• Climate regulation;• Disease regulation;• Water purification: reduction of fecal coli and ammonia due to wetland filtering. (This indicator was not
available for the whole basin.)• Areas where groundwater abstraction is affecting surface water. (Groundwater withdrawals affect the
baseflow of streams.) This is an example of where one use of an ecosystem affects the delivery of otherecosystem services, in this case quantity of freshwater in river systems and biodiversity in streams.
• Sub-catchments, where ecological reserve requirements are met since, by law, a certain amount ofwater needs to stay in the ecosystem to preserve wetlands, aquatic species, etc.
Cultural ServicesCultural ecosystem services include ecosystem use for:
• Recreation;• Ecotourism;• Educational purposes; and• Spiritual values of nature.
The assessment of Ecosystem Services in the Gariep Basin included a short text section on the cultural significanceof certain landscapes. It pointed out that scale may affect what is culturally and spiritually important. Certainlandscapes may be culturally and spiritually more important for some local communities while other aspects ofecosystems may be of greater relevance to people more distant (for example, national and international touristsinterested in wildlife). The Gariep assessment did not provide any indicators but mentioned specific resourceareas (sacred pools, mountains, or dense forests) that are central to the culture and identity of Xhosa people.These are places where culture in the form of traditions and connections with ancestors is maintained.
The regional component of the Southern African Millennium Ecosystem Assessment, Ecosystem Services inSouthern Africa: A Regional Assessment, included a chapter on nature-based tourism, which relied on thefollowing data and indicators:
• Number and revenues from nature-based tourism;• Repeat rate of foreign tourists visiting South Africa (indicator showing the high percentage return to
visit this country);• Costs for two people in one vehicle to enter and stay for three nights in formally conserved protected
areas (citizens, non-national residents, and non-residents); and• Ownership of tourism facilities.

36
Indicators reflecting the capacity of ecosystems to provide ecosystem services
The Gariep assessment developed a number of indicators, listed below, that gauged the capacity of ecosystemsto provide a selected service. The last indicator example is from the regional component of the Southern AfricanMillennium Ecosystem Assessment. The indicators are:
• Areas where groundwater abstraction is affecting surface water: the capacity to maintain baseflow ofstreams in dry season and capacity to maintain habitat for certain freshwater species;
• Sub-catchments where ecological reserve requirements are met: the capacity to provide a certainquantity of water (for human and other ecosystem use) and the capacity to support freshwater species;
• Irreplaceability values (of biodiversity) by quarter degree grid square: the capacity to maintainecosystems rich and diverse in species;
• Trophic status of dams: those with eutrophication problems: the capacity to provide clean water andsupport freshwater species;
• Combined index of soil and vegetation degradation by municipality: the capacity of ecosystem toproduce food and maintain agrobioversity; and
• Maximum number of tourists that can be accommodated at any one time relative to the size of severalwildlife parks: the capacity to provide a high-quality nature-based tourism experience.
These indicators were mapped for the entire basin and for micro-catchments. The indicators, in the case ofprovisioning services, were compared to targets set: Are the supplies adequate (food, water, energy services,mineral services)? Was there effective distribution for the same four? What were the implications for humanhealth? What was the capacity of ecosystems to continue to produce these services?
In a separate analysis, the Gariep Basin experts proposed a framework for setting ecological resource qualityobjectives. Objectives ranged from the “highest” level of protection of resources and were least amenable tomany forms of utilization to those that provided the “lowest” level of protection but allowed utilization that ismore intensive.
How the tradeoffs were made among these objectives is described in the next section.

37
Integrating Environment into All MDGs
Millennium Development Goal 7 calls for countries (and the world) to “ensure environmental sustainability.” Theprevious section made the case for using an ecosystem approach to interpret Target 7 and, with it, to developindicators to assess progress toward “maintaining or restoring the capacity of ecosystems to provide criticalecosystem services for people.” But ecosystem services also play an important role in achieving targetsassociated with the other MDGs. This chapter explores a number of statistical and geospatial techniques forlinking and integrating ecosystem services with other goals and targets. The chapter also reviews a fewassessment methodologies that can be used by countries and other jurisdictions to ensure that ecosystemservices are incorporated in national strategic plans and actions aimed at addressing other MDGs.
Indicators for integrating environment into MDGs
For the past 35 years, statisticians and social and natural scientists have been struggling with the developmentof a single number or index that would capture the complexity of environmental conditions. Attempts havebeen made to combine indicators of air and water pollution with those of land use, loss of biodiversity, loss anddegradation of forests, pesticide poisoning, water resources, and other important environmental variables.However, none of these attempts at creating country level indices has caught on, meaning that policy-makershave not routinely used these measures in making environmental decisions. They have been used, however, toraise awareness and make comparisons that in turn are used in policy discussions. Nor have these approachescaught on in the scientific community because of the recognized lack of models that link these variousimportant environmental components to one another.
What has been successful is the development of indices for selective environmental media. The PollutionStandards Index for air quality in the United States has proven useful in warning the public about hazardouslevels of ambient air pollutants. In cities, when the levels of pollution reach the prescribed hazardous zone,policy-makers have acted to reduce emissions by cutting back on industrial production and local transportationand encouraging citizens to remain indoors until the spike in ambient conditions declined. Other indices haveproven useful in measuring soil erosion potential, aquatic biodiversity, grazing potential on grasslands, quality ofwater for drinking, radiation exposure, and others.
In recent years, there has been a renewed effort to develop indices at the international level. Once sustainabledevelopment became the working concept for the Rio and Johannesburg summits, a new round of studies havebeen undertaken to develop indices of sustainability, with specific work done to develop environmental indicessuch as the Ecological Footprint, prepared by the Global Footprint Network; the Environmental SustainabilityIndex (ESI), prepared by Yale University; CIESIN, the European Commission and the World Economic Forum; andthe World Bank’s Adjusted Net Savings and Comprehensive Wealth Measure. Another important internationaleffort is the UNDP Human Development Index, which does not include the environment and is therefore notreviewed in this report. Four of these indices are explored in more detail in this section. Also included is adiscussion of how the ecosystem services approach can be used to make tradeoff decisions on the use of oneecosystem service over another, using a case study from the Millennium Assessment.

38
Environmental Sustainability IndexESI 2005 is intended to “benchmark the ability of nations to protect the environment over the next severaldecades.” “The most important function of the ESI is as a policy tool for identifying issues that deserve greaterattention with national environmental protection programs and across societies more generally.” (Esty et al.2005). Based on 76 variables, organized into 21 indicators that can be collapsed into five “meta” components,the ESI provides a provocative ranking of 146 countries. The ESI does not include measures of poverty oreconomic conditions nor does it define environmental sustainability. So it does not provide a strong model forlinking environmental conditions to social and economic development. Countries are ranked against oneanother but not against a standard or set of criteria that would lead to environmental sustainability. So, in theterminology of this paper, there is no defined target.
To be included, a country must have data of documented quality for at least 60 percent of the 76 indicators. Thismeans that many of the poorest and least developed countries are omitted. They basically lack the capacity orthe resources to develop the core statistics used in compiling the index.
The ESI has been effectively used by some countries to alert policy-makers to where their country is fallingbehind (or moving ahead) other countries with policies and practices that can make a difference inenvironmental sustainability. In previous years, countries that were ranked low often criticized the way theIndex was constructed but then would try to increase their scores by improving selected policies. The ESIfollows the OECD Pressure-State-Impact-Response Framework, an analytic construct often used inenvironmental reporting. (A pressure such as a polluting industry emits pollutants that change the state of airquality, which in turn leads to lung disorders, or impacts, and the response can be to establish policies thatreduce the emissions through changes in technology or energy sources.)
This approach may lead to some of the rankings to appear contradictory. Russia, for example, ranks relativelyhigh in the list – 33 out of 146. However, it ranks low in some policy-related variables such as eco-efficiency andprivate sector responsiveness to environmental problems, but high in indicators such as the availability of freshwater and the vast extent of uncut forest resources. It also ranks high on science and technology because manyheavily polluting industries have closed.
Table 6: 2005 Environmental Sustainability Index – Scores and Rankings10 Highest Countries 10 Lowest Countries
ESIRank Country Name ESI
ScoreESI
Rank Country ESIScore
1 Finland 75.1 137 Yemen 37.32 Norway 73.4 138 Kuwait 36.63 Uruguay 71.8 139 Trinidad & Tobago 36.34 Sweden 71.7 140 Sudan 35.95 Iceland 70.8 141 Haiti 34.86 Canada 64.4 142 Uzbekistan 34.47 Switzerland 63.7 143 Iraq 33.68 Guyana 62.9 144 Turkmenistan 33.19 Argentina 62.7 145 Taiwan 32.7
10 Austria 62.7 146 North Korea 29.2Source: Esty et al. 2005. Available on line www.yale.edu/esi.
39
The Ecological FootprintThe Ecological Footprint (EF) emerged in the early 1990s in the work of Canadians Mathis Wackernagel andWilliam Reese. The idea of the EF is to quantify the compound effect of humanity's consumption of naturalresources and generation of waste and to illustrate who uses how much of which ecological resource, withpopulations defined either geographically or socially.
The ecological footprint model estimates demand for natural resources and expresses the total as a unit of land(i.e., “the average Australian requires over 7.7 hectares to provide for his or her annual consumption”). Whenconsidering the supply of land available, only biologically productive land is included. The available surface areaof productive land is calculated from FAO statistics, with six different classes — forest land, crop land, grazingland, fishing grounds, CO2 absorption, and built-up areas—weighted for biological productivity (CO2 absorptionland is a fictitious type used to represent the area that would be needed to sequester the CO2 emitted as a resultof a country’s fuel consumption). When calculating the global EF, a “global hectare”—a hectare whose biologicalproductivity equals the global average—is used.
Ecological footprinting can be done on a large scale (national and global), at the regional or local level, or evenapplied to a particular product. At larger scales, the EF is calculated from published and internationallystandardized data. At the sub-national level, interviews and independent data collection are often used and thenumbers are then converted into global units.
To calculate natural resource demand, an EF study must decide which environmental pressures to include. Themost commonly included at the national scale are food, timber, carbon storage, buildings and roads, andbiodiversity. Other impacts, such as pollution and waste disposal may also be included. EF does not includesocial issues such as education and health or economic issues such as inflation, GDP, and unemployment (STOA2001).
The demand for land at a national level is calculated according to the six land types listed above. Trade data areimportant because the EF seeks to identify the impact of nations’ consumption rather than just production.Hence, imports and exports must be accounted for in the total. For example:
Demand for cropland = (mass of crops produced) + (imports) – (exports)
Total quantity of crops is then converted into an “area” by dividing the total by world average yields for thatcrop. The process is repeated for each of 18 major crops. Other commodities are converted into land equivalentsby estimating energy and direct land inputs required to manufacture the goods. National data on fossil fuelusage are converted into carbon dioxide emissions to estimate energy demands.
The difference between the EF (demand for land in area units) and the supply of land (the actual bio-productivearea controlled by the population measured) is termed the “ecological deficit.”

40
Table 7: Ecological Footprint, 2001
Highest 10 Countries
Country Population(Millions)
TotalEcologicalFootprint
(globalha/person)
EcologicalDeficit *)
(globalha/person)
Per CapitaEcologicalFootprint
Change1991-2001
**)(% changesince 1991)
Afghanistan 22.1 0.3 -0.8 -35%
Somalia 9.1 0.4 -0.7 3%
Haiti 8.1 0.5 0.3 -4%
Bangladesh 140.9 0.6 0.3 0%
Lesotho 1.8 0.6 -0.4 -1%
Nepal 24.1 0.6 0.2 -4%
Tajikistan 6.1 0.6 0.1 -90%
Burundi 6.4 0.7 0.1 -22%
Congo, Dem.Rep. 49.8 0.7 -0.9 -19%
Eritrea 3.8 0.7 -0.1 -12%
Lowest 10 Countries
Country Population(Millions)
TotalEcologicalFootprint
(globalha/person)
EcologicalDeficit *)
(globalha/person)
Per CapitaEcologicalFootprint
Change1991-2001
**)(% changesince 1991)
Norway 4.5 6.2 -0.8 11%
Canada 31.0 6.4 -8.0 -2%
Denmark 5.3 6.4 2.9 7%
Estonia 1.4 6.9 1.2 25%
Finland 5.2 7.0 -5.4 16%
Sweden 8.9 7.0 -2.7 6%
Australia 19.4 7.7 -11.5 16%
Kuwait 2.4 9.5 9.2 181%United States ofAmerica 288.0 9.5 4.7 7%U n i t e d A r a bEmirates 2.9 9.9 8.9 36%
Notes0.0= less than 0.05* If number for ecological deficit is negative, country has an ecological reserve.
Source: World Wildlife Fund (WWF) et al. 2004.

41
At smaller scales, a ground-up “component approach” can be used to calculate a population’s EF. The amount ofactivity undertaken by a population is calculated from a list of about 25 activities such as waste, air travel, foodconsumption, etc., and then converted into energy and direct land use. Finally, this is converted into global areaunits to allow comparison with the global constant.
The World Wildlife Fund’s Living Planet Report uses the Ecological Footprint as one of two main indices toquantify changes in the state of the Earth’s ecosystems. The report is released approximately every two yearsand was published most recently in 2004. The global EF is computed for all countries that are represented in UNstatistical data, back to 1961.
Results show that by 2001, humanity required 2.2 global hectares of productive area per person (13.5 billionglobal hectares total) to sustain current lifestyles. But the Earth currently has just 1.8 global hectares availableper person, creating a 21 percent difference. The recently published Europe 2005 report found that Europe,constituting only 7 percent of the world population, consumes 17 percent of the biosphere’s generativecapacity. Because of the design of the indicator, CO2 sequestration emerges as the by far the most importantecological demand, making up almost 50 percent of the EF on a worldwide basis.
Adjusted Net SavingsAdjusted Net Savings was developed by World Bank environmental economists as an indicator to determine ifcountries are on a sustainable development path. The indicator is being recommended by its authors, inconjunction with their new measure, Comprehensive Wealth, as an indicator of progress toward MDG 7 Target 9,as described in “Ensuring Environmental Sustainability: Measuring Progress Toward the 7th MillenniumDevelopment Goal.” Adjusted net savings is based on the concept that “a development path is sustainable iftotal welfare does not decline along the path.” Adjusted net savings, as the name implies, adjusts the traditionalmeasure of savings to include social and environmental factors and can therefore be used to assess whether thetotal welfare of a country is growing or declining.
Conceptually, the calculation of Adjusted Net Savings is straightforward. Analysts at the Bank adjust grossnational savings by taking natural resource depletion, pollution, and social investments into account. Morespecifically, four adjustments to traditional national accounting measures are made:
• deductions for natural resource depletion;• deduction of capital consumption of produced assets;• additions for spending on education; and• deductions for damages caused by pollution.
These steps are depicted graphically in Figure 8. The result can be shown in nominal terms as a dollar amount oras percent of Gross National Income (GNI). Either way, a positive result indicates positive savings, increasingtotal welfare, and sustainable economic development, while a negative result indicates the opposite.

42
Figure 3: Calculation of Genuine Savings for Bolivia, 2003
-5
0
5
10
15
Gross saving Net saving Net saving pluseduc. exp.
Genuine savingexc. pollution
damages
Genuine saving
Depletion of natural
resources
% GNI
Depreciation of fixed capital
Education exp.
Pollution damages
Adjusted Net Savings can be estimated on an annual basis for countries with available data. Estimates of AdjustedNet Savings are published annually by the World Bank in the “Little Green Data Book, 2005” and available online athttp://lnweb18.worldbank.org/ESSD/envext.nsf/44ByDocName/EnvironmentalIndicatorsCurrentInitiativesTheLittleGreenDataBook2005. Results for selected countries are shown in Table 8.
Table 8: Adjusted Net Savings Rates in Selected Countries, 2005
CountryAdjusted Net Savings Rate in
2003. Percent of GNI
Uzbekistan -46%
Azerbaijan -41%
Nigeria -31%
Kuwait -31%
Trinidad and Tobago -23%
Kazakhstan -22%
Saudi Arabia -19%
Lebanon -18%
Malawi -12%
Sierra Leone -8%
Bolivia -4%
Mozambique 8%
Cambodia 14%
Honduras 21%
Hong Kong, China 24%
Namibia 26%
Nepal 30%
Haiti 30%
Singapore 32%
China 34%Source: The World Bank 2005a.

43
Adjusted net savings calculations suggest that many countries, particularly those with significant oil, other non-renewable resources, and timber resources are not on a sustainable path. Their natural resources are beingdepleted, economic growth is low or negative, and investments in education are low. For example, Bolivia asdepicted in Figure 8 and Table 10, has gross savings of about 12% of GNI. After accounting for depreciation andeducation expenditures, Bolivia still has positive savings of about 7%. However, the depletion of naturalresources, mostly oil and timber, is greater than the savings plus education expenditures. The impacts ofpollution bring adjusted net savings further into negative territory. Overall, Bolivia is calculated as havingnegative 3% savings rate. Other countries, often those with fewer natural resources, have established policiesthat by combining education investment and either sustainable or moderate rates of natural resources use, haveachieved more sustainable development policies.
Changes in the Index, and therefore in a country’s direction towards sustainability, can be brought aboutthrough policy change in economic sectors, social sectors, and environmental sectors.
The Adjusted Net Savings approach is not intended to be poverty focused. Nor are critical governance measuressuch as resource rights and participation in decision-making incorporated. Important natural resources as wateruse, fish catch, soil loss, and air pollutants other than CO2 are also omitted as are most socially valuableinvestments such as preventive health care. These omissions may well skew the results, moving some countriesinto the non-sustainable path and others into the sustainable path.
Measure of Comprehensive WealthComprehensive Wealth or Total Wealth, as defined by the World Bank, is a measure of sustainable developmentbased on macroeconomic theory that states that a country’s total wealth depends on the value of its naturalresources, the value of its infrastructure and built environment, and the value of its intangible wealth—made upof the knowledge of its citizens and critical institutions and laws of a society. The comprehensive wealthapproach quantifies natural wealth, produced capital, and intangible wealth. Given a certain set of assumptions,the World Bank suggests these measures can be used by countries to track sustainable development over time.Specifically, the Bank staff suggests that the value of natural wealth per capita be adopted as an indicator forMDG 7, with a target of stable or increasing value of natural wealth per capita by 2015. In addition to trackingtotal wealth, at approximately five-year intervals, this indicator also reflects whether or not a country’s policieseffectively direct income from natural wealth to increases in social well-being as measured through intangiblewealth.
The methodology and initial results are described in detail in a new report by the World Bank, “Where Is theWealth of Nations? Measuring Capital for the XXI Century” The implications of this measure and adjusted netsavings for MDG 7 are described more completely in “Ensuring Environmental Sustainability: Measuring ProgressToward the 7th Millennium Development Goal.”
Economic development requires that a country maintains or grows its wealth on a total and a per capita basis.Sustainable development, as defined in this Bank study, requires that countries maintain or grow their naturalwealth as well. However, sustainable development also requires maintaining or increasing intangible wealth.There can be periods during which a country uses its natural resource capital as a way to invest in eitherproduced wealth (roads, factories, houses, etc.) or intangible wealth (education, legislative and judicial systems,etc.). Countries that follow this approach would temporarily experience a decline in natural wealth but shouldnot see declines in total wealth. Countries experiencing declines in both total and natural wealth, therefore, arenot developing and are on an unsustainable trajectory. This means they are mining their natural resource basesand not wisely investing the revenues elsewhere in society. At first read, it seems counterintuitive that natural

44
wealth should grow instead of decline over time, as it is often accepted that many richer countries developed bydrawing down their natural capital. The comprehensive wealth analysis shows, though, that the estimate ofnatural wealth in developed countries does not decline over time, only its relative importance in relation to theoverall economy. If more develop countries had depleted their natural capital over time, one would expect toobserve that they retained only small amounts of natural capital compared to developing countries, but this isnot the case. Belgium and Bolivia have similar amounts of natural capital per person: $3,030 and $4,783,respectively. What is dramatically different, however, is how this relates to the two countries’ overall wealth.Belgium’s natural capital is only 1/100th of its intangible wealth while Bolivia’s natural capital is more than one-third of its intangible wealth. Sustainable economic development requires increasing the value of its intangiblewealth and its produced wealth without reducing its natural capital.
Table 9: Country Level Wealth Estimates, 2000
Country Name PopulationNatural CapitalUS$ per capita
ProducedCapital +
Urban LandUS$ per capita
Intangiblecapital US$per capita
TotalWealth US$per capita
B e l g i u m -Luxembourg 10,690,000 3,030 60,561 388,123 451,714Belize 240,000 6,950 9,710 36,275 52,935Bolivia 8,428,000 4,783 2,110 11,248 18,141Botswana 1,675,000 3,182 8,926 28,483 40,592Brazil 170,100,000 6,752 9,643 70,528 86,922Canada 30,770,000 34,771 54,226 235,982 324,979China 1,262,644,992 2,223 2,956 4,208 9,387Ecuador 12,420,000 13,117 2,841 17,788 33,745Haiti 7,959,000 793 601 6,840 8,235Hungary 10,024,000 4,947 15,480 56,645 77,072India 1,015,923,008 1,928 1,154 3,738 6,820Indonesia 206,264,992 3,472 2,382 8,015 13,869Mali 10,840,000 2,157 621 2,463 5,241Netherlands 15,919,000 6,739 62,428 352,222 421,389Nigeria 126,910,000 4,040 667 -1,959 2,748Norway 4,491,000 54,828 119,650 299,230 473,708Rwanda 7,709,000 2,066 549 3,055 5,670Singapore 4,018,000 0 79,011 173,595 252,607South Africa 44,000,000 3,400 7,270 48,959 59,629Switzerland 7,180,000 5,943 99,904 542,394 648,241United States 282,224,000 14,752 79,851 418,009 512,612
Source: World Bank 2005b.

45
Although the comprehensive wealth approach provides a useful indicator to track MDG 7 Target 9, there aresignificant issues that must be noted and kept in mind when interpreting the indicator. First, this indicatorneeds to be used in conjunction with other indicators that measure the quality and health of natural resourcesand not just the economic income generated by them. Resources are commonly managed to provide ongoingincome but without any consideration for the larger biological integrity of the system. While Belgium may stillderive nearly as much in rents from its natural resources as Bolivia, Bolivia has far more biodiversity and muchmore extensive area that has not been reshaped by human activity than Belgium. Sustainable developmentfrom an environmental perspective requires maintaining this greater biodiversity.
A second shortcoming is that natural resources are only assigned an economic value if they are generating rentsfor the country (or are located in an officially protected area). A forest that is not being harvested but hasn’tbeen officially protected (such as much of the Amazon Basin), it is not included as natural wealth in thecomprehensive wealth measure. This approach seems to imply that all natural resources must be converted intoeconomic goods to have value—an implication that doesn’t match the intention of sustainable development.
Another major shortcoming in the Comprehensive Wealth Measure, one noted by the authors, is their inabilityto include all important natural resources in the calculations, including some economically important resourcessuch as water and fish. Because intangible capital is the residual of subtracting natural and produced capitalfrom total wealth, this means that intangible capital instead of natural capital includes the wealth contributed bythese resources. Natural wealth is therefore smaller than it should be and intangible capital larger. This isespecially the case in countries where the unvalued resources are especially important.
Finally, the inability to explicitly value certain ecosystem services is also a significant omission. The authorsargue that many ecosystem services are, in fact, captured in natural wealth because they enhance the value ofresources that are harvested and sold and are therefore implicitly valued.
We have not included those tables here because the estimates currently are only for one year, while theindicator proposed for MDG 7 Target 9 looks at the change in wealth over time.
The Comprehensive Wealth Measure makes an important contribution toward developing economic accountsthat are able to integrate social and environmental parameters. Comprehensive Wealth is grounded entirely ineconomic theory but includes social and environmental elements to an extent that allows for insight intocountries’ priorities and the implications of the interplay between their social, economic, and environmentalpolicies. Trends in total, natural, and intangible wealth over time provide a useful indicator of whether a countryhas adopted policies that allow for economic growth without undermining the country’s natural resources baseor ignoring social development.
Tools to integrate ecosystem service indicators
Returning to the Millennium Ecosystem Assessment and the Gariep Basin in South Africa, this section exploreshow ecosystem service indicators can be used to examine the relationships among different ecosystem servicesthat have direct impacts on social and economic values and are reflected in the other MDGs. Decision-makerswant to know about the capacity of ecosystems to provide a bundle of services over a period of time and from aspecific area of their countries. Could a country such as South Africa, for example, increase food production inthe Gariep Basin (to reduce hunger and increase income) and, if so, what would be the impacts on wateravailability and biodiversity?

46
In fact, the analysis of tradeoffs or synergies among ecosystem services must be at the heart of achieving theMDGs. An integrated, synchronous approach to meeting the MDG targets should be focused on improvedmanagement of ecosystems and their capacity to sustainably deliver multiple types of ecosystem services (MA2005: Appendix B). A goal-by-goal analysis of the implications of ecosystem conditions for achieving the 2015MDG targets indicates that most of them depend directly on ecosystem services, including the targets onpoverty, hunger, gender equality, child mortality, disease, and sustainable development. Moreover, achievingthe targets of multiple MDGs frequently depends on the same ecosystem services.
This analysis requires tools to integrate ecosystem service information and help to answer the followingquestions:
• What are the relationships among different MDG targets representing different ecosystem services suchas provisioning of food and water?
• What are the relationships among use of ecosystems services now compared to the use of theseservices in the future? (This is related to MDG 7 on ensuring environmental sustainability and thecapacity of ecosystems to continue to provide services.)
The local, regional, and global components of the Millennium Ecosystem Assessment can provide someguidance on how such an evaluation of ecosystem services can be done. The assessment of Ecosystem Services inthe Gariep Basin relied on the following techniques to examine tradeoffs:
• They examined the tradeoffs between two ecosystem services--,food production and water availability--using scenarios and policy analysis;
• They used a classification framework (which was proposed for South Africa’s Water Act) to examine theallocation of different water services that covered the needs of people as well as ecosystems; and
• They used maps to examine first the tradeoffs between food production and biodiversity. A second setof maps looked at four ecosystem service indicators and one measure of human well-being. The mapsof ecosystem services highlighted either areas that provided a large supply of a service or areas thatproduced an irreplaceable or unique service. The indicators were:
o areas that are irreplaceable for food production;o areas that are irreplaceable for biodiversity;o areas in which groundwater is high in salinity;o catchments in which surface water requirements are 60 percent or more of availability; ando municipalities in which one-quarter or fewer of households have access to electricity from a
local authority (as a proxy for one important dimension of well-being/public serviceavailability).
Each of the maps, reflecting different ecosystem services, had a unique spatial pattern. By combining thesemaps, scientists from the Basin could identify potential areas of competing demands: areas that were labeled“hotspots” or areas that were irreversible for the delivery for the ecosystem service in question. These areas areshown in the following diagram.

47
Figure 4a – 4h: Ecosystem Service and Human Well-being “Hotspots” in the Gariep Basin.
Source: SAfMA 2004.

48
Figures 4.a, 4.b, and 4.c show separate catchment areas in the Basin that are of considerable importance to theprovision of proteins, calories, and biodiversity conservation. In other words, these areas are “irreversible” forthese services. Figure 4.d shows catchments in which surface water requirements are 60 percent or more ofavailability, suggesting potential limits on use if demands increase. Figure 4.e depicts catchments in whichgroundwater salinity is above the level for use for human or livestock consumption. This means that theseaquifers would not be suitable for substituting for ground water sources.
Figure 4.f highlights the poverty dimension and shows municipalities in which electricity is supplied by a localauthority to 25 percent or fewer of households. And, Figure 4.g identifies areas with two or more producingmines or exploited deposits: industries which can generate income but often have severe environmentalimpacts for local communities.
Finally, Figure 4.h is a synthesis map depicting the key ecosystem service areas in the Gariep basin for all sevenservices using the “irreversibility” measure of the indicator. The dark areas in the southeast part of the basin areirreversible for surfacewater; the medium-shaded areas in the northern part are irreplaceable for cerealproduction; the southern most catchments are irreversible for protein production and the western and northerncatchments irreversible for biodiversity.
Lessons learned from efforts to develop an index that integrates environment into all MDGs
Calculating a single number that reflects the integration of environment values (and social and economic values)has proven to be a remarkably difficult task. When experts apply basic criteria of an index that is meant to beused to influence policy, they are looking for the index (number) to be: timely; available periodically; publiclyavailable and accessible; linked to policy; linked to measurable change; based on understandable anddocumented models, quantitative, transparent in its construction; have available data for most countries in theworld; and incorporate social, economic, and environmental values.
The World Bank Adjusted Net Savings and the Comprehensive Wealth Measurement come closest to meetingthese criteria. This doesn’t mean that the ANS and CWM are ideal or close to complete. Their strength is also theirweakness. They measure all that is valuable in a single unit, money. Yet we know, for example, that manyecosystem services, particularly the regulating and cultural services identified by the Millennium EcosystemAssessment, are not usually marketed. Therefore, their value and loss are not incorporated as the ecosystemservices are depleted. These services may be tied to provisioning other ecosystem services that are measuredand valued, such as agro-ecosystem production of food, but much damage can be done to soil, water, wildlife,and human livelihoods before the economic value is tallied and shows up in an index.
The Environmental Sustainability Index, although it has been used successfully to engage country governmentsin identifying and addressing problems with their environmental policies and institutions, it focuses principallyon the environment and not on development. And, without a target to aim for, countries are left competingwith one another rather than focusing on the ultimate goal of achieving sustainability. The Ecological Footprint,too, has been useful in raising awareness among policy-makers and civil society to the unsustainable path ofresource use that the world is on. It is a creative way to measure pressures on the environment; the use of asingle unit of measure of biologically productive land is easy to comprehend. But the EF is a hypotheticalmeasure of land and does not allow for land to simultaneously provide biodiversity, timber, and carbonsequestration, which is what multiple use and environmentally sustainability policies call for.

49
The use of ecosystem service indicators to map, monitor, and analyze tradeoffs among services is a promisingnew approach, but few countries have embarked on the development of these indicators, and even fewer havebegun to use this approach in a rigorous fashion to integrate environmental values in areas where social andeconomic decisions are made. For example, if scientists were able to determine the capacity of an ecosystem tocontinue to produce a full set of ecosystem services of value and use to human society, this would be anexcellent measure of sustainability.
The ESI and the estimates of Net Adjusted Savings and Comprehensive Wealth were created independently byacademic and international organizations. So, in some respects, these organizations are the keepers of themethodology that is used. In these measures, country rankings and movements toward or away fromsustainability may very much depend on the judgments of a few individuals. The Ecological Footprint and theecosystem service indicator analyses, on the other hand, are products of local organizations as well asinternational efforts and can be adapted to local conditions and therefore influence local decisions.
More conceptual thinking, more work on models, and new indicators of ecosystem services and social andinstitutional characteristics will have to be undertaken before there is a single index that integrates values intoall the MDGs. Furthermore, it is not clear that that major social and ecosystem values will ever be measured in anacceptable manner using a unit of money, so there is a need to aggressively develop indicators of ecosystemservices and expand their use in making ecosystem tradeoffs that affect human well-being.
Assessment Methods for Integration
Millennium Development Goal 7 sets a considerable challenge—“to ensure environmentalsustainability” and target 9 will be even more difficult for national and sub-national governments toachieve—“to integrate the principles of sustainable development into country policies and programs andreverse the loss of environmental resources.” Neither the Millennium Declaration nor subsequent UNagreements and analyses offer guidance on how this is to be achieved. Clearly there is a need for bothstrategic planning processes and supporting analytical tools to ensure progress toward reaching thesegoals.
Processes for integration
In 1992, Agenda 21 called for all countries to develop national sustainable development strategies (NSDSs). ThePlan of Implementation agreed to at the World Summit on Sustainable Development recommitted governmentsto taking action on NSDSs, demanding “immediate steps to make progress in the formulation and elaboration ofnational strategies for sustainable development and begin their implementation by 2005.” As a follow-up, we haveseen a number of countries developing and revising NSDSs and their equivalents. Although there has beenprogress in process and content, many NSDSs fall well short of satisfying what is regarded as best practice.Guidance on NSDSs has been provided by OECD DAC (2001), OECD/UNDP (2002), and UNDESA (2002), based onlessons learned from international experiences. A number of principles and characteristics for NSDSs are nowrecognized and can be summarized as:
• Integrate economic, social, and environmental objectives;• Coordinate and assure balance among sector, thematic strategies, and decentralized levels;• Coordinate and assure balance across generations;• Build on existing knowledge and processes;• Encourage broad participation, with effective partnerships, transparency, and accountability;

50
• Work for country ownership, with a shared vision and a clear timeframe on which stakeholders agree;• Maintain commitment and support continuous improvement of strategic planning processes;• Focus on priorities, outcomes, and practical means of implementation;• Maintain linkage with budget and investment processes and assure continuous monitoring and
evaluation.
Strategy is increasingly being used to imply a mostly continuous learning system to develop and achieve ashared vision rather than one-off exercises. The associated challenges are now more clearly about institutionalchange—about generating awareness, reaching consensus on values, building commitment, creating anenvironment with the right incentives, working on shared tasks—and doing so at a pace with whichstakeholders can cope. The means to do this are integrated systems of participation, analysis, debate,experimentation, prioritization, transparency, monitoring, accountability, and review. All countries will havesome elements of these systems within existing strategic planning mechanisms. The challenge is to find them,bring them together, and strengthen them through experience.
Putting a NSDS into operation would, in practice, consist of using promising, existing processes as entry pointsand strengthening them in the key principles and characteristics listed above. In the poorest countries, povertyreduction strategies (PRS) enjoy considerable political and donor support and could provide a bridge to aneffective NSDS. The key will be ensuring that environmental concerns are addressed and integrated with thesocial and economic dimensions.
There are also many other existing domestic planning processes (development, urban, rural, land use, sectoral,etc.) at both national and local levels, all of which are potential vehicles for realizing the MDGs, and particularlyMDG7. Here, too, there exists a range of good guidance on methods, use of information, and best practice (seeDalal-Clayton et al. 2001, and Dalal-Clayton et al. 2002).
But although NSDSs and planning approaches themselves are important to providing a structured process and aplatform for integrating the principles of sustainable development in country policies and programs, theyrequire appraisal and assessment tools to access and analyze the required information and deliver it to the pointof decision-making. Recognizing this, UNEP initiated a program in 2003 on integrated assessment and planning(IAP) for sustainable development. The program aims to develop a generic framework for such planning andinvolves pilot applications and policy experimentation in a number of countries. It builds on earlier UNEP workon an integrated approach to Environmental Impact Assessment and Strategic Environmental Assessment andon integrated assessment of trade policies.
Assessment tools for integration
Many methods are available to assess the environmental, economic, and social dimensions of sustainabledevelopment, but, at the moment, there are four key tools that offer a means for integration. They areEnvironmental Impact Assessment, Strategic Environmental Assessment, Sustainability Appraisal or Assessment,and Ecosystem Assessment.
Environmental Impact Assessment (EIA)EIA was first introduced in 1969 under the USA’s National Environmental Policy Act. It operates at the projectlevel and is now used in almost all countries. Arguably, it is the only tool for integration that is widelyunderpinned by legal statute (most countries have some legal instrument prescribing its use) and institutionsdedicated to its application and/or regulation. Some of the available guidelines and regulations are catalogued(see Donnelly et al. 1998).

51
Although EIA has an environmental label, increasingly, practice addresses all three dimensions of sustainability.As with many other tools, the challenge to optimizing the contribution of EIA to better decision-making isensuring that it is undertaken early in the planning cycle when it can guide consideration of alternatives orinform a ‘no-go’ decision. When undertaken after decisions have been taken, EIA can, at best, signal necessarymitigation measures.
Strategic Environmental Assessment (SEA)SEA is now widely used to refer to a systematic process to analyze the environmental (and increasingly the socialand sometimes the economic) effects of policies, plans, and programs. SEA has developed largely becauseproject-based EIA is not designed to address issues beyond such predetermined proposals. SEA cancomplement, enhance, and even streamline the application of EIA to the project level.
The field of SEA has seen rapid evolution over the past 15 years. New approaches and areas ofapplication are emerging all the time, particularly in the area of development cooperation andinternational trade. And, like EIA, legal instruments are beginning to be introduced to prescribe theapplication of SEA. For example, at an international level, the European SEA Directive (Directive2001/42/EC) came into force in July 2004 across the European Union (EU) and has since beentransposed into national regulations by member states, and the SEA Protocol to the UNECE (ESPOO)Convention on EIA in a Transboundary Context was agreed to at Kiev in 2003. Beyond the EU, anumber of countries now have legal or administrative provisions that establish a formal SEAprocedure (see for example, Australia, Canada, China (national) and Hong Kong SAR, Norway and USA(federal and California).
SEA is now seen as a continuum of approaches. At one end of the continuum, the focus is mainly environmentalintegration. It is characterized by the priority goal of mainstreaming and up-streaming (mainly) environmentalconsiderations into strategic decision-making at the earliest stages of planning processes to ensure they are fullyincluded and appropriately addressed. This would be the priority when developing or evaluating a primarilysocial and/or economic policy, plan, or program. Some observers have called this the “impact-centeredapproach to SEA,” which has its roots in EIA experiences and methodologies. This focuses primarily on predictingand mitigating the negative impacts of predetermined policies, plans, and programs. Current experience of SEAtends to be dominated by this impact-centered approach.
Sustainability Appraisal or Assessment (SA)At the other end of the continuum is a more comprehensive, upstream, decision-centered approach (sometimesreferred to as ”holistic SEA” or ”sustainability appraisal”). This can be regarded as the ”frontier" of SEA, whichaims to expand the scope of assessment beyond reactive impact prediction into the earliest stages of decision-making, such as the formulation of problems, objectives, and alternatives.
Sustainability appraisal/assessment is taken to include approaches that are used to integrate or inter-relate theenvironmental, social, and economic pillars of sustainability into decision-making on proposed initiatives, forexample, evaluating tradeoffs among these dimensions. Note: others recognize more than three intersectingpillars, such as including institutions or politics or distinguishing between social and cultural dimensions ofsustainability.
Whereas SEA focuses on policies, plans, and programs, SA can be applied at all levels of activity, includingprojects, and particularly within or against a framework of sustainability principles, indicators, or strategies. Itsmethodological basis is in policy analysis rather than EIA experience.

52
A review of current practice in SA shows that it is a rapidly expanding field with much experimentation. Butapproaches tend to employ a limited number of common components (some often together), such as:
• checklists of issues and concerns,• indicators,• sustainability criteria (and weightings),• questionnaires,• cost accounting,• visual models,• computer software and modeling,• toolkit approach,• classification systems, and• matrix methods.
Among these, indicators most often provide the main ingredient of a sustainability appraisal. A problem appearsto be that sector or pillar indicators are expressed in different (and therefore non-matching) currencies or”languages.” Economic indicators are expressed in monetary terms. Environmental indicators are usuallymeasured in bio-geophysical units such as parts per million, numbers of species, or hectares of forest. Althoughsome social indicators are well developed scientifically and statistically, such as life expectancy, many others arebased on societal or individual values (preference for a particular life style or set of beliefs). Thus, althoughaiming to address sustainability, the above dilemma means that SA methods tend to align indicators side byside, frequently as visual models. Actual integration is not achieved. Users are required to make their owninterpretations.
Ecosystem Assessment (EA)The field of ecosystem assessment is changing and, with it, the methods and approaches. What was onceprincipally a local approach to protecting and mitigating forces that would impact an ecosystem has blossomedinto a global and multi-scale approach that highlights the interactions between ecosystems and human well-being. The Millennium Ecosystem Assessment, for example, “places human well-being as the central focus forthe assessment while recognizing that biodiversity and ecosystems also have intrinsic value and that peopletake decisions concerning ecosystems based on considerations of both well-being and intrinsic value” (see MA2003).
An ecosystem framework offers decision-makers a means to identify options that can better achieve core humandevelopment and sustainability goals, better understand the tradeoffs involved—across sectors andstakeholders—in decisions concerning the environment, and align response options with the level ofgovernance where they can be most effective.
Although in flux, an ecosystem assessment should be characterized by positive answers to the followingquestions. “Did the process:
• bring the best available information to bear?• function transparently, use locally grounded knowledge, and involve all those with an interest in a
decision?• pay special attention to equity and the most vulnerable populations?• use decision analytical frameworks that take account of the strengths and limits of individual, group,
and organizational information processing and action?• consider whether an intervention or its outcome is irreversible and incorporate procedures to evaluate
the outcomes of actions and learn from them?• ensure that those making the decisions are accountable?• strive for efficiency in choosing among interventions?

53
• take account of thresholds irreversibility; cumulative, cross-scale, and marginal effects; and of local,regional, and global costs, risk, and benefits?”
(MA 2003: 24)
As evident from the questions asked and the expected answers to be worked out, an ecosystem assessment isintended to be grounded in both the science and information of ecosystem processes and services, and thepolitical and administrative processes of a local, regional, national, and global setting.
Challenges for improving planning and decision-making
Inevitably, integration (seeking the balances and agreeing on the tradeoffs) must remain the responsibility ofpolitical and decision-making processes. It cannot be completely supplanted by analytical tools. But there is acontinuing challenge to improve planning and decision-making processes so that they are transparent,inclusive, participatory (to the extent possible), and have access to good and relevant information, which areanalyzed and presented in the best and most appropriate way and made available at the critical stages.
In other words, strategic planning and decision-making for the MDGs can be significantly improved by seekingto fully satisfy the above NSDS principles. Assessment and analytical tools such as EIA, SEA, SA, and EA have a keyrole to play. and more effort is needed to ensure that their role and function is understood and that they areused to deliver relevant and understandable information at optimal stages in decision-making cycles.
54
Chapter 4
Setting Priorities for Developing and Using Indicators and Assessments
As of summer 2005, no country, either developed or developing, is using all the indicator, assessment, andreporting tools needed to measure progress toward Millennium Development Goal 7, Target 9. As this reviewhas shown, most developing countries are not reporting on the state of progress to the extent expected. Thereasons for non-reporting have been discussed and analyzed. However, the data show that some countries arebeginning to develop and track their own national targets with indicators chosen to meet national needs. Moreremarkable is that only five developed countries have prepared reports on the MDGs, even though all of themhave a need to monitor progress in reversing the loss of environmental resources and in integrating theprinciples of sustainable development in national policies and programs, however this target is interpreted. It issurprising that with all the focus on achieving the MDGs by 2015, the record of reporting on progress for MDG 7is so poor.
This paper is concerned neither with the political and administrative processes involved nor with the motives ofcountry leaders to report on progress, but with the technical, resource, and institutional problems thataccompany the interpretation of targets, the development and use of indicators and other assessment methods,and the reporting of country results to policy-makers and civil society. Given the overall lack of evaluation,analysis, and reporting, what is to be done?
A first step is to help countries set priorities for improving the development and use of indicators andassessments. One technique is to provide a menu of choices so that policy-makers, policy analysts, statisticians,subject matter experts, and other critical stakeholders at all levels of society can decide which targets to focustheir efforts on and what kinds of monitoring and data collection systems need to be put in place to develop theappropriate indicators. The same can be said for assessment techniques. In the following matrix, Table 7, themajor types of indicators and assessment methods are listed across the top, and the countries are listed in acolumn along the left- hand margin. The major types of indicators and assessment tools include:
• the current and expanded set of indicators that are often labeled the “global set,” as discussed inChapter 2;
• indicators based on national interpretation of Target 7, as discussed in Chapter 2;• indicators of ecosystem services, for which a number are listed in Chapter 3;• indicators integrating environment into all the MDGs, as described in Chapter 3; and,• assessment tools for integration, also described in Chapter 3.
For the sake of brevity, detailed lists are not repeated here, but in the real-world process of choosing strategiesto achieve Target 7, countries will be making decisions on which information, analyses, and assessment methodsare available and useful.
A great deal of this information is already available from national surveys, censuses, remote sensing,administrative files at national and sub-national levels, data compiled for large projects and programs, and majorefforts to monitor change on a regional and global basis. Every country has a considerable amount of social,economic, and environmental information, although much of the latest information may in fact reside indatabases and reports outside the country’s borders. Most countries have legal requirements for impactassessments, and many have prepared national state-of-environment reports, national planning strategies, ornational sustainable development strategies, and recently have participated in the World Bank-supportedPoverty Reduction Strategy process.

55
Table 10: Choosing Indicators and Assessment Methods to Measure Progress toward Target 7
Current andExpanded
Set ofIndicators
(GlobalTargets)
IndicatorsBased onNationalTargets
Indicators ofEcosystem
Services(NationalTargets)
Indicators ofIntegration
Assessment Toolsfor Integration
Country A
Country B
Country C
…
……
When faced with a choice, countries would likely choose items from all five columns. Some would choose toexpand their data collection and indicator development to address forest resources and forest degradation.Others would monitor local fishing grounds, an important source of protein for artisanal fishers and theircommunities. Still others would improve the monitoring of drylands and the ecosystem services they provide topoor farmers and herders while some would want to focus on indicators that can be used to make tradeoffsamong a limited set of resources within the context of a growing population.
For assessments, most countries have in place regulations for applying environmental impact assessmentmethods for projects but may choose to expand their efforts to conduct a sustainability assessment to see howbest their investments link environmental outcomes (Target 7) with health and poverty reduction outcomes(Targets 1, 2, 5, 6, 7, and 8) or an ecosystem assessment to gain perspective on opportunities to alleviate poverty(Targets 1, 2) or strengthen the rules and institutions of governance (Target 12).
This process will need to take into consideration the costs involved, the capacity of country and sub-regionalscientists and experts, the access to and availability of information, and experience with data collection,processing, management, and analysis. The process should also consider how the information will be used: asinputs to policy dialogue, for communication with communities and countries in similar situations, for use by theprivate sector, for access from the Internet and Web sites, and for linking local knowledge with scientificinformation to make decisions.
Just as countries develop national strategies to address the MDG targets, they will need to develop informationand assessment strategies to help shape policies and practices, use the information to hold decision-makersaccountable, and use the data to report on progress or the lack of it in MDG and other national-level reportingpractices. The achievement of the MDGs has to go hand in hand with the development of the relevantinformation and technologies.

56
Chapter 5
Recommendations for Action
This paper contains ideas to help countries interpret MDG 7, Target 9, and to develop strategies to measureprogress toward achieving environmental sustainability and reversing the loss of environmental resources. Thechallenge now is to move from narrowly defined targets for the environment to broader thinking and anunderstanding of environment as a set of ecosystems with services that have value to all, especially the poor.Such strategies could also be used to integrate environmental issues into other MDGs and targets in whichenvironmental assets play an integral role.
The following recommendations are aimed at helping countries create the conceptual frameworksand the information that they need to strengthen the strategic planning and assessment processes toachieve the MDGs and then develop the monitoring and evaluation processes that will be used tomeasure their progress.
Recommendations for action include:
1. Interpreting MDG 7, Target 9. MDG 7 is a powerful goal. It challenges countries, all countries, to“ensure environmental sustainability.” Target 9, however, is confusing because it calls for countries toboth “integrate the principles of sustainable development into country policies and programs” and to“reverse the loss of environment resources.” Unlike most other targets, it is neither time bound norquantifiable, and the indicators suggested for countries to use to develop strategies and assess progressare limited to only a few key environmental resources.
The ambiguity can be removed by interpreting Target 9 as two separate targets. The first should dealwith environmental resources in a more comprehensive fashion, with wording as follows, “Maintain orrestore the capacity of ecosystems to provide ecosystem services to people.” The focus is on people butwithout losing site of the intrinsic value of nature. An ecosystem audit as part of the strategic planningprocess for the MDGs will ensure that all major ecosystem services are identified and valued within acountry. The second target, to “Integrate the principles of sustainable development into countrypolicies and programs,” should also apply to all countries. It should be understood that both thesetargets apply to administrative units within and among countries and at local and international levels.
2. Setting Country Priorities for Target 9. Although all countries signed the Millennium Declaration, itwas understood that each country would review and refine the targets for making progress toward theMDGs and the indicators by which it would measure progress and be held accountable. It isrecommended that much greater effort be made by the international community to supportdeveloping country processes for setting targets and developing indicators that meet their nationalneeds. It is also recommended that countries adopt an ecosystem approach to identifying resourcetargets to ensure that sufficient attention is paid to provisioning, regulating, and cultural services which,in many cases, can generate opportunities for poverty alleviation, particularly in rural areas. Thebottom-up process has to be a fundamental part of the MDG success. Furthermore, it is these basicecosystem services that have to be maintained if a country or region of a country is to move towardenvironmental sustainability.

57
3. Strengthening and Integrating Environmental Assessment Processes.
It is essential to mainstream environment and ecosystem thinking in all MDG development strategies,particularly those that address health, water and sanitation, poverty, gender, and governance targets.The economic and social as well as environmental returns to investments in environmentalmanagement and ecosystem restoration are positive, and the success rate is growing. Focusing ondefining national targets means they can be used in implementing the Poverty Reduction StrategiesPlans (PRSPs) and other national and local strategic planning efforts. Focusing on targets also meansthat implementing the PRSPs will be supportive of all of the Millennium Development Goals. Ifindicators are to be developed to assess changes in poverty, ecosystem services, and governance, thenchanges will need to be made in how information is collected, how new institutional arrangements areestablished, and how greater use can be made of information and communication technologies toreach targeted audiences.
4. Strengthening the Information Base to Develop Indicators for Planning, Decision-making, andAssessment. If environmental resources and ecosystems are going to be recognized as worthy ofinvestment by business leaders, bankers, and finance ministers, much more attention needs to be paidto developing core data sets for decision-making. If ecosystem services are going to be recognized asessential components of strategies for all the MDG Targets, then much more effort has to go intocollecting, processing, managing, releasing, accessing, analyzing, and using this information.
Every country, for example, should have a high- resolution map of where the poor are located so thatpro-poor policies and investments can be targeted to the right localities. These maps can be integratedwith ecosystem service maps to assess the resources available to the poor. Countries should take thelead in developing National Ecosystem Accounts, so that analysis and assessment can be donethroughout a country and on a timely basis. Too much effort now goes into one-off data collection withlittle regard for its cost and future use. Developing countries need to establish legal and regulatoryregimes to ensure that the rights to land, water, and other natural resources are protected and enforcedat community, individual, and household levels. This information should be available to all.
5. Involving Developed Countries in Setting Targets, Developing Indicators, and Reporting Progress.The MDGs, particularly Target 7 and the development of global, national, and sub-national indicators,are not just for developing countries. OECD countries can provide numerous examples of how tomeasure and monitor ecosystem services and indicators used to assess all other targets. Many of theseexamples are relevant to developing countries. Furthermore, developed countries, for many reasons,should continue to expand their monitoring of such key environmental issues as climate change,biodiversity, energy production and use, agricultural production and trade, fishing effort and catch, andthe regulating of ecosystem services, noted previously because so many of these issues have trans-boundary and global impacts. Developed countries should also turn this valuable scientific informationinto policy-based indicators and report on global and regional conditions to their citizens and theworld. The developed world is in a much better position to assist the developing world when it firstexamines its own development trajectory to see if it is sustainable and then share its experiencescollaboratively.
58
References
Dalal-Clayton D.B. and D.L. Dent. 2001. Knowledge of the Land: Land Resources Information and Its Use in RuralDevelopment. Oxford: Oxford University Press.
Dalal-Clayton D.B., D.L. Dent and O. Dubois. 2002. Rural Planning in Developing Countries. London: EarthscanPublications.
Department for International Development, UK (DFID) in collaboration with The European Commission (EC),United Nations Development Programme (UNDP) and The World Bank. 2002. Linking Poverty Reduction andEnvironmental Management. Policy Challenges and Opportunities. New York: DFID.
Donnelly A, D.B. Dalal-Clayton and R. Hughes. 1998. A Directory of Impact Assessment Guidelines. 2nd edition.Nottingham: International Institute for Environment and Development.
Esty, D., M. Levy, S. Srebotnjak and A. de Sherbinin. 2005. 2005 Environmental Sustainability Index: BenchmarkingNational Environmental Stewardship. New Heaven: Yale Center for Environmental Law and Policy. Availableonline at http://www.yale.edu/esi/.
Folke C, A. Jansson, J. Larsson and R. Costanzo. 1997. “Ecosystem Appropriation by Cities.” Ambio, 26 (3).
Millennium Ecosystem Assessment (MA). 2003. Ecosystems and Human Well-Being: A Framework for Assessment.Washington, DC: MA.
Millennium Ecosystem Assessment (MA). 2005. Ecosystems and Human Well-Being: Synthesis. Washington, DC:MA.
Narayan D., R. Patel, K. Schafft, A. Rademacher, and S. Koch-Schulte. 2000. Voices of the Poor: Can Anyone Hear Us? New York, N.Y.: Published for the World Bank, Oxford University Press.
Narayan D., R. Chambers, M. Kaul Shah, and P. Petesch. 2000. Voices of the Poor: Crying Out for Change. New York,N.Y: Published for the World Bank, Oxford University Press.
Narayan D., and P. Petesch. 2002. Voices of the Poor: From Many Lands. New York, N.Y: Published for the WorldBank, Oxford University Press.
Organization for Economic Co-operation and Development (OECD). 2001. The DAC Guidelines: Strategies forSustainable Development: Guidance for Development Cooperation. Paris: OECD. Available online atwww.SourceOECD.org.
Organization for Economic Co-operation and Development (OECD), and United Nations Development Program(UNDP). 2002. Sustainable Development Strategies: A Resource Book. London, England: Earthscan Publications.
Scientific and Technological Options Assessment (STOA), and Directorate General for Research, Division Industry,Research, Energy, and Environment. 2001. Ecological Footprinting. Luxemburg: Commissioned by the EuropeanParliament. Available online at http://www.europarl.eu.int/stoa/publi/pdf/00-09-03_en.pdf.
Southern Africa Millennium Ecosystem Assessment (SAfMA). 2004. Ecosystems Services in the Gariep Basin.Pretoria, South Africa: SAfMA. Available online athttp://www.millenniumassessment.org/en/Products.Subglobal.aspx.
The World Bank. 2005a. Little Green Data Book 2005. Washington, DC: The World Bank. Available online athttp://lnweb18.worldbank.org/ESSD/envext.nsf/44ByDocName/EnvironmentalIndicatorsCurrentInitiativesTheLittleGreenDataBook2005.
The World Bank. 2005b. Where Is the Wealth of Nations: Measuring Capital for the XXI Century. Washington, DC: TheWorld Bank.

59
United Nations Conference on Environment and Development (UNCED). 2002. Guidance in Preparing a NationalSustainable Development Strategy: Managing Sustainable Development in the New Millennium. New York: UNCED.13 (DESA/DSD/PC2BP13). Available on www.johnnesburgsummit.org.
United Nations Development Programme (UNDP). 2004. Vietnam’s National Strategy for Environmental Protection.New York: UNDP. Available online at http://www.undp.org.vn/themes/environment/.
United Nations. 2000. United Nations Millennium Development Goals. Available online athttp://www.un.org/millenniumgoals/.
United Nations Development Programme (UNDP). 2005. Monitoring Country Progress towards MDG7: EnsuringEnvironmental Sustainability. Available online at http://www.undp.org/fssd/sustdevmdg.htm#globtarg.
United Nations Development Program. 2005. Millennium Development Goals Statistical Database.http://www.undp.org/fssd/sustdevmdg.htm
United Nations Millennium Project. 2005. Investing in Development: A Practical Plan to Achieve the MillenniumDevelopment Goals. New York: United Nations Development Programme.
United Nations Statistics Division (UN DESA). 2005. Millennium Development Goals: 2005 Progress Chart. New York:UN DESA.
U.S. Agency for International Development (USAID), Center for International Forestry Research, WinrockInternational, World Resources Institute and IRG. 2002. Nature, Wealth, and Power: Emerging Best Practice forRevitalizing Rural Africa. Washington, DC: USAID.
World Resources Institute (WRI) in collaboration with United Nations Development Programme, United NationsEnvironment Programme, and World Bank. 2005. World Resources 2005: The Wealth of the Poor – ManagingEcosystems to Fight Poverty. Washington, DC: WRI.
World Wildlife Fund International (WWF), Global Footprint Network and UNEP-WCMC. 2004. Living Planet Report2004. Gland, Switzerland: WWF. Available online at http://www.panda.org/downloads/general/lpr2004.pdf.
World Wildlife Fund International, Global Footprint Network, and Netherlands Committee for the WorldConservation Union (NC-IUCN). 2005. Europe 2005: The Ecological Footprint. Gland, Switzerland: WWF. Availableonline at http://www.footprintnetwork.org/gfn_sub.php?content=books.

60
Acronyms
ANS - Adjusted Net Savings
CBD – Convention on Biodiversity
CDIAC – Carbon Dioxide Information Analysis
CFCs – Chlorofluorocarbons
COP – Conference of the Parties
CWM - Comprehensive Wealth Measurement
EU – European Union
EF- Ecological Footprint
EIA – Environmental Impact Assessment
ESPOO - SEA Protocol to the UNECE
ESI – Environmental Sustainability Index
FAO – Food and Administration Organization of the United Nations
GHG – Green House Gas
GNI - Gross National Income
IEA - International Energy Agency
IPCC - International Panel on Climate Change
IUCN – The World Conservation Union
MDG – Millennium Development Goals
NSDSs - National Sustainable Development Strategies
ODS - Ozone Depleting Substances
POPs - Persistent Organic Pollutants
PPP - Purchasing Power Parity
SA – Sustainable Appraisal or Assessment
SEA – Strategic Environmental Assessment
STOA - Scientific and Technological Options Assessment
UNFCCC - United Nations Framework Convention on Climate Change
WCMC – UNEP World Conservation Monitoring Centre
WHO - World Health Organization
WSSD – World Summit on Sustainable Development

61
List of Tables and Figures
Tables:
Table 1: The Millennium Development Goals
Table 2: Major Trends in the MDGs, by Region
Table 3: Key Links between the Environment and the MDGs
Table 4: MDG 7 Global Targets and Indicators
Table 5: Examples of Country/Context-Specific MDG 7 Targets
Table 6: 2005 Environmental Sustainability Index – Scores and Rankings
Table 7: Ecological Footprint, 2001
Table 8: Adjusted Net Savings Rates in Selected Countries, 2005
Table 9: Country Level Wealth Estimates, 2000
Table 10: Choosing Indicators and Assessment Methods to Measure Progress toward Target 7
Figures:
Figure 1: Millennium Ecosystem Assessment Conceptual Framework of Interactions between Biodiversity,
Ecosystem Services, Human Well-Being, and Drivers of Change
Figure 2: Linkages between Ecosystems Services and Human Well-Being
Figure 3: Calculation of Genuine Savings for Bolivia, 2003
Figure 4: Ecosystem Service and Human Well-being “Hotspots” in the Gariep Basin