Embed Size (px)
Citation preview

Annual Report 2012-13
Pennar Industries LtdFloor No.: 3, DHFLVC Silicon Towers,
Kondapur, Hyderabad - 500 084Andhra Pradesh, India.

Corporate Information ......................................................................................................2
From the Chairman ...............................................................................................................4
From the Vice Chairman ................................................................................................6
From the CEO .............................................................................................................................8
Looking Forward ..................................................................................................................10
Business Verticals ...............................................................................................................16
Directors’ Report .................................................................................................................32
Management Discussion and Analysis Report ............................40
Compliance Report on Corporate Governance ...........................56
Auditors’ Report ...................................................................................................................74
Pennar Industries Limited Balance Sheet ............................................80
Pennar Industries Limited Statement of Profit & Loss............81
Cash Flow Statement ....................................................................................................82
Notes forming part of the Financial Statements ..........................83
PEBSL Directors’ Report .............................................................................................106
PEBSL Independent Auditors’ Report......................................................110
PEBSL Balance Sheet ..................................................................................................114
PEBSL Statement of Profit & Loss .................................................................115
PEBSL Cash Flow Statement .............................................................................116
Notes ...............................................................................................................................................118
Consolidated Balance Sheet ...........................................................................150
Consolidated Statement of Profit & Loss ...........................................151
Consolidated Cash Flow Statement ......................................................152
Notes ...............................................................................................................................................154
PEBS Pennar Factory

Board of DirectorsMr. Nrupender Rao, Chairman
Mr. C Parthasarathy
Mr. Ravi Chachra
Mr. B Kamalaker Rao
Dr. G Vivekanand
Mr. C Rangamani
Mr. Manish Sabharwal
Mr. J Ramu Rao
Mr. Vishal Sood
Mr. Varun Chawla, Additional Director
Mr. Ch Anantha Reddy
Mr. Aditya Rao, Vice Chairman
Management TeamMr. Suhas Baxi, President & CEO, PIL
Mr. P V Rao, MD, PEBSL
Mr. Shreepad Purkar, President & CEO, PEL
VP - Finance & Company Secretary
Mr. R Ravi
AuditorsM/s Rambabu & Co.,Chartered Accountants,31, Pancom Chambers,6-3-1090/1/A, Rajbhavan Road,Somajiguda, Hyderabad - 500 082
BankersState Bank of India
Axis Bank Limited
State Bank of Patiala
Registered Office :
Floor No. : 3, DHFLVC Silicon Towers,Madhapur Road, Kondapur,Hyderabad - 500 084, India
Registrars and Share Transfer Agents
Karvy Computershare Pvt. Ltd.,Plot No.: 17-24, Vithalrao Nagar,Madhapur, Hyderabad - 500 081
Plants
Patancheru UnitIDA, Patancheru - 502 319,Medak (Dist.), A.P.
Isnapur UnitIsnapur Village - 502 307Medak (Dist), A.P.
Chennai UnitKannigaipair Village,Uthukottai Tq Thiruvellore Dist,Tamil Nadu - 601 102
Tarapur UnitJ-72, MIDC, Tarapur, Maharashtra - 401 506
Hosur Unit43, SIDCO Industrial Estate, II Phase,Hosur, Tamil Nadu
PEBS PennarChandapur village, Sadasivpet Mandal, Medak,(Dist.)
Pennar Enviro Limited186/A & 188/A, IDA Mallapur, RR (Dist.) 500076
2

3
Mr. Nrupender RaoChairman
Mr. P V RaoMD, PEBSL
Mr. Aditya RaoVice Chairman
Mr. Suhas BaxiPresident & CEO, PIL
Mr. Shreepad PurkarPresident & CEO, PEL

4
Dear Shareholders,
Twenty five years ago, the Pennar Group took birth with the establishment of Pennar Steel. My dream in establishing Pennar Steels was modest and I believed that as an entrepreneur I could build an institution that could in a small manner cater to the needs of a growing India. My ambition was to create a company that would provide employment and livelihood to hundreds of families.
In the first year of operation, Pennar generated ` 8 Crores in sales. Twenty five years later, Pennar has evolved into a diversified engineering company with ` 1500 Crores in sales, representing a 25% compounded annual growth rate. Over 2000 employees and over 400 engineers are employed by the company. Pennar Industries and its subsidiaries have seven manufacturing facilities and 35 sales offices across India.
Pennar is now present in a diverse range of verticals providing solutions in custom designed green building systems, environmental technology, auto components, solar power, railway coach and wagon components and engineering design. It is with great pride that I look back at the past two and a half decades and on the journey we have traversed together.
I am very happy that Mr Suhas Baxi has joined your company as the President & CEO in December 2012.Mr Baxi has rich experience in managing companies and is very well suited to lead the company in its transformation. Mr Baxi has worked out a well-defined strategy with focused medium term objectives and a clear long term direction.
As you are aware, the last year was a very challenging year for the Indian Industry and your company had to operate in a macro-economic environment that was experiencing a slowdown, rising inflation that resulted in higher material and energy costs, a high interest rate regime and an environment that was not conducive to new investment in manufacturing.
In this difficult environment, Pennar has delivered, creditable consolidated results in FY 13, with Gross Revenue of ` 1274 Crores, EBIDTA of ` 116.5 Crores and PAT of ` 42 Crores, The company has generated positive cash flow of ` 54 Crores, during the year. While the slowdown in the manufacturing and infrastructure sectors is expected to continue for one more year, we believe that due to our efforts in the past financial year,we are well placed to put the company on a robust growth path.
We have sown the seeds for a new Pennar and have set ourselves an ambitious goal to transform your

5
company into an eminent engineering company in the next five years. Ten years ago, in response to difficult market conditions, we had to change and evolve by putting our faith in the idea that only a company that embraced continual value addition could remain relevant in a world with breakneck technological advancement. The logical synthesis of that idea has now developed into our growth plan which will transform us into an engineering institution with over a Billion USD in sales, a three fold increase in our revenues over the next five years.
Pennar’s transformation started a few years back when Aditya Rao joined the board with a vision to create Pennar’s leadership in Pre-engineered buildings. In a very short span of time, Pennar’s building subsidiary (PEBS) has emerged as a technically proficient and financially strong company enabling it to become a leading player in the country with sales of ` 325 Crores in FY13. PEBS has many firsts to its credit by building the first Gold Rated Green Factory in India, by constructing the largest clear span building (99 meters) in India, and by setting up the largest warehouse in India (10 million sq ft).
Mr. P V Rao, the Managing Director of PEBSL has built a highly capable, motivated and empowered management team. PEBS is confident that in the next five years, the explosive growth it has experienced will continue. Our efforts have been supported by NCI, Inc-our technical collaborator in the US and access to their technology and product line has allowed us to establish the company as a leading PEB player in India. A private equity firm Zephyr Peacock, a leading private equity company has recently taken a significant stake at a premium in the company.
The second subsidiary of Pennar Industries, Pennar Enviro (PEL) manufactures and markets fuel additives and water treatment chemicals. It has diversified by providing cohesive solutions in the design and construction of clear water and waste water treatment plants. The company has a technical collaboration with Tech Universal of UK, who have vast experience in designing and executing water projects. The CEO of Pennar Enviro Limited has rich experience in the field of water and has acquired a talented and motivated team with capabilities in estimation, design, detailing, supply chain and project management. The company has received orders from Amtech Auto, L&T, My Home Construction, Ranbaxy and AGI Glaspac.
The vast market opportunity and the strong capabilities of the PEL team make me very optimistic of the subsidiary’s future.
I have always believed in the potential for the growth of Pennar with its engineering skills and manufacturing capabilities. We need to create a new organization structure which has operational flexibility that will enable different manufacturing verticals to flourish and develop into vibrant independent businesses. The company has now been divided into four Strategic Business Units (SBU): Systems and Projects, Industrial Components, Precision Tubes and Steel Products as each of these businesses have their own distinct markets, capital assets, and customers. We have added prestegious customers like Thermax, BGR Energy, VE Commercial, Gabriel, ABB, Larsen & Toubro, Tata Power Solar, Schneider Electric and Lanco.
Mr. Suhas Baxi has been instrumental in laying the groundwork for the transformation of your company and substantial progress has been made in acquiring the best talent for various levels of management. Mr. Baxi has put in place the architecture for the SBUs, revamped our IT and ERP infrastructure, is planning to invest in high margin engineering verticals and is building a senior management team that is capable of making our vision a reality.
We are planning to build new products in the segments that we are already present, and will set up manufacturing facilities to address new geographies and expand the footprint to cover international markets. Our strategic initiatives are aimed at growing the top line to US$ 1 Billion by 2018, while graduating to be in the top three companies by market share in all segments of our business in India. We aim to be one of the most profitable companies in our industry, while we create a greener and safer work environment, and become one of the best workplaces in India.
I am confident that the creation of the strategic business units, the growing strength of our subsidiaries, our sound financial health, the capabilities of our management and technical team, and the support of all of you shareholders, will ensure that Pennar Industries growth story continues unhindered.
Thanking you,Nrupender Rao
ChairmanPennar Industries
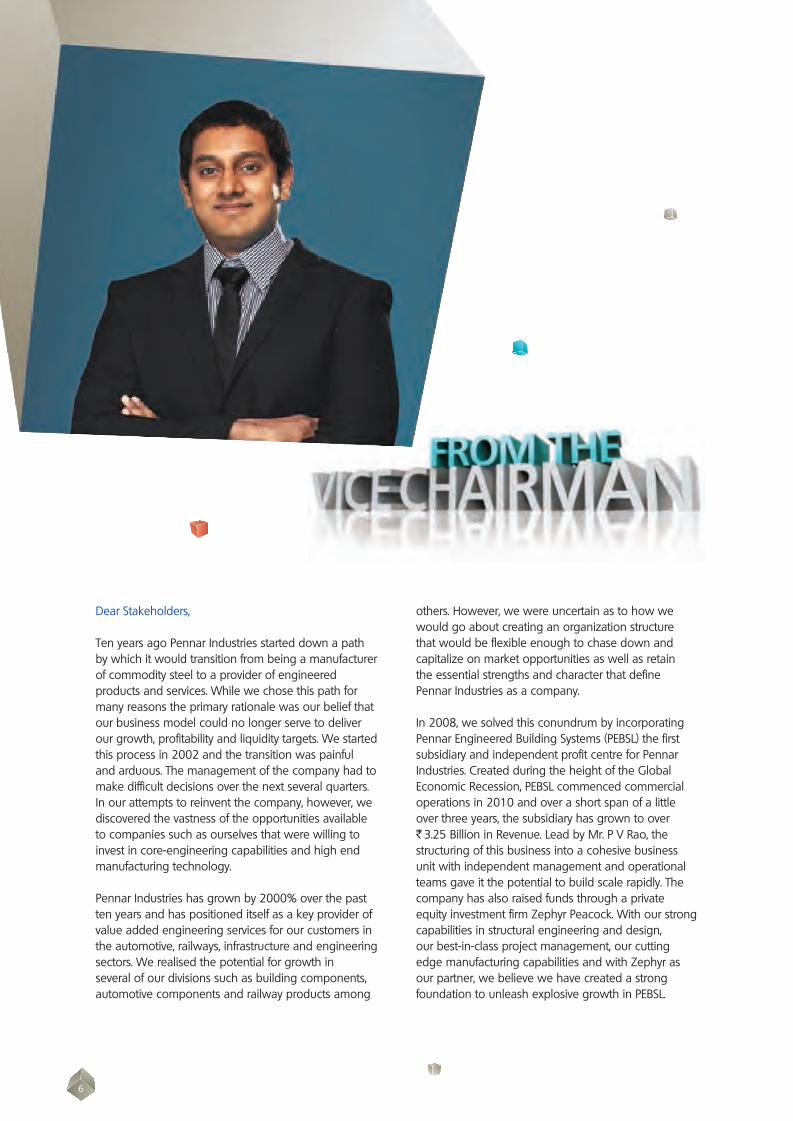
6
Dear Stakeholders,
Ten years ago Pennar Industries started down a path by which it would transition from being a manufacturer of commodity steel to a provider of engineered products and services. While we chose this path for many reasons the primary rationale was our belief that our business model could no longer serve to deliver our growth, profitability and liquidity targets. We started this process in 2002 and the transition was painful and arduous. The management of the company had to make difficult decisions over the next several quarters. In our attempts to reinvent the company, however, we discovered the vastness of the opportunities available to companies such as ourselves that were willing to invest in core-engineering capabilities and high end manufacturing technology.
Pennar Industries has grown by 2000% over the past ten years and has positioned itself as a key provider of value added engineering services for our customers in the automotive, railways, infrastructure and engineering sectors. We realised the potential for growth in several of our divisions such as building components, automotive components and railway products among
others. However, we were uncertain as to how we would go about creating an organization structure that would be flexible enough to chase down and capitalize on market opportunities as well as retain the essential strengths and character that define Pennar Industries as a company.
In 2008, we solved this conundrum by incorporating Pennar Engineered Building Systems (PEBSL) the first subsidiary and independent profit centre for Pennar Industries. Created during the height of the Global Economic Recession, PEBSL commenced commercial operations in 2010 and over a short span of a little over three years, the subsidiary has grown to over ` 3.25 Billion in Revenue. Lead by Mr. P V Rao, the structuring of this business into a cohesive business unit with independent management and operational teams gave it the potential to build scale rapidly. The company has also raised funds through a private equity investment firm Zephyr Peacock. With our strong capabilities in structural engineering and design, our best-in-class project management, our cutting edge manufacturing capabilities and with Zephyr as our partner, we believe we have created a strong foundation to unleash explosive growth in PEBSL.

7
In the financial year ended 2013, Pennar has created another subsidiary – Pennar Enviro (PEL). This subsidiary will look to capitalize on the massive opportunities in the water and waste water treatment and energy sectors. The company has a technical collaboration with Tech Universal of UK, which is one of the leading global players in the water treatment industry. Pennar Enviro’s CEO Mr. Shreepad Purkar is committed to delivering quick growth and intends to evolve the company into one of the major providers of solutions in the water treatment, environment and energy sectors.
The organization structure, engineering capabilities and human capital that has allowed us to transform ourselves and achieve ` 14 Billion in sales over 10 years will no longer serve us for what lies ahead. The transformation that we will have to go through over the next few years has precedent, in Pennar’s own transition ten years ago in far more difficult conditions from a commodity steel company to a value added engineered products manufacturer. There is also historical precedent in the work of Ludwig Wilhelm Erhard and the ‘Wirtschaftswunder’. Wirtschaftswunder literally translates to ‘Economic Wonder’ in English, which illustrates the impact of Erhard’s policies.
For almost a decade after World War II, the German economy was struggling on account of its indebtedness to the newly formed United Nations. As the Minister of Economics, Erhard was the key to the reforms that followed, championing tough decisions such as the institution of the Deutschmark, removal of restrictive economic trade practices and bringing balance to the German currency. Later elected as the Chancellor, he led the country’s coal and steel revolution that changed the economy forever and transforming Germany into the eminent industrial and technological powerhouse it is today.
Under our new CEO - Mr. Suhas Baxi, Pennar Industries has made strong beginnings over the past two quarters in remaking itself anew. We have made several strong additions to our senior management and engineering talent. The company has segregated itself into four operational SBUs viz. Steel Products, Tubes, Engineered Components and Project & Systems. We have also started evaluating opportunities in solar power, high rise steel buildings, standardized water treatment plants, hydraulic systems and warehousing solutions among others.
It is our hope that this restructuring - combined with a cohesive enhancement of our capabilities in design, engineering, manufacturing and project execution - will allow us to unleash another decade of rapid growth for Pennar Industries and its subsidiaries.
The financial year that ended in March 2013 has been one of the most challenging one we have faced in the recent past. We ended the year with de-growth in revenues, EBIDTA and net income as compared to the financial year ended March 2012. Our core segment in value added steel products have been under relentless margin pressure due to the emergence of leaner competitors with the advantages of a lower capital base and lower overhead costs. Our fixed costs have had to increase significantly in order to retain the talent we needed to service our customers. The slowdown in the infrastructure, automotive and railways sectors has had a disproportionate impact on operations at Pennar Industries with increases in operating costs, inflating working capital costs and operating cycles and delays in order book execution. The cumulative impact of these factors has been the reduction of our net profit to a level last seen in the financial year 2009.
In spite of these concerns, in a very challenging macro-economic environment, Pennar Industries along with its subsidiaries, is well poised to deliver growth, liquidity and profitability. The tremendous growth seen in the Solar (Systems & Projects), Tubes and PEBS divisions illustrates the potential for our business divisions to rapidly become self-sustaining profit centres.
We face the financial year 2014 with enthusiasm and we are confident that the aggressive targets we have set for ourselves are achievable. Together with the senior management team of Pennar Industries we will strive to ensure that the next few years herald the greatest chapter in the history of this company. I look forward to your support as we implement our plans.
Best,
Aditya RaoVice Chairman
Pennar Industries
8
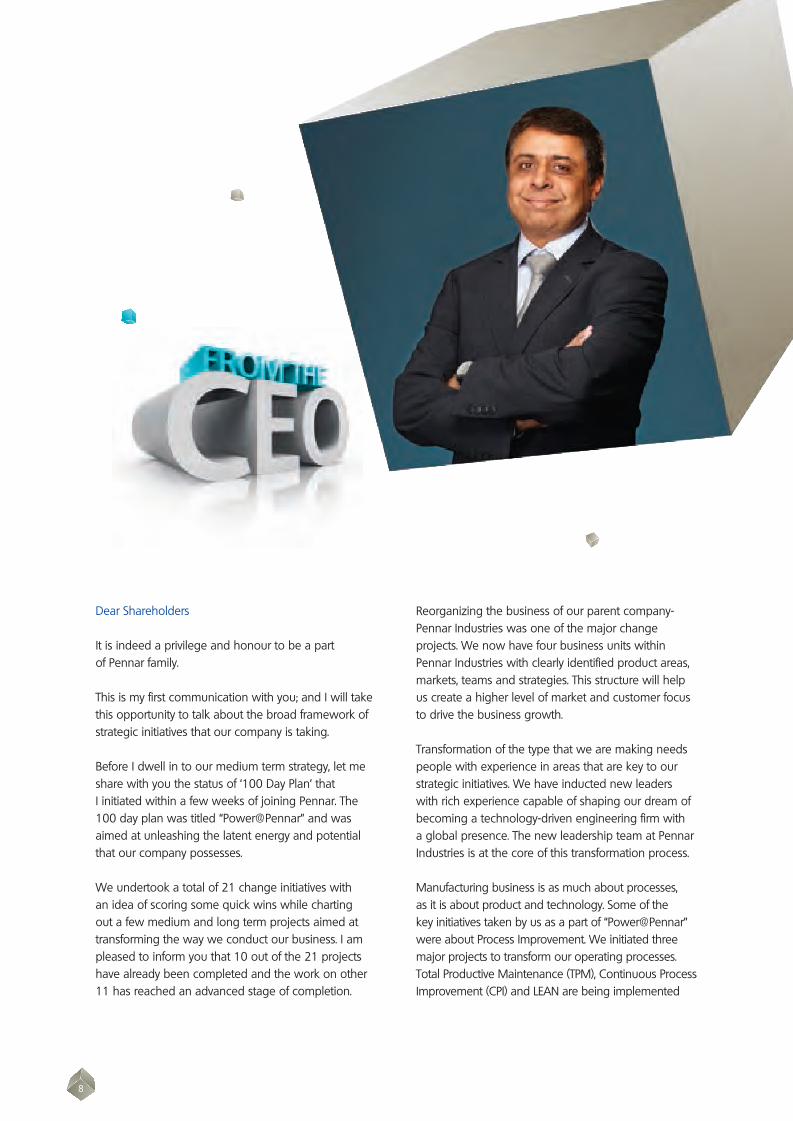
Dear Shareholders
It is indeed a privilege and honour to be a part of Pennar family.
This is my first communication with you; and I will take this opportunity to talk about the broad framework of strategic initiatives that our company is taking.
Before I dwell in to our medium term strategy, let me share with you the status of ‘100 Day Plan’ that I initiated within a few weeks of joining Pennar. The 100 day plan was titled “Power@Pennar” and was aimed at unleashing the latent energy and potential that our company possesses.
We undertook a total of 21 change initiatives with an idea of scoring some quick wins while charting out a few medium and long term projects aimed at transforming the way we conduct our business. I am pleased to inform you that 10 out of the 21 projects have already been completed and the work on other 11 has reached an advanced stage of completion.
Reorganizing the business of our parent company- Pennar Industries was one of the major change projects. We now have four business units within Pennar Industries with clearly identified product areas, markets, teams and strategies. This structure will help us create a higher level of market and customer focus to drive the business growth.
Transformation of the type that we are making needs people with experience in areas that are key to our strategic initiatives. We have inducted new leaders with rich experience capable of shaping our dream of becoming a technology-driven engineering firm with a global presence. The new leadership team at Pennar Industries is at the core of this transformation process.
Manufacturing business is as much about processes, as it is about product and technology. Some of the key initiatives taken by us as a part of “Power@Pennar” were about Process Improvement. We initiated three major projects to transform our operating processes. Total Productive Maintenance (TPM), Continuous Process Improvement (CPI) and LEAN are being implemented
9
in various parts of our business to ensure cost effective and customer focused processes. We have seen some early successes here; however all these initiatives are essentially a part of transforming Pennar in to a modern manufacturing company that can set standards for quality management and customer centricity.
Our medium term strategy for the company is thus based on the work initiated through “Power@Pennar” transformation initiative and the goals related to Growth, Market Share, ROCE; along with an aim to create an organization that is valued by the customers and employees alike. I would like to elaborate the four pillars of our mid-term strategy:
Global: Pennar Industries would like to generate 10% of its revenue through International operations within 3 year period. To give wings to this dream we have set up an International Business Cell that will focus on Asia and Africa as markets. Our International plan will be centred on exports as well as creating operations outside India. Simultaneously, the process improvement initiative that we have undertaken is also having clear milestones that will allow us to satisfy the needs of global customers in the area of quality and reliability.
Acquire: Pennar’s roadmap for becoming an engineering company will involve acquisition of technology, talent and businesses to supplement our current business. We will add businesses to our current portfolio so that we move up the value chain by adding technology driven products, services and solutions; provide a larger bouquet of related offerings to our existing customers and grow as a multi-product engineering company.
Triple: Pennar Industries is working on tripling the turnover of all our existing businesses over the next
five year span. This organic growth will be driven by New Product Development and Geographical Expansion. Application Engineering and Product Development teams have been strengthened and the four business units are targeting opportunities to expand in to Northern India where our presence is limited. We are also expanding our product portfolio in all the businesses and targeting 10% revenue growth through new products every year.
Excel: Business and Operational processes aimed at Customer Centricity Superior Quality and Optimum Cost are at the core of our strategic initiative titled “Excel @ the House of Pennar”. This house is being built with pillars signifying process excellence we aim to achieve. Along with TPM, CPI and LEAN; we have now added initiatives in the area of Learning & Development, Energy Efficiency and Environment/ Health & Safety. We are confident that these initiatives will help us create a globally competitive organization that is able to deliver and grow in some of the most competitive businesses.
Global, Acquire, Triple, Excel (GATE); at Pennar we are opening the GATE to move towards a potentially rewarding future. A GATE which will lead us to a higher level of stakeholder satisfaction.
Team Pennar is excited to begin this journey of transformation and growth.
Best,
Suhas BaxiCEO
Pennar Industries

10
As Pennar celebrates its Silver Jubilee in 2013, it is infused with energy and ready to transform itself. Transform, like the chrysalis into the butterfly, to take on the new challenges of the Indian and the global business environment and to keep growing. Innovate, from the building blocks of steel processing to the more sophisticated spaces of engineering and technology. Empower ourselves to move into new businesses and take on new projects. Use this TIE to bind our organisation with a new culture that is able to achieve this dream, like a butterfly, to take wing.
Our initiatives are being recognised. In February 2013, the Council of State Industrial Development and Investment Corporations of India conferred the prestigious “Outstanding Entrepreneur Award” on your Chairman. Earlier, the Hyderabad Management Association awarded him as “Entrepreneur of the Year”. He was also the recipient of IIT Kharagpur Alumnus award for the year 2011, which was
The TIE that Binds: Transforming, Innovating, Empowering
presented by the Hon’ble Prime Minister of India. He also received the “Nayudamma Gold Medal” for his contribution to Industrial Development in Andhra Pradesh. Pennar’s story is one of continuous innovation and consistent growth, evolving from a cold rolled steel products manufacturer into a multi-location, multi-product engineering group.
In our continuing endeavours to keep up with and outpace, market trends, we are now looking at adding new businesses, transforming our business processes and breaking our traditional geographical boundaries in the South of India to become a pan-India and a global entity. To lead this transformation, Pennar also has a new leadership team in place, led by the CEO Suhas Baxi and the SBU heads with the skills and experience we need.
And this is only the beginning.
11
Ten: save 10% in cost of operations year on year
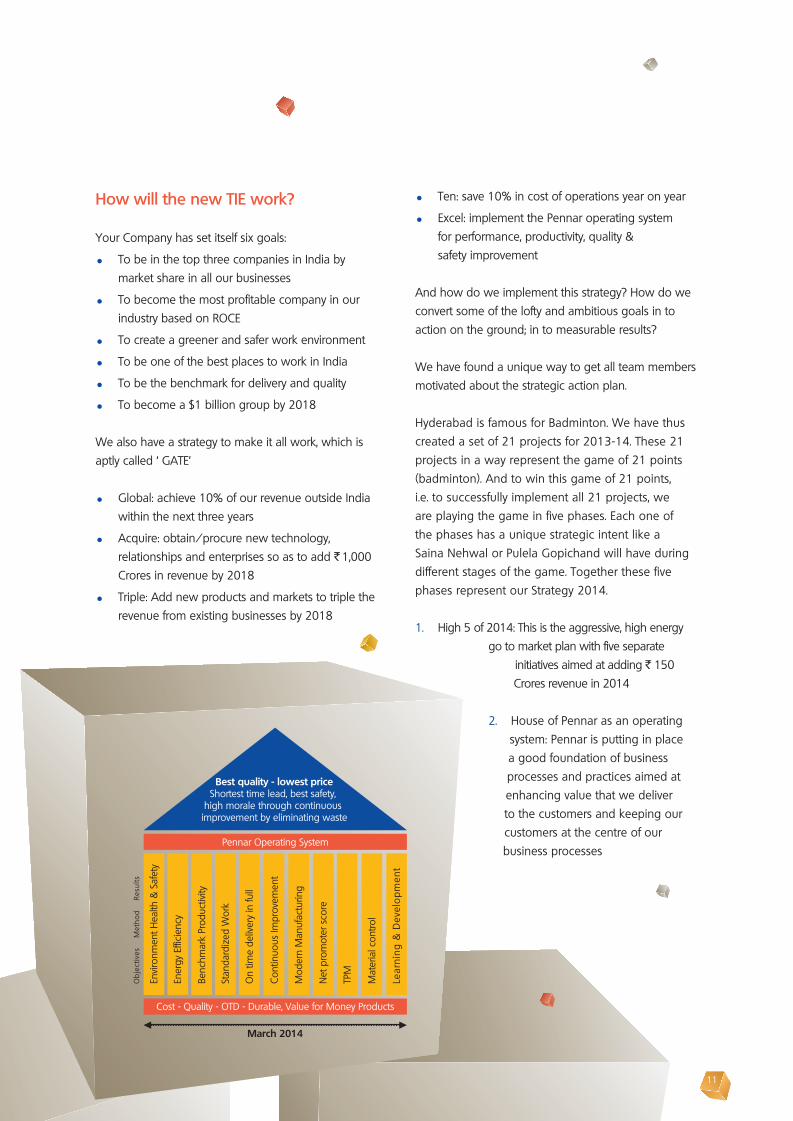
Excel: implement the Pennar operating system for performance, productivity, quality & safety improvement
And how do we implement this strategy? How do we convert some of the lofty and ambitious goals in to action on the ground; in to measurable results?
We have found a unique way to get all team members motivated about the strategic action plan.
Hyderabad is famous for Badminton. We have thus created a set of 21 projects for 2013-14. These 21 projects in a way represent the game of 21 points (badminton). And to win this game of 21 points, i.e. to successfully implement all 21 projects, we are playing the game in five phases. Each one of the phases has a unique strategic intent like a Saina Nehwal or Pulela Gopichand will have during different stages of the game. Together these five phases represent our Strategy 2014.
1. High 5 of 2014: This is the aggressive, high energy go to market plan with five separate
initiatives aimed at adding ` 150 Crores revenue in 2014
2. House of Pennar as an operating system: Pennar is putting in place a good foundation of business processes and practices aimed at enhancing value that we deliver to the customers and keeping our customers at the centre of our business processes
How will the new TIE work?
Your Company has set itself six goals:
To be in the top three companies in India by market share in all our businesses
To become the most profitable company in our industry based on ROCE
To create a greener and safer work environment
To be one of the best places to work in India
To be the benchmark for delivery and quality
To become a $1 billion group by 2018
We also have a strategy to make it all work, which is aptly called ‘ GATE’
Global: achieve 10% of our revenue outside India within the next three years
Acquire: obtain/procure new technology, relationships and enterprises so as to add ` 1,000 Crores in revenue by 2018
Triple: Add new products and markets to triple the revenue from existing businesses by 2018
Pennar Operating System
March 2014
Obj
ectiv
es
M
etho
d
Res
ults
Envir
onm
ent H
ealth
& S
afet
y
Ener
gy E
ffici
ency
Benc
hmar
k Pr
oduc
tivity
Stan
dard
ized
Wor
k
On
time
deliv
ery
in fu
ll
Cont
inuo
us Im
prov
emen
t
Mod
ern
Man
ufac
turin
g
Net
pro
mot
er s
core
TPM
Mat
eria
l con
trol
Lear
ning
& D
evel
opm
ent
Best quality - lowest priceShortest time lead, best safety,
high morale through continuous improvement by eliminating waste
Cost - Quality - OTD - Durable, Value for Money Products
12
3. Continental Plan: Pennar Industries will start operations in Asia and Africa.
4. Doubles Play: During the year 2014, Pennar Industries will add two new businesses, both aimed at moving up the value chain towards our stated goal of becoming a technology company.
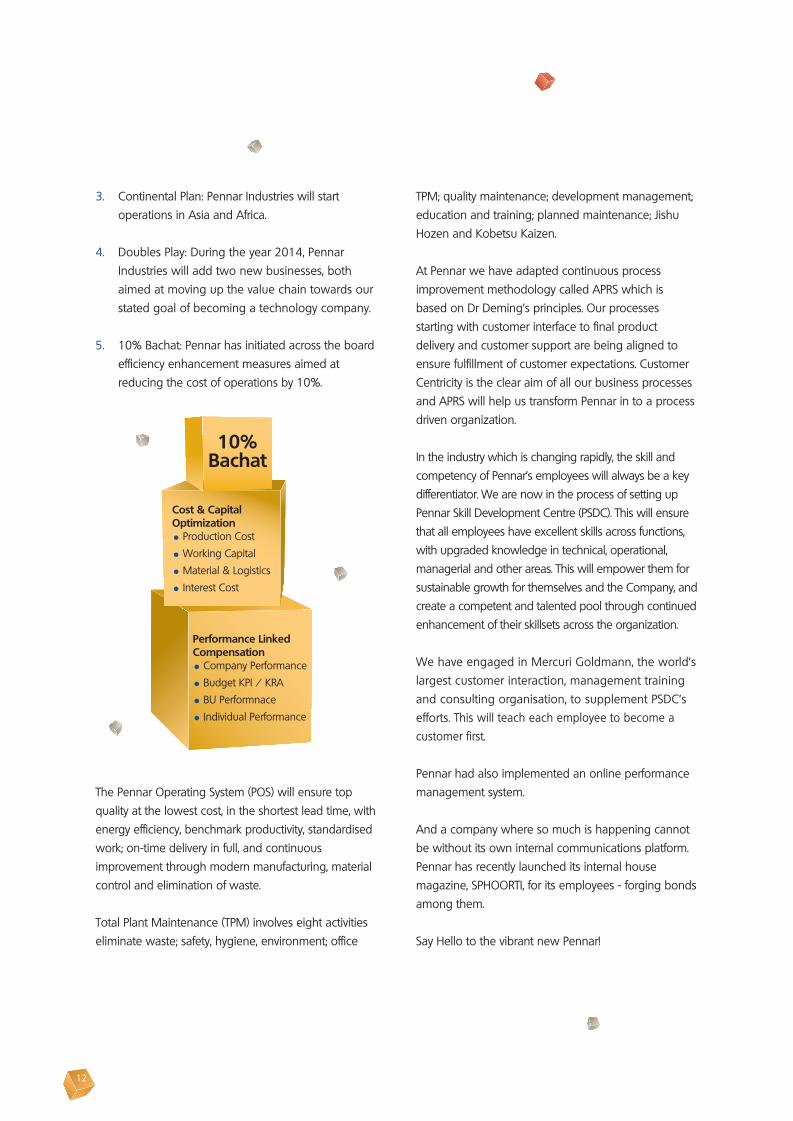
5. 10% Bachat: Pennar has initiated across the board efficiency enhancement measures aimed at
reducing the cost of operations by 10%.
The Pennar Operating System (POS) will ensure top quality at the lowest cost, in the shortest lead time, with energy efficiency, benchmark productivity, standardised work; on-time delivery in full, and continuous improvement through modern manufacturing, material control and elimination of waste.
Total Plant Maintenance (TPM) involves eight activities eliminate waste; safety, hygiene, environment; office
TPM; quality maintenance; development management; education and training; planned maintenance; Jishu Hozen and Kobetsu Kaizen.
At Pennar we have adapted continuous process improvement methodology called APRS which is based on Dr Deming’s principles. Our processes starting with customer interface to final product delivery and customer support are being aligned to ensure fulfillment of customer expectations. Customer Centricity is the clear aim of all our business processes and APRS will help us transform Pennar in to a process driven organization.
In the industry which is changing rapidly, the skill and competency of Pennar’s employees will always be a key differentiator. We are now in the process of setting up Pennar Skill Development Centre (PSDC). This will ensure that all employees have excellent skills across functions, with upgraded knowledge in technical, operational, managerial and other areas. This will empower them for sustainable growth for themselves and the Company, and create a competent and talented pool through continued enhancement of their skillsets across the organization.
We have engaged in Mercuri Goldmann, the world’s largest customer interaction, management training and consulting organisation, to supplement PSDC’s efforts. This will teach each employee to become a customer first.
Pennar had also implemented an online performance management system.
And a company where so much is happening cannot be without its own internal communications platform. Pennar has recently launched its internal house magazine, SPHOORTI, for its employees - forging bonds among them.
Say Hello to the vibrant new Pennar!
Cost & Capital Optimization
Production Cost
Working Capital
Material & Logistics
Interest Cost
10% Bachat
Performance Linked Compensation
Company Performance
Budget KPI / KRA
BU Performnace
Individual Performance
13
While the parent company PIL is undertaking growth and process improvement strategy, new bright stars like Pennar Engineered Building Systems (PEBS Pennar) have emerged in the Pennar Group. PEBS Pennar was set up as a subsidiary of Pennar Industries in 2009 with a state-of-the-art manufacturing facility at Sadashivpet near Hyderabad. It is into design, manufacture, supply and installation of pre-engineered steel buildings. The three-year-old company has already started taking giant strides which will take the Group to even greater heights as it gets into diversefied segments.
PEL, even younger, marks the renaissance of the old Pennar Chemical. It has an all-new mandate of providing EPC solutions and O&M services for Water and Waste Water Treatment Plants. These are growing
markets and the Company is in a great position to gain from them.
Environment
At Pennar, we are passionate about our responsibility towards our environment and community.
Being a responsible corporate citizen, we put safety, health and environment at the forefront of our activities.
Your Company conforms to all the norms with regard to water and air pollution. We have also put up a waste-water recycling plant to conserve water.
As a resposible corporate citizen, we have taken a number of social and environmental initiatives for the betterment of our community and the world at large.
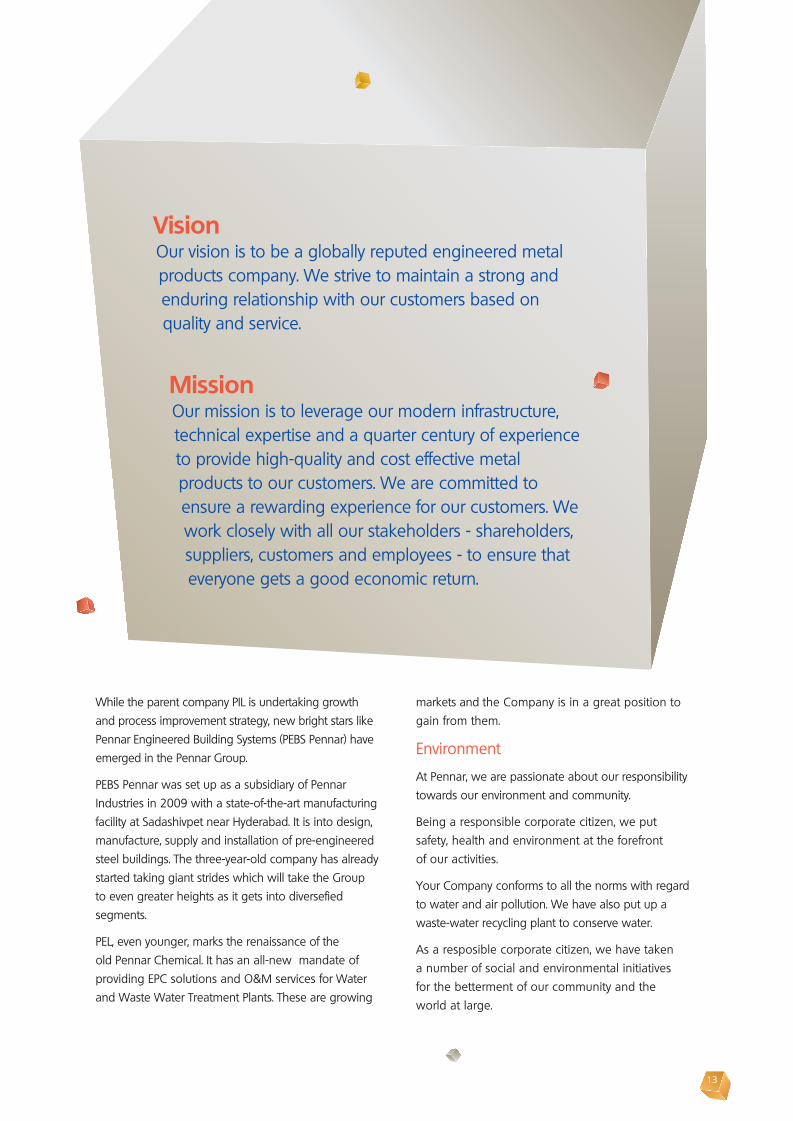
VisionOur vision is to be a globally reputed engineered metal products company. We strive to maintain a strong and enduring relationship with our customers based on quality and service.
MissionOur mission is to leverage our modern infrastructure,technical expertise and a quarter century of experience to provide high-quality and cost effective metal products to our customers. We are committed to ensure a rewarding experience for our customers. We work closely with all our stakeholders - shareholders, suppliers, customers and employees - to ensure that everyone gets a good economic return.

14
Mr. Nrupender Rao receiving FAPCII award for Best Allround Performance - Pennar Industries
Mr. P V Rao, MD, PEBSL, wins Manager of the Year award from Hyderabad Management Association

15
Our core principles of ‘reuse’, ‘recycle’ and ‘replenish’ are aimed at:
Pollution control
Minimising waste
Reduced effluent discharge
We are the best in maintaining employee and industrial relations. We have also given a helping hand to the neighbouring villages near our manufacturing locations.
Core Competencies
1 Professional Management Team: The Company has continued its focus on professional management and has created a very strong leadership team at the senior and mid management level to execute an ambitious plan.
2 Technology-driven: The Company is investing in technologies that will allow a natural progression from metal processing to other value added engineering streams.
3. Value-added products: The Company has increased the proportion of value-added products in its revenue mix from 50.8% in 2006-07 to 78% in 2012-13, resulting in a higher margin-accretive product mix and improved realisations.
4. Quality focus: The Company is committed to provide quality products to customers. All manufacturing units are ISO 9001:2008-certified, resulting in a high-quality discipline. The Tubes manufacturing plant has received TS 16949:2009 certification.
5. High-growth markets: The Company focuses on high-growth sectors of the Indian economy, such as infrastructure, railways, construction and automobiles, which the government has prioritised for increased investments.
6. Blue-chip clients: The Company has a blue-chip client roster, which includes TATA Motors, L&T, Ashok Leyland, ABB, Moser Baer, Schneider Electric, Tata BP Solar, among others. The building subsidiary developed prestigious customers like L&T, Ultratech Cement, Dr. Reddy’s Labs, My Home Group, Reliance Retail and others.
7. Diversified product mix: The Company’s portfolio comprises over 1,000 products, across diverse sectors like railways, automobiles, general engineering, building and construction among others, thus derisking the business.
8. People strengths: The Company has over 1,450 employees with a cumulative experience of over a million person-days, resulting in expertise in different fields.
9. Strong financials: The Company possesses a strong balance sheet with low gearing, providing it room for additional borrowing whenever needed.
10. Replacement cost: The Company’s replacement cost is estimated at ` 700 Crores, considerably higher than its gross block of ` 360 Crores, which is an adequate hedge against greenfield competition.
16
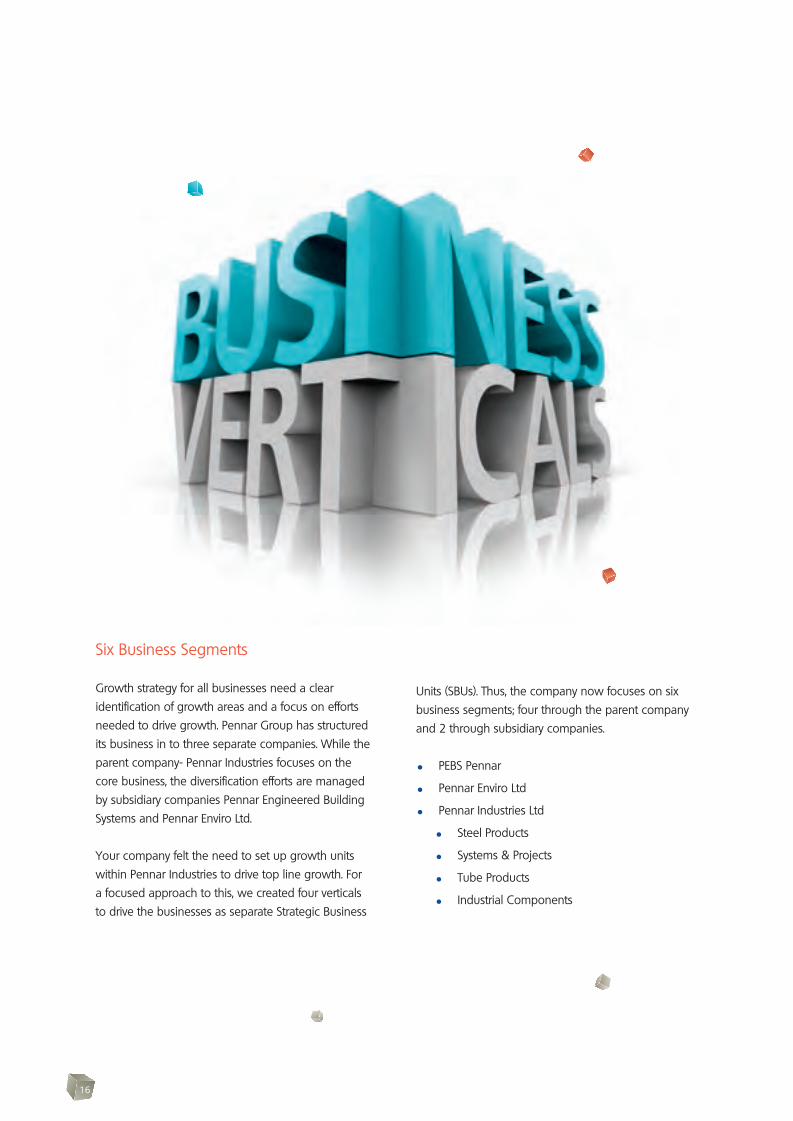
Six Business Segments
Growth strategy for all businesses need a clear identification of growth areas and a focus on efforts needed to drive growth. Pennar Group has structured its business in to three separate companies. While the parent company- Pennar Industries focuses on the core business, the diversification efforts are managed by subsidiary companies Pennar Engineered Building Systems and Pennar Enviro Ltd.
Your company felt the need to set up growth units within Pennar Industries to drive top line growth. For a focused approach to this, we created four verticals to drive the businesses as separate Strategic Business
Units (SBUs). Thus, the company now focuses on six business segments; four through the parent company and 2 through subsidiary companies.
PEBS Pennar
Pennar Enviro Ltd
Pennar Industries Ltd
Steel Products
Systems & Projects
Tube Products
Industrial Components
17
PEBS Pennar (Pennar Engineered Building Systems Ltd.)
Pennar Engineered Building Systems Limited, a subsidiary of Pennar Industries Limied, provides design, manufacture, supply and installation of custom designed metal buildings, building components and structural steel. PEBSL also provides structural EPC solutions for Solar power plants. The services provided by the company find diversified applications such as Factory buildings Warehouses, Power plants, Commercial centres, High-rise buildings, Aircraft hangars, Defence installations, Sports stadia, Industrial racking systems, Cold-form structures for school building low cost housing etc.
The company has a 29,000 sq. m, world-class manufacturing facility on a 33 acres plot near Hyderabad with a total production capacity after expansion to 90,000 MT per annum. This is one of the best plants in India, with modern technology and high-precision equipment sourced from leading suppliers across the world. The factory received the prestigious “GOLD RATING” from the INDIAN GREEN BUILDING COUNCIL (IGBC) by incorporating several sustainable features like Solar PV system, Sewage Treatment Plant, energy efficient designs for the building, drought tolerant species for landscaping among many others, thus becoming the first manufacturing facility in the country to receive this honour. The success so achieved helps the company propagate the Green Building paradigm by suggesting several parameters on which certification can be availed and thus becoming a pioneer in the Green Building movement.
The company has technical association with NCI Group of USA for 100% leak proof Double Lok® roofing system.
The company provides solutions under two product segments PRIME BUILD and VALUE BUILD. PRIME BUILD offers Double Lok® roofing system with a 10 year warranty and VALUE BUILD focuses on standard and economical options.
Business highlights
Revenue(` Crores)
EBITDA(` Crores)
Margins(%)
FY13 287 35.5 12.4%
The company has registered profits from the very first year of its operations. Today the company can claim to be in the top four in India in the pre-engineered buildings segment. This year it has achieved annual sales of ` 325.8 Crores, with a 16.7% growth.
Achievements
PEBS Pennar started commercial production in January 2010 and since then the company has grown in strength. PEBS Pennar has worked with several major Fortune 500 companies. These customers are geographically and sectorally diverse. Several customers are the leaders in the fields of Pharmaceuticals, Cement, Engineering, Power, Textile, Automotive, Electrical & Electronics, Logistics and Retail. Some of the prominent clientele that the Company have worked with include UltraTech Cement Ltd. L&T, HCC, P&G, Godrej, Dr. Reddy’s Laboratories, ABB, JSW, Schneider Electric, Reliance Retail, ACC, IOT Infrastructure & Energy Services Ltd, Schindler, Volvo and several others.
Landmark Projects
PEBS Pennar has a strong engineering team which has designed some landmark projects. PEBS Pennar has the distinction of being the first company in India to execute a 99m clear span building for UltraTech Cement Ltd.
The Company is currently executing ONGC OPAL’s warehouse building for IOT Infrastructure & Energy Services Ltd. It is approximately 1 km long, the longest building by a PEB company in India, within area of 1,32,000 sq. m.
A seven-storied building for Bharat Biotech near Hyderabad is also another land mark achievement.

18
National Distribution Center for Reliance Retail, Pune, Maharashtra
Manufacturing Facility forSchneider Electric,
Bangalore, Karnataka
National Distribution Center for Reliance Retail, Pune, Maharashtra
Manufacturing Facility forSchneider Electric,
Bangalore, Karnataka
99m Clear Span Building for UltraTech Cement Ltd.,
Kotputli, Rajasthan
19
in North India to further augment its capabilities and local presence.
PEBS Pennar has diversified into new segments such as Cold Form Structures and Structural Steel. The Company also has a Solar division which offers Structural EPC solutions for Solar power plants. The division provides design, manufacture, supply and installation services for Solar. In the Solar segment the services offered are Fixed Structures, Tracking Systems, Rooftops, Canal Tops, Solar Car Parks. The Company also has plans to provide end to end solutions for customers who are interested in Green Building Certifications.
Growth Strategy
The Company wants to build on the excellent performance over the past few years so as to become the leader in the industry. Apart from its prime focus on pre-engineered buildings market the Company also works on exploring new markets and new product avenues. The Company plans to expand to international markets and will be setting up Sales offices in East Africa and Middle East. Focus will be on new segments like structural steel, multi-storied buildings, industrial racking systems and space frames. By 2015, the Company also plans to set up a components manufacturing unit in East Africa.
Also Zephyr Peacock, a global private equity firm, has acquired a significant minority stake in Pennar Engineered Building Systems Ltd (PEBSL) at a premium with an investment of ` 50 Crores. Zephyr’s investment will help PEBS Pennar target ` 1000 Crores in sales in the next three years, a CAGR of over 40%. PEBSL proposes to achieve this through its aggressive growth plans in international emerging markets, solar, infrastructure, high rise commercial buildings and cold form building systems.
PEBS Pennar has also bagged the order from L&T for Hyderabad Metro for a wagon workshop.
Other major projects include a building for LNV Technologies that has two 100 MT cranes running in tandem, Reliance Retail’s National Distribution Centre with an area of about 4 lakh sft, a multi-storied, ground +10, building for Jayabheri Properties Pvt. Ltd. in Hyderabad. The Company has also executed structural steel projects for Toyota, HCC, Asian Colour Coated Ispat Ltd. and UltraTech Cement Ltd.
Ongoing Projects
A factory building for Schindler in Pune: the total area is 25,435 sq.m.
A limestone and additive storage building for UltraTech: Rajshree Cements at Malked Village, Gulbarga District, Karnataka. The total area of the building is 45,000 sq.m.
An additive storage building for UltraTech: Vikram Cements, near Neemuch, Madhya Pradesh. The total area of the building is 11,500 sq.m.
A limestone storage building for UltraTech: White Cement near Gothan, Jodhpur District, Rajasthan. Area: 25,000 sq.m.
Structural EPC projects in Solar for a total of 15 MW in AP and 2 MW in Rajasthan
Core Competencies and Competitive Advantage
PEBS Pennar’s edge lies in its exceptional engineering design capabilities. The Company intends to grow this capability further into competitive advantage with automated engineering, and energy-efficient buildings. The Company intends to set up a manufacturing plant

20
21
Pennar Enviro Limited (PEL)
Pennar Enviro Limited, a subsidiary of Pennar Industries Limited, operates in the field of Fuel Additives, Water Treatment Chemicals and EPC services for Water Treatment Projects. The Company has been operating in the field of Fuel Additives and Water Treatment Chemicals for more than 15 years. The Company has obtained technical knowhow from Total of France for the manufacture of fuel additives.
The water treatment sector in India offers huge opportunities in industrial and municipal water and waste-water treatment. Currently the total size of the water treatment market in India is estimated to be around Rs. 20,000 Crores.
Today the portfolio of Pennar Enviro Limited (PEL) includes the following:
Additives: The manufacture and sale of Liquid Fuel Additives, Coal & Solid Fuel Additives and a range of water treatment chemicals for pre-treatment, cooling tower applications, boiler applications and for UF/RO plants
Standard Plants: The design and manufacture of standardized packaged water treatment plants.
Turnkey Water Treatment Plants: The engineering and commissioning of turnkey water and waste water treatment plants.
PEL has a manufacturing unit in Hyderabad, for the manufacture of fuel additives and standardized plants.
Fuel Additives
PEL is a pioneer in the manufacture and supply of fuel additives with a technical collaboration with TOTAL. Fuel additives are used for a wide variety of industrial applications including the following:
Additives for Heavy Fuel Oils
Storage Stability Additive
Additive for Light oils
Additive for Solid Fuels
Other Products (Industrial and Agro Products)
Water Treatment Chemicals:
PEL has made a strong entry into the supply and treatment of water treatment chemicals. The Company possesses the knowhow to design and provide schemes for cooling water treatment, boiler water treatment, raw water and effluent treatment. The Company’s range of treatment chemicals include:
Cooling Water Treatment Chemicals
Boiler Water Treatment Chemicals
Raw Water and Effluent Treatment Chemicals
Chemicals for MF, UF & RO Plants
WTP / ETP / Standard Packaged Plants:
Modular packaged water treatment plants offer many advantages over conventional water treatment for smaller volume requirements. The pre-engineered modular components in packaged treatment plants, allow for significant efficiencies in time and cost. Pre-engineered modular components such as diffused air blowers, aeration tanks, sludge holding tanks, wastewater clarifiers, and disinfection units allow for the package wastewater treatment plants to be sized specifically for the customer’s application. They can be designed to handle a variety of influent flow rates and BOD loadings to meet discharge requirements. Our standard plants capabilities allow us to provide:
Fabricated structures / skids for UF/RO
Pressure Vessels & it’s internals (PSF/MGF/DM)
EPC + O&M of Clear & Waste Water Treatment Plants
PEL deals with Water & Environment Infrastructure business to provide turnkey solutions viz., Water Treatment Plants (WTPs), Sewage Treatments Plants (STPs), Effluent Treatment Plants (ETPs), Effluent recycling Plants (ERPs), Zero Liquid Discharge Plants (ZLDPs) among others. The Company uses various advanced & environmental friendly technologies in Industrial

22
23
and Municipal Segments besides Sea/Brackish Water Desalination and plans to enter into MSW and HWM Processing and Treatment Solutions using advanced and environmentally friendly technologies.
The segments we deal with are:
Municipal – Drinking Water and Sewage
Industrial – Oil & Gas, Power Generation, Cement, Chemicals, Steel, Sugar, Pulp & Paper, Breweries, Distilleries, Food Processing, Tanneries, Slaughterhouses, Beverage, Metal & Mineral Processing, Large Township & Retail outlets.
Container RO units
Container UF units
Container RO/UF/DM (EDI) units
Our Technology Collaboration
Tech Universal
PEL has signed a technology collaboration agreement with M/s. Tech Universal, UK on an exclusive basis. M/s. Tech Universal, UK is a 30 year old reputed EPC & technology provider, with 200+ major references on brackish/sea desalination, ETP & STP solutions to the tune of 100 MLD. Tech Universal specializes in the field of desalination water / sewage and industrial effluent treatment plant and has supplied many plants throughout Europe and the Middle East.
Total France
PEL has obtained the technology and knowhow to manufacture fuel additives from TOTAL. We are an authorized manufacturer of Elf fuel oil additives in collaboration with TOTAL, France (the fourth largest petroleum Company in the world). Total France is a global leader in the fuel additives and petroleum refining market.
Achievements
The net sales recorded a growth of 9% as compared to the previous year. The overall net sales of the Company has been growing by 10% for the past two years.
This growth was mainly due to the sale of solid fuel additives and water chemicals. As part of a strategic initiative, the Company entered into water EPC projects. We built a team of 50 plus engineers in business development, engineering, project management and other verticals.
Pennar Enviro has bagged orders from several reputed companies for Water Treatment projects. Some of the major clientele include L&T Metro Rail Project - Hyderabad, My Home Industries Limited, AGI Glaspac (an SBU of HSIL Limited), PARK CETP – Tamil Nadu and others.
Core Competencies and Competitive Advantage
Pennar Enviro Limited has the distinctive advantage in having an experienced and competitive team in place to cater to the Fuel Additives market and the booming EPC market in the Water segment. The Company’s manufacturing facility coupled with the expertise built upon through technical collaborations with global leaders like Tech Universal and Total France help in delivering superior quality products and services to our customers.
Growth Strategy
The Company intends to explore further growth through promoting the new product lines & EPC activity for clear and waste water. Future growth in the additives business is estimated to come from coal additives and water treatment chemicals segment. With new products and new areas both the chemicals are expected to grow @ 25% per year. PEL is developing three more derivatives for applications related to coal piles and coal feed in power plant applications.
PEL’s entry into new segments for Standard Packaged units and acquisition of new customers for Bio Toilet, Packaged RO units, Packaged Softener units and Packaged STP will be a significant growth driver. The Company will also focus on expanding its base in the water treatment EPC business, O&M – Clear / Waste water plants and OEM spares business.

24

25
Pennar Industries Limited
Steel Products
The Steel Products SBU consists of Cold Rolled Steel Strips(CRSS) which includes special steels, Cold Rolled Formed Sections (CRFS) used for building products, infrastructure and auto profiles, road safety systems and sheet piles. Currently, this is the largest SBU in terms of revenues (50%) and operates from four plants.
The Steel Products SBU services some of the major customers in the industry such as Lloyds Insulation Ltd, Alstom Projects India Ltd, Lanco Infratech India Ltd., F L Smidth, Thermax, Johnson Lifts, Adani Power, VECV, L&T, Ashok Leyland and many others.
Business highlights
Revenue(` Crores)
EBITDA(` Crores)
Margins(%)
FY13 485.5 38.4 7.9%
Achievements
A major order for sheet piles for Delhi Metro
Metal crash barriers for 30 km length road in Vijayawada
Deck sheets for power projects
Core Competencies and Competitive Advantage
Cold rolling is a great strength for creating value-added products. Pennar was one of the first companies in the country to venture into narrow cold rolling. We were also the first to enter the profiles
business, and we are market leaders in terms of tonnage and variety of profiles.
The company is a one-stop shop for most customers for a variety of products as it has its own tool room to serve customers in the shortest lead time and an in-house engineering and design strength to create value for the customer. Over 100 loyal customers using our dedicated services for the past three decades is testimonial to this fact.
Growth Strategy
Steel Products is the most matured business. It has limited scope with the existing products, so there are plans to expand its portfolio by venturing into intricate profiles for elevators, door frames, roofing, special steels for auto applications, etc. The manufacturing units will also be strengthened with more equipment to gear up for the region’s demand. The regional sales force will be empowered to drive the respective units to achieve the goals of the SBU.
This SBU has projected a revenue of ` 603 Crores for the current year, which includes additional sales of ` 25 Crores from new markets.
By 2015, we will become a pan-India player. At present where we are predominantly present in Southern and Western markets, with footprints in Middle East and South East Asia and Africa. We will venture into the export markets for ESP electrodes and building/infrastructure products.
Steel Products Division has drawn a roadmap to reach ` 1,000 Crores by 2018.

26

27
Systems & Projects
Systems & Projects includes Pennar’s railways and Solar business. This SBU registered a drop in sales in the last quarter of 2012-13 because Indian Railways cut back on its volume offtake, primarily due to lower coach and wagon manufacturing plans announced by the Railway Board. The good news, however, is that EBIDTA margins were maintained. The Solar business maintained its growth trend.
Business highlights
Revenue(` Crores)
EBITDA(` Crores)
Margins(%)
FY13 190.7 25.2 13.2%
Achievements
The Solar business maintained its sales levels, in spite of stiff competition and stagnating opportunities. Currently we have a market share of about 35% in this business segment.
Systems & Projects would continue its focus on Solar mounting structures and railways products, both for coaches and wagons. The division has initiated strong marketing efforts to consolidate the market share it enjoys in both the segments.
Our main clients for Solar includes L&T, Tata Power Solar, Navalakha, Lanco Solar, ABB, Schneider Electric, Solarsis.
Our main clients for Railways include Integral Coach Factory, Chennai, Southern Railways, Texmaco, Besco.
Systems & Projects which is currently focussed in Andhra Pradesh, Tamil Nadu, West Bengal and Maharashtra, will have a pan India presence in 2013-14.
Core Competencies and Competitive Advantage
The cold roll formed profiles and fabricated structures that are used in the manufacture of railway wagons
have superior strength to weight ratio. For the new generation Stainlees Steel wagons, Pennar has developed and supplied various Stainless Steel sections with the required dimensions. For coaches Pennar has been supplying several sections including some heavy fabrication parts. Pennar has had the market share 35 % in Solar Module Mounting Structures. Apart from the policies under JNNSM, several states like Tamil Nadu, Rajasthan, UP and MP coming with respective policies that will add to the demand. Pennar has existing manufacturing locations in Tamil Nadu, Maharashtra and Andhra Pradesh, has active plans to expand in the North. This would mean there would be a strategic advantage for the company interms of service delivery. As the markets are maturing, Pennar is focussing on delivering some new age designs and technologies keeping in view the customers requirements.
Growth Strategy
The railways business is expected to gain new potential from wagons. Pennar will also focus on Stainless Steel coaches and Metro Rail segment.
The division aims for almost 30% growth in 2013-14 from new products and markets in Solar, Infrastructure and Warehousing. We have also started extending our geographical and segmental reach to acquire a higher market share in the existing businesses. The Solar business will focus extensively on enhancing its reach into new territories including Uttar Pradesh, Punjab and Kerala. Serious study and efforts are also on to enter the business of Solar structures with tracking systems. Aggressive efforts are on to standardise the Solar mounting structures to crunch the delivery lead times and offer speedy solutions to customers.
Warehousing solutions: Pennar has deep expertise in structural steel and pre-engineered buildings. As an extension of our product offering, we are entering the warehousing solutions space. Pennar will provide storage solutions that include Industrial racking and shelving systems, Mezzanine systems and Cantilever systems.

28
29
Tubes
The Tubes SBU manufactures four broad categories of products for various industrial segments. The products manufactured are of different shapes and dimensions. The standard products includes
Electric Resistance Welded (ERW) pipes
Cold Drawn Welded (CDW) tubes
Air Pre-heater (APH) tubes
Indian Boiler Regulations (IBR) tubes
The segments that the division caters to include Automobile, Power, Manufacturing, Structural and General Engineering and several others. We are present predominantly in Tamil Nadu, Karnataka and Maharashtra.
We serve several automobile companies directly or indirectly. Some of the major customers include Mahindra, VECV (Volvo-Eicher commercial vehicles), Hyundai , TVS , Tata Motors and Ashok Leyland.
In the power sector our products are used by several major players in the power sector like Thermax, BGR, Paharpur, Cethar, KCP, Airco Fin among others.
Our products are also used by the Cement plant equipment manufacturers, Sugar plant equipment manufacturers, etc.
Business highlights
Revenue(` Crores)
EBITDA(` Crores)
Margins(%)
FY13 99.2 7.2 7.3%
Achievements
The Tubes’ Divisions current market share is 4% in ERW and 2% in CDW. Overall business grew by 67% as compared with 2012
During 2012-13, the plant started utilising 80% of the capacity; got TS 16949: 2009 certification; and got approved to manufacture IBR products. We stabilised quality systems and developed a strong team of personnel who have rich industry experience.
Core Competencies and Competitive advantage
The two mills work to produce tubes of multiple dimensions. The auto controlled pollution free wet-process plants also have a bright annealing furnace.
Stringent quality systems are in place. A strong team of personnel who have rich industry experience are in place to take the business forward
Growth Strategy
Tubes’ Division aim is to achieve 8% of the ERW market and 5% of CDW market by 2014-15, from our present shares of 4% and 2%, respectively.
The Tubes SBU has substantial orders to keep the plant fully loaded over the next quarter. The majority of the demand is from Auto customers.
Two additional tube mills will be put up at Isnapur (A.P.) and Chennai to generate additional revenue.
In 2013-14, Tubes has targetted gross sales of Rs.150 Crores, which will be 27% higher than in 2012-13.
For CDW, the aim is to double the volume. The margins will also be better with high-grade, higher-thickness products.
The division also plans to get into more value added tubular products. It will take up in house processing of G.P coil as backward integration. The focus will be more on special grade ERW/CDW products covering high strength low alloy steel (HSLA), roll-over protection parts (ROPS) and hydraulic cylinders for earth-moving equipment
The strategy is to consolidated in the Western region and penetrate into newer regions like Kerala certain regions in Northern India. The other major strategy is to focus on export markets.
30
31
3,50,000
2011 2012 2013
3,00,000
2,50,000
2,00,000
5,00,000
4,50,000
4,00,000
1,50,000
1,00,000
5,0000
0.0 0.0%
0.2%
0.4%
0.6%
0.8%
1.0%
1.2%
1.4%
1.6%
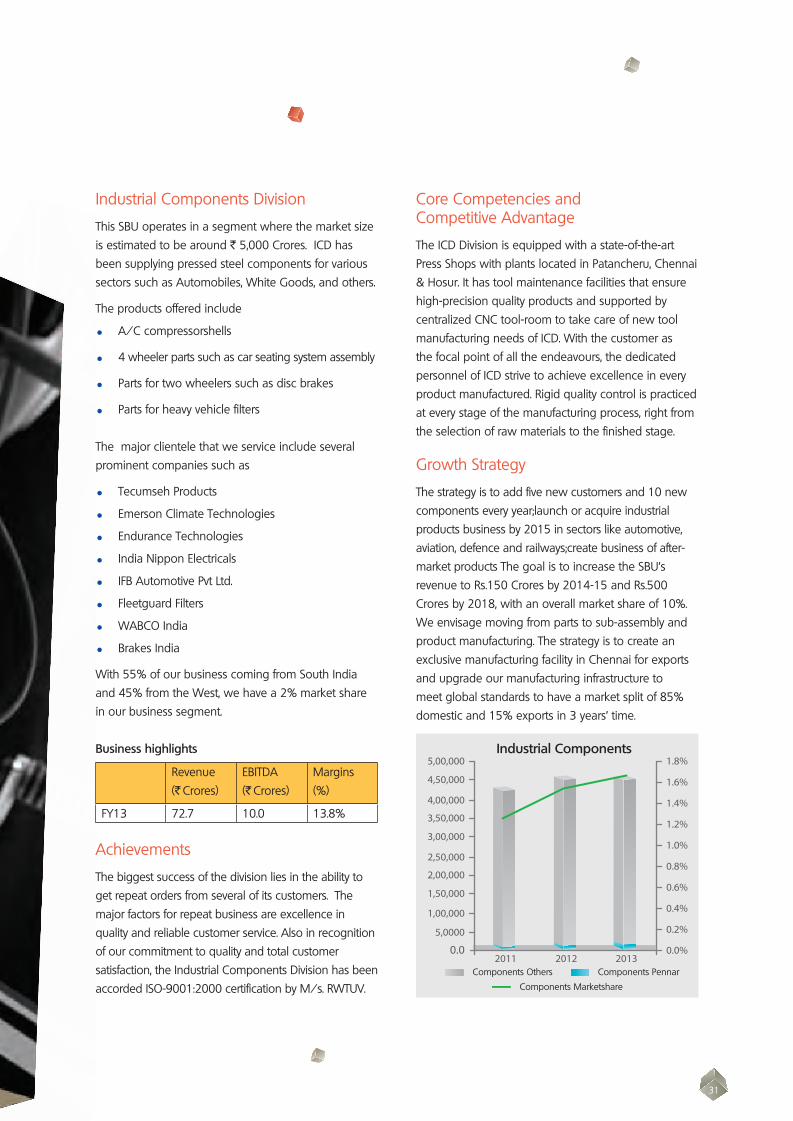
1.8%Industrial Components
Components Others Components Pennar
Components Marketshare
Industrial Components Division
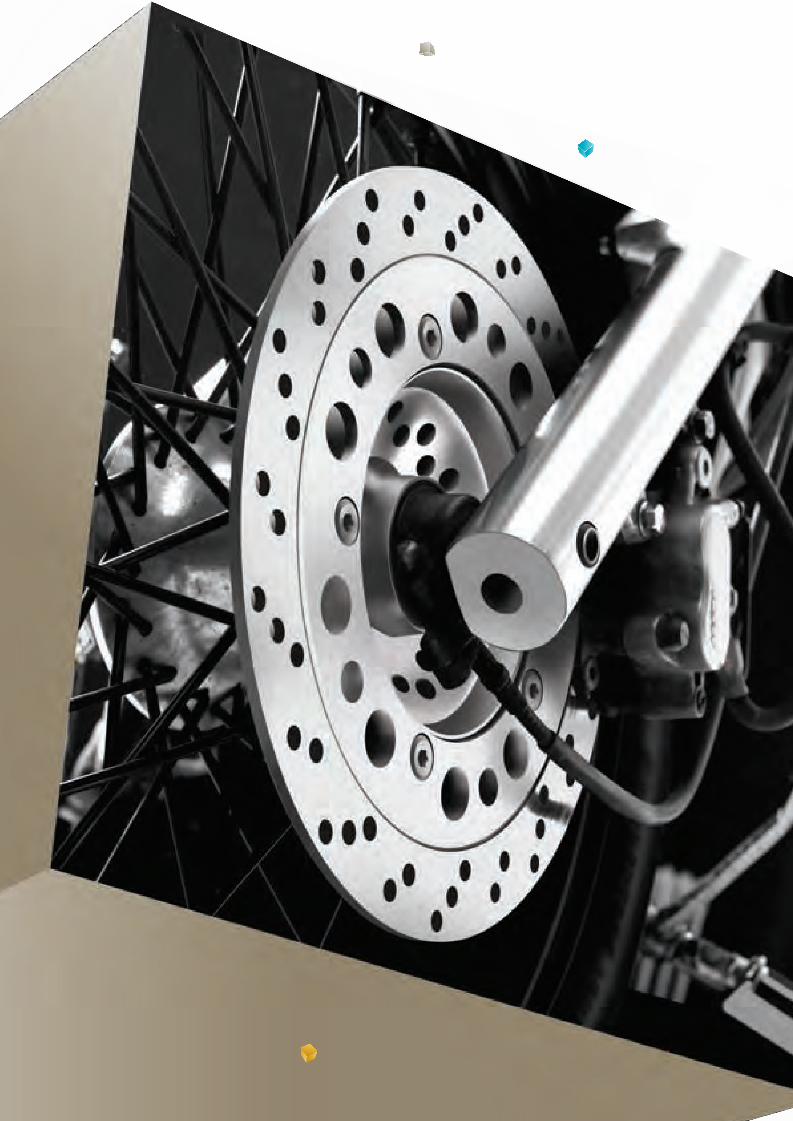
This SBU operates in a segment where the market size is estimated to be around ` 5,000 Crores. ICD has been supplying pressed steel components for various sectors such as Automobiles, White Goods, and others.
The products offered include
A/C compressorshells
4 wheeler parts such as car seating system assembly
Parts for two wheelers such as disc brakes
Parts for heavy vehicle filters The major clientele that we service include several prominent companies such as
Tecumseh Products
Emerson Climate Technologies
Endurance Technologies
India Nippon Electricals
IFB Automotive Pvt Ltd.
Fleetguard Filters
WABCO India
Brakes India
With 55% of our business coming from South India and 45% from the West, we have a 2% market share in our business segment.
Business highlights
Revenue(` Crores)
EBITDA(` Crores)
Margins(%)
FY13 72.7 10.0 13.8%
Achievements
The biggest success of the division lies in the ability to get repeat orders from several of its customers. The major factors for repeat business are excellence in quality and reliable customer service. Also in recognition of our commitment to quality and total customer satisfaction, the Industrial Components Division has been accorded ISO-9001:2000 certification by M/s. RWTUV.
Core Competencies and Competitive Advantage
The ICD Division is equipped with a state-of-the-art Press Shops with plants located in Patancheru, Chennai & Hosur. It has tool maintenance facilities that ensure high-precision quality products and supported by centralized CNC tool-room to take care of new tool manufacturing needs of ICD. With the customer as the focal point of all the endeavours, the dedicated personnel of ICD strive to achieve excellence in every product manufactured. Rigid quality control is practiced at every stage of the manufacturing process, right from the selection of raw materials to the finished stage.
Growth Strategy
The strategy is to add five new customers and 10 new components every year;launch or acquire industrial products business by 2015 in sectors like automotive, aviation, defence and railways;create business of after-market products The goal is to increase the SBU’s revenue to Rs.150 Crores by 2014-15 and Rs.500 Crores by 2018, with an overall market share of 10%. We envisage moving from parts to sub-assembly and product manufacturing. The strategy is to create an exclusive manufacturing facility in Chennai for exports and upgrade our manufacturing infrastructure to meet global standards to have a market split of 85% domestic and 15% exports in 3 years’ time.
32
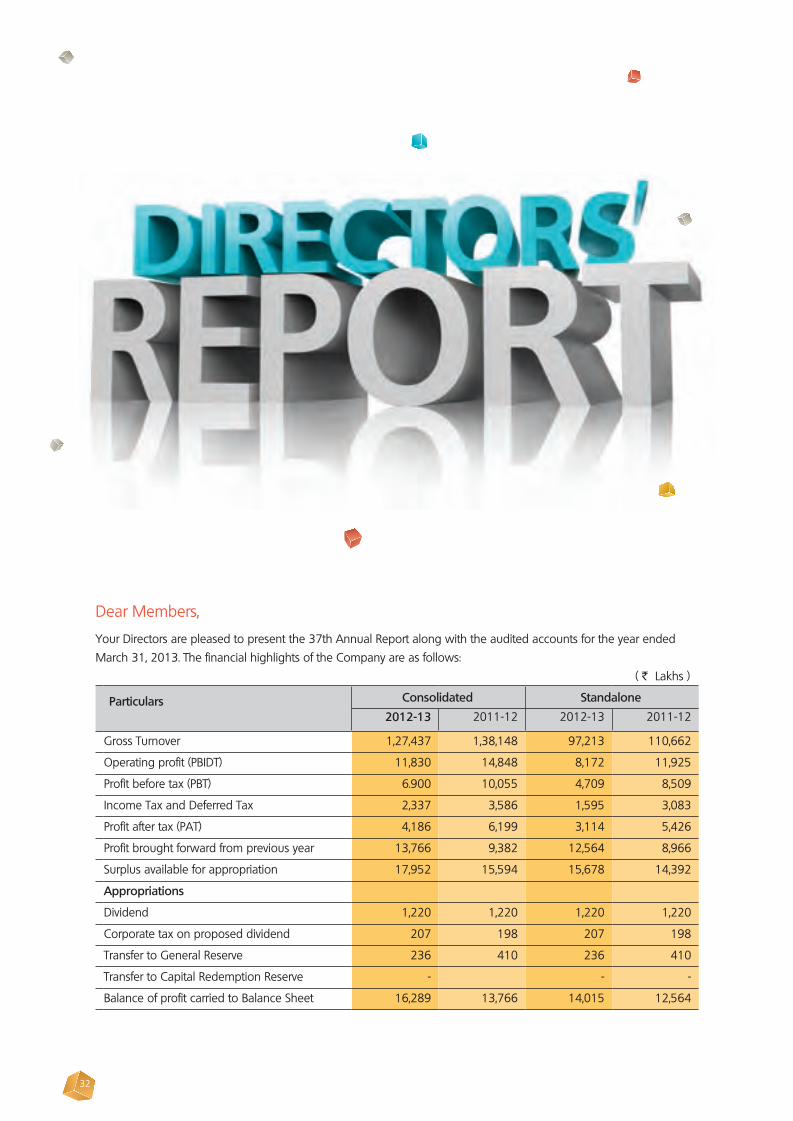
Dear Members,
Your Directors are pleased to present the 37th Annual Report along with the audited accounts for the year ended March 31, 2013. The financial highlights of the Company are as follows: ( ` Lakhs )
Particulars Consolidated Standalone
2012-13 2011-12 2012-13 2011-12
Gross Turnover 1,27,437 1,38,148 97,213 110,662
Operating profit (PBIDT) 11,830 14,848 8,172 11,925
Profit before tax (PBT) 6.900 10,055 4,709 8,509
Income Tax and Deferred Tax 2,337 3,586 1,595 3,083
Profit after tax (PAT) 4,186 6,199 3,114 5,426
Profit brought forward from previous year 13,766 9,382 12,564 8,966
Surplus available for appropriation 17,952 15,594 15,678 14,392
Appropriations
Dividend 1,220 1,220 1,220 1,220
Corporate tax on proposed dividend 207 198 207 198
Transfer to General Reserve 236 410 236 410
Transfer to Capital Redemption Reserve - - -
Balance of profit carried to Balance Sheet 16,289 13,766 14,015 12,564
33
Performance
The year under review witnessed reduced demand from customers due to slow down in Business verticals which the company services. Increase in sales of Tubes and solar power segment helped in offsetting the decline in Cold Rolled Steel Business. Profits were affected due to increase in input costs and reduced margin as a result of competition. Policy delays affected demand from infrastructure and capital goods sectors. The recovery in Automobile and Railway segments is awaited.
Subsidiary companies
Pennar Engineered Building Systems Limited (PEBSL)
Your Company’s subsidiary, Pennar Engineered Building Systems Limited (PEBSL), one of the leading providers of pre-engineering building solutions in India, recorded annual sales of ` 325.8 Crores representing a 16.7% growth compared with last year. PEBSL recorded an operating profit (PBIDT) of ` 35.5 Crores and a net profit of ` 14.4 Crores, representing a 22.8 % and 38.2 % growth, respectively as compared to last year. PEBSL continued to build a strong order book including significant repeat orders from existing customers which demonstrates the trust that the Company has built in the short period of time. Your company holds 74% stake in PEBSL. As at March 31, 2013, PEBSL had an order book of ` 230 Crores.
Pennar Enviro Limited (PEL)
Pennar Enviro Limited (PEL) became the subsidiary of Pennar Industries Limited with effect from November 30, 2012. Pennar Industries Limited holds 51% stake in Pennar Enviro limited. This investment is in line with the Company’s strategy of entering new areas of engineering services. Pennar Enviro Ltd is engaged in water and waste water treatment, Fuel Additives, Water treatment chemicals and Water treatment projects. PEL has a manufacturing unit at Mallapur in Hyderabad.
It produces Fuel Additives for industrial furnace fuels with a “know-how” provided by M/s. TOTAL, France, the fourth largest Oil/Gas Company in the World. PEL also has a technical collaboration with Tech Universal, which specialises in the field of desalinated water, sewage and industrial effluent treatment plants.
Consolidated Result
The consolidated financial statements presented by the Company include financial information of its subsidiaries prepared in compliance with applicable Accounting Standards. The Ministry of Corporate Affairs, Government of India vide its Circular No. 5/12/2007-CL-III dated 8th February, 2011 has granted general exemption under Section 212(8) of the Companies Act, 1956, from attaching the balance sheet, statement of profit and loss and other documents of the subsidiary companies to the balance sheet of the Company, provided certain conditions are fulfilled. Accordingly, annual accounts of the subsidiary companies Pennar Engineered Building Systems Limited and Pennar Enviro Limited and the related detailed information will be made available to the holding and subsidiary companies’ investors seeking such information at any point of time. The annual accounts of the subsidiary companies will also be kept for inspection by any investor at its Head Office in Hyderabad and that of the subsidiary companies concerned. Details of the subsidiaries of the Company are covered in this Annual Report.
Liquidity
The operating efficiencies and prudent working capital management by the company resulted in its maintaining a conservative debt profile with consolidated net debt of ` 122.52 Crores and a debt to equity ratio of 0.36 x and net debt to EBITDA ratio of 1.05 x as of March 31, 2013. Your Company continues to focus on generating strong cash flows to meet its future growth plans from internal accruals. The Company is comfortable with its current liquidity position and foreseeable funds requirement.
34
Listing of equity shares
The Company’s equity shares are listed at the Bombay Stock Exchange Limited, the National Stock Exchange of India Limited and MCX Stock Exchange Limited. The company has obtained listing approval from MCX Stock Exchange and the shares are listed from May 3, 2013.
Change of address of registered office of the Company
With effect from May 10, 2013, the address of the Registered Office of Pennar Industries Limited has been changed to Floor No. 3, DHFLVC Silicon Towers, Kondapur, Hyderabad-500084.
Dividend
Your Directors recommended a dividend of 20% i.e., ` 1 per equity share of ` 5 each. Directors have also recommended a dividend on cumulative redeemable preference shares of ` 5 each of the Company at a coupon rate of 0.01% p.a.
Secretarial Audit Report
As a measure of good Corporate Governance practice and as recommended by the Ministry of Corporate Affairs’ (MCA) Corporate Governance Voluntary Guidelines, 2009, the Board of Directors of the Company appointed Mr. S Chidambaram, Company Secretary in Practice, to conduct Secretarial Audit of records and documents of the Company.
The Secretarial Audit Report for the financial year ended March 31, 2013, is provided in the Annual Report.
The Secretarial Audit Report confirms that the Company has complied with all the applicable provisions of the Companies Act, 1956, Depositories Act, 1996, Listing Agreements with the Stock Exchanges, and SEBI guidelines/regulations on Insider Trading and Takeover Code.
Credit Rating
CARE has reaffirmed the ‘CARE A’ (Single A) rating assigned to the long term bank facilities of Pennar. This rating is applicable to facilities having tenure of more than one year. Instruments with ‘CARE A’ rating are considered to have adequate degree of safety regarding timely servicing of financial obligations. Further, CARE has also reaffirmed the ‘CARE A1’ (A One) rating assigned to the short term bank facilities. This rating is applicable to facilities having a tenure upto one year. Instruments with ‘CARE A1’ rating are considered to have very strong degree of safety regarding timely payment of financial obligations and carry lowest credit risk.
Directors
Mr. Varun Chawla a management graduate from Cornell University and having rich experience in Investment Banking, was inducted into the Board of Pennar Industries as an Additional Director with effect from November 9, 2012, and would hold office up to the conclusion of the ensuing Annual General Meeting. It is proposed to appoint Mr. Varun Chawla as the company’s Director.
Mr. C Parthasarathy, Mr Manish Sabharwal and Mr. J Ramu Rao retire by rotation at the ensuing Annual General Meeting and being eligible, offer themselves for re-appointment.
The Board of Directors of the Company at its meeting held on November 9, 2012, accepted the request of Mr. A. Krishna Rao to resign from the directorship of the Company. The board is thankful to Mr. A. Krishna Rao for his guidance and support to the company during his Directorship.
For perusal of the shareholders, a brief resume of the Directors being appointed/re-appointed along with other necessary particulars are given in the explanatory statement to the notice. The Board of Directors recommend their appointment/re-appointment.

35
Auditors
The Auditors, M/s Rambabu& Co., Chartered Accountants, retire at the ensuing Annual General Meeting and have confirmed their eligibility and willingness to accept the office, if re-appointed.
Cost Auditor
The Products classified as “Iron & Non-Alloy steel (Chapter 72) and Steel Products (chapter 73)” are subjected to Cost Audit in terms of Sec.233B of the Companies Act read with the Central Government Rules.
M/s.DZR & Co., Cost Accountants have been reappointed as the Cost Auditors for the year ending 31st March 2014 having been appointed for the FY 2011-12 & 2012-13.
The Cost Audit Report for the year ended 31st March 2012 was reviewed by the Audit Committee at their meeting held on 23rd July 2012 and has been filed on 31/01/2013 well within the due date of 28th February 2013.
The Cost Audit for the year ended 31st March 2013 is in progress and the Cost Audit Report will be filed within the stipulated time.
Directors’ Responsibility Statement
In terms of Section 217(2AA) of the Companies Act, 1956, the Directors would like to state that:
i. In the preparation of the annual accounts, the applicable accounting standards were followed.
ii. The Directors selected such accounting policies and applied them consistently and made judgments and estimates that were reasonable and prudent, so as to give a true and fair view of the Company’s state of affairs at the end of the financial year and of the profit or loss of the Company for 2012-13.
iii. The Directors took proper and sufficient care for maintaining adequate accounting records in accordance with the provisions of the Companies Act, 1956, for safeguarding the Company’s assets and for preventing and detecting fraud and other irregularities.
iv. The Directors prepared the Company’s annual accounts on a going concern basis.
Management Discussion and Analysis
The report on Management Discussion and Analysis forming part of Directors’ Report, is annexed.
Corporate Governance
A separate section on Corporate Governance with a detailed compliance report thereon is annexed and forms a part of the Annual Report. The Auditor’s Certificate in respect of compliance with the provisions concerning Corporate Governance, as required by Clause 49 of the Listing Agreement, is also annexed.
Public deposits
The Company has no amount outstanding towards public deposit as on March 31, 2013.
Key Developments
Mr. Suhas Baxi joined the company as President & CEO from December 2012. Mr. Baxi, aged 46, has a diverse experience of over 24 years in different industries and geographies including India, North America and Asia Pacific.
Corporate Social Responsibility
Your Company has been involved in the Corporate Social Responsibility (CSR) activity over the past few years. You will be happy to know that the company has supported education and sanitation in schools in villages near our factory. At Govt High School,
36
Ankanapalli Village, Sadashivpet. Pennar had provided water pipe line villages in the backward regions of the Andhra Pradesh State. Following are the activities undertaken at a few villages in the State
1. Protein supplement to a few Government schools for their Mid Day Meals to the students
2. Pension to old aged people and widows
3. Developmental works like sanitation works and construction of toilets in the Schools
4. Providing drinking water pipelines in the villages.
Conservation of energy, technology absorption and foreign exchange earnings and outgo
In accordance with the provisions of Section 217(1)(e) of the Companies Act, 1956, the required information relating to conservation of energy, technology absorption and foreign exchange earnings and outgo is annexed.
Awards and Recognitions
During the year under review, Mr. Nrupender Rao, Chairman, was conferred with the prestigious “Outstanding Entrepreneur Award” by the Council of State Industrial Development and Investment Corporations of India.
Particulars of Employees
The information required under Section 217(2A) read with Companies (Particulars of Employees) Rules, 1975, the names and other particulars of employees are to be set out in the Annexure to the Directors’ report. Having regard to the provisions of Section 219(1)(b)(iv) of the said Act, the Annual Report excluding the aforesaid information is being sent to all the members of the Company and others entitles thereto. Any member interested in obtaining such particulars may write to the Company Secretary for a copy.
Appreciation
Your directors take this opportunity to express their appreciation for the co-operation to all the suppliers, customers, distributors, sales channel and business partners who have been associated with the Company as partners of growth. The Directors would also like to take this opportunity to thank the financial institution, banks, regulatory and government authorities as well as the shareholders for their continued co-operation and support. The directors also wish to place on record their appreciation of the devoted and dedicated services rendered by all employees of the Company.
For and on behalf of the Board
Place: Hyderabad Nrupender RaoDate: 10th May 2013 Chairman
37
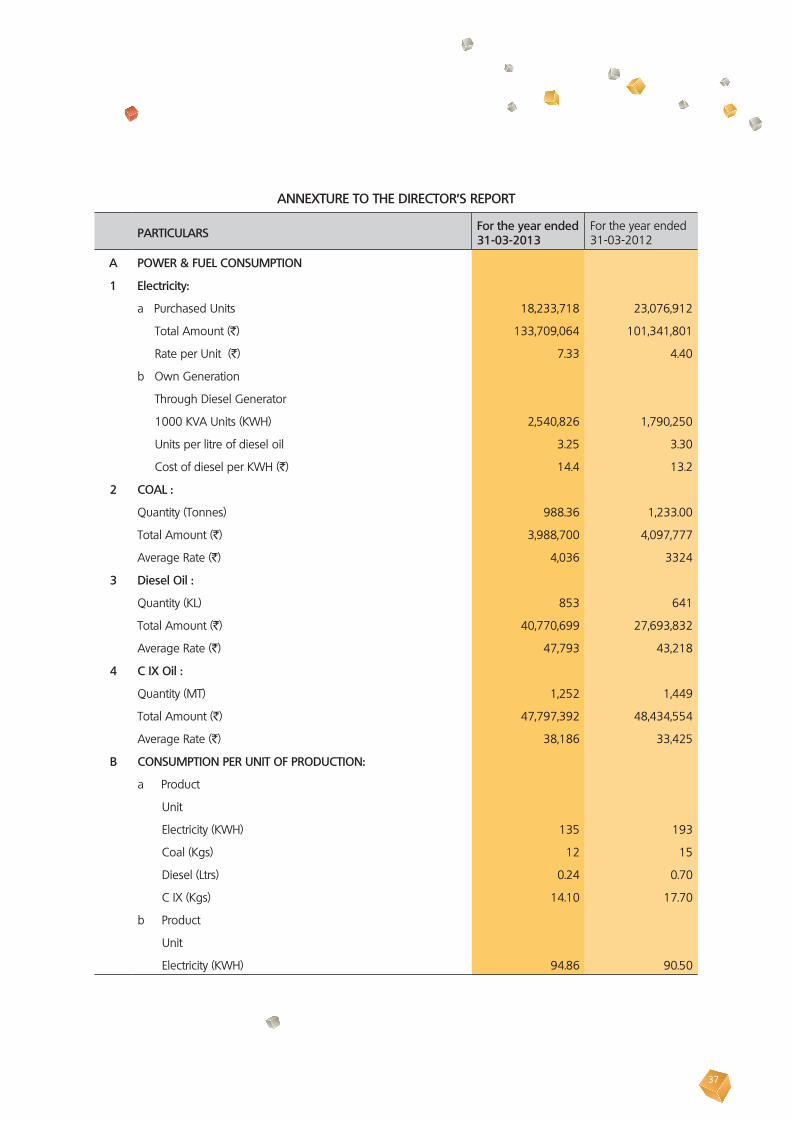
ANNEXTURE TO THE DIRECTOR’S REPORT
PARTICULARS For the year ended31-03-2013
For the year ended 31-03-2012
A POWER & FUEL CONSUMPTION
1 Electricity:
a Purchased Units 18,233,718 23,076,912
Total Amount (`) 133,709,064 101,341,801
Rate per Unit (`) 7.33 4.40
b Own Generation
Through Diesel Generator
1000 KVA Units (KWH) 2,540,826 1,790,250
Units per litre of diesel oil 3.25 3.30
Cost of diesel per KWH (`) 14.4 13.2
2 COAL :
Quantity (Tonnes) 988.36 1,233.00
Total Amount (`) 3,988,700 4,097,777
Average Rate (`) 4,036 3324
3 Diesel Oil :
Quantity (KL) 853 641
Total Amount (`) 40,770,699 27,693,832
Average Rate (`) 47,793 43,218
4 C IX Oil :
Quantity (MT) 1,252 1,449
Total Amount (`) 47,797,392 48,434,554
Average Rate (`) 38,186 33,425
B CONSUMPTION PER UNIT OF PRODUCTION:
a Product
Unit
Electricity (KWH) 135 193
Coal (Kgs) 12 15
Diesel (Ltrs) 0.24 0.70
C IX (Kgs) 14.10 17.70
b Product
Unit
Electricity (KWH) 94.86 90.50
38
Research and Development (R&D)
R&D initiatives will be crucial for the success for any company. Pennar also believes in this philosophy and thus through reaserch and development it aims to take up several activities that will optimise the cost, improve the the quality, customer satisfaction, safety and environment .
Some new initiatives were taken up during the financial year 2012-13 for creation of new and special grades of material for the following customer.
For IFB Industries, Bengaluru, special grades of 16mm CR5, C-15 and C-60 were developed.
For Venus Engineering, Enamel grade was developed. A total of 200 MT was supplied to the customer for this product.
For Daechung Auto QSTE 500 : HSLA grade trial samples have been supplied. The process of evaluation of the product is underway.
The following activities have been taken up for improving customer satisfaction.
The quality of Pickling process has been stabilised for the material that is being used by the Industrial Components Division CD (800 MT/month). The consumption of scratch bite has been been reduced to a great extent and there by ensuring the availability of machinery for other processes.
Anaar project was undertaken to improve the quality of material that was being supplied to LUK INDIA. The main purpose of the project was to improve the customer satisfaction levels.
New implementations such as 1S and 2S methodologies have been initiated in the Quality Assurance Lab.
The other initiatives have been the improvement in the packing quality for panels being supplied to Prabha. This process was initiated to reduce the damages during transit.
To improve the satisfaction levels of one of our major clients Eicher (VOLVO) for whom Chassis Component(VOLVO) is being delivered, paint process was stabilised to avoid the problem of paint peel off.
Several new equipments such as HYDRO TESTER AND NDT were installed at our manufacturing plant in Isnapur.
A new 60 MT UTM machine was added in ISNAPUR. The machine will be used by the Tubes Division.
The following business development activities have been carried out during the year.
A rain gutter profile was developed for Tata Marcopolo.
Flywheel cups have been developed for INEL
Car Door parts were delivered for IFB.
Disc Brake for Endurance were developed.
For Alf Engineering Tube Body Frame Parts were delivered.
Developed CDW applications for Automobiles.
Focus was on taking up new initiatives to create a cleaner and greener environment. Some of the new steps taken:
Setting up of Sewerage Treatment Plant at Chennai manufacturing unit has been initiated.
Oil Recovery Systems have been initiated at our manufacturing units in Patancheru and Isnapur.
New MEE systems were installed to treat rejects of RO plant and material with high TDS.
A new RO plant was established at the manufacturing unit in Isnapur. A similar unit has been established at Patancheru as part of Clean and Green programme.
New facilities at various manufacturing plants have been installed to improve the overall quality of production. Some of the major initiatives include:
New forming mills have been installed at manufacturing units in Tarapur, Chennai and Isnapur. These would be for precision components, light weight profiles for Solar and specialised Electro Static Precipitators.
A new 1010 KVA DG has been set up at Chennai for power security.
EOT Cranes in the manufacturing unit for CDW Tubes have been put up at Isnapur to improve the handling facility.
39
Installation of Auto Trimming machine for the Industrial Components Division to improvement of productivity and quality.
Installed 300 Ton Hydraulic press at Tarapur for manufacturing automobile panels.
Some concrete plans have been chalked out for our future products and solutions. Some of the initiatives that will be taken up in the immediate future are:
Developing Elevator profiles for all the major lift manufacturers.
Developing special grades of steel for Auto Applications.
Creating CDW Tubes that will find some special applications.
The auto parts for Alf will be developed from the manufacturing unit in Chennai.
New projects are already underway to cater to the new emerging concepts in the field of Solar. New age structures such as Screw piles are actively being provided as per customers specifications.
Single Axis tracking systems as a complete structural solution for the megawatt scale solar power plants will be provided this would be done keeping in tune with the customers requirements and developments in the Solar market.
Manufacturing of Solar Structures will also be localised at various manufacturing units so as to cater to the regional demand. This will also help in reducing the cost, increasing the speed of delivery and thus improving the overall customer satisfaction.
Warehousing solutions will be one of the new products and services that will be launched. Special racking and shelving solutions as a new product offering will be done this year. The target customers will be in the industrial, commercial, retail space through out the country also targeting the middle eastern markets and Africa.
Mezzanine and cantilever storage is the new offering being done this year to cater to the ever growing sectors of automobiles, automobile components, white goods, bulk drugs, ware housing companies.
Catering to a new class of vertical warehousing as the current conventional storage requires huge
floor space and land has become a premium in the country.
Keeping in tune with the market requirements of the railway market, development of SS 304 and other grades of Railway coach frames, side and top bodies will be taken up.
Modular toilet blocks for the icons of Indian Railways such as Rajadhani and Shatabdi trains will be taken up.
Development of engine front cones and motor bodies for the suburban trains, EMUs and DEMUs will be taken up for the Integral Coach Factory.
Increasing the capability and capacity of the existing manufacturing facility at Chennai to cater to the ever increasing demand from the Railway coach & wagon factories in the country.
A full-fledged Engineering & design team at Hyderabad and Chennai is being put in place.
A dedicated team of new product development is being put in place in Hyderabad and Chennai to cater to the ever growing demand for new products and support the different business units to augment market share and increasing the present offering to the customers.
A dedicated team of design & engineering professionals being put in place in Hyderabad to standardise and augment the present processes and product portfolio. The responsibilities of the team will include:
To bring in new technologies and add new offerings to the existing portfolio.
To bring in new manufacturing capability and improve the product offering.
A new business team in place at Hyderabad to look at various acquisitions, additional business which in turn increases the turnover and better bottom and top line.
Development of ESP (Electro Static Precipitator) technology as power industry is going through a boom and which will bring in substantial revenues.
Development of new businesses to cater to the construction & mining industry like batching, screening, concrete mixing plants and high capacity conveyor systems for the mining industry.

40
1. Industry overview, Opportunities and Outlook
The global economic scenario in the recent past has been witnessing some mixed trends. Though the developed economies have shown signs of regaining the momentum, some members of the EU are still facing the heat of the downturn. While the economists are still debating to choose between austerity and public spending, the global economic growth rate has dipped to 2.5 % in 2012. It is expected that the growth rate of the world economy will hold steady at 2.6% in 2013, but one must say that there is some distance to travel before the growth stories become certain.
The Indian economic scenario was no different from the global outlook. The growth rate of GDP in the last quarter of FY13 was 4.8% and the entire year stood at 5.0%. Several factors such as policy inaction, fiscal deficit, inflationary pressures, depreciating rupee value, tight monetary and fiscal policy among others have affected the overall growth prospects. The key input sectors in the economy have been underperforming for some time now. A decline in mining output in the past two years has adversely affected power generation, which in turn is impacting other sectors of the economy. In 2012-13,
manufacturing output grew by merely 1 per cent, on the back of a mild 4.4 per cent growth in 2011-12. Slowing private consumption growth and weak exports too hurt the manufacturing sector. The non-performance of manufacturing sector over the last few years has resulted in the dwindling of its share in the total GDP. For FY13 the manufacturing sector was 15.2 % of the total GDP whereas in FY 2012 it was 15.7 %.
Moreover, prices of most of these inputs continue to rise, driving up input costs for various industries. When inputs are scarce and costly, the rate of return on investment falls, deterring the private sector to undertake new investment. In 2012-13, fixed investment growth slowed to 1.7 per cent from 4.4 per cent in the previous year. A key factor so far has been a loss of confidence in the government’s ability to invest in infrastructure and enact necessary institutional reforms. In addition, the government’s reliance on domestic funds to finance its large budget deficit has raised the cost of borrowing for firms, crowding out private investment. This definitely calls for immediate measures to drive up the investment sentiment.
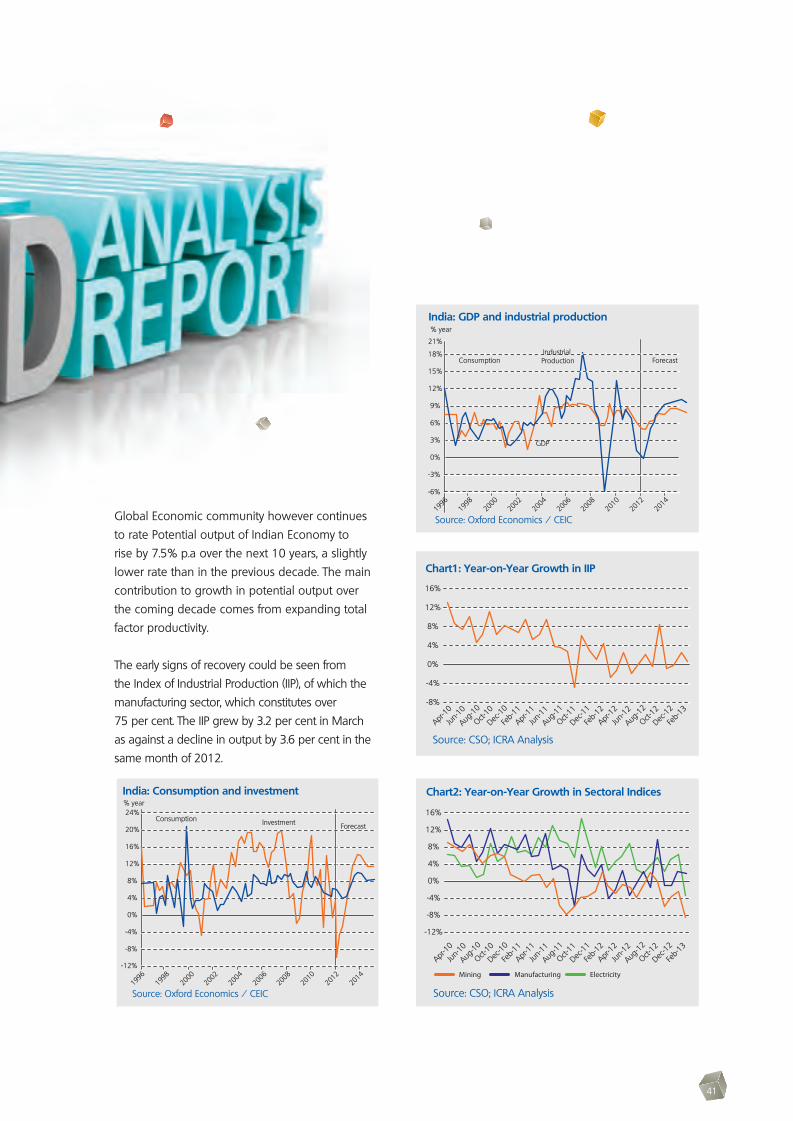
41
Chart1: Year-on-Year Growth in IIP
16%
12%
8%
4%
0%
-4%
-8%
Apr-10
Jun-10
Aug-10
Oct-10
Dec-10
Feb-1
1
Apr-11
Jun-11
Aug-11
Oct-11
Dec-11
Feb-1
2
Apr-12
Jun-12
Aug-12
Oct-12
Dec-12
Feb-1
3
Source: CSO; ICRA Analysis
Chart2: Year-on-Year Growth in Sectoral Indices
16%
12%
8%
4%
0%
-4%
-8%
-12%
Apr-10
Jun-10
Aug-10
Oct-10
Dec-10
Feb-1
1
Apr-11
Jun-11
Aug-11
Oct-11
Dec-11
Feb-1
2
Apr-12
Jun-12
Aug-12
Oct-12
Dec-12
Feb-1
3
Source: CSO; ICRA Analysis
Mining Manufacturing Electricity
India: Consumption and investment
16%
12%
8%
24%
20%
4%
0%
-4%
-8%
-12%
1996
1998
2000
2002
2004
2006
2008
2010
2012
2014
Source: Oxford Economics / CEIC
% year
Consumption Investment Forecast
India: GDP and industrial production
12%
9%
6%
18%
21%
15%
3%
0%
-3%
-6%
1996
1998
2000
2002
2004
2006
2008
2010
2012
2014
Source: Oxford Economics / CEIC
% year
ConsumptionIndustrial Production
GDP
Forecast
Global Economic community however continues to rate Potential output of Indian Economy to rise by 7.5% p.a over the next 10 years, a slightly lower rate than in the previous decade. The main contribution to growth in potential output over the coming decade comes from expanding total factor productivity.
The early signs of recovery could be seen from the Index of Industrial Production (IIP), of which the manufacturing sector, which constitutes over 75 per cent. The IIP grew by 3.2 per cent in March as against a decline in output by 3.6 per cent in the same month of 2012.
42
2. Pennar’s Key Market Segments
For Pennar, the performance of economy has always been a guiding parameter. Traditionally it has been catering to the several sub sectors such as automobile, power, cement, steel, transport and several other infrastructure segments.
Pennar shares an active interest in the Indian automotive industry. The Indian automobile industry which manufactures over 1.1 Crores of vehicles and exports about 15 lakhs each year has been called as a ‘sunrise sector’ in the Indian economy. The commercial vehicles and three-wheelers share about 9% between them. But the Indian automobiles industry witnessed a moderation in demand in 2012, after the double-digit growth in sales recorded in the preceding three years. The way forward seems to be that the Indian small and light commercial vehicle segment is expected to more than double by 2015-16 and grow at 18.5 per cent compound annual growth rate (CAGR) for the next five years, according to a report titled, ‘Strategic Assessment of Small and Light Commercial Vehicles Market in India’ by Frost & Sullivan. The growth rate in the sectors will have a direct bearing on the performance of several of our products that are being used in the auto sector. Pennar continues to view the automotive segment with great interest as it is the main driver for our steel products and components business.
Railways which is the one the largest networks in the world has been a driver for the growth of the company. But over the last few years the sector hasn’t witnessed the expected momentum. Some of the tenders issued in 2012 are yet to be realised. But the year 2013 could see some new initiatives with the proposal of launching around 70 new trains and also the setting up of new rail coach factory in Sonepat in Haryana. At macro level, the pace of development
in Delhi- Mumbai freight corridor, a few other major freight corridors on the drawing board, progress in metro rail infrastructure bodes well for the long term future of this sector. In the long run we continue to remain confident of growth for Pennar’s business in the railways segment.
Pennar has been playing a leadership for the solar
segment by having a major share in the Solar structural market. The business of PV based solar power generation has reached a point of techno-commercial viability which allows it to compete successfully with other more proven forms of alternate power generation. Though FY13 has seen a relative lull, FY14 is expected to see a flurry of activity from the Central and State governments. It is expected that nearly 1300-1400 MW will be added in the coming financial year and Pennar will be in a great position to play an active role. The Solar segment is expected to play an important role in our growth plan. The technology leap including the viability of Roof Top solar in distributed generation mode bodes well for our business.
3. Business and Operational Overview
The slowdown in the economy and the core sectors has impacted the demand for steel, engineering and infrastructure products in the last one year. However, we view this as an opportunity to prepare ourselves for the upturn in the economy and demand. Among other goals, your Company is targeting to be among the top three players in all the segments we are present in. Against the backdrop of this goal, we have structured our businesses into four key verticals – Steel Products (a combined entity of the erstwhile Cold Rolled Steel Strips (CRSS) and Engineering Profiles), Tubes, Industrial Components, Systems and Projects. We are proposing to add new products/ services, new segments, targeting newer markets both in India and abroad and scale capacities in
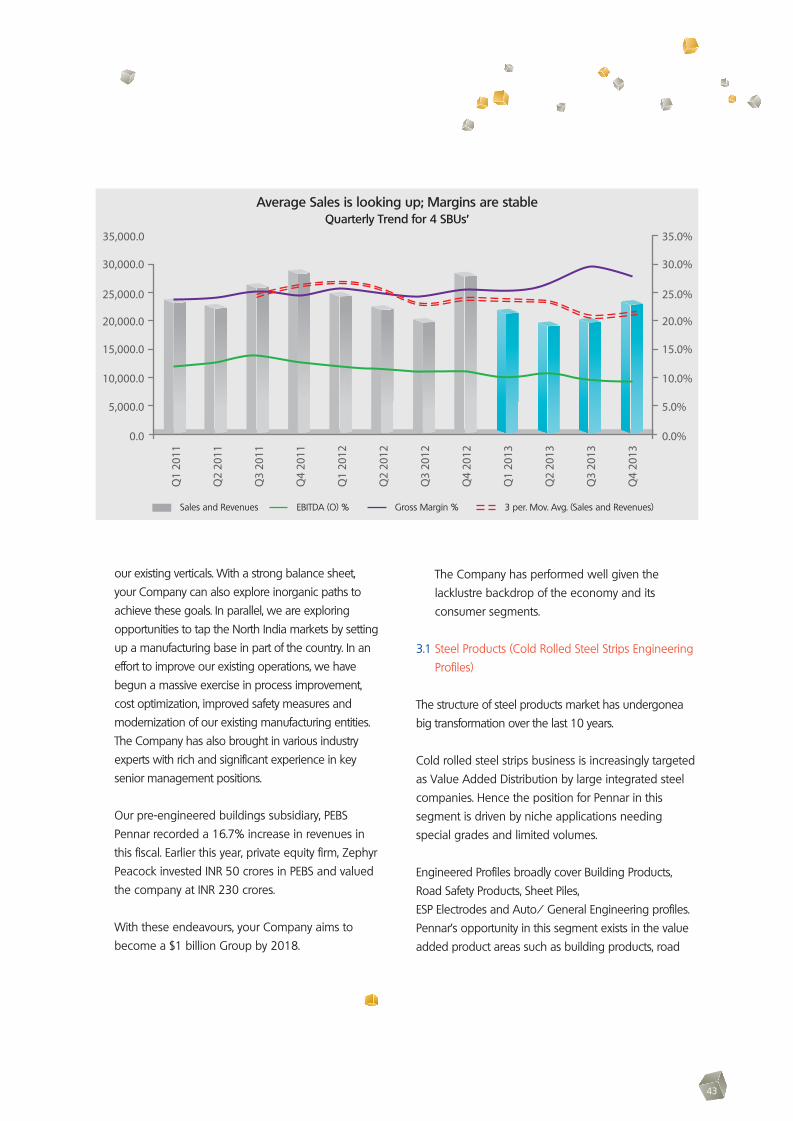
43
our existing verticals. With a strong balance sheet, your Company can also explore inorganic paths to achieve these goals. In parallel, we are exploring opportunities to tap the North India markets by setting up a manufacturing base in part of the country. In an effort to improve our existing operations, we have begun a massive exercise in process improvement, cost optimization, improved safety measures and modernization of our existing manufacturing entities. The Company has also brought in various industry experts with rich and significant experience in key senior management positions.
Our pre-engineered buildings subsidiary, PEBS Pennar recorded a 16.7% increase in revenues in this fiscal. Earlier this year, private equity firm, Zephyr Peacock invested INR 50 crores in PEBS and valued the company at INR 230 crores.
With these endeavours, your Company aims to
become a $1 billion Group by 2018.
The Company has performed well given the lacklustre backdrop of the economy and its consumer segments.
3.1 Steel Products (Cold Rolled Steel Strips Engineering Profiles)
The structure of steel products market has undergonea big transformation over the last 10 years.
Cold rolled steel strips business is increasingly targeted as Value Added Distribution by large integrated steel companies. Hence the position for Pennar in this segment is driven by niche applications needing special grades and limited volumes.
Engineered Profiles broadly cover Building Products, Road Safety Products, Sheet Piles, ESP Electrodes and Auto/ General Engineering profiles. Pennar’s opportunity in this segment exists in the value added product areas such as building products, road
35,000.0 35.0%
30.0%
Q1
2011
Q2
2011
Q3
2011
Q4
2011
Q1
2012
Q2
2012
Q3
2012
Q4
2012
Q1
2013
Q2
2013
Q3
2013
Q4
2013
25.0%
20.0%
15.0%
10.0%
5.0%
0.0%
30,000.0
25,000.0
20,000.0
15,000.0
10,000.0
5,000.0
0.0
Quarterly Trend for 4 SBUs’
Sales and Revenues EBITDA (O) % Gross Margin % 3 per. Mov. Avg. (Sales and Revenues)
Average Sales is looking up; Margins are stable
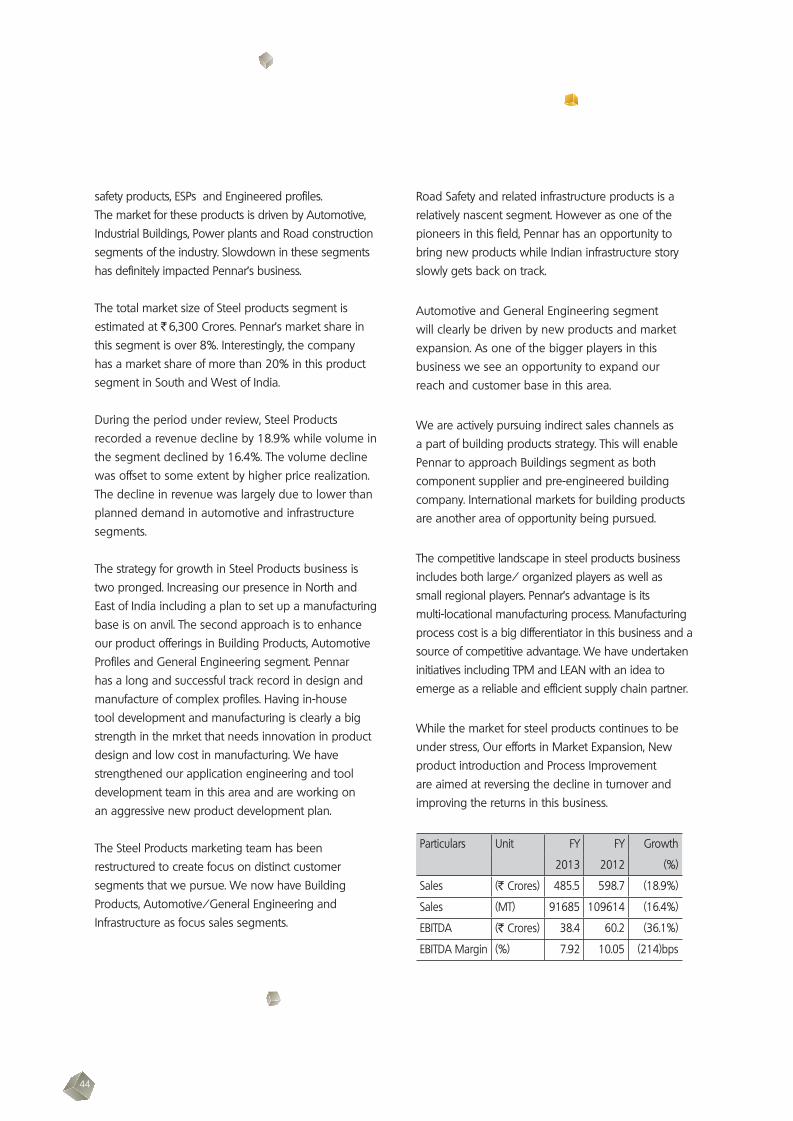
44
safety products, ESPs and Engineered profiles. The market for these products is driven by Automotive, Industrial Buildings, Power plants and Road construction segments of the industry. Slowdown in these segments has definitely impacted Pennar’s business.
The total market size of Steel products segment is estimated at ` 6,300 Crores. Pennar’s market share in this segment is over 8%. Interestingly, the company has a market share of more than 20% in this product segment in South and West of India.
During the period under review, Steel Products recorded a revenue decline by 18.9% while volume in the segment declined by 16.4%. The volume decline was offset to some extent by higher price realization. The decline in revenue was largely due to lower than planned demand in automotive and infrastructure segments.
The strategy for growth in Steel Products business is two pronged. Increasing our presence in North and East of India including a plan to set up a manufacturing base is on anvil. The second approach is to enhance our product offerings in Building Products, Automotive Profiles and General Engineering segment. Pennar has a long and successful track record in design and manufacture of complex profiles. Having in-house tool development and manufacturing is clearly a big strength in the mrket that needs innovation in product design and low cost in manufacturing. We have strengthened our application engineering and tool development team in this area and are working on an aggressive new product development plan.
The Steel Products marketing team has been restructured to create focus on distinct customer segments that we pursue. We now have Building Products, Automotive/General Engineering and Infrastructure as focus sales segments.
Road Safety and related infrastructure products is a relatively nascent segment. However as one of the pioneers in this field, Pennar has an opportunity to bring new products while Indian infrastructure story slowly gets back on track.
Automotive and General Engineering segment will clearly be driven by new products and market expansion. As one of the bigger players in this business we see an opportunity to expand our reach and customer base in this area.
We are actively pursuing indirect sales channels as a part of building products strategy. This will enable Pennar to approach Buildings segment as both component supplier and pre-engineered building company. International markets for building products are another area of opportunity being pursued.
The competitive landscape in steel products business includes both large/ organized players as well as small regional players. Pennar’s advantage is its multi-locational manufacturing process. Manufacturing process cost is a big differentiator in this business and a source of competitive advantage. We have undertaken initiatives including TPM and LEAN with an idea to emerge as a reliable and efficient supply chain partner.
While the market for steel products continues to be under stress, Our efforts in Market Expansion, New product introduction and Process Improvement are aimed at reversing the decline in turnover and improving the returns in this business.
Particulars Unit FY FY Growth
2013 2012 (%)
Sales (` Crores) 485.5 598.7 (18.9%)
Sales (MT) 91685 109614 (16.4%)
EBITDA (` Crores) 38.4 60.2 (36.1%)
EBITDA Margin (%) 7.92 10.05 (214)bps

45
3.2 Tubes
The business of Tubes for Pennar includes ERW, GP and CDW Tubes. 2013 saw the compay launching CDW range through its newly created facility at Isnapur near Hyderabad. With the launch of CDW tube range, Pennar has made an entry in to precision tubes segment.
The total market size of Tubes in value terms is around ` 3,000 Crores. Pennar’s market share in this segment is over 4%. Company’s entry in CDW segment has opened doors to many possibilities in the area of tubular components; thus allowing us to increase the extent of value addition and moving up the value chain.
During the period under review, Tubes segment recorded a revenue growth of 63.3% and volume growth of 57.6%. Both the volume and value growths were primarily driven by increased contribution from higher value added products including engineering components and tubes. This vertical has grown by 27% YoY in volume and 23% YoY in value, whereas CDW tubes have grown by 175%. In Q4, Isnapur plant recorded the highest ever production, amounting to 1900 MT of ERW tubes and 290MT of CDW tubes.
This growth is not just about numbers. The business of CDW Tubes is quite different from ERW tubes. The manufacturing process, quality management practices, customer profile and nature of application makes CDW tubes business fundamentally different from ERW or GP tubes. Pennar has been able to successfully integrate the CDW facility in its business and now has an impressive array of customers. We have created product distribution and service setups in Chennai and Hosur to address specific needs of Key Accounts. The steps taken in 2013 will go a long way in ensuring consistent growth for Tubes business.
Pennar’s combined Tube manufacturing capacity is at 36,000 TPA and the last quarter of 2013 saw
us utilizing our capacity to >80%. The trend in new customer orders is encouraging and we are looking at making incremental additions to our capacity in Tubes. Focus on CDW business; increase in tubular component business and higher capacity utilization will lead to enhanced margins in Tubes business.
We are also looking at major capacity addition in North/West India to provide geographical diversity to this business and also to improve market share.Tubes is clearly a growth segment for Pennar.
We are relatively new in this business area; geographical expansion in India, international markets, tubular products and sub-systems represent a big opportunity for the company. We have installed a new leadership team in Tubes business; and clearly brought in the spirit of a small and nimble enterprise in our Tubes business Unit. We do believe that this spirit is an essential ingredient in our aim to aggressively grow the business of Tubes.
Particulars Unit FY FY Growth
2013 2012 (%)
Sales (` Crores) 99.2 60.7 63.3%
Sales (MT) 18611 11807 57.6%
EBITDA (` Crores) 7.2 5.1 40.2%
EBITDA Margin (%) 7.26 8.45 (120)bps
3.3 Industrial Components
The business of Industrial components for Pennar consists of Press Metal components for Automotive and White Goods segment of the industry.Press Metal components were seen as a natural extension of Pennar’s manufacturing process and hence the company initially ventured in to this business. The nature of this market has however changed dramatically since that time. The market has become much larger and expectations from automotive, White Goods and General Engineering

46
segments which form the key customr segments; towards the supply chain has also changed.
After reviewing the market potential, customer expectations and Pennar’s capabilities, we are confident that the way forward in this business is to shape it like an Auto Components Unit.
A newly created business unit with clearly defined focus, new leadership and a mandate to aggressively grow the business portfolio; all at our new Headquarters for Components business in Chennai spells like providing wings to our dream of making Pennar’s business increasingly focused on value added engineering products.
The total market size of Industrial Components in value terms is around ` 4,590 Crores. Pennar’s market share in this segment is over 2%. There are low hanging fruits for the company in this business with existing customers to expand the product basket. Further, there is also a big opportunity to go beyond press metal products. A product range expansion, new technology infusion, international market opportunity along with market expansion in India are the steps that company intends to take for growing our Industrial components business.
During the period under review, Industrial Components segment recorded a revenue growth of 5.4% and volume decline of 9.8% primarily driven by increased contribution from higher value added products including engineering components and tubes. The stabilization of new disc brakes for Endurance has begun generating revenues in this segment.
Particulars Unit FY FY Growth
2013 2012 (%)
Sales (` Crores) 72.7 69.0 5.4%
Sales (MT) 9258 10263 (9.8%)
EBITDA (` Crores) 10.0 9.5 5.4%
EBITDA Margin (%) 13.78 13.78 (0)bps
3.4 Systems and Projects
The business of Pennar originated with Cold Rolled Steel Strips. Our business growth has been driven by a continuous process of product extension based on our manufacturing capabilities in metal processing. Opportunities at the market place and a strategy to expand in to related areas has been our business growth driver.
This search product extension got us in to the business of Railway Wagons and Coach systems a few years back. The business with Railways has seen its highs and lows. Along with the business of Railway systems, the company also developed product offerings for Solar Structures last year.
Railways and Solar structure segments differentiate themselves from other businesses of Pennar in three areas. Both these businesses involve order related engineering, project management and onsite support. The organization needs of these businesses are quite different from steel products, Tubes or Industrial components. Further, we see a need to look at either Railways or Solar as purely market segments for our systems. We do believe that our business here is that of providing systems for Body Shop for Transportation segment and modular structures for Solar Power plants.
We plan to work on applications and markets other than Railways and Solar to epand the reach of our solutions in this segment. Systems & Projects BU is aggressively pursuing to introduce a range of new products and solutions from the infrastructure & warehousing industry. It has also started extending on the geographical and segmental reach to acquire a higher market share in the existing businesses too. This business vertical wishes to acquire almost 30% of growth in FY 14 from new products & new markets.
Solar business would focus extensively on enhancing its reach into new territories like Rajasthan, Punjab and Kerala to name a few. Serious study and efforts are also on its way to

47
enter the track mounted Solar business. Aggressive efforts are on, to standardize the Solar mounting structures to crunch the delivery lead times and offer speedy solutions to customers.
During the period under review, performance of the Systems & Projects segment which consisted of primarily railways was impacted by slower off-take from the railway industry. The slowdown in the railways sector and subsequent drop in orders for wagon and coach components is expected to make this a tough year for Systems & Projects. Solar business maintained its business levels while Railways business saw a major decline primarily due to lower Coach & Wagon manufacturing plans announced by the Railway Board. The total market size of Systems & Projects in value terms is around ` 1,455 crore. Pennar’s market share in this segment is around 24%.
Particulars Unit FY FY Growth
2013 2012 (%)
Sales (` Crores) 190.7 248.1 (23.2%)
Sales (MT) 23749 25940 (8.4%)
EBITDA (` Crores) 25.2 43.4 (41.9%)
EBITDA Margin (%) 13.21 17.49 (428)bps 3.5 Pre-Engineered Buildings Systems(PEBS Performance)
During the period under review, PEBS segment recorded a robust revenue growth of 16.7%. This growth was primarily driven by increased capacity utilization levels and significant new orders. This segment executed 148 new projects during the year. The company saw a major breakthrough in the Cold form steel buildings segment by securing orders of ` 24 Cr (3000MT). PEBS bagged a major order from IOT Infra worth which is the single largest job by the company. The company also bagged a structural steel order from HZL through COGIL for Zinc ore mining structures. Further, PEBS bagged repeated orders from Godrej, Hindustan Unilever, Volvo, Continental Tyres, P L Raju Constructions, Archean Chemicals, RVR Projects OCTL, AGI Glasspac, Glandpharma.
The company made inroads into two new industry segements – PEBS successfully bagged an order for the Metro Rail Project through L&T Hyderabad and entered into power plant segment by bagging order from Ramky.
Northern/Western plant will help the company to expand aggressively in North India and Export market. The PEBS segment is expected to continue along its growth trajectory this year. The Company got ` 50 crores of funding from private equity firm, Zephyr Peacock. Zephyr’s investment will help PEBS target INR 1000 Crores in sales in the next three years, a CAGR of over 40%. PEBS proposes to achieve this through its aggressive growth plans in international emerging markets, solar infrastructure, high rise commercial buildings and cold form building systems.
The company proposes expansion into Solar, Cold Form buildings, Highrise Buildings sectors. The subsidiary also proposes to set up a plant in West/North India; expansion of exports and setting up of business presence in Africa. The Indian Pre-Engineered Steel Buildings (PEB) market is experiencing robust growth, fuelled by infrastructure development and the increasing popularity of PEB systems in the industrial sector. Sectors such as automotive, power, logistics, pharma, FMCG, and capital goods provide huge growth opportunity for PEB in India. Analysis of the Indian Pre-engineered Buildings Market, finds that the market earned revenues of INR 52,970 million in 2012 and estimates this to reach INR 136,120 million in 2016, growing at a compound annual growth rate (CAGR) of 26.6 percent.
Particulars Unit FY FY Growth
2013 2012 (%)
Sales (` Crores) 287.0 245.9 16.7%
Sales (MT) 36871 34479 3.5%
EBITDA (` Crores) 35.5 28.9 22.8%
EBITDAMargin
(%) 12.38 11.75 63bps
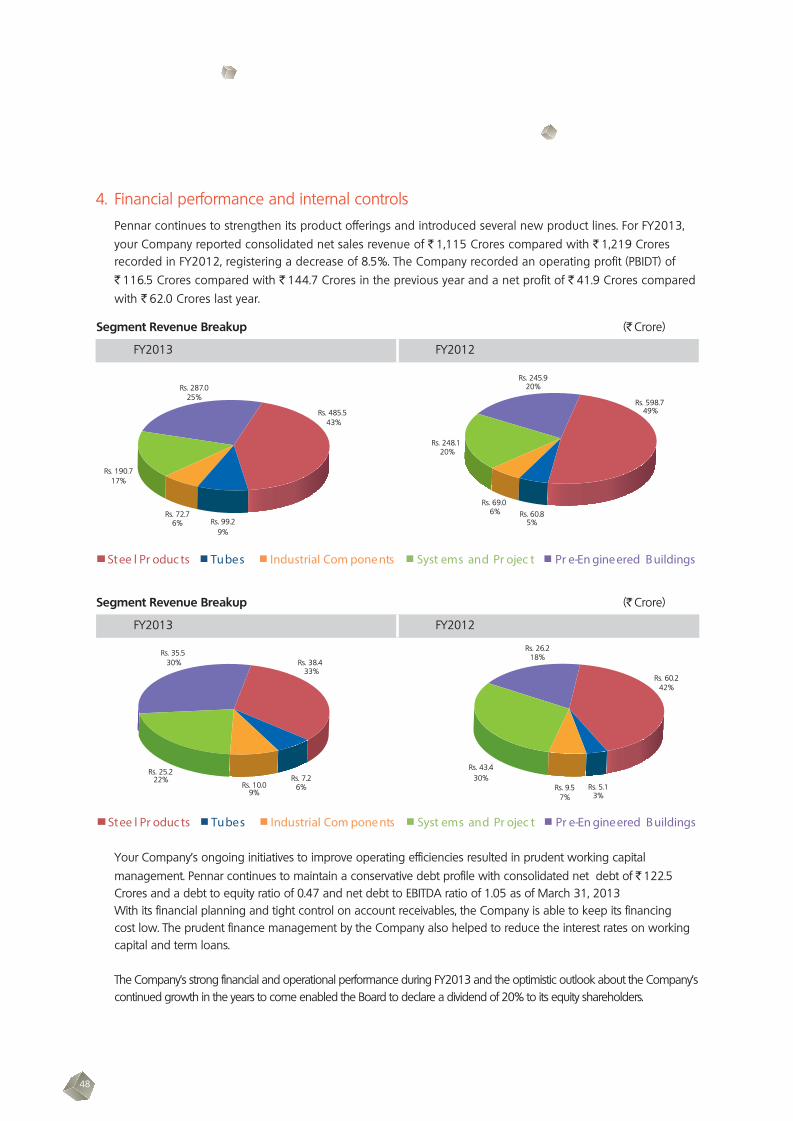
48
4. Financial performance and internal controls Pennar continues to strengthen its product offerings and introduced several new product lines. For FY2013,
your Company reported consolidated net sales revenue of ` 1,115 Crores compared with ` 1,219 Crores recorded in FY2012, registering a decrease of 8.5%. The Company recorded an operating profit (PBIDT) of ` 116.5 Crores compared with ` 144.7 Crores in the previous year and a net profit of ` 41.9 Crores compared with ` 62.0 Crores last year.
Your Company’s ongoing initiatives to improve operating efficiencies resulted in prudent working capital management. Pennar continues to maintain a conservative debt profile with consolidated net debt of ` 122.5 Crores and a debt to equity ratio of 0.47 and net debt to EBITDA ratio of 1.05 as of March 31, 2013 With its financial planning and tight control on account receivables, the Company is able to keep its financing cost low. The prudent finance management by the Company also helped to reduce the interest rates on working capital and term loans.
The Company’s strong financial and operational performance during FY2013 and the optimistic outlook about the Company’s continued growth in the years to come enabled the Board to declare a dividend of 20% to its equity shareholders.
Steel Products Tubes Industrial Components Systems and Project Pre-Engineered Buildings
Rs. 485.543%
Rs. 99.29%
Rs. 72.76%
Rs. 190.717%
Rs. 287.025%
Rs. 598.749%
Rs. 60.85%
Rs. 69.06%
Rs. 248.120%
Rs. 245.920%
Stee l Pr oduc ts Tubes Industrial Com pone nts Syst ems and Pr ojec ts Pr e-En gineered B uildings
Segment Revenue Breakup (` Crore)
FY2013 FY2012
Rs. 38.433%
Rs. 7.26%Rs. 10.0
9%
Rs. 25.222%
Rs. 35.530%
Rs. 60.242%
Rs. 5.13%
Rs. 9.57%
Rs. 43.430%
Rs. 26.218%
Stee l Pr oduc ts Tubes Industrial Com pone nts Syst ems and Pr ojec ts Pr e-En gineered B uildings
Segment Revenue Breakup (` Crore)
FY2013 FY2012

49
5. Resources
The net current assets as on March 31, 2013 increased from ` 211.8 crores in 2011-12 to ` 225.2 crores.
The Company earned ` 53.9 Crores cash inflow from operations. After meeting working capital requirements, theCompany earned net cash inflow of ` 0.2 Crores. After providing for tax liability, the net profit stood at ` 31.1 Crores.
Particulars 12 months ended March 31, 2013
12 months ended March 31, 2012
Sources of funds
a. Shareholders’ funds 316.4 302.1
b. Loan funds 105.7 114.8
c. Deferred tax liability 13.3 12.2
Total 435.4 429.1
Application of funds
a. Fixed assets (net) 187.4 198.8
b. Investments 22.8 18.5
c. Net current assets 225.2 211.8
d. Deferred tax/ miscellaneous expense, among others
Total 435.4 429.1
Particulars 12 months ended March 31, 2013
12 months ended March 31, 2012
Profit from operations after tax 65.6 84.0
Less: Increase in net working capital (11.7) (2.1)
Net cash flow from operating items (before extraordinary items)
53.9 81.8
Payments for assets acquisitions/investment (10.4) (52.3)
Net cash flow from investing activities (10.4) (52.3)
Cash flow from financing activities (43.3) (29.4)
Net cash inflow / (outflow) 0.2 0.2
` crores.
` crores.

50
6. Learning & Development
Learning is a continuum, especially in the midst of transformation. In a dynamic set up keeping abreast with the best practices is all the more important in order to be competitive. Keeping in mind this philosophy the company has charted a course where in several learning and development initiatives have been opted for. A systematic learning and development plan has been created where by training needs will be identified, training sessions will be provided for and a post learning evaluation is done. Some of the major initiatives include:
HSE Training: The basic aim of HSE training to impart practical training on behavioural safety aspects with significant pointing out of errors and providing remedies. It also includes providing application techniques at the site to have better safe working environment. The training has been designed in two levels in two different days. A training programme on behavioural safety aspects for people below supervisory levels for two days in 21 batches covering 1560 people for all units. Further, one day training programme on safety planning, process and review inclusive of safety audit provisions etc for people with the rank of senior manager and above was provided. In this category, 200 employees were covered in 9 batches in one day programme
Process based Management: Training for process based management has been initiated in the company to enhance the skillset of the employees and to improve the productivity. Programmes such as TPM and Anaar have been identified as one of the tools for process enhancement.
TPM stands for Total Productive Maintenance. The objective of TPM is to set a goal to
increase employee participation and maximize equipment efficiency (overall efficiency) by establishing a total system for Preventive Maintenance (PM) for the entire life of equipment. TPM ensures participation by all departments, including equipment planning, operating and maintenance departments, involving all personnel, including top personnel to first-line operators. For implementing TPM training is being given by TPM Club, CII, Bangalore on 8 TPM Pillars: Individual Improvement, Autonomous Maintenance, Planned Maintenance, Quality Maintenance, Education and Training, Development Management, Safety Health and Environment and Office TPM. Currently there are four teams of 6 people each involving Production, Quality and Maintenance along with operators for CRSS PTC & ISNP, Industrial Comp. and CRFS. The foundation of TPM lies in 1S and 2S for which activities like “Cleaning with Meaning” have already been started. After introduction of autonomous maintenance activities, operators take care of machines by themselves without being ordered to. With achievement of zero breakdowns and zero defects, operators get new confidence in their own abilities. Workplaces that used to be covered with oil and chips are now clean and pleasant as to be almost unrecognizable. TPM transform work culture and strengthens Pennar brand image, a giant step towards becoming a $1 billion company
The Anaar Roadmap is an integrated and focused approach that consists of interconnected modules for improving both the effectiveness and efficiency of an organization. It is the product of two decades of experience implementing the philosophies of Dr. W. Edwards Deming. It is designed to address the challenges such as delays, inefficiencies in operations, low employee
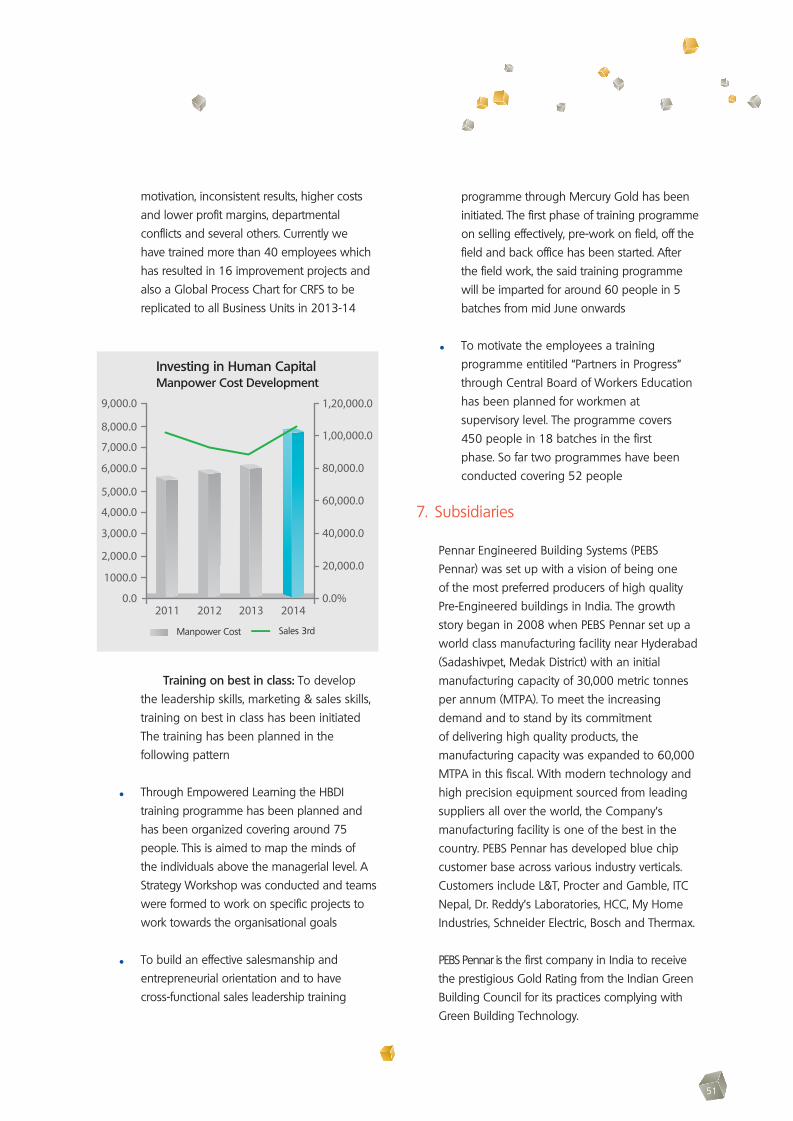
51
motivation, inconsistent results, higher costs and lower profit margins, departmental conflicts and several others. Currently we have trained more than 40 employees which has resulted in 16 improvement projects and also a Global Process Chart for CRFS to be replicated to all Business Units in 2013-14
Training on best in class: To develop the leadership skills, marketing & sales skills, training on best in class has been initiated The training has been planned in the following pattern
Through Empowered Learning the HBDI training programme has been planned and has been organized covering around 75 people. This is aimed to map the minds of the individuals above the managerial level. A Strategy Workshop was conducted and teams were formed to work on specific projects to work towards the organisational goals
To build an effective salesmanship and entrepreneurial orientation and to have cross-functional sales leadership training
programme through Mercury Gold has been initiated. The first phase of training programme on selling effectively, pre-work on field, off the field and back office has been started. After the field work, the said training programme will be imparted for around 60 people in 5 batches from mid June onwards
To motivate the employees a training programme entitiled “Partners in Progress” through Central Board of Workers Education has been planned for workmen at supervisory level. The programme covers 450 people in 18 batches in the first phase. So far two programmes have been conducted covering 52 people
7. Subsidiaries
Pennar Engineered Building Systems (PEBS Pennar) was set up with a vision of being one of the most preferred producers of high quality Pre-Engineered buildings in India. The growth story began in 2008 when PEBS Pennar set up a world class manufacturing facility near Hyderabad (Sadashivpet, Medak District) with an initial manufacturing capacity of 30,000 metric tonnes per annum (MTPA). To meet the increasing demand and to stand by its commitment of delivering high quality products, the manufacturing capacity was expanded to 60,000 MTPA in this fiscal. With modern technology and high precision equipment sourced from leading suppliers all over the world, the Company’s manufacturing facility is one of the best in the country. PEBS Pennar has developed blue chip customer base across various industry verticals. Customers include L&T, Procter and Gamble, ITC Nepal, Dr. Reddy’s Laboratories, HCC, My Home Industries, Schneider Electric, Bosch and Thermax.
PEBS Pennar is the first company in India to receive the prestigious Gold Rating from the Indian Green Building Council for its practices complying with Green Building Technology.
Investing in Human CapitalManpower Cost Development
Manpower Cost Sales 3rd
7,000.0
2011 2012 2013 2014
6,000.0
5,000.0
4,000.0
9,000.0
8,000.0
3,000.0
2,000.0
1000.0
0.0 0.0%
20,000.0
40,000.0
60,000.0
80,000.0
1,00,000.0
1,20,000.0
52
PEBS Pennar also received the ISO 9001:2008 certification and PEBS Pennar’s flagship product DOUBLE – LOK® in technical association with NCI Group USA, received the highly acclaimed FM Approval in India.
Pennar Enviro Ltd is engaged in water and waste water treatment. Pennar acquired a majority stake in Pennar Enviro Ltd, this investment being in line with the Company’s strategy of entering new areas of engineering services.
Pennar Enviro Ltd (PEL) has three business divisions, namely Fuel Additives, Water treatment chemicals and Water treatment projects.
For the Fuel Additives (FA) and Water treatment Chemicals (WTC) divisions, PEL has a manufacturing unit at Mallapur in Hyderabad. It manufactures FAs for industrial furnace fuels with a “know-how” provided by M/S TOTAL, France, the fourth largest Oil/Gas Company in the World. It also produces the entire range of WTC applications such as boiler feed, RO membrane based treatment plants, cooling water towers, effluent and raw water treatment plants.
Water Treatment Projects: PEL provides solutions through EPC + O&M services, to treat raw water and waste water for municipal and industrial applications. Sewage treatment and drinking water treatment projects are undertaken in municipal sector where as process input water, Effluent Treatment Plants (ETP) / Zero Liquid Discharge (ZLD) solutions are provided in industrial sector for various segments as food, pharma, beverages, power generation, cement and sugar.
8. Opportunities and threats
Material handling: We have the opportunity to move from being a components supplier to a systems integrator and provide complete solutions including coal handling, ash handling and ESPs.
Engineering design: We aim to move ahead in the product development value chain of the engineering design of our products. Presently our engineering design works are at the back-end of this value chain.
At this point of time, Pennar is geared to utilise its resources effectively by virtue of its strength of its work force and improved capacity utilisation of its assets. It further aims that diligence will help in improving yields and productivity, thereby improving its financial strength.
Pennar’s business may be impacted by the general slowdown in the economy. This may also lead to elongated operating and working capital cycles. Some of the sectors that the Company caters to are highly unstructured and have strong price competition. However, the management remains confident that due to its continued focus on manufacturing excellence through technological innovations, productivity and capacity utilization improvements, the Company is well positioned to deal with any short term economic or market volatility.
9. Risks and Concerns
1) User Industry Risk: The Company’s businesses are also dependent upon the policies of the Indian government and any change whether positive or adverse, has a direct impact on the Company’s business.
The Company has introduced new
product lines to mitigate user industry concentration risk.
2) Raw Material Risk: The Company’s operations require substantial amounts of steel, scrap, specialized components and are exposed to volatility in prices and availability.
Pennar has alliance with leading steel
53
producers in the country. The Company is also focused on rationalization and standardization of grades. It is also focusing on moving to products with high value addition.
3) Exposure to Interest Rate Hikes: Over the past year, Indian economy has been facing a very challenging economic scenario with high interest rates and increasing inflation. The Company’s operations are therefore exposed to higher interest rate environment. Although the RBI is now progressively following an easing monetary policy, it will take some time for the full effects of this policy to have the desired impact.. Pennar maintains a very conservative leverage profile and has a total debt to equity ratio of 0.56x to keep down the interest burden to minimum. This also provides balance sheet flexibility for future growth.
10. Internal control systems and their adequacy
The Company has in place effective internal controls to aid improved decision-making by making the operating information available online across the country. The Company implemented SAP-based ERP. The Company put in place proper checks and balances and control systems to safe guard its assets and ensure that all operational and financial activities were carried out under proper authorisation and with necessary documentation. Internal audit by a firm of Chartered Accountants is carried out at regular intervals. The internal audit reports, the quarterly and annual financial statements are placed before the Audit Committee of the Board, for their review, discussion and follow-up actions.
11. Environment Safety, Health and Energy Conservation
At Pennar, we recognize how business growth is closely associated with community uplift, workplace safety and environment protection.
The Company adopted a number of measures to enhance community uplift and environment friendliness. The Company strictly monitors energy and water consumption. The senior management ensures that sustainability is at the forefront of its strategic planning in harmony with employees, customers and community commitment. Pennar’s subsidiary Pennar Engineered Building Systems Limited (PEBS) was awarded the Gold Rating by the Indian Green Building Council, and is the first factory in the country to receive the Gold Award.
At Pennar, a safe and secure workplace is of utmost importance. The Company emphasizes safer processes and minimises effluent discharge potential. The Company is committed to the ideal of zero workplace injuries.
The information required under Section 217(1)(e) of the Companies Act, 1956, read with the Companies (Disclosure of Particulars in the Report of the Board of Directors) Rules, 1988 with respect to energy conservation is attached as an appendix to this report.
12. Industrial relations/human resources
The Company has an excellent track record of cordial and harmonious industrial relations and over the years not a single man-day was lost on account of labour unrest. In view of its aggressive growth plans, the Company, during the year, augmented its manpower with experienced personnel in the technical, marketing and finance areas. The Company took steps for upgrading the knowledge base of the employees by continuous training. The Company continues to take care of the welfare of the employees. The Company organized camps for checking the health of operatives and staff by ESI and other medical agencies.
13. Outlook for 2013-14
Although we believe that household consumption growth has bottomed out in
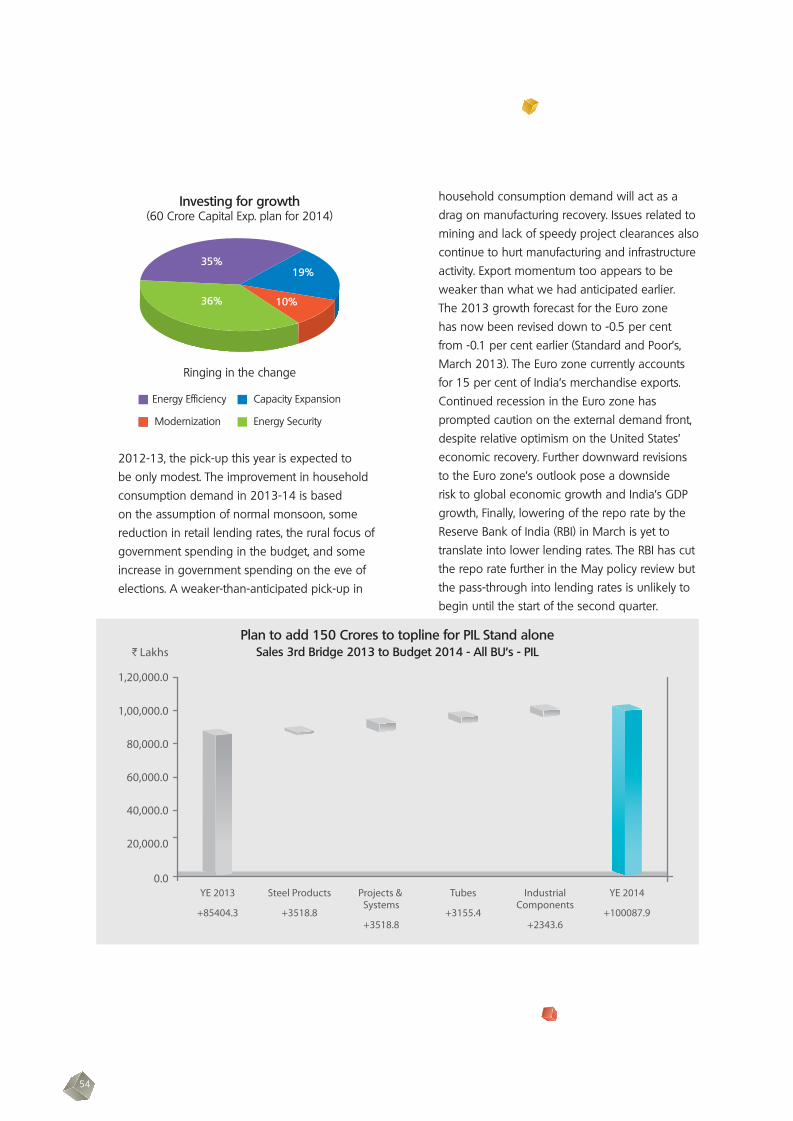
54
2012-13, the pick-up this year is expected to be only modest. The improvement in household consumption demand in 2013-14 is based on the assumption of normal monsoon, some reduction in retail lending rates, the rural focus of government spending in the budget, and some increase in government spending on the eve of elections. A weaker-than-anticipated pick-up in
household consumption demand will act as a drag on manufacturing recovery. Issues related to mining and lack of speedy project clearances also continue to hurt manufacturing and infrastructure activity. Export momentum too appears to be weaker than what we had anticipated earlier. The 2013 growth forecast for the Euro zone has now been revised down to -0.5 per cent from -0.1 per cent earlier (Standard and Poor’s, March 2013). The Euro zone currently accounts for 15 per cent of India’s merchandise exports. Continued recession in the Euro zone has prompted caution on the external demand front, despite relative optimism on the United States’ economic recovery. Further downward revisions to the Euro zone’s outlook pose a downside risk to global economic growth and India’s GDP growth, Finally, lowering of the repo rate by the Reserve Bank of India (RBI) in March is yet to translate into lower lending rates. The RBI has cut the repo rate further in the May policy review but the pass-through into lending rates is unlikely to begin until the start of the second quarter.
YE 2013
+85404.3
YE 2014
+100087.9
Steel Products
+3518.8
Tubes
+3155.4
Projects & Systems
+3518.8
IndustrialComponents
+2343.6
1,20,000.0
I Lakhs
1,00,000.0
80,000.0
60,000.0
40,000.0
20,000.0
0.0
Sales 3rd Bridge 2013 to Budget 2014 - All BU’s - PILPlan to add 150 Crores to topline for PIL Stand alone
Investing for growth(60 Crore Capital Exp. plan for 2014)
Ringing in the change
Capacity Expansion
Energy Security
Energy Efficiency
Modernization
35%
36%
19%
10%

55
Financial Highlights (consolidated) for the year 2012-13 (` Crores)

56
In compliance with Clause 49 of the Listing Agreement, with the stock exchanges, your Company hereby provides, to the shareholders, the report on Corporate Governance.
1. Company’s philosophy on Code of Corporate Governance
The Company is committed to ethical values and self-discipline through standards of good governance with transparency, efficiency, efficacy, full disclosure in its dealings and appropriate checks and balances directed at sustaining shareholders’ interests and overall organisational goals.
2. Board of Directors
a) Composition of the Board: The Company’s Board of Directors comprises twelve Directors, of which three are Executive Directors and balance nine are Non-Executive Directors of whom six are Independent Directors. The Company has a Chairman and Vice-Chairman. The Chairman is responsible for the conduct of the business and the day-to-day affairs of the Company. The Vice-Chairman looks after diversification and projects.
b) Number of Board meetings held during the financial year and the dates of the Board meetings: During 2012-13, the Board met four times on May 29, 2012, July 23, 2012, November 9, 2012,
and February 9, 2013.
57
c). Attendance of each Director at Board meetings and the last Annual General Meeting
Sl. No.
Name of the Director Category of Directorship Number ofBoard meeting held during his
Directorship
Number of Board meetings attended
Attendance at the last AGM
held on July 23, 20 12
1 Mr. Nrupender Rao Promoter, Chairman 4 4 Yes
2 Mr. Ravi Chachra Non-Executive Director 4 3 No
3 Dr. G Vivekanand Independent Non-Executive Director 4 1 No
4 Mr. C Parthasarathy Independent Non-Executive Director 4 1 No
5 Mr. B Kamalaker Rao Independent Non-Executive Director 4 4 Yes
6 Mr. C Rangamani Independent Non-Executive Director 4 2 Yes
7 Mr. A Krishna Rao* Independent Non-Executive Director 2 0 No
8 Mr. Manish Sabharwal @ Independent Non-Executive Director 4 2 No
9 Mr. J Ramu Rao Non-Executive Director 4 1 No
10 Mr. Vishal Sood Non-Executive Director 4 2 No
11 Mr. Varun Chawla # Independent Non-Executive Director 2 2 NA
12 Mr. Ch Anantha Reddy Director 4 4 Yes
13 Mr. Aditya Rao Vice Chairman 4 4 Yes
*Mr. A Krishna Rao resigned as the Director of the Company with effect from November 9, 2012 # Mr. Varun Chawla was appointed as an Additional Director with effect from November 9, 2012 @ In addition to attending two meetings, Mr. Manish Sabharwal participated in one meeting over teleconference. No sitting fee has been paid for participation over teleconference

58
d) Number of other Boards/Board Committees each Director (being a Director of the Company as at the end of the financial year) is a Director/Chairman
Sl. No
Name of the Director Number of other Companies in which director
Number of Committee memberships held in
other Companies
Chairman Director Chairman Member
1 Mr. Nrupender Rao 4 5 6 2
2 Mr. Ravi Chachra - 1 - -
3 Mr. C Parthasarathy 8 15 8 8
4 Dr. G Vivekanand - 7 - 1
5 Mr. B Kamalaker Rao 1
6 Mr. C Rangamani - 2 1 -
7 Mr. A Krishna Rao* - 2 - -
8 Mr. Manish Sabharwal - 11 2 -
9 Mr. J Ramu Rao 3
10 Mr. Vishal Sood 11
11 Mr. Varun Chawla # - - -
12 Mr. Ch Anantha Reddy - 1 - -
13 Mr. Aditya Rao - 7 - 5
*Mr. A Krishna Rao ceased to be the Director of the Company with effect from November 9, 2012 # Mr. Varun Chawla was appointed as an Additional Director with effect from November 9, 2012
3. Audit Committee a) Brief description of the terms of reference The terms of reference of the Audit Committee are comprehensive and cover the matters specified for Audit
Committees under the Listing Agreements with stock exchanges. The Committee provides the Board with additional assurance as to the adequacy of Company’s internal control systems and financial disclosures.
b) Composition, name of members and chairperson The Committee comprises 1. Mr. C Rangamani - Chairman (Independent Non-Executive Director) 2. Mr. B Kamalaker Rao - Member (Independent Non-Executive Director) 3. Mr. A Krishna Rao* - Member (Independent Non-Executive Director) 4. Mr. C Parthasarathy@- Member (Independent Non-Executive Director) 5. Mr. Varun Chawla#- Member (Independent Non-Executive Director) 6. Mr. Aditya Rao @- Member (Vice Chairman)
*Mr. A Krishna Rao ceased to be the Director of the Company with effect from November 9, 2012 @Mr. C Parthasarathy and Mr. Aditya Rao was appointed as members of the Audit Committee with effect
from July 23, 2012 # Mr. Varun Chawla was appointed as member of the Audit Committee with effect from February 9, 2013
59
c) Meetings and attendance during the year During the year under review, the Committee met five times on May 29, 2012, July 23, 2012,
November 9, 2012, February 9, 2013 and March 25, 2013. The details of attendance are given below:
Sl. No Name of the member Number of
meetings heldNumber of
meetings attended
1 Mr. C Rangamani 5 2
2 Mr. B Kamalaker Rao 5 5
3 Mr. A Krishna Rao @ 3 1
4 Mr. C Parthasarathy 3 2
5 Mr. Varun Chawla 1 0
6 Mr. Aditya Rao 3 3
@ Mr. A Krishna Rao participated in the meeting over teleconference. No sitting fee has been paid for participation over teleconference
The Statutory Auditors and Internal Auditors are invited to attend the Audit Committee meetings and the Company Secretary acts as the Secretary of the Committee.
The Chairman of the Board will attend the meetings as he deems appropriate
The minutes of the meetings of the Audit Committee are circulated to all the members of the Board.
4. Remuneration Committee
a) Brief description of terms of reference To formulate the remuneration policy and approve the remuneration or revision
in the remuneration payable to Executive Directors/Whole time Directors
b) Composition, name of members and chairperson The company reconstituted the Remuneration Committee on February 09, 2013.
The Remuneration Committee comprises 1. Mr. C Parthasarathy - Chairman (Independent Non-Executive Director) 2. Mr. B Kamalaker Rao - Member (Independent Non-Executive Director) 3. Mr. C Rangamani - Member (Independent Non-Executive Director) 4. Mr. Varun Chawla - Member (Independent Non-Executive Director)
c) Meetings and attendance during the year During the Period under review the Company has conducted Remuneration Committee Meeting
on March 25, 2013. The details of attendance are given below:
Sl. No Name of the member Number of
meetings heldNumber of
meetings attended
1 Mr. C Parthasarathy 1 1
2 Mr. C Rangamani 1 0
3 Mr. B Kamalaker Rao 1 1
4 Mr. Varun Chawla 1 0
60
d) Remuneration policy To recommend/review the remuneration package, periodically, to the Executive Directors. The remuneration
payable to them is in accordance with the existing industry practice and also with the provisions of the Companies Act, 1956.
e) At present, all the Non-Executive Directors receive remuneration only by way of sitting fees for attending the meetings of the Board and Committee thereof.
The actuals of remuneration paid to all the Director’s for 2012-13 is given below
Name of the Director Designation Salary Commission Provident fund, Superannuation fund and other perquisites (`)
Sitting Fee Total
Mr. Nrupender Rao Chairman 36,00,000 50,15,165 36,00,000 - 1,22,15,165
Mr. Ch Anantha Reddy Director 36,00,000 37,61,373 36,00,000 - 1,09,61,373
Mr. Aditya Rao Vice Chairman 24,00,000 25,07,582 24,00,000 - 73,07,582
Mr. Ravi Chachra Non-Executive Director 15,000 15,000
Dr. G Vivekanand Independent Non-Executive Director 5,000 5,000
Mr. C Parthasarathy Independent Non-Executive Director 19,000 19,000
Mr. B Kamalaker Rao Independent Non-Executive Director 55,000 55,000
Mr. C Rangamani Independent Non-Executive Director 24,000 24,000
Mr. A Krishna Rao Independent Non-Executive Director - -
Mr. Manish Sabharwal Independent Non-Executive Director - -
Mr. J Ramu Rao Non-Executive Director 5,000 5,000
Mr. Vishal Sood Non-Executive Director 5,000 5,000
Mr. Varun Chawla Independent Non-Executive Director 10,000 10,000
Mr. A K Rao, Chairman of the Remuneration Committee was not present at the last Annual General Meeting.
61
f. Details of number of shares held by the Non-Executive/Independent Directors as on March 31, 2013
Name of the Director Designation No. of shares held
Mr. Ravi Chachra Non-Executive Director -
Mr. C Parthasarathy Independent Non-Executive Director -
Dr. G Vivekanand Independent Non-Executive Director -
Mr. B Kamalaker Rao Independent Non-Executive Director 11,900
Mr. C Rangamani Independent Non-Executive Director -
Mr. A Krishna Rao Independent Director Non-Executive -
Mr. Manish Sabharwal Independent Non-Executive Director -
Mr. J Ramu Rao Non-Executive Director -
Mr. Vishal Sood Non-Executive Director
Mr. Varun Chawla Independent Non-Executive Director -
5. Shareholders’/Investors’ Grievances Committee
The company has ‘Shareholder’s/Investor’s Grievances Committee’ to specifically look into the redressal of shareholder/investor complaints and to strengthen investor relations.
a) Name of Non-Executive Director heading the Committee: The Committee functions under the Chairmanship of Mr. C Rangamani, a Non-Executive and Independent
Director. Other members include Mr. A Krishna Rao*, Independent Non-Executive Director, Mr. B Kamalaker Rao, a Non- Executive and Independent Director, Mr. Aditya Rao@, Vice- Chairman and Mr. Varun Chawla#, Independent Non-Executive Director.
*Mr. A Krishna Rao ceased to be the Director of the Company with effect from November 9, 2012. @Mr. Aditya Rao was appointed as member of the Shareholder’s/Investor’s Grievances Committee with effect
from July 23, 2012 # Mr. Varun Chawla was appointed as member of the Shareholder’s/Investor’s Grievances Committee with
effect from February 9, 2013
b) Name and designation of Compliance Officer: Mr. R Ravi, V.P Finance and Company Secretary.
c) Number of complaints received from shareholders: During the period under review, the Company has received and resolved 94 complaints and there were no pending complaints as at the year end.
d) Number of pending share transfers and complaints: Nil
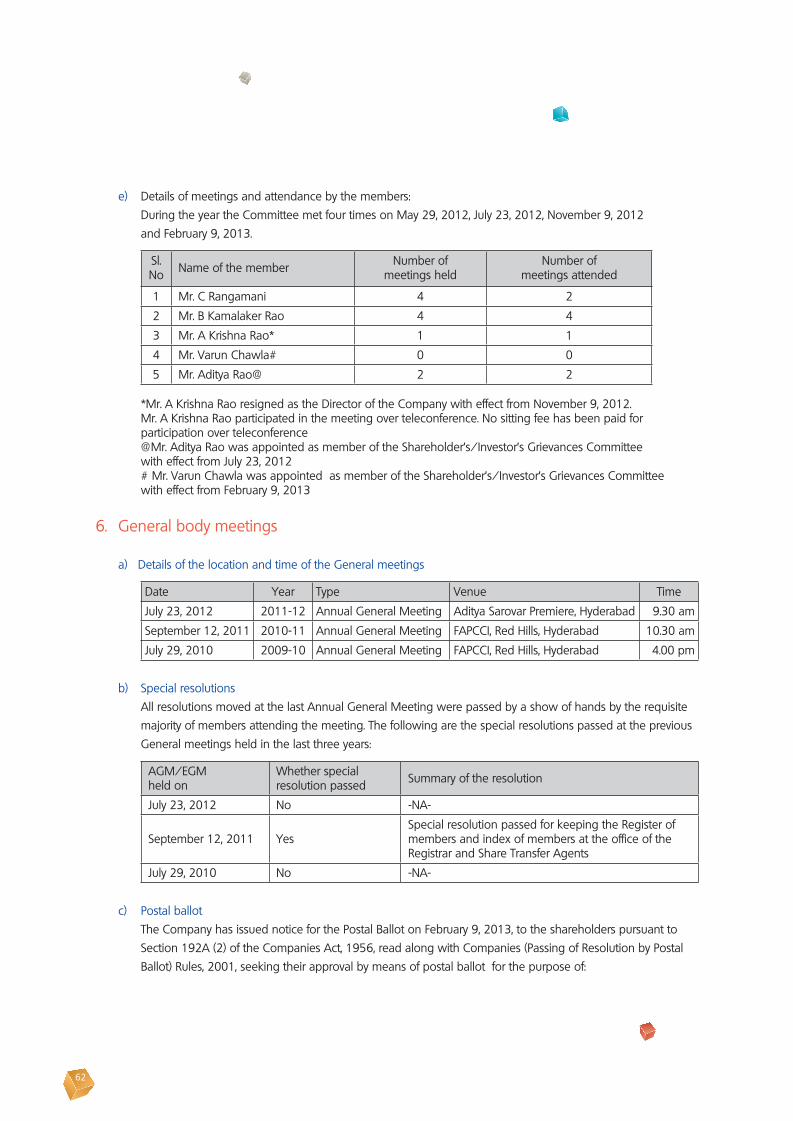
62
e) Details of meetings and attendance by the members: During the year the Committee met four times on May 29, 2012, July 23, 2012, November 9, 2012
and February 9, 2013.
Sl. No Name of the member Number of
meetings heldNumber of
meetings attended
1 Mr. C Rangamani 4 2
2 Mr. B Kamalaker Rao 4 4
3 Mr. A Krishna Rao* 1 1
4 Mr. Varun Chawla# 0 0
5 Mr. Aditya Rao@ 2 2
*Mr. A Krishna Rao resigned as the Director of the Company with effect from November 9, 2012. Mr. A Krishna Rao participated in the meeting over teleconference. No sitting fee has been paid for participation over teleconference@Mr. Aditya Rao was appointed as member of the Shareholder’s/Investor’s Grievances Committee with effect from July 23, 2012# Mr. Varun Chawla was appointed as member of the Shareholder’s/Investor’s Grievances Committee with effect from February 9, 2013
6. General body meetings
a) Details of the location and time of the General meetings
Date Year Type Venue Time
July 23, 2012 2011-12 Annual General Meeting Aditya Sarovar Premiere, Hyderabad 9.30 am
September 12, 2011 2010-11 Annual General Meeting FAPCCI, Red Hills, Hyderabad 10.30 am
July 29, 2010 2009-10 Annual General Meeting FAPCCI, Red Hills, Hyderabad 4.00 pm
b) Special resolutions All resolutions moved at the last Annual General Meeting were passed by a show of hands by the requisite
majority of members attending the meeting. The following are the special resolutions passed at the previous General meetings held in the last three years:
AGM/EGMheld on
Whether special resolution passed Summary of the resolution
July 23, 2012 No -NA-
September 12, 2011 YesSpecial resolution passed for keeping the Register of members and index of members at the office of the Registrar and Share Transfer Agents
July 29, 2010 No -NA-
c) Postal ballot The Company has issued notice for the Postal Ballot on February 9, 2013, to the shareholders pursuant to
Section 192A (2) of the Companies Act, 1956, read along with Companies (Passing of Resolution by Postal Ballot) Rules, 2001, seeking their approval by means of postal ballot for the purpose of:

63
1. Providing Corporate Guarantee/ security to the Subsidiary Companies Pennar Engineered Building Systems Limited and Pennar Enviro Limited and making Loans/Investment in Pennar Engineered Building Systems Limited and Pennar Enviro Limited.
2. Alteration of Main objects in the Memorandum of Association of the Company.
3. Alteration of Ancillary objects in the Memorandum of Association of the Company.
4. Alteration of Articles of Association of the Company.
Mr. S Chidambaram, Practicing Company Secretary, Hyderabad, was appointed as Scrutiniser for conducting the Postal Ballot voting process in a fair and transparent manner. The Chairman after receiving the Scrutiniser’s Report announced on April 6, 2013, that the Resolutions of the Postal Ballot Notice was duly passed as special resolution by the requisite majority.
The results are as follows:
Sl. No
Particulars No. of shareholders
No. of Equity shares
% to the total no. of equity shares for which postal ballot
forms were received
1 Total Postal Ballot forms received 54 3,95,58,923 100
2 Total no. of votes polled in favour of the resolution
41 3,94,93,114 99.83
3 Total no. of votes polled against the resolution
0 0 0
4 Total no. of votes polled neutral/invalid to the resolution
13 65,809 0.17
Presently, the Company is not proposing to pass any special resolution through postal ballot. d) Procedure for postal ballot - Not applicable. e) Information on Directors re-appointment as required under Clause 49 VI (G) of the Listing Agreement with
stock exchanges is given as a note appended to the explanatory statement of the AGM notice.
7. Disclosures
a) Related Party Transactions: No transaction of material nature was entered in to by the Company with the related parties i.e, Directors or
the management, their subsidiaries or relatives conflicting with the Company’s interest. Transactions with the related parties are disclosed in notes to accounts in the Annual Report.
b) Disclosure of Accounting Treatment: The Company has followed the accounting standards notified under Companies (Accounting Standards)
Rules, 2006 in the preparation of its financial statements.
c) Details of non-compliance etc There has been no instance of non-compliance with any legal requirements nor have there been any
strictures imposed by any stock exchange, SEBI on any matters relating to the capital market over the last three years. A Statement of Compliance with all laws and regulations as certified by the President & CEO and V.P Finance and Company Secretary is placed at periodic intervals for review by the Board.

64
d) Whistle Blower Policy: The Company has not established a whistle blower policy. We further affirm that during the
year 2012-13 no personnel have been denied access to the Audit Committee.
e) Code of Conduct The Company has adopted the Code of Conduct which is applicable to the members of the Board and
top management of the Company. The Code of Conduct is available on the Company’s website.
f) Proceeds from public issues, rights issues, preferential issues etc., During the financial year ended March 31, 2013, there were no proceeds from public issues,
rights issues, preferential issues, among others.
g) Details of compliance with mandatory requirements and adoption of the non-mandatory requirements of this clause.
The Company has complied with all the mandatory requirements of the Clause 49 of the Listing Agreement.
Compliance with Non-Mandatory requirements: We comply with the following non-mandatory requirements:
(i) The Board – We also ensure that the persons who are being appointed as an Independent Director has the requisite qualifications and experience which would be of use to the Company and contribute effectively to the Company.
(ii) Remuneration Committee – We have constituted a Remuneration Committee. A detailed note on it is provided in the Remuneration Committee section.
(iii) Shareholder Rights – The Company publishes its results on its website i.e, www.pennarindia.com which is accessible to the public at large. A half-yearly declaration of financial performance including summary of the significant events is presently not being sent to each household of shareholders. The Company’s results for each quarter are published in an English newspaper having a wide national circulation and also in a Telugu newspaper having a wide circulation in Andhra Pradesh. Hence, half-yearly results are not sent to the shareholders individually.
(iv) Audit qualifications – During the period under review, there is no audit qualification in Company’s financial statements.
The Company continues to adopt best practices to ensure regime of unqualified financial statements.
(v) Training of Board members – The Company is yet to evolve a plan to train the Board members.
(vi) Mechanism for evaluating Non-Executive Board members – Yet to evolve
As regards other non-mandatory requirements, the Board has taken cognizance of the same and may consider adopting them as and when deemed appropriate.
65
The Company has not yet adopted the CORPORATE GOVERNANCE VOLUNTARY GUIDELINES, 2009. The Board will adopt the same as and when deemed appropriate.
8. Means of communication
The quarterly/half-yearly/annual financial results of the Company are sent to the stock exchanges immediately after they are approved by the Board.
The quarterly/half-yearly/annual financial results of the Company are published in Business Standard and Surya within 48 hours of the conclusion of the Board meeting.
The Company’s website www.pennarindia.com contains a separate dedicated section “Investors” where latest information for shareholders is available. The quarterly/halfyearly/annual financial results of the Company are simultaneously posted on the website. The Company’s website also displays official news releases related to the activities of the Company.
Presentations were made to analysts during the financial year 2012-13.
General information
1. Date, time and venue of Annual General Meeting July 31, 2013 at 10.00 A.M. at Aditya Sarovar Premiere, Hitec city, Gachibowli, Hyd-32
2. Financial calendar (Tentative schedule)
Financial year : April 1 to March 31: Board meetings for approval of quarterly results:1st Quarter ended on June 30, 2013: August 7, 20132nd Quarter ended on September 30, 2013: November 6, 2013 3rd Quarter ended on December 31, 2013: February 5, 2014
Annual results for financial year ended March 31, 2014 (audited): May 7, 2014
Annual general meeting for the year 2013-14 : In accordance with Section 166 of Companies Act, 1956
3. Date of book closure July 23, 2013
4. Dividend payment due August 29, 2013
5. Listing on stock exchanges The Bombay Stock Exchange LimitedP. J. Towers, Dalal Street, Mumbai – 400001
The National Stock Exchange of India LimitedExchange Plaza, Plot no. C/1, G Block, Bandra-Kurla Complex, Bandra (E), Mumbai – 400051
MCX Stock Exchange Limited 2nd Floor, Exchange Square Suren Road, Chakala, Andheri (East), Mumbai – 400 093
Note: The equity shares of the Company were listed on MCX Stock Exchange Limited with effect from May 03, 2013.
66
6. Stock Code BSE: Equity- 5132280.01% cumulative redeemable preference shares- 700107
NSE EQUITY:PENIND
MCX EQUITY: PENIND
7. Electronic connectivity 1. The National Securities Depository LtdTrade World, Kamala Mills Compound,Senapati Bapat Marg, Lower Parel
Mumbai – 4000132. Central Depository Services (India) Ltd
Phiroze Jeejeebhoy Towers, 28th FloorDalal Street, Mumbai – 400023
8. Registered Office (address for correspondence)
Floor No. 3, DHFLVC Silicon Towers, Kondapur, Hyderabad - 500084 A.P. India,Tel.No: +91 40 400061621/22/23/24 Fax No: +91 40 40061618 E-mail:[email protected], [email protected]
9. Communication regarding share transfers and other related correspondence
Karvy Computershare Pvt Ltd Plot no. 17-24, Vithalrao Nagar, Madhapur, Hyderabad - 500081, Phone: 040 23420818 – 828, Fax: 040 23420814 E-mail: [email protected]/[email protected]
Note: Shareholders holding shares in electronic mode should address all correspondence to their respective depository participants
10. Share transfer system Shares lodged for physical transfer at the Registrar’s address are normally processed within a period of 15 days from the date of lodging, if the documents are clear in all respects. The shares duly transferred would be dispatched to the concerned shareholders within a week from the date of approval of transfers by the Share Transfer Committee.
9. As required under Clause 49 of the Listing Agreement, a certificate duly signed by Mr. Suhas Baxi, President & CEO, and Mr. R Ravi, V. P. Finance and Company Secretary was placed at the meeting of the Board of Directors held on May 10, 2013
10. Distribution of shareholding as on March 31, 2013 was as under
upto 1 - 1000 24403 91.93 4,940,551 4.05
1001 - 2000 899 3.39 1,389,986 1.14
2001 - 4000 475 1.79 1,405,338 1.15
4001 - 6000 266 1.00 1,322,321 1.08
6001 - 8000 76 0.29 529,816 0.43
8001 - 10000 91 0.34 864,086 0.71
10001 - 20000 137 0.52 1,994,805 1.63
20001 & ABOVE 199 0.75 109,577,097 89.80
Total: 26,546 100.00 12,202,4000 100.00

67
Shareholding Pattern as on March 31, 2013 was as under
Sl. No
Particulars No. of Shares % to total shares
1 Promoter and Promoter Group 4,90,01,040 40.16
2 Mutual Funds/ UTI 950 –
3 Financial Institutions/Banks 8,16,344 0.67
4 Foreign Institutional Investors 2,68,04,684 21.97
5 Foreign Funds 87,11,854 7.14
6 Bodies Corporate 1,32,64,262 10.87
7 Individuals 2,21,87,691 18.18
8 Trust 5,955 –
9 NRI 12,14,083 0.99
10 Clearing Members 17,137 0.01
Total 12,20,24,000 100.00
11. Dematerialisation of shares and liquidity
a) Equity shares The Company’s equity shares are in compulsory demat list. The International Securities Identification Number
(ISIN) allotted to the Company’s scrip is INE932A01024. 98.23% of equity shares are held in dematerialised form as on March 31, 2013.
b) Preference shares The Company’s 0.01% cumulative redeemable preference shares issued as per the scheme of reconstruction
and arrangement approved by Hon’ble High court of Andhra Pradesh are listed on the Bombay Stock Exchange. International Securities Identification Number (ISIN) allotted to these preference shares is INE932A04010. 84.60% of 0.01% cumulative redeemable preference shares are held in dematerialised form as on March 31, 2013.
c) Outstanding GDR/ADR/Warrants or any convertible instruments, conversion date and likely impact on equity. During the financial year 2012-13, the Company has not issued any GDR /ADR and there are no outstanding
warrants or any convertible instruments.
12. Plant locations
a) Patancheru unit : IDA, Patancheru, Medak (Dist.), A.P. b) Isnapur unit : Isnapur Village, Medak (Dist.), A.P. c) Chennai unit : Kannigaipair Village, Thiruvellore Dist, T.N. d) Tarapur unit : MIDC, Tarapur, Maharashtra e) Hosur unit : SIDCO Industrial Estate, Hosur, T.N.
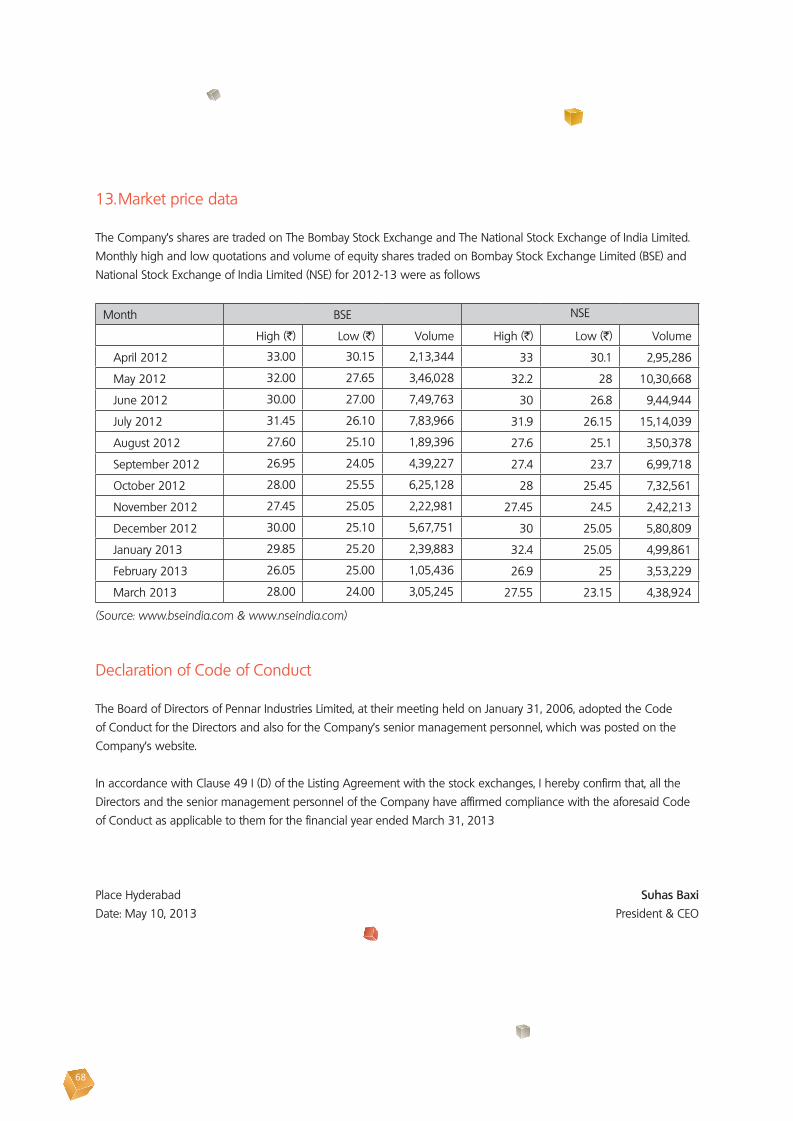
68
13. Market price data
The Company’s shares are traded on The Bombay Stock Exchange and The National Stock Exchange of India Limited.Monthly high and low quotations and volume of equity shares traded on Bombay Stock Exchange Limited (BSE) and National Stock Exchange of India Limited (NSE) for 2012-13 were as follows
Month BSE NSE
High (`) Low (`) Volume High (`) Low (`) Volume
April 2012 33.00 30.15 2,13,344 33 30.1 2,95,286
May 2012 32.00 27.65 3,46,028 32.2 28 10,30,668
June 2012 30.00 27.00 7,49,763 30 26.8 9,44,944
July 2012 31.45 26.10 7,83,966 31.9 26.15 15,14,039
August 2012 27.60 25.10 1,89,396 27.6 25.1 3,50,378
September 2012 26.95 24.05 4,39,227 27.4 23.7 6,99,718
October 2012 28.00 25.55 6,25,128 28 25.45 7,32,561
November 2012 27.45 25.05 2,22,981 27.45 24.5 2,42,213
December 2012 30.00 25.10 5,67,751 30 25.05 5,80,809
January 2013 29.85 25.20 2,39,883 32.4 25.05 4,99,861
February 2013 26.05 25.00 1,05,436 26.9 25 3,53,229
March 2013 28.00 24.00 3,05,245 27.55 23.15 4,38,924
(Source: www.bseindia.com & www.nseindia.com)
Declaration of Code of Conduct
The Board of Directors of Pennar Industries Limited, at their meeting held on January 31, 2006, adopted the Code of Conduct for the Directors and also for the Company’s senior management personnel, which was posted on the Company’s website.
In accordance with Clause 49 I (D) of the Listing Agreement with the stock exchanges, I hereby confirm that, all the Directors and the senior management personnel of the Company have affirmed compliance with the aforesaid Code of Conduct as applicable to them for the financial year ended March 31, 2013
Place Hyderabad Suhas BaxiDate: May 10, 2013 President & CEO
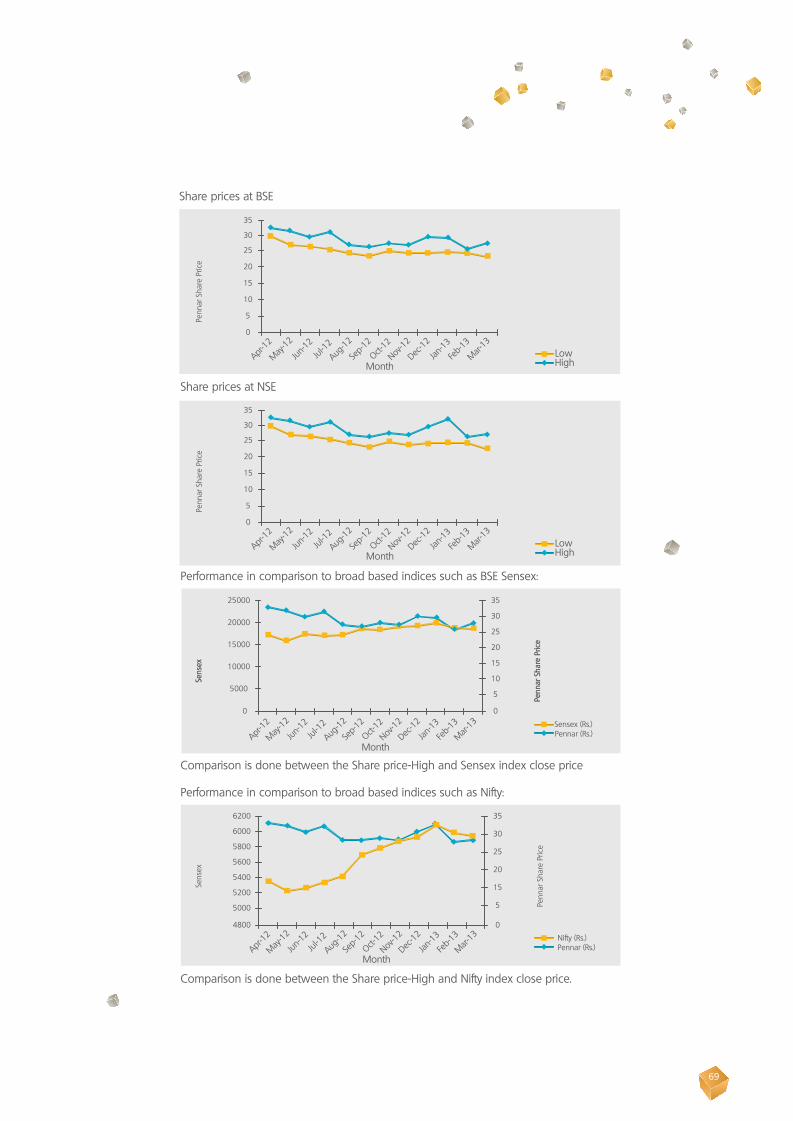
69
Apr-12
May-12
Jun-12
Jul-12
Aug-12
Sep-1
2
Oct-12
Nov-12
Dec-12
Jan-13
Feb-1
3
Mar-13
Share prices at BSEPe
nnar
Sha
re P
rice
35
30
25
20
15
10
5
0
MonthLowHigh
Apr-12
May-12
Jun-12
Jul-12
Aug-12
Sep-1
2
Oct-12
Nov-12
Dec-12
Jan-13
Feb-1
3
Mar-13
Share prices at NSE
Penn
ar S
hare
Pric
e
35
30
25
20
15
10
5
0
Month
Apr-12
May-12
Jun-12
Jul-12
Aug-12
Sep-1
2
Oct-12
Nov-12
Dec-12
Jan-13
Feb-1
3
Mar-13
Performance in comparison to broad based indices such as BSE Sensex:
Comparison is done between the Share price-High and Sensex index close price
Penn
ar S
hare
Pric
e
Pennar (Rs.)
Sens
ex
Penn
ar S
hare
Pric
e
Sens
ex
25000 35
30
25
20
15
10
5
0
20000
15000
10000
5000
0
Month
Sensex (Rs.)
Apr-12
May-12
Jun-12
Jul-12
Aug-12
Sep-1
2
Oct-12
Nov-12
Dec-12
Jan-13
Feb-1
3
Mar-13
Comparison is done between the Share price-High and Nifty index close price.
Performance in comparison to broad based indices such as Nifty:
Penn
ar S
hare
Pric
e
Sens
ex
6200 35
30
25
20
15
5
0
6000
5800
5600
5400
5200
5000
4800
MonthPennar (Rs.)Nifty (Rs.)
LowHigh
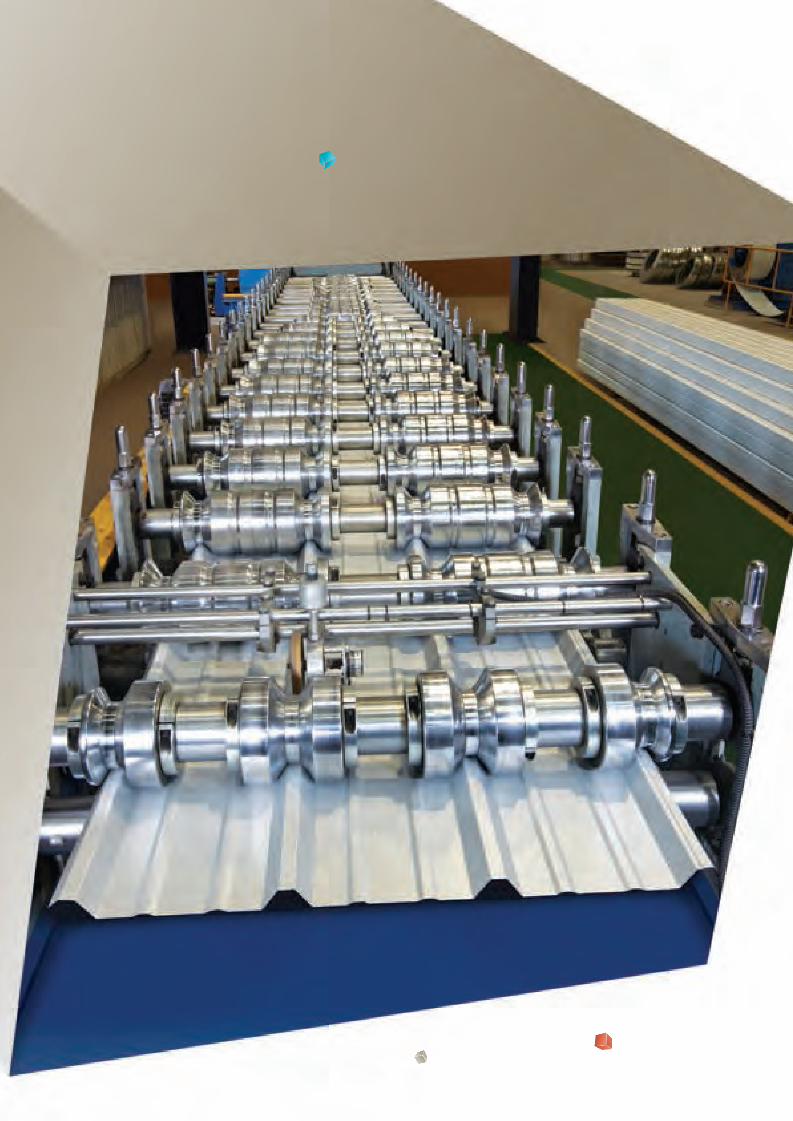
70

71
Secretarial Audit ReportPennar Industries LimitedFloor No.: 3, DHFLVC Silicon Towers,Kondapur,Hyderabad – 500 084
I have examined the registers, records, books and papers of Pennar Industries Limited as required to be maintained under the Companies Act, 1956 (the Act) and the rules made there under and also the provisions contained in the Memorandum and Articles of the Company for the financial year ended on 31st March, 2013. In my opinion and to the best of my information and according to the examinations carried out by me and explanations furnished to me by the company, its officers and agents, according to the provisions of:
The Companies Act, 1956;
The Depositories Act, 1996 and the Regulations and Bye-laws framed under that Act;
The Securities and Exchange Board of India (Substantial Acquisition of Shares and Takeovers) 2011;
The Securities and Exchange Board of India (Prohibition of Insider Trading) Regulations, 1992;
The Securities and Exchange Board of India (Employee Stock Option Scheme and Employee Stock Purchase Scheme) Guidelines, 1999 and
The Equity Listing Agreements with Bombay Stock Exchange Limited and National Stock Exchange of India Limited
I report the following
1. The Company :
(a) has maintained various statutory registers and documents;
(b) has closed its Register of Members during the Financial Year for the purpose of Annual General Meeting and Dividend;
(c) has filed Forms, returns, documents and resolutions required to be filed with the Registrar of Companies and Central Government;
(d) has duly conducted Board meetings/Committee Meetings;
(e) has sent the notices as required to its Members;
(f) has duly conducted the Annual General Meeting on 23.07.2012;
(g) has maintained minutes of proceedings of Board Meetings/Committee Meetings and General Meetings;
(h) has complied with all the applicable provisions with regard to constitution of the Board of Directors / Committee(s) of directors and appointment, retirement and their re-appointment including that of Managing Director/Whole-time Directors;
(i) has complied with all the applicable provisions with regard to payment of remuneration to the Directors including the Managing Director and Whole-time Directors;
(j) has complied with all the applicable provisions with regard to appointment and remuneration of Auditors;
(k) has delegated power to the committee to process and approve the transfers and transmissions of the Company’s shares;
(l) during the period under review the Company has not allotted any shares.

72
(m) has complied with the provisions of the Companies Act, with regard to declaration and payment of dividends;
(n) has complied with the provisions of Section 372A of the Companies Act, 1956;
2. I further report that:
(a) the Directors have complied with the requirements as to disclosure of interests and concerns in contracts and arrangements, shareholdings / debenture holdings and directorships in other companies and interests in other entities;
(b) the Directors have complied with the disclosure requirements in respect of their eligibility of appointment, their being independent and compliance with the code of Business Conduct & Ethics for Directors and Management Personnel as per Clause 49 of the Listing Agreement;
(c) there was no prosecution initiated against or show cause notice received by the Company and no fines or penalties were imposed on the Company during the year under review under the Companies Act, SEBI Act, SCRA, Depositories Act, Listing Agreement and Rules, Regulations and Guidelines framed under these Acts against the Company, its Directors and Officers;
3. I further report that the Company has complied with the provisions of the Depositories Act, 1996 and the Bye-laws framed thereunder by the Depositories with regard to dematerialisation / rematerialisation of securities and reconciliation of records of dematerialised securities with all securities issued by the Company.
4. I further report that:
(a) the Company has filed the requisite returns, documents, information as per the requirements under the Equity Listing Agreements entered into with the Bombay Stock Exchange Limited and the National Stock Exchange of India Limited;
(b) the Company has duly complied with the provisions of the Securities and Exchange Board of India (Substantial Acquisition of Shares and Takeovers) Regulations, 2011;
(c) the Company has filed returns, documents, information as required under the provisions of the Securities and Exchange Board of India (Prohibition of Insider Trading) Regulations, 1992;
Place: Hyderabad S. ChidambaramDate: May 10, 2013 Practicing Company Secretary
C P No: [email protected]
73
Auditor’s Certificate on Compliance with the Provision of Corporate Governance Pursuant to Clause 49 of the Listing Agreement
ToThe MembersPENNAR INDUSTRIES LIMITEDHYDERABAD.
We have examined the compliance of conditions of Corporate Governance by PENNAR INDUSTRIES LIMITED for the year ended on 31st March, 2013, as stipulated in Clause 49 of the Listing Agreement of the said Company with Stock Exchanges.
The Compliance of conditions of Corporate Governance is the responsibility of the management. Our examination has been in the manner described in the Guidance Note on Certification of Corporate Governance issued by the Institute of Chartered Accountants of India and has been limited to a review of the procedures and implementation thereof adopted by the company for ensuring compliance with the conditions of Corporate Governance as stipulated in the said Clause. It is neither an audit nor an expression of opinion on the financial statements of the Company.
In our opinion and to the best of our information and according to explanations given to us, and based on our reliance upon the representations made by the management, we certify that the company has complied
in all material respects with the conditions of the Corporate Governance as stipulated in the Listing Agreement.
As required by the Guidance Note issued by the Institute of Chartered Accountants of India, we have to state that no investor grievances were pending for a period of one month against the Company as per the records maintained by the Shareholders/ Investor’s Grievance Committee.
We further state that such compliance is neither an assurance as to the future viability of the Company nor the efficiency or effectiveness with which the management has conducted the affairs of the Company.
For RAMBABU & Co., Chartered Accountants Firm Reg. No: 002976S
RAVI RAMBABU Place: Hyderabad PartnerDate: 10th May, 2013 Membership. No. 18541

74
To the Members of Pennar Industries Limited.
Report on Financial Statements
We have audited the accompanying financial statements of M/s. PENNAR INDUSTRIES LIMITED (“the Company”), which comprise the Balance Sheet as at March 31, 2013, and the Statement of Profit and Loss and Cash Flow Statement for the year then ended, and a summary of significant accounting policies and other explanatory information.
Managements Responsibility for the Financial Statements
Management is responsible for the preparation of these financial statements that give a true and fair view of the financial position, financial performance and cash flows of the Company in accordance with the Accounting Standards referred to in sub-section (3C) of section 211 of the Companies Act, 1956 (“the Act”).
This responsibility includes the design, implementation and maintenance of internal control relevant to the preparation and presentation of the financial statements that give a true and fair view and are free from material misstatement, whether due to fraud or error.
Auditor’s Responsibility
Our responsibility is to express an opinion on these financial statements based on our audit. We conducted our audit in accordance with the Standards on Auditing issued by the Institute of Chartered Accountants of India. Those Standards require that we comply with ethical requirements and plan and perform the audit to obtain reasonable assurance about whether the financial statements are free from material misstatement.An audit involves performing procedures to obtain audit evidence about the amounts and disclosures in the financial statements. The procedures selected depend on the auditor’s judgment, including the assessment of the risks of material misstatement of
75
the financial statements, whether due to fraud or error. In making those risk assessments, the auditor considers internal control relevant to the Company’s preparation and fair presentation of the financial statements in order to design audit procedures that are appropriate in the circumstances. An audit also includes evaluating the appropriateness of accounting policies used and the reasonableness of the accounting estimates made by management, as well as evaluating the overall presentation of the financial statements.
We believe that the audit evidence we have obtained is sufficient and appropriate to provide a basis for our audit opinion.
Opinion
In our opinion and to the best of our information and according to the explanations given to us, the financial statements give the information required by the Act in the manner so required and give a true and fair view in conformity with the accounting principles generally accepted in India:
a) In the case of the Balance Sheet, of the state of affairs of the Company as at March 31, 2013;
b) In the case of the Statement of Profit and Loss, of the profit for the year ended on that date; and
c) In the case of the Cash Flow Statement, of the cash flows for the year ended on that date.
1. As required by the Companies (Auditor’s Report) Order, 2003 (“theOrder”) issued by the Central Government of India in terms of sub-section (4A) of section 227 of the Act, we give in the Annexure a statement on the matters specified in paragraphs 4 and 5 of the Order.
2. As required by section 227(3) of the Act, we report that:
a) We have obtained all the information and explanations which to the best of our knowledge and belief were necessary for the purpose of our audit;
b) In our opinion proper books of account as required by law have been kept by the Company so far as appears from our examination of those books.
c) The Balance Sheet, Statement of Profit and Loss, and Cash Flow Statement dealt with by this Report are in agreement with the books of account.
d) In our opinion, the Balance Sheet, Statement of Profit and Loss, and Cash Flow Statement comply with the Accounting Standards referred to in subsection (3C) of section 211 of the Companies Act, 1956;
e) On the basis of written representations received from the directors as on March 31, 2013, and taken on record by the Board of Directors, none of the directors is disqualified as on March 31, 2013, from being appointed as a director in terms of clause (g) of sub-section (1) of section 274 of the Companies Act, 1956.
RAMBABU & Co. Chartered Accountants Firm Reg No: 002976S
Ravi RambabuPlace: Hyderabad PartnerDate: 12-05-2013 M No. : 018541
76
1. In respect of Fixed Assets:
(a) The company has maintained proper records showing full particulars including quantitative details and situation of its fixed assets.
(b) As explained to us, fixed assets have been physically verified by the management in a phased periodical manner, which in our opinion is reasonable having regard to the size of the company and nature of its assets. No material discrepancies were noticed on such verification.
(c) In our opinion, the company has not disposed off a substantial part of its fixed assets during the year and the going concern status of the company is not affected.
2. In respect of its inventories
(a) As explained to us, inventories have been physically verified during the year by the management at regular intervals. In our opinion, the frequency of verification is reasonable.
(b) In our opinion and according to the information and explanations given to us, the procedures of physical verification of inventories followed by the management are reasonable and adequate in relation to the size of the company and the nature of its business.
(c) The company has maintained proper records of inventories. In our opinion and according to the information and explanations given
to us, the discrepancies noticed on physical verification as compared to the book records.
3. In respect of the loans, secured or unsecured granted or taken by the company to/or from companies, or other parties covered in the register maintained under section 301 of the Companies Act,1956:
(a) According to the information and explanations given to us and on the basis of our examination of the books of account, the Company has not granted any loans, secured or unsecured, to companies, firms or other parties listed in the register maintained under Section 301 of the Companies Act, 1956. Consequently, the provisions of clauses iii (b), iii(c) and iii (d) of the order are not applicable to the Company.
(b) According to the information and explanations given to us and on the basis of our examination of the books of account, the Company has not taken loans from companies, firms or other parties listed in the register maintained under Section 301 of the Companies Act, 1956. Thus sub clauses (f) & (g) are not applicable to the company.
4. In our opinion and according to the information and explanations given to us, there is generally an adequate internal control procedure commensurate with the size of the company and the nature of its business, for the purchase of inventories & fixed assets and payment for expenses & for sale of goods. During the course of our audit, we have not observed any continuing failure to correct major weaknesses in the internal control system.
The Annexure referred to in paragraph 1 of the Our Report of even date to the members of Pennar Industries Limited on the accounts of the company for the year ended 31st March, 2013.

77
5. In respect of contracts or arrangements preferred to in Section 301 of the Companies Act, 1956:
(a) In our opinion and according to the information and explanations given to us, the transactions made in pursuance of contracts or arrangements, that needed to be entered into the register maintained under section 301 of the Companies Act, 1956 have been so entered.
(b) In our opinion and according to the information and explanations given to us, the transactions made in pursuance of contracts or arrangements entered in the register maintained under section 301 of the Companies Act, 1956 and exceeding the value of ` 5,00,000/- in respect of each party covered above during the year have been made at prices which appear reasonable as per information available with the Company.
6. According to the information and explanations given to us, the Company has not accepted any deposits from the public covered under section 58A and 58AA of the Companies Act, 1956.
7. In our opinion, the Company has an internal audit system commensurate with its size and the nature of its business.
8. We have broadly reviewed the cost records
maintained by the Company pursuant to the Companies (Cost Accounting Records) Rules, 2011 prescribed by the Central Government under
Section 209(d)(1) of the Act and we are of the opinion that prima facie the prescribed accounts and records have been made and maintained. We have, however, not made a detailed examination of the cost records with a view to determine whether they are accurate or complete.
9. In respect of statutory dues:
(a) According to the records of the company, undisputed statutory dues including Provident Fund, Investor Education and Protection Fund, Employees’ State Insurance, Income-tax, Sales-tax, Wealth Tax, Service Tax, Custom Duty, Excise Duty, cess to the extent applicable and any other statutory dues have generally been regularly deposited with the appropriate authorities. According to the information and explanations given to us there were no outstanding statutory dues as on 31st of March, 2013 for a period of more than six months from the date they became payable.
(b) According to the information and explanations given to us, there is no amounts payable in respect of income tax, wealth tax, service tax, sales tax, customs duty and excise duty which have not been deposited on account of any disputes.
(c) According to the information and explanations given to us, an amount of ` 209.70 lakhs of Sales tax, Customs duty, and interest which have not been deposited on account of dispute as given below:
S.no Name of the Statute Nature of the dues Forum where dispute is pending
Amount.
(` In Lakhs)
Deposit Amount(` in Lakhs)
Unpaid Deposit Amount
(` in Lakhs)
1 Customs Act,1962 Interest on Customs Duty Paid
The Commissioner of Custom(Appeals)
44.70 – 44.70
2 A.P. VAT Act,2005 Entry Tax on Cix The Supreme Court of India
218.60 54.0 165.00
Total 263.30 54.0 209.70

78
10. The Company does not have any accumulated losses at the end of the financial year. The Company has not incurred cash losses during the financial year covered by the audit and in the immediately preceding financial year.
11. Based on our audit procedures and according to the information and explanations given by the management, we are of the opinion that, the Company has not defaulted in repayment of dues to financial institutions, bank and debenture holders.
12. In our opinion and according to the explanations given to us and based on the information available, no loans and advances have been granted by the company on the basis of security by way of pledge of shares, debentures and other securities.
13. In our opinion, the Company is not a chit fund or a nidhi /mutual benefit fund/society. Therefore, the provision of this clause of the Companies (Auditor’s Report) Order, 2003 (as amended) is not applicable to the Company.
14. In our opinion, the Company is not dealing in or trading in Shares, securities, debentures, mutual funds & other Investments.Accordingly, the provisions of clause 4(xiii) of the companies (Auditor’s Report) order, 2003 are not applicable to the company.
15. According to the information and explanations given to us, the Company has given any 1 guarantees for loan taken by the Pennar Engineered Building Systems Ltd (PEBSL) from state bank of India to the tune of ` 16,826 Lakhs and further the company has provided collateral security by way of lien on fixed deposits of ` 200 Lakhs and pledge of 61,50,000 shares of Pennar Engineered Building Systems Limited amounting to ` 615 Lakhs for securing the said Loan.
16. Based on the information given by the management, we report that the company has not raised any term loans during the year.
17. In our opinion, according to the information and explanations given to us and on an overall examination of the Balance Sheet of the Company as at 31st March, 2013, we report that no funds raised on short-term basis have been used for long-term investment by the Company.
18. Based on the audit procedures performed and the information and explanations given to us by the management, we report that the Company has not made any preferential allotment of shares during the year.
19. According to the information and explanations given to us, the Company has not issued debentures during the period covered by our report. Hence, the Company is not required to create or register or modify any security or charge.
20. The Company has not raised any money by public issue during the year.
21. Based on the audit procedures performed and the information and explanations given to us, we report that no material fraud on or by the Company has been noticed or reported during the year, nor have we been informed of such case by the management.
RAMBABU & Co. Chartered Accountants Firm Reg No: 002976S
Ravi RambabuPlace: Hyderabad PartnerDate: 12-05-2013 M No. : 018541

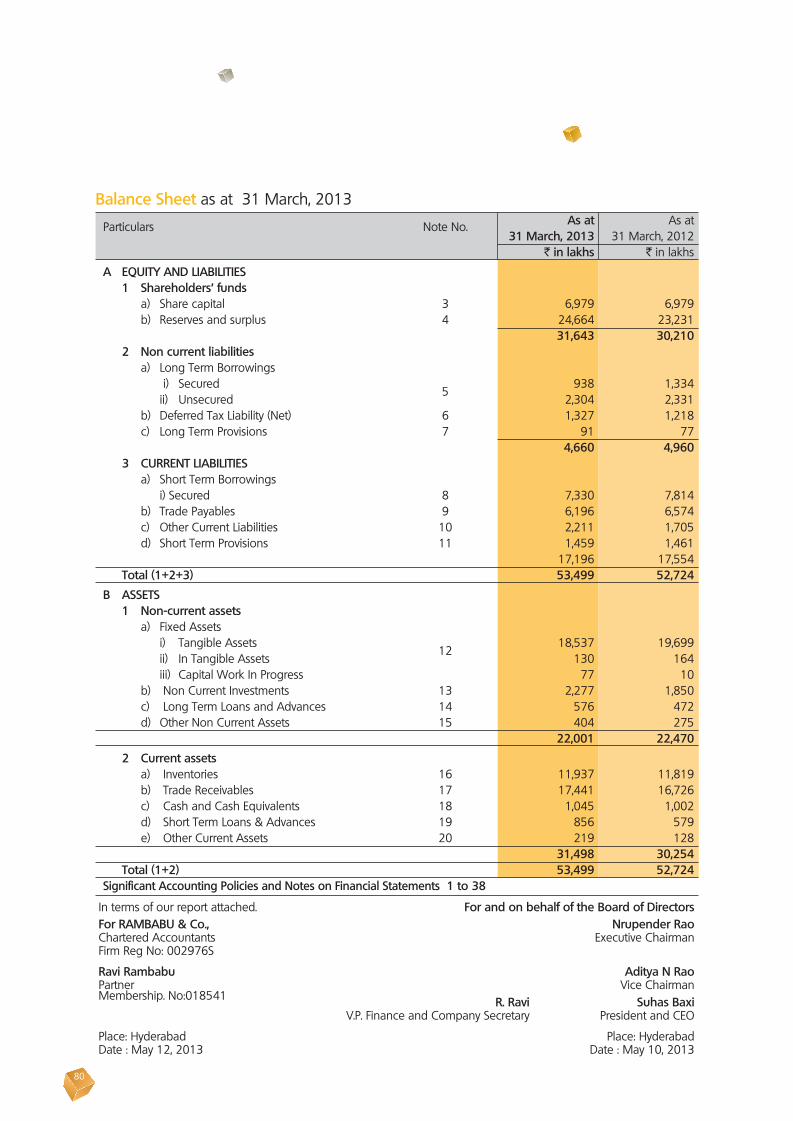
80
Balance Sheet as at 31 March, 2013 Particulars Note No. As at As at 31 March, 2013 31 March, 2012 ` in lakhs ` in lakhs
A EQUITY AND LIABILITIES 1 Shareholders’ funds a) Share capital 3 6,979 6,979 b) Reserves and surplus 4 24,664 23,231 31,643 30,210 2 Non current liabilities a) Long Term Borrowings i) Secured
5 938 1,334
ii) Unsecured 2,304 2,331 b) Deferred Tax Liability (Net) 6 1,327 1,218 c) Long Term Provisions 7 91 77 4,660 4,960 3 CURRENT LIABILITIES a) Short Term Borrowings i) Secured 8 7,330 7,814 b) Trade Payables 9 6,196 6,574 c) Other Current Liabilities 10 2,211 1,705 d) Short Term Provisions 11 1,459 1,461 17,196 17,554 Total (1+2+3) 53,499 52,724
B ASSETS 1 Non-current assets a) Fixed Assets i) Tangible Assets
12 18,537 19,699
ii) In Tangible Assets 130 164 iii) Capital Work In Progress 77 10 b) Non Current Investments 13 2,277 1,850 c) Long Term Loans and Advances 14 576 472 d) Other Non Current Assets 15 404 275 22,001 22,470
2 Current assets a) Inventories 16 11,937 11,819 b) Trade Receivables 17 17,441 16,726 c) Cash and Cash Equivalents 18 1,045 1,002 d) Short Term Loans & Advances 19 856 579 e) Other Current Assets 20 219 128 31,498 30,254 Total (1+2) 53,499 52,724 Significant Accounting Policies and Notes on Financial Statements 1 to 38
In terms of our report attached. For and on behalf of the Board of DirectorsFor RAMBABU & Co., Nrupender Rao Chartered Accountants Executive ChairmanFirm Reg No: 002976S
Ravi Rambabu Aditya N Rao Partner Vice Chairman Membership. No:018541 R. Ravi Suhas Baxi V.P. Finance and Company Secretary President and CEO
Place: Hyderabad Place: Hyderabad Date : May 12, 2013 Date : May 10, 2013

81
Statement of Profit and Loss for the year ended 31 March, 2013 Particulars Note No. For the year ended for the year ended 31 March, 2013 31 March, 2012 ` in lakhs ` in lakhs
1 Revenue from operations 21 84,806 97,654 2 Other Income 22 87 103 3 Total Revenue (1 + 2) 84,893 97,757
4 Expenditure : a) Raw Material Consumed 23 61,005 71,961 b) Change in Inventories 24 65 (1,392) c) Manufacturing Expenses 25 8,031 7,723 d) Employee Benefits Expense 26 4,212 3,852 e) Other Expenses 27 3,408 3,688 76,721 85,832
Profit before Interest, Depreciation & Tax 8,172 11,925 Finance Cost 28 1,971 1,999 Depreciation and amortisation expense 1,492 1,417 3,463 3,416
Profit before Tax 4,709 8,509 5 Tax Expenses a) Current Tax 1,486 2,850 b) Deferred Tax 109 233 1,595 3,083
Net Profit after Tax 3,114 5,426
Earning Per Share (having a face value of ` 5 each) - Basic and Diluted 29 2.55 4.45
Significant Accounting Policies and Notes on Financial Statements 1 to 38
In terms of our report attached. For and on behalf of the Board of DirectorsFor RAMBABU & Co., Nrupender Rao Chartered Accountants Executive ChairmanFirm Reg No: 002976S
Ravi Rambabu Aditya N Rao Partner Vice Chairman Membership. No:018541 R. Ravi Suhas Baxi V.P. Finance and Company Secretary President and CEO
Place: Hyderabad Place: Hyderabad Date : May 12, 2013 Date : May 10, 2013

82
Cash Flow statement for the year ended 31st March, 2013 Particulars For the year ended for the year ended 31 March, 2013 31 March, 2012 ` in lakhs ` in lakhs
A. Cash flow from operating activities : Net Profit Before Tax 4,709 8,509 Add : Depreciation 1,492 1,417 Add : Finance Cost 1,971 1,999 Add: Bad Debts written off – 18 Less: Interest Received – (35) Less: Rent Received (13) (13) Less : Proceeding from sale of fixed assets (8) (–) Operating Profit before working capital changes 8,151 11,895
Adjustment for: Trade receivables (715) (1,894) Inventories (118) (1,430) Loans and Advances & other assets (531) 231 Trade payables and Other Payables 193 2,881 (1,171) (212) Cash Generated From Operation 6,980 11,683 Less : Income Tax Paid (1,590) (3,499) Net cash from operating activities “A“ 5,390 8,185
B. Cash Flows from Investing activities : Purchase of fixed assets (657) (5,254) Proceedings from sale of fixed assets 8 – Investment in Subsidiary - Pennar Enviro Limited (406) – Share Application Money – Pennar Enviro Limited – (21) Interest Received – 35 Rent Received 13 13 Net cash used in investing activities “B“ (1,042) (5,228) C. Cash Flows from Financing activities : Proceeds from Long Term Borrowings – 1,500 Repayment of Long Term Borrowings (457) (384) Net increase/(decrease) of working capital borrowings (484) (992)
Finance Cost (1,971) (1,999) Dividends paid (1,418) (1,064) Net Cash used in financing activities “C“ (4,330) (2,939)
Net ( Decrease ) / Increase in Cash and Cash Equivalents (A+B+C) 18 18 Cash and Cash Equivalents at the beginning 548 530 Cash and Cash Equivalents at the end 566 548
In terms of our report attached. For and on behalf of the Board of DirectorsFor RAMBABU & Co., Nrupender Rao Chartered Accountants Executive ChairmanFirm Reg No: 002976S
Ravi Rambabu Aditya N Rao Partner Vice Chairman Membership. No:018541 R. Ravi Suhas Baxi V.P. Finance and Company Secretary President and CEO
Place: Hyderabad Place: Hyderabad Date : May 12, 2013 Date : May 10, 2013
83
1 Corporate information
Pennar Industries Limited is a multi-location, multi-product company manufacturing Cold Rolled Steel Strips, Precision Tubes, Cold Rolled Formed Sections, Electro Static Precipitators, Profiles, Railway Wagons and Coach Components, Press Steel Components and Road Safety Systems. Pennar Industries Limited has manufacturing facilities at Patancheru and Isnapur ( in A.P.), Chennai and Hosur (Tamil Nadu ) Tarapur (Maharashtra).
2 Significant accounting policies and practices
2.1 Accounting Conventions :
The financial statements have been prepared under the historical cost conventions in accordance with the generally accepted accounting principles in India including the Accounting Standards notified by the Government of India and issued by the Institute of Chartered Accountants of India, as applicable, and the provisions of the Companies Act, 1956 as adopted consistently by the Company. All income and expenditure having a material bearing on the financial statements are recognized on accrual basis.
2.2 Use of Estimates:
The preparation of the financial statements requires the Management to make estimates and assumptions considered in the reported amounts of assets and liabilities (including contingent liabilities) as of the date of the financial statements and the reported income and expenses during the reporting period like provision for employee benefits, provision for doubtful debts/advances/contingencies, allowances for slow/non moving inventories, useful lives of fixed assets, provision for taxation, etc. Management believes that the estimates used in the preparation of the financial statements are prudent and reasonable. Future results may vary from these estimates.
2.3 Inventories:
Inventories have been valued as under:
i) Raw materials, stores and spares and traded goods have been valued at cost.
Cost includes freight, taxes and duties and is net of credit under VAT and CENVAT scheme, where applicable.
ii) Due allowance is made for slow / non moving items, based on Management estimates
iii) Finished goods and work-in-progress have been valued at cost or net realizable value whichever is lower. Cost includes all direct costs and applicable production overheads to bring the goods to the present location and condition.
iv) Excise duty on closing stock of finished goods has been provided in the accounts and considered for valuation of closing stock. A corresponding liability is created for the same amount.
2.4 Cash and Cash equivalents (for purposes of Cash Flow Statement):
Cash comprises of cash on hand, amount in current accounts and deposit accounts.
Cash flows are reported using the indirect method, whereby profit/(loss) before tax is adjusted for the effects of transactions of non-cash nature and any deferrals or accruals of past or future cash receipts or payments. The cash flows from operating, investing and financing activities of the Company are segregated based on the available information.
2.5 Depreciation and Amortization:
Depreciation on Fixed Assets including on the additions on account of revaluation has been provided on a straight-line method at the rates specified in the Schedule XIV to the Companies Act, 1956.
Depreciation on the additional value due to revaluation has been charged to the Revaluation Reserve account.
Intangible assets are amortized over the estimated useful life as follows:
License fee – 6 years (2 years remaining as on Balance Sheet Date)
The estimated useful life of the intangible assets and the amortization period are
Notes forming part of the financial statements

84
reviewed at the end of each financial year and the amortization method is revised to effect the changed pattern.
2.6 Revenue Recognition:
Revenue from the sale of goods is recognized when the significant risks and rewards of ownership have been transferred to the buyer.
Revenue from Works Contracts is recognized by reference to the completion of the contract activity at the reporting date, where the contract activity extended beyond the reporting date, on the basis of percentage of completion method.
Dividend income on investments is accounted for when the right to receive the payment is established.
2.7 Expenditure:
Expenses are accounted on accrual basis and provision is made for all known losses and liabilities.
2.8 Tangible Fixed Assets:
Fixed Assets are stated at cost of acquisition as reduced by accumulated depreciation. All costs including financial costs up to the date of commissioning and attributable to the fixed assets are capitalized apart from taxes, freight and other incidental expenses related to the acquisition and installation of the respective fixed assets and excludes duties and taxes to the extent recoverable from tax authorities.
Fixed Assets which are revalued are stated at the amounts revalued as reduced by the depreciation.
2.9 Intangible assets:
Intangible assets are carried at cost less accumulated amortisation and impairment losses, if any. The cost of an intangible asset comprises its purchase price, including any import duties and other taxes (other than those subsequently recoverable from the taxing authorities), and any directly attributable expenditure on making the asset ready for its intended use and net of any trade discounts and rebates. Subsequent expenditure on an intangible asset after its purchase / completion is recognised as an expense when incurred unless it is probable that such expenditure will enable the asset to generate future
economic benefits in excess of its originally assessed standards of performance and such expenditure can be measured and attributed to the asset reliably, in which case such expenditure is added to the cost of the asset.
2.10 Foreign Exchange Transactions:
Initial Recognition
Transactions in foreign currencies entered into by the Company are accounted at the exchange rates prevailing on the date of the transaction or at rates that closely approximate the rate at the date of the transaction.
Measurement of foreign currency monetary items at the Balance Sheet date
Foreign currency monetary items (other than derivative contracts) of the Company at the Balance Sheet date are restated at the year-end rates.
Treatment of exchange differences
Exchange differences arising on settlement / restatement of short-term foreign currency monetary assets and liabilities of the Company are recognised as income or expense in the Statement of Profit and Loss.
2.11 Investments
Long term Investments are stated at cost. Provision, if any, is made for permanent diminution in the value of investments. Current investments are stated at lower of cost or market value.
2.12 Employee Benefits:
a) Short Term Employee Benefits
All employee benefits payable wholly within twelve months of rendering the service are classified as short term employee benefits. Benefits such as salaries, wages and short term compensated absences etc. are recognized in the period in which the employee renders the related service.
b) Long Term Employee Benefits
Defined Contribution Plan
The Company makes contribution in respect of selected employees to a Superannuation Fund administered by
85
trustees and managed by Life Insurance Corporation of India. The Company has no liability for future Superannuation Fund benefits other than its annual contribution and recognizes such contributions as an expense in the year incurred.
Defined Benefit Plans
The Company makes annual contribution to a Gratuity Fund administered by trustees and managed by LIC. The Company accounts its liability for future gratuity benefits based on actuarial valuation, as at the Balance Sheet date, determined every year by LIC using the Projected Unit Credit method. Actuarial gains / losses are immediately recognized in the Statement of Profit and Loss.
In respect of Provident Fund and Pension Fund, Contributions are made by the Company in accordance with the relevant rules and fully charged off to Statement of Profit and Loss .
The company provides for leave encashment based on valuations, as at the balance sheet date, made by independent actuaries.
2.13 Earnings Per Share
Basic earnings per share is computed by dividing the profit / (loss) after tax (including the post tax effect of extraordinary items, if any) by the weighted average number of equity shares outstanding during the year. Diluted earnings per share is computed by dividing the profit / (loss) after tax (including the post tax effect of extraordinary items, if any) as adjusted for dividend, interest and other charges to expense or income relating to the dilutive potential equity shares, by the weighted average number of equity shares considered for deriving basic earnings per share and the weighted average number of equity shares which could have been issued on the conversion of all dilutive potential equity shares. Potential dilutive equity shares are deemed to be converted as at the beginning of the period, unless they have been issued at a later date. The dilutive potential equity shares are adjusted for the proceeds receivable had the shares been actually
issued at fair value (i.e. average market value of the outstanding shares). Dilutive potential equity shares are determined independently for each period presented. The number of equity shares and potentially dilutive equity shares are adjusted for share splits / reverse share splits and bonus shares, as appropriate.
2.14 Taxes on Income
Income tax liability for the year is calculated in accordance with the relevant tax laws and regulations applicable to the Company. Deferred tax is recognized on timing differences, being the differences between taxable income and accounting income that originate in one period and are capable of reversal in one or more subsequent periods.
2.15 Impairment of Assets
The carrying amounts of assets are reviewed at each Balance Sheet date to determine whether there is any indication of impairment of the carrying amount of the Company’s assets. The recoverable amount of such assets is estimated. Where the carrying amount of the asset exceeds the recoverable amount, the impairment loss is recognized in the Statement of profit and loss.
2.16 Provisions, Contingent Liabilities and Contingent Assets
Provisions are recognized only when there is a present obligation as a result of past events and when a reliable estimate of the amount of obligation can be made. Contingent liability is disclosed for (i) Possible obligation which will be confirmed only by future events not wholly within the control of the Company or (ii) Present obligations arising from past events where it is not probable that an outflow of resources will be required to settle the obligation or a reliable estimate of the amount of the obligation cannot be made. Contingent assets are not recognized in the financial statements since this may result in the recognition of income that may never be realized.
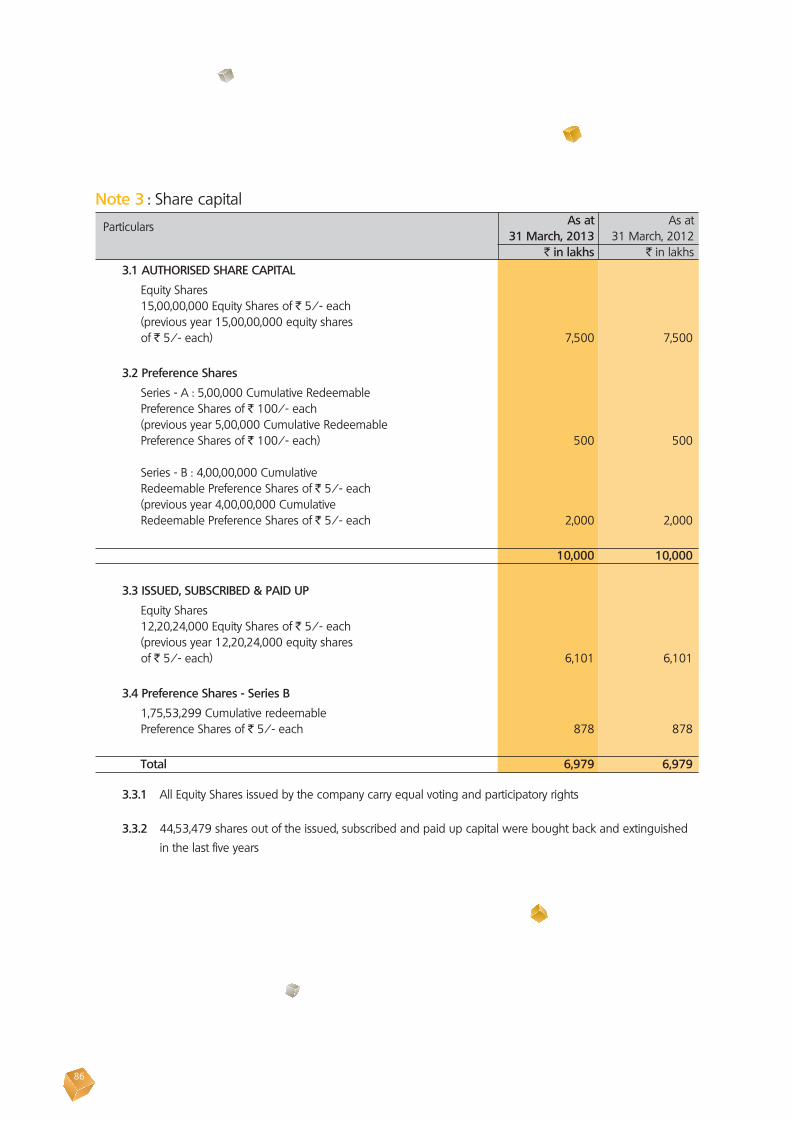
86
Note 3 : Share capital Particulars As at As at 31 March, 2013 31 March, 2012 ` in lakhs ` in lakhs 3.1 AUTHORISED SHARE CAPITAL
Equity Shares 15,00,00,000 Equity Shares of ` 5/- each (previous year 15,00,00,000 equity shares of ` 5/- each) 7,500 7,500
3.2 Preference Shares Series - A : 5,00,000 Cumulative Redeemable Preference Shares of ` 100/- each (previous year 5,00,000 Cumulative Redeemable Preference Shares of ` 100/- each) 500 500 Series - B : 4,00,00,000 Cumulative Redeemable Preference Shares of ` 5/- each (previous year 4,00,00,000 Cumulative Redeemable Preference Shares of ` 5/- each 2,000 2,000
10,000 10,000
3.3 ISSUED, SUBSCRIBED & PAID UP Equity Shares 12,20,24,000 Equity Shares of ` 5/- each (previous year 12,20,24,000 equity shares of ` 5/- each) 6,101 6,101
3.4 Preference Shares - Series B 1,75,53,299 Cumulative redeemable Preference Shares of ` 5/- each 878 878
Total 6,979 6,979
3.3.1 All Equity Shares issued by the company carry equal voting and participatory rights
3.3.2 44,53,479 shares out of the issued, subscribed and paid up capital were bought back and extinguished
in the last five years
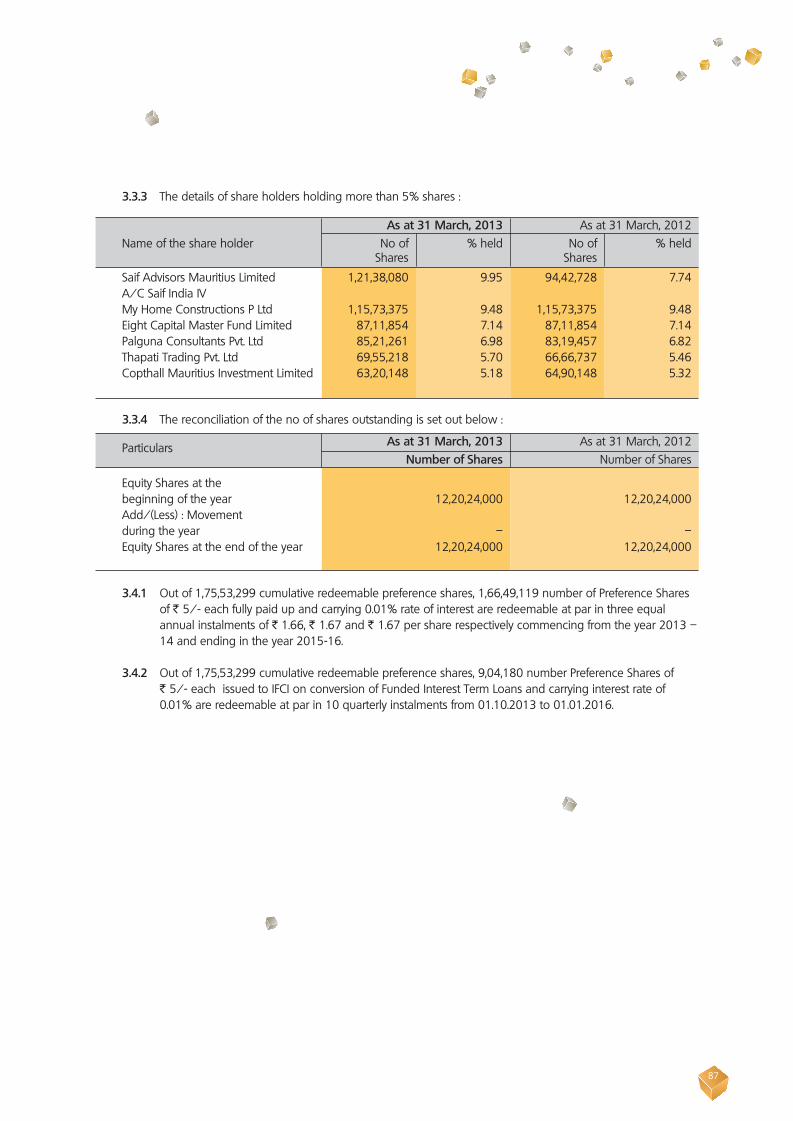
87
3.3.3 The details of share holders holding more than 5% shares : As at 31 March, 2013 As at 31 March, 2012 Name of the share holder No of % held No of % held Shares Shares
Saif Advisors Mauritius Limited 1,21,38,080 9.95 94,42,728 7.74 A/C Saif India IV My Home Constructions P Ltd 1,15,73,375 9.48 1,15,73,375 9.48 Eight Capital Master Fund Limited 87,11,854 7.14 87,11,854 7.14 Palguna Consultants Pvt. Ltd 85,21,261 6.98 83,19,457 6.82 Thapati Trading Pvt. Ltd 69,55,218 5.70 66,66,737 5.46 Copthall Mauritius Investment Limited 63,20,148 5.18 64,90,148 5.32
3.3.4 The reconciliation of the no of shares outstanding is set out below :
Particulars As at 31 March, 2013 As at 31 March, 2012 Number of Shares Number of Shares
Equity Shares at the beginning of the year 12,20,24,000 12,20,24,000
Add/(Less) : Movement during the year – –
Equity Shares at the end of the year 12,20,24,000 12,20,24,000
3.4.1 Out of 1,75,53,299 cumulative redeemable preference shares, 1,66,49,119 number of Preference Shares of ` 5/- each fully paid up and carrying 0.01% rate of interest are redeemable at par in three equal annual instalments of ` 1.66, ` 1.67 and ` 1.67 per share respectively commencing from the year 2013 – 14 and ending in the year 2015-16.
3.4.2 Out of 1,75,53,299 cumulative redeemable preference shares, 9,04,180 number Preference Shares of
` 5/- each issued to IFCI on conversion of Funded Interest Term Loans and carrying interest rate of 0.01% are redeemable at par in 10 quarterly instalments from 01.10.2013 to 01.01.2016.
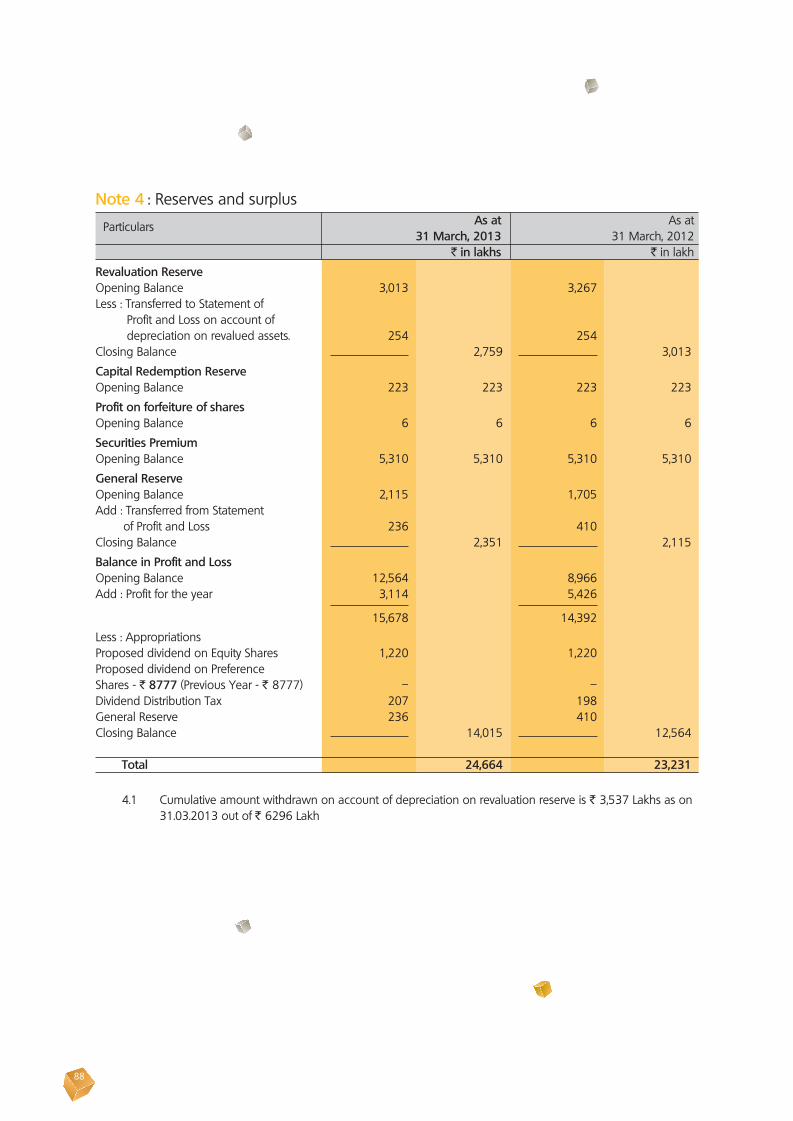
88
Note 4 : Reserves and surplus Particulars As at As at 31 March, 2013 31 March, 2012 ` in lakhs ` in lakh
Revaluation Reserve Opening Balance 3,013 3,267 Less : Transferred to Statement of Profit and Loss on account of depreciation on revalued assets. 254 254 Closing Balance 2,759 3,013
Capital Redemption Reserve Opening Balance 223 223 223 223
Profit on forfeiture of shares Opening Balance 6 6 6 6
Securities Premium Opening Balance 5,310 5,310 5,310 5,310
General Reserve Opening Balance 2,115 1,705 Add : Transferred from Statement of Profit and Loss 236 410 Closing Balance 2,351 2,115
Balance in Profit and Loss Opening Balance 12,564 8,966 Add : Profit for the year 3,114 5,426 15,678 14,392
Less : Appropriations Proposed dividend on Equity Shares 1,220 1,220 Proposed dividend on Preference Shares - ` 8777 (Previous Year - ` 8777) – – Dividend Distribution Tax 207 198 General Reserve 236 410 Closing Balance 14,015 12,564 Total 24,664 23,231
4.1 Cumulative amount withdrawn on account of depreciation on revaluation reserve is ` 3,537 Lakhs as on 31.03.2013 out of ` 6296 Lakh
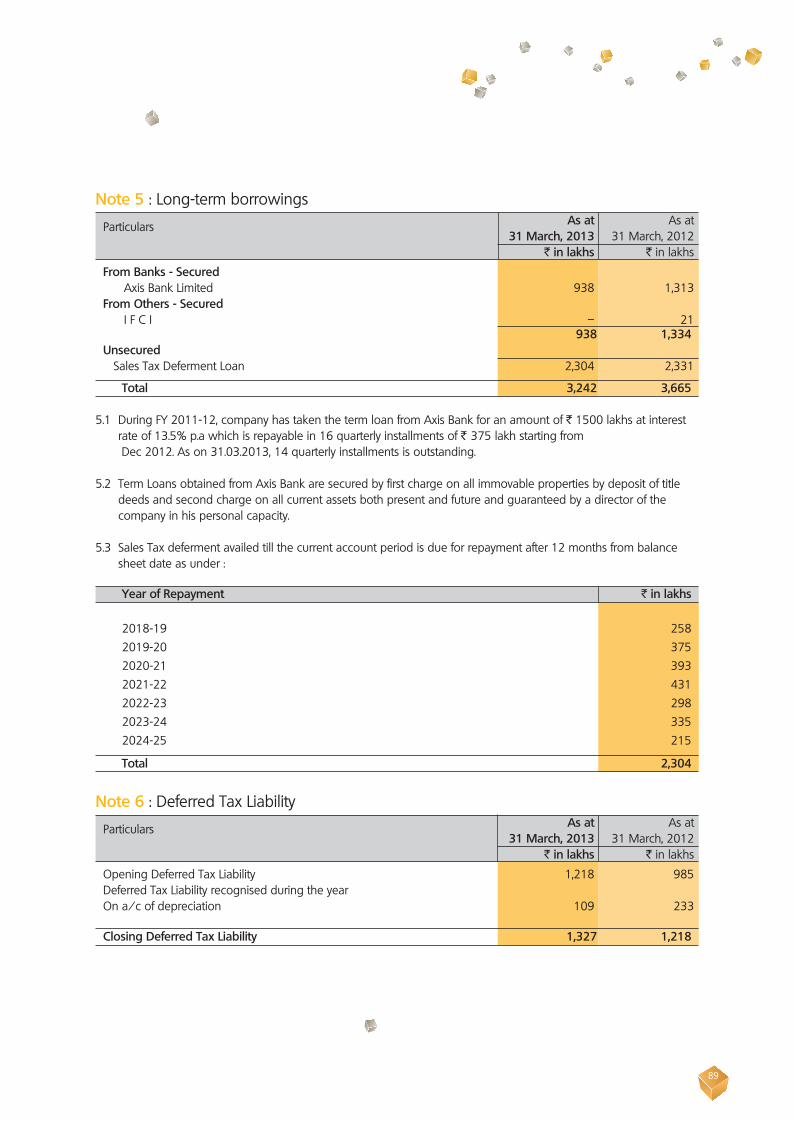
89
Note 5 : Long-term borrowings
Particulars As at As at 31 March, 2013 31 March, 2012 ` in lakhs ` in lakhs
From Banks - Secured Axis Bank Limited 938 1,313 From Others - Secured I F C I – 21 938 1,334 Unsecured Sales Tax Deferment Loan 2,304 2,331
Total 3,242 3,665
5.1 During FY 2011-12, company has taken the term loan from Axis Bank for an amount of ` 1500 lakhs at interest rate of 13.5% p.a which is repayable in 16 quarterly installments of ` 375 lakh starting from Dec 2012. As on 31.03.2013, 14 quarterly installments is outstanding.
5.2 Term Loans obtained from Axis Bank are secured by first charge on all immovable properties by deposit of title
deeds and second charge on all current assets both present and future and guaranteed by a director of the company in his personal capacity.
5.3 Sales Tax deferment availed till the current account period is due for repayment after 12 months from balance
sheet date as under :
Year of Repayment ` in lakhs
2018-19 258 2019-20 375 2020-21 393 2021-22 431 2022-23 298 2023-24 335 2024-25 215
Total 2,304
Note 6 : Deferred Tax Liability
Particulars As at As at 31 March, 2013 31 March, 2012 ` in lakhs ` in lakhs
Opening Deferred Tax Liability 1,218 985 Deferred Tax Liability recognised during the year On a/c of depreciation 109 233 Closing Deferred Tax Liability 1,327 1,218
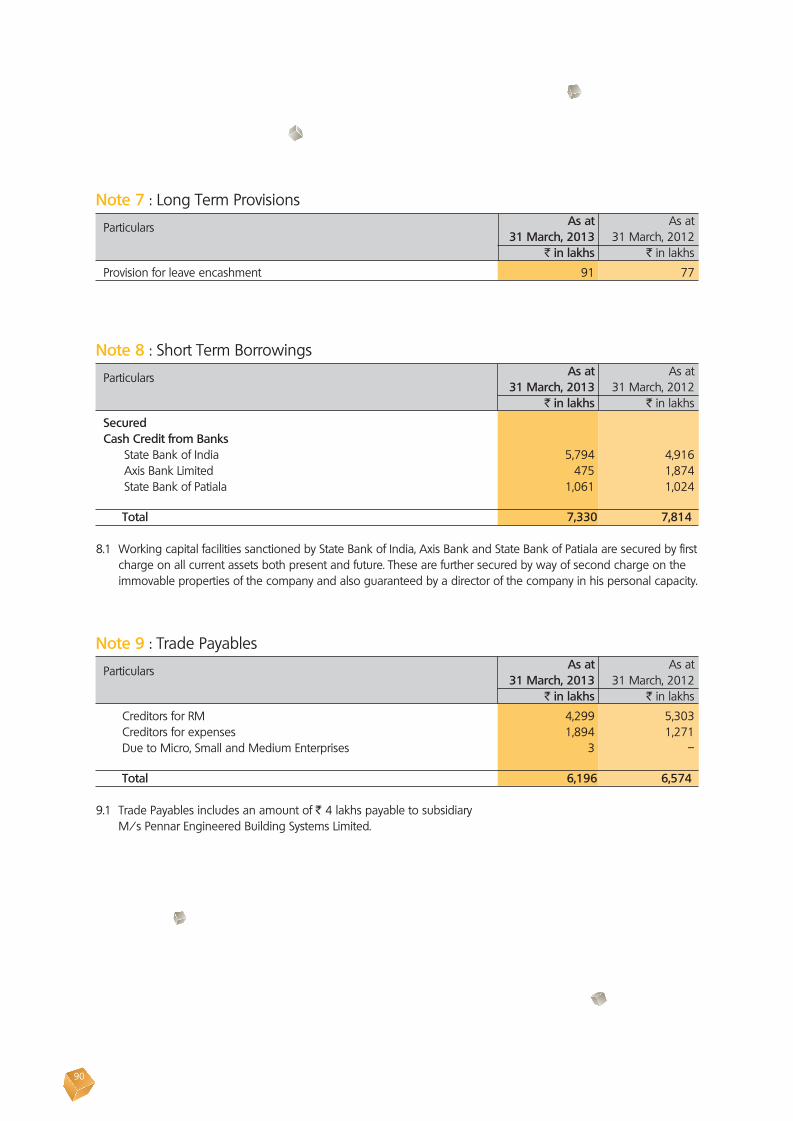
90
Note 7 : Long Term Provisions
Particulars As at As at 31 March, 2013 31 March, 2012 ` in lakhs ` in lakhs
Provision for leave encashment 91 77
Note 8 : Short Term Borrowings
Particulars As at As at 31 March, 2013 31 March, 2012 ` in lakhs ` in lakhs
Secured Cash Credit from Banks State Bank of India 5,794 4,916 Axis Bank Limited 475 1,874 State Bank of Patiala 1,061 1,024 Total 7,330 7,814 8.1 Working capital facilities sanctioned by State Bank of India, Axis Bank and State Bank of Patiala are secured by first
charge on all current assets both present and future. These are further secured by way of second charge on the immovable properties of the company and also guaranteed by a director of the company in his personal capacity.
Note 9 : Trade Payables Particulars As at As at 31 March, 2013 31 March, 2012 ` in lakhs ` in lakhs
Creditors for RM 4,299 5,303 Creditors for expenses 1,894 1,271 Due to Micro, Small and Medium Enterprises 3 – Total 6,196 6,574 9.1 Trade Payables includes an amount of ` 4 lakhs payable to subsidiary
M/s Pennar Engineered Building Systems Limited.

91
Note 10 : Other Current Liabilities Particulars As at As at 31 March, 2013 31 March, 2012 ` in lakhs ` in lakhs
Current Maturities of Long Term Debt 401 385 Creditors for capital goods 17 45 Unclaimed Dividend 54 43 Advances from customers 5 119 Sales Tax Deferment Loan 27 77 VAT Payable 198 199 Other Liabilities 1,509 837
Total 2,211 1,705 10.1 Other liabilities consists of TDS, TCS, PF & ESI payable etc.
Note 11 : Short Term Provisions Particulars As at As at 31 March, 2013 31 March, 2012 ` in lakhs ` in lakhs
Provision for Gratuity 22 34 Provision for Leave Encashment 10 9 Provision for Equity Dividend 1,220 1,220 Provision for Preference Dividend - ` 8777 (Previous Year - ` 8777) - - Provision for Dividend Distribution Tax 207 198 Total 1,459 1,461

92
S.NO
ASSE
T G
ROUP
Gro
ss B
lock
(At C
ost)
Dep
recia
tion
& Am
ortis
atio
n N
et B
ook
Valu
e O
p Bl
ock
Add
itions
D
ispos
als
As o
n O
p Bl
ock
For t
he y
ear
Disp
osal
s A
s on
As o
n A
s on
As o
n 1.
4.20
12
FY- 2
012-
13
FY- 2
012-
13
31.
03.2
013
As o
n 1.
4.20
12
201
2 - 2
013
Adj
FY 1
2-13
3
1.03
.201
3 3
1.03
.201
3 3
1.03
.201
2
TAN
GIB
LE A
SSET
S 1
LAN
D 1
,113
2
4 –
1
,137
–
–
–
–
1
,137
1
,113
(P
revio
us Y
ear)
(897
) (2
16)
–
(1,1
13)
–
–
–
–
(1,1
13)
(897
)2
ROA
DS
495
–
–
4
95
23
8
–
31
464
4
72
(Pre
vious
Yea
r) (4
07)
(88)
–
(495
) (1
6) (7
) –
(2
3) (4
71)
(390
)3
BUILD
ING
S 7
,637
3
3 –
7
,670
1
,874
2
36
–
2,1
10
5,5
60
5,7
63
(Pre
vious
Yea
r) (6
,003
) (1
,634
) –
(7
,637
) (1
,671
) (2
03)
–
(1,8
74)
(5,7
63)
(433
)4
PLA
NT
& M
ACH
INER
Y 2
2,55
5 2
94
51
22,
798
12,
131
1,2
36
51
13,
316
9,4
82
10,
424
(Pre
vious
Yea
r) (1
9,10
8) (3
,447
) –
(2
2,55
5) (1
0,92
8) (1
,203
) –
(1
2,13
1) (1
0,42
4) (8
,179
)5
ELEC
TRIC
ALS
2,5
91
80
–
2,6
71
1,0
80
180
–
1
,260
1
,411
1
,511
(P
revio
us Y
ear)
(2,2
48)
(344
) –
(2
,591
) (9
06)
(174
) –
(1
,080
) (1
,511
) (1
,342
)6
COM
PUTE
RS 3
47
58
–
405
2
62
27
–
289
1
16
85
(Pre
vious
Yea
r) (3
12)
(35)
–
(347
) (2
27)
(36)
–
(262
) (8
5) (8
6)7
OFF
ICE
EQ
UIP
MEN
TS 2
94
11
–
305
1
25
10
–
135
1
70
169
(P
revio
us Y
ear)
(237
) (5
7) –
(2
94)
(117
) (8
) –
(1
25)
(169
) (1
21)
8FU
RNIT
URE
158
5
–
1
63
50
8
–
58
105
1
08
(Pre
vious
Yea
r) (1
11)
(47)
–
(158
) (4
4) (6
) –
(5
0) (1
08)
(67)
9VE
HIC
LES
86
44
–
130
3
0 8
–
3
8 9
2 5
6 (P
revio
us Y
ear)
(86)
–
–
(86)
(23)
(8)
–
(30)
(56)
(63)
SUB
TOTA
L-1
35,
276
549
5
1 3
5,77
4 1
5,57
5 1
,713
5
1 1
7,23
7 1
8,53
7 1
9,70
1 (P
revio
us Y
ear)
(29,
408)
(5,8
68)
–
(35,
276)
(13,
932)
(1,6
45)
–
(15,
577)
(19,
701)
(15,
476)
INTA
NG
IBLE
ASS
ETS
10LIC
ENCE
FEE
208
–
–
2
08
44
34
–
78
130
1
64
(Pre
vious
Yea
r) (1
20)
(88)
–
(208
) (1
9) (2
5) –
(4
4) (1
64)
(101
)SU
B TO
TAL-
2 2
08
–
–
208
4
4 3
4 –
7
8 1
30
164
(P
revio
us Y
ear)
(120
) (8
8) –
(2
08)
(19)
(25)
–
(44)
(164
) (1
01)
TOTA
L (1
+ 2
) 3
5,48
4 5
49
51
35,
982
15,
619
1,7
47
51
17,
315
18,
667
19,
865
(Pre
vious
Yea
r) (2
9,52
8) (5
,956
) –
(3
5,48
4) (1
3,95
1) (1
,670
) –
(1
5,62
1) (1
9,86
5) (1
5,57
7)
Not
e 12
: Fix
ed a
sset
s`
in la
khs
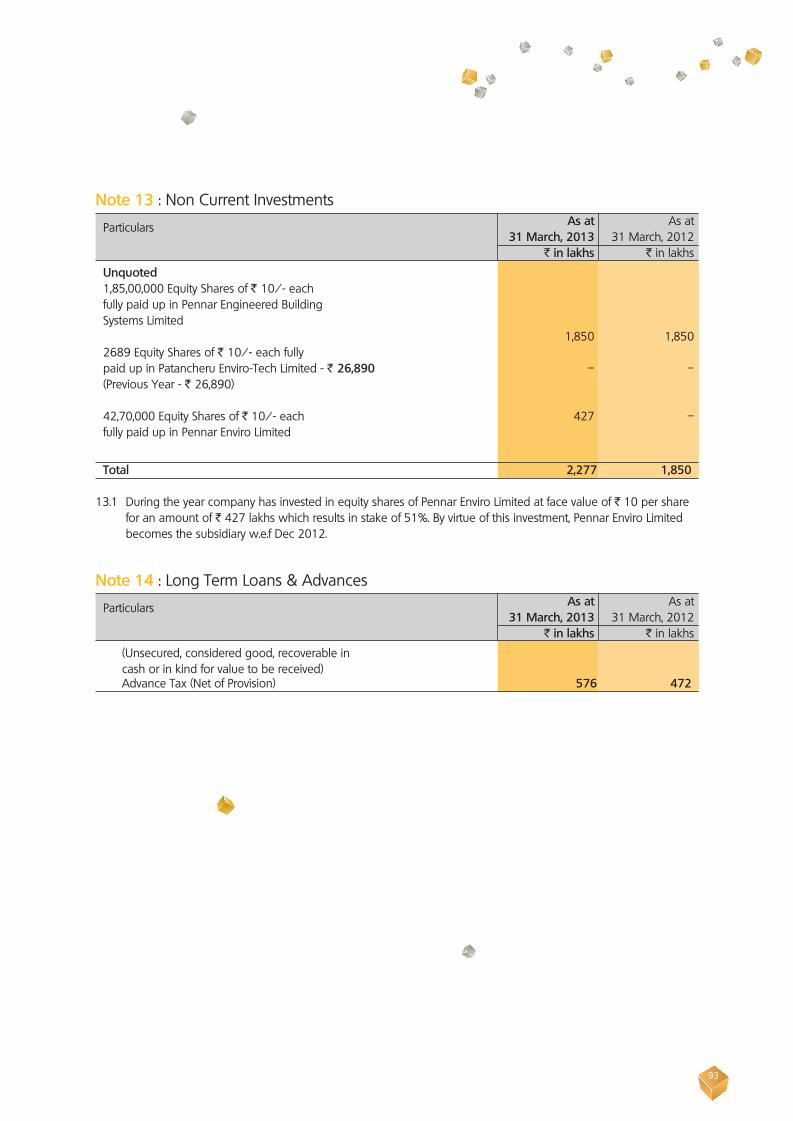
93
Note 13 : Non Current Investments Particulars As at As at 31 March, 2013 31 March, 2012 ` in lakhs ` in lakhs
Unquoted 1,85,00,000 Equity Shares of ` 10/- each fully paid up in Pennar Engineered Building Systems Limited 1,850 1,850 2689 Equity Shares of ` 10/- each fully paid up in Patancheru Enviro-Tech Limited - ` 26,890 – – (Previous Year - ` 26,890) 42,70,000 Equity Shares of ` 10/- each 427 – fully paid up in Pennar Enviro Limited
Total 2,277 1,850 13.1 During the year company has invested in equity shares of Pennar Enviro Limited at face value of ` 10 per share
for an amount of ` 427 lakhs which results in stake of 51%. By virtue of this investment, Pennar Enviro Limited becomes the subsidiary w.e.f Dec 2012.
Note 14 : Long Term Loans & Advances Particulars As at As at 31 March, 2013 31 March, 2012 ` in lakhs ` in lakhs
(Unsecured, considered good, recoverable in cash or in kind for value to be received) Advance Tax (Net of Provision) 576 472

94
Note 15 : Other Non Current Assets Particulars As at As at 31 March, 2013 31 March, 2012 ` in lakhs ` in lakhs
Sales Tax Claims 124 55 Electricity Deposit 216 178 Rent Deposit 43 30 Water Deposit 21 12 Total 404 275
Note 16 : Inventories (As valued and certified by Management) Particulars As at As at 31 March, 2013 31 March, 2012 ` in lakhs ` in lakhs
Raw Material 2,048 1,955 Stores & Spares 3,072 2,982 Work in Progress 5,039 6,460 Finished Goods 1,534 306 Scrap 244 116 Total 11,937 11,819
Note 17 : Trade receivables
Particulars As at As at 31 March, 2013 31 March, 2012 ` in lakhs ` in lakhs Trade receivables outstanding for a period exceeding six months from the date they were due for payment Secured, considered good – – Unsecured, considered good 817 544 Other Trade receivables Secured, considered good – – Unsecured, considered good 16,624 16,182 Total 17,441 16,726
17.1 Trade receivables outstanding for a period exceeding 6 months includes an amount of ` 140 lakhs which is doubtful for recovery. However, management is confident of recovering the same. Out of the aforesaid mentioned ` 140 lakhs, company has filed the legal cases against customers to the extent of ` 78 lakhs for receovery.
17.2 Trade Receivables includes an amount of ` 596 lakhs from subsidiary
M/s Pennar Engineered Building Systems Limited.

95
Note 19 : Short Term Loans & Advances
Particulars As at As at 31 March, 2013 31 March, 2012 ` in lakhs ` in lakhs (Unsecured, considered good, recoverable in cash or in kind for value to be received) Loans & Advances to Staff 46 5 Advances for Raw Material 176 87 Advances for Capital Goods 35 23 Advances to others 93 97 Cenvat Credit 501 343 Other Deposits 5 3 Share Application Money – 21
Total 856 579
Note 18 : Cash and Cash Equivalents
Particulars As at As at 31 March, 2013 31 March, 2012 ` in lakhs ` in lakhs Cash and Cash Equivalents Balance with Banks - in current accounts 46 29 - in Collection accounts 471 463 - in unclaimed dividend accounts 42 43 - in margin money accounts 279 254 Cash on hand 7 13 Fixed Deposit under lien 200 200 Total 1,045 1,002
Cash and Cash Equivalents for Cash Flow Statement 566 548
18.1 The company has provided a collateral security, a lien on fixed deposit of ` 200 lacs towards the Term Loans and Working Capital Loans taken by subsidiary M/s Pennar Engineered Building Systems Limited.
18.2 Out of the margin money balance, an amount of ` 225 lakhs has maturity period of more than 12 months.
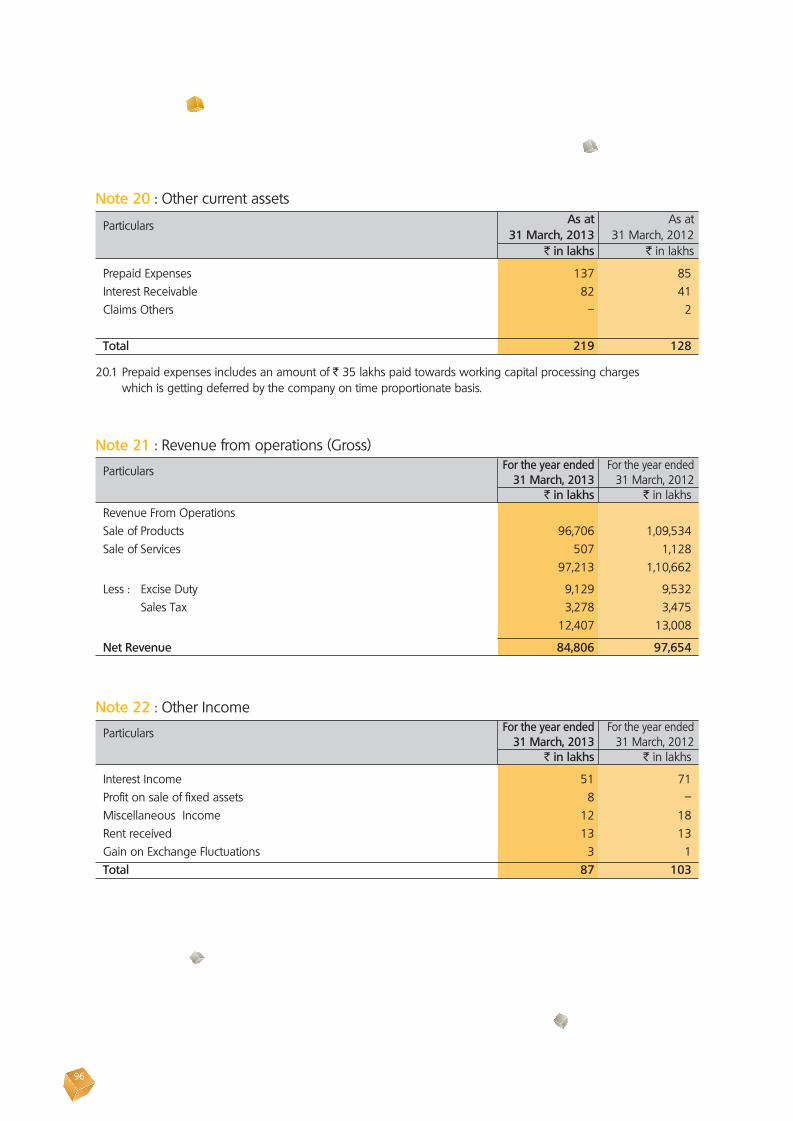
96
Note 20 : Other current assets
Particulars As at As at 31 March, 2013 31 March, 2012 ` in lakhs ` in lakhs
Prepaid Expenses 137 85 Interest Receivable 82 41 Claims Others – 2 Total 219 128
20.1 Prepaid expenses includes an amount of ` 35 lakhs paid towards working capital processing charges which is getting deferred by the company on time proportionate basis.
Note 22 : Other Income
Particulars For the year ended For the year ended 31 March, 2013 31 March, 2012 ` in lakhs ` in lakhs
Interest Income 51 71 Profit on sale of fixed assets 8 – Miscellaneous Income 12 18 Rent received 13 13 Gain on Exchange Fluctuations 3 1 Total 87 103
Note 21 : Revenue from operations (Gross)
Particulars For the year ended For the year ended 31 March, 2013 31 March, 2012 ` in lakhs ` in lakhs Revenue From Operations Sale of Products 96,706 1,09,534 Sale of Services 507 1,128 97,213 1,10,662
Less : Excise Duty 9,129 9,532 Sales Tax 3,278 3,475 12,407 13,008 Net Revenue 84,806 97,654

97
Note 23 : Raw Material Consumed
Particulars For the year ended For the year ended 31 March, 2013 31 March, 2012 ` in lakhs ` in lakhs
Opening Stocks 1,955 2,286 Add : Purchases 65,686 76,386 67,641 78,672 Less : Closing Stocks 2,048 1,955 Consumption 65,593 76,717 Less : Scrap Revenue 4,588 4,756 Net Material Cost 61,005 71,961
23.1 Raw materials purchases includes carriage inwards of ` 140 lakhs (previous year ` 15 Lakhs).
Note 24 : Changes in Inventories (other than RM)
Particulars For the year ended For the year ended 31 March, 2013 31 March, 2012 ` in lakhs ` in lakhs
Opening Stocks Work in Progress 6,460 3,542 Finished Goods 306 1,841 Scrap 116 107 6,882 5,490 Closing Stocks Work in Progress 5,039 6,460 Finished Goods 1,534 306 Scrap 244 116 6,817 6,882 Changes in Stock 65 (1,392)
Note 25 : Manufacturing Expenses
Particulars For the year ended For the year ended 31 March, 2013 31 March, 2012 ` in lakhs ` in lakhs
Sub Contract Expenses 1,805 1,754 Stores & Spares 4,620 4,485 Power 1,181 1,013 Repairs & Maintenance - Buildings 56 102 Repairs & Maintenance - Plant & Machinery 112 107 Repairs & Maintenance - Others 76 117 Miscellaneous manufacturing expenses 181 145 Total 8,031 7,723
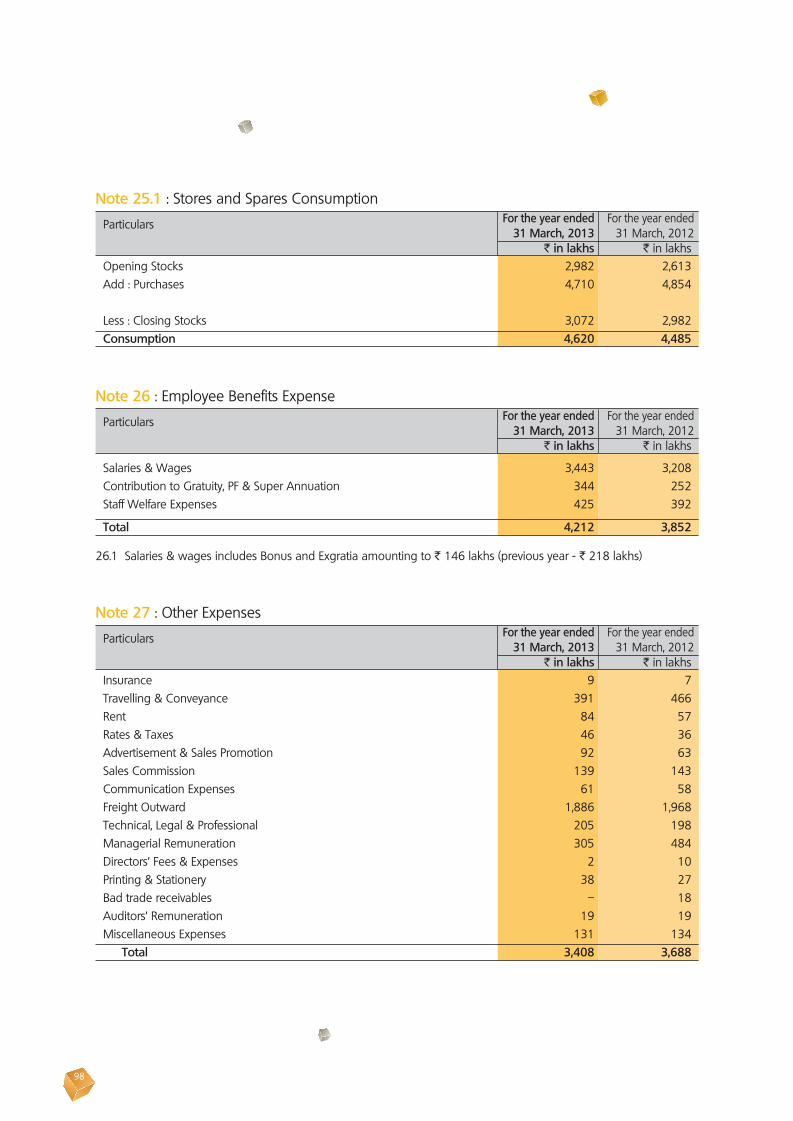
98
Note 26 : Employee Benefits Expense
Particulars For the year ended For the year ended 31 March, 2013 31 March, 2012 ` in lakhs ` in lakhs
Salaries & Wages 3,443 3,208 Contribution to Gratuity, PF & Super Annuation 344 252 Staff Welfare Expenses 425 392
Total 4,212 3,852
26.1 Salaries & wages includes Bonus and Exgratia amounting to ` 146 lakhs (previous year - ` 218 lakhs)
Note 27 : Other Expenses
Particulars For the year ended For the year ended 31 March, 2013 31 March, 2012 ` in lakhs ` in lakhs Insurance 9 7 Travelling & Conveyance 391 466 Rent 84 57 Rates & Taxes 46 36 Advertisement & Sales Promotion 92 63 Sales Commission 139 143 Communication Expenses 61 58 Freight Outward 1,886 1,968 Technical, Legal & Professional 205 198 Managerial Remuneration 305 484 Directors’ Fees & Expenses 2 10 Printing & Stationery 38 27 Bad trade receivables – 18 Auditors’ Remuneration 19 19 Miscellaneous Expenses 131 134 Total 3,408 3,688
Note 25.1 : Stores and Spares Consumption
Particulars For the year ended For the year ended 31 March, 2013 31 March, 2012 ` in lakhs ` in lakhs Opening Stocks 2,982 2,613 Add : Purchases 4,710 4,854
Less : Closing Stocks 3,072 2,982 Consumption 4,620 4,485
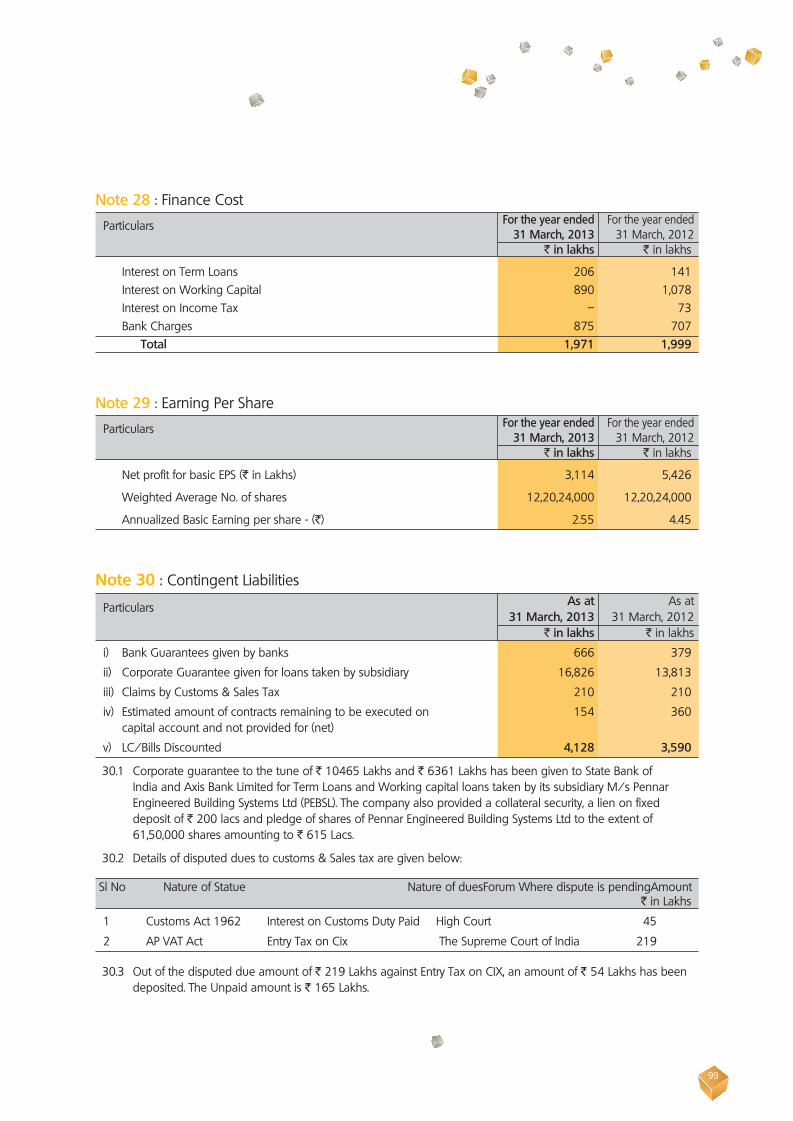
99
Note 28 : Finance Cost Particulars For the year ended For the year ended 31 March, 2013 31 March, 2012 ` in lakhs ` in lakhs
Interest on Term Loans 206 141 Interest on Working Capital 890 1,078 Interest on Income Tax – 73 Bank Charges 875 707 Total 1,971 1,999
Note 29 : Earning Per Share Particulars For the year ended For the year ended 31 March, 2013 31 March, 2012 ` in lakhs ` in lakhs
Net profit for basic EPS (` in Lakhs) 3,114 5,426
Weighted Average No. of shares 12,20,24,000 12,20,24,000
Annualized Basic Earning per share - (`) 2.55 4.45
30.2 Details of disputed dues to customs & Sales tax are given below:
Sl No Nature of Statue Nature of dues Forum Where dispute is pending Amount ` in Lakhs
1 Customs Act 1962 Interest on Customs Duty Paid High Court 45
2 AP VAT Act Entry Tax on Cix The Supreme Court of India 219
30.3 Out of the disputed due amount of ` 219 Lakhs against Entry Tax on CIX, an amount of ` 54 Lakhs has been deposited. The Unpaid amount is ` 165 Lakhs.
Note 30 : Contingent Liabilities
Particulars As at As at 31 March, 2013 31 March, 2012 ` in lakhs ` in lakhs
i) Bank Guarantees given by banks 666 379
ii) Corporate Guarantee given for loans taken by subsidiary 16,826 13,813
iii) Claims by Customs & Sales Tax 210 210
iv) Estimated amount of contracts remaining to be executed on 154 360 capital account and not provided for (net)
v) LC/Bills Discounted 4,128 3,590
30.1 Corporate guarantee to the tune of ` 10465 Lakhs and ` 6361 Lakhs has been given to State Bank of India and Axis Bank Limited for Term Loans and Working capital loans taken by its subsidiary M/s Pennar Engineered Building Systems Ltd (PEBSL). The company also provided a collateral security, a lien on fixed deposit of ` 200 lacs and pledge of shares of Pennar Engineered Building Systems Ltd to the extent of 61,50,000 shares amounting to ` 615 Lacs.

100
Note 31 : Disclosures required under Section 22 of the Micro, Small and Medium Enterprises Development Act, 2006 Particulars As at As at 31 March, 2013 31 March, 2012 ` in lakhs ` in lakhs
(i) Principal amount remaining unpaid to any supplier as at 3.00 – the end of the accounting year (Refer note 9)
(ii) Interest due thereon remaining unpaid to any supplier as at – – the end of the accounting year
(iii) The amount of interest paid along with the amounts of the payment – – made to the supplier beyond the appointed day
(iv) The amount of interest due and payable for the year – –
(v) The amount of interest accrued and remaining unpaid at the – – end of the accounting year
(vi) The amount of further interest due and payable even in the succeeding year, until such date when the interest dues as above are actually paid – –
Dues to Micro and Small Enterprises have been determined to the extent such parties have been identified on the basis of information collected by the Management.
Note 32 : Managerial Remuneration Particulars For the year ended For the year ended 31 March, 2013 31 March, 2012 ` in lakhs ` in lakhs 1 Directors Salaries & Allowances 132 132 2 Providend Fund & Superannuation 26 26 3 Other Perquisites 34 34 4 Commission 113 292 Total 305 484
Note 33 : Auditors Remuneration (Excluding Service Tax)
Particulars For the year ended For the year ended 31 March, 2013 31 March, 2012 ` in lakhs ` in lakhs 1 Audit Fees 16 16 2 Tax Audit Fees 2 2 3 Certification & Others 1 1
Total 19 19
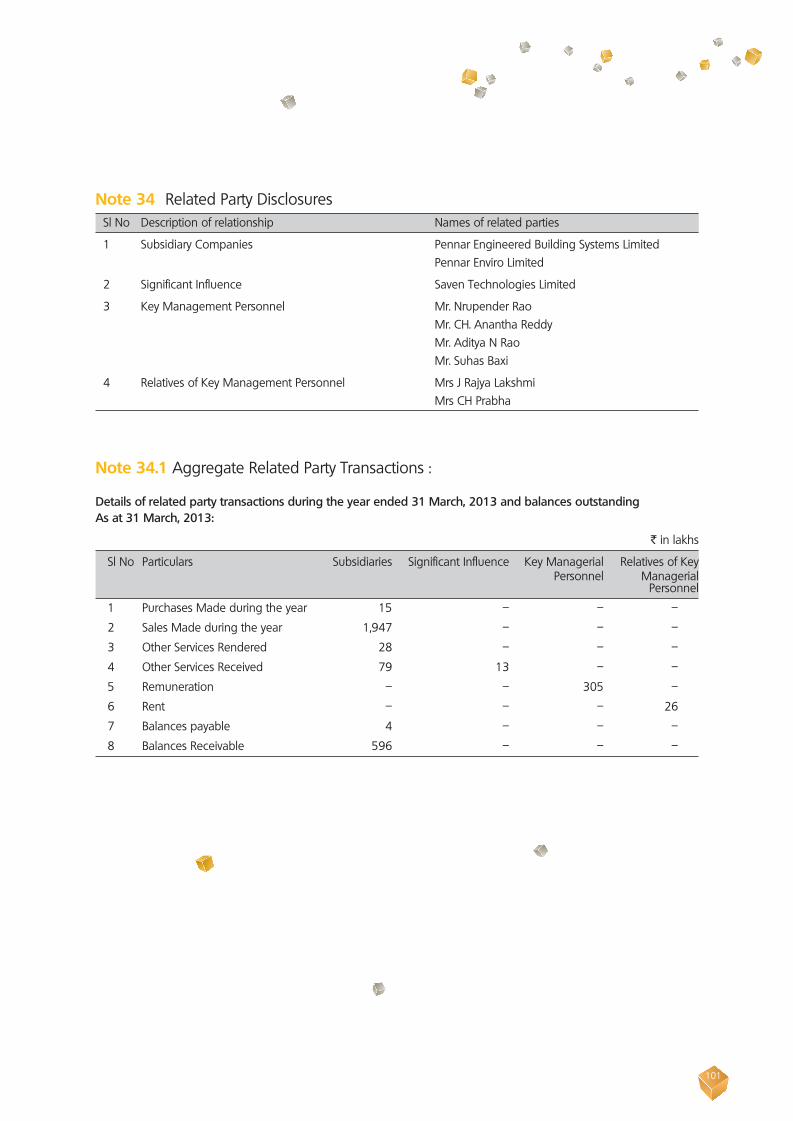
101
Note 34 Related Party Disclosures Sl No Description of relationship Names of related parties
1 Subsidiary Companies Pennar Engineered Building Systems Limited Pennar Enviro Limited
2 Significant Influence Saven Technologies Limited
3 Key Management Personnel Mr. Nrupender Rao Mr. CH. Anantha Reddy Mr. Aditya N Rao Mr. Suhas Baxi
4 Relatives of Key Management Personnel Mrs J Rajya Lakshmi Mrs CH Prabha
Note 34.1 Aggregate Related Party Transactions :
Details of related party transactions during the year ended 31 March, 2013 and balances outstandingAs at 31 March, 2013:
` in lakhs
Sl No Particulars Subsidiaries Significant Influence Key Managerial Relatives of Key Personnel Managerial Personnel
1 Purchases Made during the year 15 – – –
2 Sales Made during the year 1,947 – – –
3 Other Services Rendered 28 – – –
4 Other Services Received 79 13 – –
5 Remuneration – – 305 –
6 Rent – – – 26
7 Balances payable 4 – – –
8 Balances Receivable 596 – – –
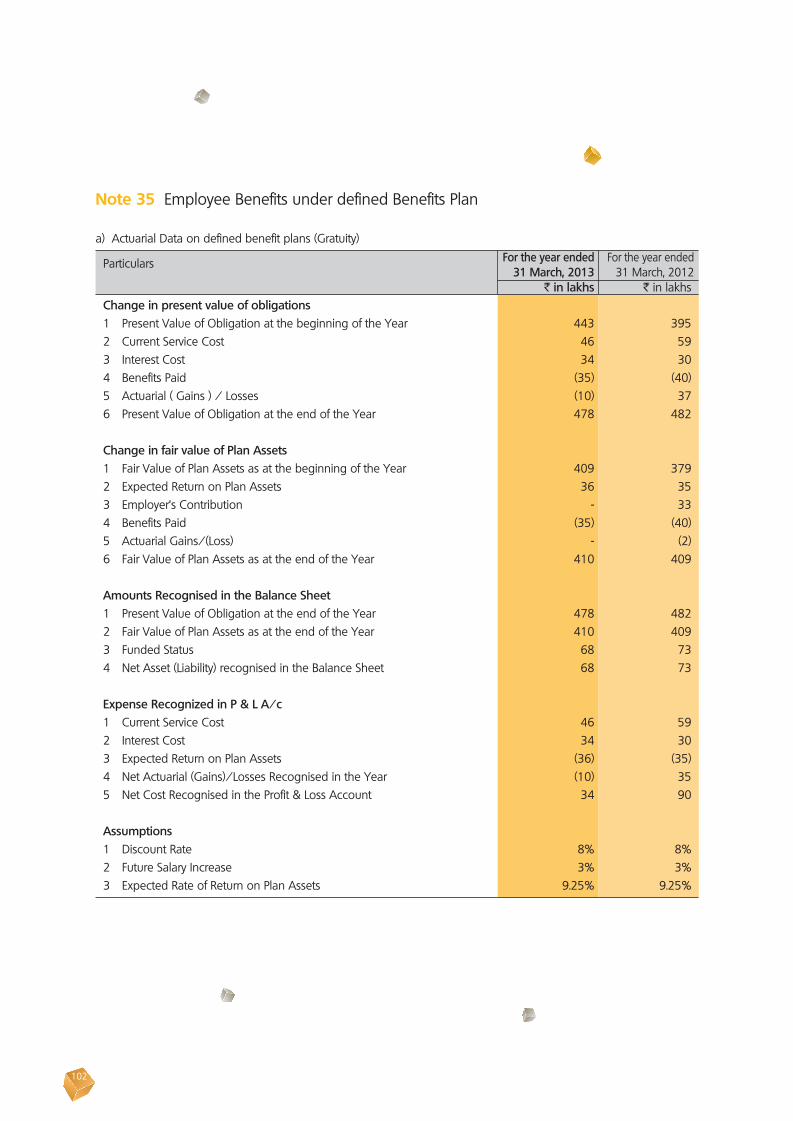
102
Note 35 Employee Benefits under defined Benefits Plan
a) Actuarial Data on defined benefit plans (Gratuity) Particulars For the year ended For the year ended 31 March, 2013 31 March, 2012 ` in lakhs ` in lakhs Change in present value of obligations 1 Present Value of Obligation at the beginning of the Year 443 395 2 Current Service Cost 46 59 3 Interest Cost 34 30 4 Benefits Paid (35) (40) 5 Actuarial ( Gains ) / Losses (10) 37 6 Present Value of Obligation at the end of the Year 478 482 Change in fair value of Plan Assets 1 Fair Value of Plan Assets as at the beginning of the Year 409 379 2 Expected Return on Plan Assets 36 35 3 Employer’s Contribution - 33 4 Benefits Paid (35) (40) 5 Actuarial Gains/(Loss) - (2) 6 Fair Value of Plan Assets as at the end of the Year 410 409 Amounts Recognised in the Balance Sheet 1 Present Value of Obligation at the end of the Year 478 482 2 Fair Value of Plan Assets as at the end of the Year 410 409 3 Funded Status 68 73 4 Net Asset (Liability) recognised in the Balance Sheet 68 73 Expense Recognized in P & L A/c 1 Current Service Cost 46 59 2 Interest Cost 34 30 3 Expected Return on Plan Assets (36) (35) 4 Net Actuarial (Gains)/Losses Recognised in the Year (10) 35 5 Net Cost Recognised in the Profit & Loss Account 34 90 Assumptions 1 Discount Rate 8% 8% 2 Future Salary Increase 3% 3% 3 Expected Rate of Return on Plan Assets 9.25% 9.25%

103
b) Long Term Compensated Absences Sl No Assumptions %
1 Discount Rate 8% 2 Future Salary Increase 3% 3 Attrition Rate (Depending on Age) 1-3%
Note 36 : Segment DetailsThe company is engaged in manufacture of steel products, viz Cold Rolled Steel Strips (CRSS) and Cold Formed Metal Profiles (CRFS) which in the context of Accounting Standard -17 issued by the Institute of Chartered Accountants of India is considered as a single segment.
Note 37 : Foreign Currency Transactions Particulars For the year ended For the year ended 31 March, 2013 31 March, 2012 ` in lakhs ` in lakhs a) Outflow in foreign currency i) Foreign Travel Expense 7 21 ii) Raw Material – – iii) Capital Equipment & Components 129 824 b) Inflow in foreign currency i) FOB value of exports 116 36
Note 38 Figures for the previous year have been regrouped / reclassified / recast wherever necessary. Figures are rounded off to the nearest Lac of rupees.
In terms of our report attached. For and on behalf of the Board of Directors For RAMBABU & Co., Chartered Accountants
Ravi Rambabu Nrupender Rao Partner Executive Chairman Membership. No:018541 Aditya N Rao Vice Chairman
Place: Hyderabad R. Ravi Suhas Baxi Date : May 12, 2013 V.P.Finance and Company Secretary President and CEO

104
1 Name of the Subsidiary Company Pennar Engineered Building Systems Limited
Pennar Enviro Limited
2 Financial year of the Subsidiary ended on March 31, 2013 March 31, 2013
3 Shares of Subsidiary Company held on the above date and extent of holding
i. Number of shares heldii. Extent of holding
1,85,00,00074%
42,70,00051%
4 Net aggregate amount of profits / (losses) of the Subsidiary for the above financial year so far as they concern members of Pennar Industries Limited:
i. dealt with in the Accounts of Pennar Industries Limited
ii. not dealt with in the Accounts of Pennar Industries Limited
–
` 1440 Lakhs
–
` 6 Lakhs
5 Net aggregate amount of profits / (losses) for previous financial years of the Subsidiary so far as they concern members of Pennar Industries Limited:
i. dealt with in the Accounts of Pennar Industries Limited
ii. not dealt with in the Accounts of Pennar Industries Limited
–
` 1042 Lakhs
–
` 3 Lakhs
For and on behalf of the Board
Statement pursuant to Section 212(1)(e) of the Companies Act, 1956, relating to Subsidiary Company
Nrupender Rao Aditya N RaoExecutive Chairman Vice Chairman
Place : HyderabadDate : May 10, 2013
Suhas Baxi R RaviPresident & CEO V.P. Finance & Company Secretary
105
Board of DirectorsMr. Nrupender Rao
Mr. C Parthasarathy
Mr. Mukul Gulati
Mr. Vishal Avinash Dixit
Mr. Ch Anantha Reddy
Mr. Manish Sabharwal
Mr. Vijay Chandra Puljal
Mr. Aditya N Rao
Mr. P V Rao
Company SecretaryMirza Mohammed Ali Baig
Pennar Engineered Building Systems Limited
Fifth Annual Report 2012 - 2013
Registered Office
Floor No. : 9, DHFLVC Silicon Towers,
Madhapur Road, Kondapur,Hyderabad - 500 084, India
PlantSy No. 144, 145, Anakapalli,
Chandapur Village, Sadasivpet Mandal,Medak District, Andhra Prasesh
Statutory AuditorsM/s. Deloitte Haskins & Sells.,
Chartered Accountants1-8-384&385, 3rd Floor, Gowra Grand,
S P Road, Begumpet, Hyderabad - 3
BankersState Bank of IndiaAxis Bank Limited

106
Dear Members,
Your directors take pleasure in presenting the Fifth Annual Report together with the audited accounts for the financial year ended 31st March, 2013.
Financial Results:
The performance of the Company for the period under review is summarized below: ( ` in Lacs )
Particulars Year ended Year ended
31st March, 2013 31st March, 2012
Gross Sales 32580.36 27920.18
Profit before Interest, Depreciation and Tax (EBIDT) 3554.12 2887.63
Profit before Tax 2181.74 1544.31
Current Tax and Deferred Tax 741.87 502.59
Profit after tax (PAT) 1439.87 1041.72

107
Operations:
During the year under review, which was the fourth year of operation, your Company has achieved sales of ` 32580.36 lakhs. The sales for the previous year was ` 27920.18 lakhs. This represents a growth of 16.69% year on year. Your company continues to be a subsidiary of M/s. Pennar Industries Limited.
The Company achieved an EBIDTA of ` 3554.12 lakhs (previous year ` 2887.63 lakhs), representing a growth of 23.08% year on year. The profit after tax was ` 1439.87 lakhs (previous year ` 1041.72 lakhs) representing a growth of 38% year on year. The Company is hopeful of achieving further growth in the financial year ending March 31, 2014.
Allotment of Compulsorily Convertible Preference Shares (CCPS):
The company has allotted 24,90,530 CCPS of ` 10/- each at a premium of ` 54/- per Share to M/s. Zephyr Peacock India Fund III Limited and 11,18,845 CCPS of ` 10/- each at a premium of ` 54/- per Share to M/s. Zephyr Peacock India III Fund, a scheme of Zephyr Peacock India Master Trust and the Authorized Share Capital of the company has been increased from ` 25.50 Crores to ` 37.50 Crores so as accommodate to the said allotment of shares.
Wholly Owned Subsidiary:
M/s. Pennar Building Systems Private Limited (PBSPL), a Wholly Owned Subsidiary of the company. Currently PBSPL does not have any business operations. The Board of Directors of PBSPL has taken necessary steps to close the company.
Directors:
Mr. A K Rao resigned from the office of the directorship on 21st March, 2013. Your Board places on record their appreciation for the contribution
made by him during his tenure as a Director. The Board of Directors has appointed Mr. C Parthasarathy, Mukul Gulati and Mr. Vishal Avinash Dixit as Additional Directors with effect from 21st March, 2013. Their appointment as Director is sought at the ensuing Annual General Meeting.
Mr. P V Rao was appointed as Managing Director of the company at the meeting of the Board of Directors held on 8th February, 2013. His appointment as Managing Director is to be ratified by the members.
Mr. Aditya Rao was re-designated as Vice Chairman of the company at the meeting of the Board of Directors held on 8th May, 2013.
Mr. J Nrupender Rao and Mr. Ch Anantha Reddy who retire by rotation and being eligible offer themselves for re-appointment. Your Board recommends their appointment.
Fixed Deposits, Dividend & General Reserves:
Your company has not accepted any Fixed Deposits during the year. No dividend has been declared and no amount has been carried to General Reserves during the year.
Statutory Auditors:
M/s. Deloitte Haskins & Sells., Chartered Accountants, Statutory Auditors of the Company retire at the conclusion of the ensuing Annual General Meeting. The Audit Committee and the Board of Directors recommend their re-appointment as the Statutory Auditors for the Financial Year 2013-14. The Auditors Report is self explanatory.
Cost Auditors:
The Central Government approved the appointment of M/s. DZR & Co., Cost Accountants, Hyderabad as the Cost Auditor of the Company for conducting Cost Audit
108
for the financial year 2012-13. The Cost Audit Report for the FY 2012-13 shall be submitted to the Central Government within the stipulated period.
Particulars of Employees:
Your Directors place on record, their sincere appreciation for the Company’s employees whose dedication and commitment is responsible for the Company’s performance. As required by the provisions of Section 217 (2A) of the Companies Act, 1956 read with Companies (Particulars of Employees) Rules, 1975, as amended, would be made available to the shareholders on request.
Particulars Regarding Conservation of Energy, Technology Absorption:
The particulars as prescribed under sub-section (1)(e) of Section 217 of the Companies Act, 1956, read with the Companies (Disclosure of Particulars in the Report of Board of Directors) Rules, 1988 are as follows:
Conservation of Energy: See Annexure - I Technology Absorption: See Annexure - II
Foreign Exchange Earnings:
There are foreign exchange earnings and outgoings during the financial year under review.Inflow: NilOutflow: ` 684.91 lakhs
Audit Committee:
Mr. Manish Sabharwal , Mr. Nrupender Rao, Mr. Vijay Chandra Puljal and Mr. Aditya N Rao are the members of the Audit Committee that is constituted pursuant to Section 292A of the Companies Act,1956. The Committee at its meeting held on 7th May 2013, approved the Annual Accounts for the year ended 31st March, 2013.
Directors Responsibility Statement:
In accordance with the provisions of Section 217(2AA) of the Companies Act, 1956, with respect to Directors Responsibility Statement, it is hereby confirmed that:
1. In the preparation of the Annual Accounts, the applicable Accounting Standards had been followed along with proper explanations relating to material departures;
2. The directors had selected such Accounting Policies and applied them consistently and made judgments and estimates that are reasonable and prudent so as to give a true and fair view of the state of affairs of the Company as at 31st March, 2013 and of the profit of the company for that period;
3. The directors had taken proper and sufficient care for the maintenance of adequate accounting records in accordance with the provisions of the Companies Act, 1956, for safeguarding the assets of the Company and for preventing and detecting fraud and other irregularities;
4. The directors had prepared the annual accounts on a ‘going concern’ basis.
Acknowledgements:
Your Directors wish to place on record their appreciation and gratitude for the support and cooperation extended by our clients, consultants, our bankers State Bank of India and Axis Bank, our employees and all the stakeholders of the Company. We look forward to further support.
By Order of the Boardfor Pennar Engineered Building Systems Limited
Place: Hyderabad Nrupender RaoDate: 9th May 2013 Chairman

109
Annexure I
Particulars 01.04.2012 to 31.03.2013 01.04.2011 to 31.03.2012
A. Power and Fuel consumption
1. Electricity
a. Purchase of Units 12,70,358 16,54,637
Total Amount (S) 91,14,617 76,59,742
Rate Per Units (S) 7.17 4.63
b. Own Generation
500KVA units (KWH) 354,439 1,11,264
Units per liter of diesel oil 0.32 0.35
Cost of Diesel per KWH (S) 15.94 14.80
2. Diesel Oil
Quantity (KL) 1,12,397 80,100
Total Amount (S) 56,48,925 35,61,708
Average Rates (S) 50.26 44.47
B. Consumption Per Unit of production
Production 32,240 31,078
Electricity (KWH)/MT 39.40 53.24
Diesel (Ltrs)/MTC. 3.49 2.58
C. Solar Power Generation (Units generated since commissioning)
88,474 54,361
Annexure II
Your Company has technical association with M/s. NCI building Systems which provides Technical Knowhow with regard to Manufacture, Distribution, Marketing, and Sale, of NCI’s Double-Lok® Roof system.
Advantages of Double-Lok® Roof system
a) Reduces risk of Leakage from Roof.b) System versality facilitates thermal expansion and contraction of the panel without any damagec) Tested by Factory Mutual Research Corporation for wind uplift, fire and hail damage.d) Simple, Flexible and Durable.e) Pre punched panels and components.

110
INDEPENDENT AUDITORS’ REPORT
TO THE MEMBERS OF PENNAR ENGINEERED BUILDING SYSTEMS LIMITED
Report on the Financial Statements
We have audited the accompanying financial statements of PENNAR ENGINEERED BUILDING SYSTEMS LIMITED (“the Company”), which comprise the Balance Sheet as at 31 March, 2013, the Statement of Profit and Loss and the Cash Flow Statement for the year then ended, and a summary of the significant accounting policies and other explanatory information.
Management’s Responsibility for the Financial Statements
The Company’s Management is responsible for the preparation of these financial statements that give a true and fair view of the financial position, financial performance and cash flows of the Company in accordance with the Accounting Standards referred to in Section 211(3C) of the Companies Act, 1956 (“the Act”) and in accordance with the accounting principles generally accepted in India. This responsibility includes the design, implementation and maintenance of internal control relevant to the preparation and presentation of the financial statements that give a true and fair view and are free from material misstatement, whether due to fraud or error.
Auditors’ Responsibility
Our responsibility is to express an opinion on these financial statements based on our audit. We conducted our audit in accordance with the Standards on Auditing issued by the Institute of Chartered Accountants of India. Those Standards require that we comply with ethical requirements and plan and perform the audit to obtain reasonable assurance about whether the financial statements are free from material misstatement.
An audit involves performing procedures to obtain audit evidence about the amounts and the disclosures in the financial statements. The procedures selected depend on the auditor’s judgment, including the assessment of the risks of material misstatement of the financial statements, whether due to fraud or error. In making those risk assessments, the auditor considers internal control relevant to the Company’s preparation and fair presentation of the financial statements in order to design audit procedures that are appropriate in the circumstances, but not for the purpose of expressing an opinion on the effectiveness of the Company’s internal control. An audit also includes evaluating the appropriateness of the accounting policies used and the reasonableness of the accounting estimates made by the Management, as well as evaluating the overall presentation of the financial statements.
We believe that the audit evidence we have obtained is sufficient and appropriate to provide a basis for our audit opinion.
Opinion
In our opinion and to the best of our information and according to the explanations given to us, the aforesaid financial statements give the information required by the Act in the manner so required and give a true and fair view in conformity with the accounting principles generally accepted in India:
(a) in the case of the Balance Sheet, of the state of affairs of the Company as at 31 March, 2013;
(b) in the case of the Statement of Profit and Loss, of the profit of the Company for the year ended on that date; and
(c) in the case of the Cash Flow Statement, of the cash flows of the Company for the year ended on that date.
111
Report on Other Legal and Regulatory Requirements
1. As required by the Companies (Auditor’s Report) Order, 2003 (“the Order”) issued by the Central Government in terms of Section 227(4A) of the Act, we give in the Annexure a statement on the matters specified in paragraphs 4 and 5 of the Order.
2. As required by Section 227(3) of the Act, we report that:
(a) We have obtained all the information and explanations which to the best of our knowledge and belief were necessary for the purposes of our audit.
(b) In our opinion, proper books of account as required by law have been kept by the Company so far as it appears from our examination of those books.
(c) The Balance Sheet, the Statement of Profit and Loss and the Cash Flow Statement dealt with by this Report are in agreement with the books of account.
(d) In our opinion, the Balance Sheet, the Statement of Profit and Loss and the Cash Flow Statement comply with the Accounting Standards referred to in Section 211(3C) of the Act.
(e) On the basis of the written representations received from the directors as on 31 March, 2013 taken on record by the Board of Directors, none of the directors is disqualified as on 31 March, 2013 from being appointed as a director in terms of Section 274(1) (g) of the Act.
For DELOITTE HASKINS & SELLSChartered Accountants
(Firm Registration No. 008072S)
Ganesh Balakrishnan Partner
(Membership No. 201193)
SECUNDERABAD, May 9, 2013

112
ANNEXURE TO THE INDEPENDENT AUDITORS’ REPORT
(Referred to in paragraph 1 under ‘Report on Other Legal and Regulatory Requirements’ section of our report of even date)
Having regard to the nature of the Company’s business / activities / results during the year, clauses (x), (xii), (xiii), (xiv), (xv), (xviii), (xix) and (xx) of paragraph 4 of the Order are not applicable to the Company.
(i) In respect of its fixed assets:
(a) The Company has maintained proper records showing full particulars, including quantitative details and is in the process of updating situation of the fixed assets.
(b) The Company has a program of verification of fixed assets to cover all the items in a phased manner over a period of three years which, in our opinion, is reasonable having regard to the size of the Company and the nature of its assets. Pursuant to the program, certain fixed assets were physically verified by the Management during the year. According to the information and explanations given to us no material discrepancies were noticed on such verification.
(c) The fixed assets disposed off during the year, in our opinion, do not constitute a substantial part of the fixed assets of the Company and such disposal has, in our opinion, not affected the going concern status of the Company.
(ii) In respect of its inventories:
(a) As explained to us, the inventories were physically verified during the year by the Management at reasonable intervals.
(b) In our opinion and according to the information and explanations given to us, the procedures of physical verification of inventories followed
by the Management were reasonable and adequate in relation to the size of the Company and the nature of its business.
(c) In our opinion and according to the information and explanations given to us, the records of inventories maintained by Company need to be strengthened in relation to raw material, work in progress and stores and spares and no material discrepancies were noticed on physical verification.
(iii) The Company has neither granted nor taken any loans, secured or unsecured, to / from companies, firms or other parties covered in the Register maintained under Section 301 of the Companies Act, 1956.
(iv) In our opinion and according to the information and explanations given to us, internal control system in relation to sale of goods needs to be strengthened so as to be commensurate with the size of the company and nature of its business, having regard to the explanations that some of the items purchased are of special nature and suitable alternative sources are not readily available for obtaining comparable quotations, there is an adequate internal control system commensurate with the size of the Company and the nature of its business with regard to purchases of inventory and fixed assets and the sale of services. During the course of our audit, we have not observed any major weakness in such internal control system.
(v) In respect of contracts or arrangements entered in
the Register maintained in pursuance of Section 301 of the Companies Act, 1956, to the best of our knowledge and belief and according to the information and explanations given to us:
(a) The particulars of contracts or arrangements referred to in Section 301 that needed to be entered in the Register maintained under the said Section have been so entered.

113
(b) Where each of such transaction is in excess of ` 5 lakhs in respect of any party, the transactions have been made at prices which are prima facie reasonable having regard to the prevailing market prices at the relevant time, other than certain purchases which are of a special nature for which comparable quotations are not available and in respect of which we are, therefore, unable to comment.
(vi) According to the information and explanations given to us, the Company has not accepted any deposit from the public during the year.
(vii) In our opinion, the internal audit functions carried out during the year by an external agency appointed by the Management have been commensurate with the size of the Company and the nature of its business.
(viii) We have broadly reviewed the cost records maintained by the Company pursuant to the Companies (Cost Accounting Records) Rules, 2011 prescribed by the Central Government under Section 209 (1) (d) of the Companies Act, 1956 and are of the opinion that, prima facie, the prescribed cost records have been maintained. We have, however, not made a detailed examination of the cost records with a view to determine whether they are accurate or complete.
(ix) According to the information and explanations given to us, in respect of statutory dues:
(a) The Company has generally been regular in depositing undisputed statutory dues, including Provident Fund, Investor Education and Protection Fund, Employees’ State Insurance, Sales Tax, Wealth Tax, Service Tax, Customs Duty, Excise Duty, Cess and other material statutory dues applicable to it with the appropriate authorities except Income Tax.
(b) There were no undisputed amounts payable in respect of Provident Fund, Investor Education and Protection Fund, Employees’ State Insurance, Sales Tax, Wealth Tax, Service Tax, Customs Duty, Excise Duty, Cess and other material statutory
dues in arrears as at 31 March, 2013 for a period of more than six months from the date they became payable except income tax as given below.
(c) No disputed amounts payable in respect of Income tax, Sales Tax, Wealth Tax, Service Tax, Customs Duty, Excise Duty and Cess as at 31 March, 2013.
(x) In our opinion and according to the information and explanations given to us, the Company has not defaulted in the repayment of dues to banks.
(xi) In our opinion and according to the information and explanations given to us, the term loans have been applied for the purposes for which they were obtained.
(xii) In our opinion and according to the information and explanations given to us, and on an overall examination of the Balance Sheet of the Company, we report that funds raised on short-term basis have, prima facie, not been used during the year for long-term investment.
(xiii) To the best of our knowledge and according to the information and explanations given to us, no fraud by the Company and no fraud on the Company has been noticed or reported during the year.
For DELOITTE HASKINS & SELLSChartered Accountants
(Firm Registration No. 008072S)
Ganesh Balakrishnan Partner
(Membership No. 201193)SECUNDERABAD, May 9, 2013
Name of the statute
Nature of the dues
AmountIn Lakhs
Period to which the amount relates
Due date Date of Payment
Income Tax act, 1961
Advance tax
74.29 April 2012 -June 2012
June 15, 2012
Yet to be paid
Advance tax
150.75 July 2012 - Sept. 2012
Sept. 15, 2012
Yet to be paid

114
Balance Sheet as at 31 March, 2013 Particulars Note No. As at As at 31 March, 2013 31 March, 2012 ` in lakhs ` in lakhs
A EQUITY AND LIABILITIES 1 Shareholders’ funds a) Share capital 3 2,749.05 2,500.00 b) Reserves and surplus 4 4,298.78 1,713.54 7047.83 4,213.54 2 Non-current liabilities a) Long-term borrowings 5 – 367.42 b) Deferred tax liabilities (net) 32 134.42 254.98 c) Other long-term liabilities 6 165.92 69.90 d) Long-term provisions 7 107.29 67.19 407.63 759.49 3 Current liabilities a) Short-term borrowings 8 4,944.27 4,772.90 b) Trade payables 9 5,296.81 4,541.05 c) Other current liabilities 10 5,279.35 4,068.55 d) Short-term provisions 11 791.97 60.68 16,312.40 13,443.18
TOTAL 23767.86 18,416.21
B ASSETS 1 Non-current assets a) Fixed assets i) Tangible assets 12.A 4,458.47 4,614.55 ii) Intangible assets 12.B 169.89 172.48 iii) Capital work-in-progress 36 1,374.98 148.45 6,003.34 4,935.48 b) Non-current investments 13 – 1.00 c) Long-term loans and advances 14 113.14 237.98 d) Other non current assets 15 380.12 355.27 6,496.60 5,529.73 2 Current assets a) Current investments 16 330.00 – b) Inventories 17 4,555.90 4,322.76 c) Trade receivables 18 6,336.06 4,363.32 d) Cash and cash equivalents 19 2,589.92 608.49 e) Short-term loans and advances 20 861.57 807.35 f) Other current assets 21 2,597.81 2,784.56 17,271.26 12,886.48 TOTAL 23,767.86 18,416.21 See accompanying notes forming part of the financial statements 1 & 2 In terms of our report attached. For Deloitte Haskins & Sells For and on behalf of the Board of Directors Chartered Accountants Ganesh Balakrishnan PV Rao Aditya N Rao Partner Managing Director Vice Chairman
Mirza Mohammed Ali Baig V Rajeshwari Company Secretary Senior Manager Finance
Place: Secunderabad Place: Hyderabad Date : May 9, 2013 Date : May 9, 2013
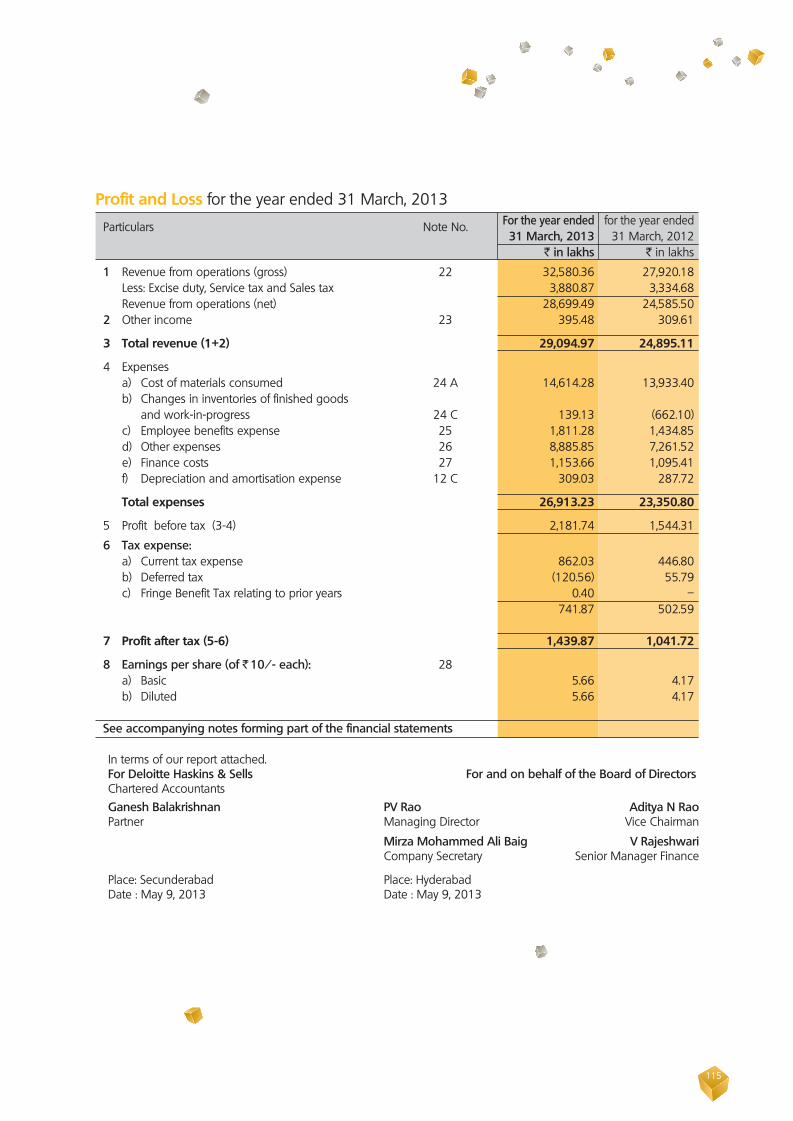
115
In terms of our report attached. For Deloitte Haskins & Sells For and on behalf of the Board of Directors Chartered Accountants Ganesh Balakrishnan PV Rao Aditya N Rao Partner Managing Director Vice Chairman
Mirza Mohammed Ali Baig V Rajeshwari Company Secretary Senior Manager Finance
Place: Secunderabad Place: Hyderabad Date : May 9, 2013 Date : May 9, 2013
Profit and Loss for the year ended 31 March, 2013 Particulars Note No. For the year ended for the year ended 31 March, 2013 31 March, 2012 ` in lakhs ` in lakhs
1 Revenue from operations (gross) 22 32,580.36 27,920.18 Less: Excise duty, Service tax and Sales tax 3,880.87 3,334.68 Revenue from operations (net) 28,699.49 24,585.50 2 Other income 23 395.48 309.61
3 Total revenue (1+2) 29,094.97 24,895.11
4 Expenses a) Cost of materials consumed 24 A 14,614.28 13,933.40 b) Changes in inventories of finished goods and work-in-progress 24 C 139.13 (662.10) c) Employee benefits expense 25 1,811.28 1,434.85 d) Other expenses 26 8,885.85 7,261.52 e) Finance costs 27 1,153.66 1,095.41 f) Depreciation and amortisation expense 12 C 309.03 287.72
Total expenses 26,913.23 23,350.80
5 Profit before tax (3-4) 2,181.74 1,544.31
6 Tax expense: a) Current tax expense 862.03 446.80 b) Deferred tax (120.56) 55.79 c) Fringe Benefit Tax relating to prior years 0.40 – 741.87 502.59 7 Profit after tax (5-6) 1,439.87 1,041.72
8 Earnings per share (of ` 10/- each): 28 a) Basic 5.66 4.17 b) Diluted 5.66 4.17 See accompanying notes forming part of the financial statements
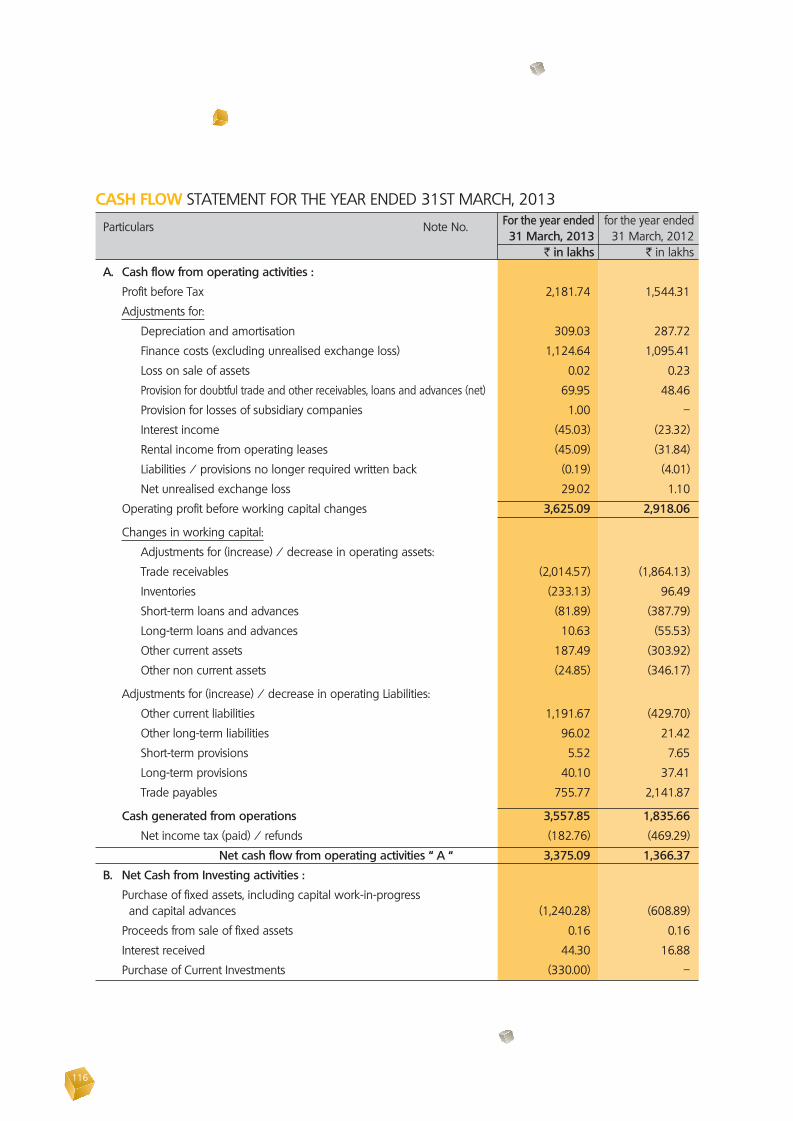
116
CASH FLOW STATEMENT FOR THE YEAR ENDED 31ST MARCH, 2013 Particulars Note No. For the year ended for the year ended 31 March, 2013 31 March, 2012 ` in lakhs ` in lakhs
A. Cash flow from operating activities :
Profit before Tax 2,181.74 1,544.31
Adjustments for:
Depreciation and amortisation 309.03 287.72
Finance costs (excluding unrealised exchange loss) 1,124.64 1,095.41
Loss on sale of assets 0.02 0.23
Provision for doubtful trade and other receivables, loans and advances (net) 69.95 48.46
Provision for losses of subsidiary companies 1.00 –
Interest income (45.03) (23.32)
Rental income from operating leases (45.09) (31.84)
Liabilities / provisions no longer required written back (0.19) (4.01)
Net unrealised exchange loss 29.02 1.10
Operating profit before working capital changes 3,625.09 2,918.06
Changes in working capital:
Adjustments for (increase) / decrease in operating assets:
Trade receivables (2,014.57) (1,864.13)
Inventories (233.13) 96.49
Short-term loans and advances (81.89) (387.79)
Long-term loans and advances 10.63 (55.53)
Other current assets 187.49 (303.92)
Other non current assets (24.85) (346.17)
Adjustments for (increase) / decrease in operating Liabilities:
Other current liabilities 1,191.67 (429.70)
Other long-term liabilities 96.02 21.42
Short-term provisions 5.52 7.65
Long-term provisions 40.10 37.41
Trade payables 755.77 2,141.87
Cash generated from operations 3,557.85 1,835.66
Net income tax (paid) / refunds (182.76) (469.29)
Net cash flow from operating activities “ A “ 3,375.09 1,366.37
B. Net Cash from Investing activities :
Purchase of fixed assets, including capital work-in-progress and capital advances (1,240.28) (608.89)
Proceeds from sale of fixed assets 0.16 0.16
Interest received 44.30 16.88
Purchase of Current Investments (330.00) –
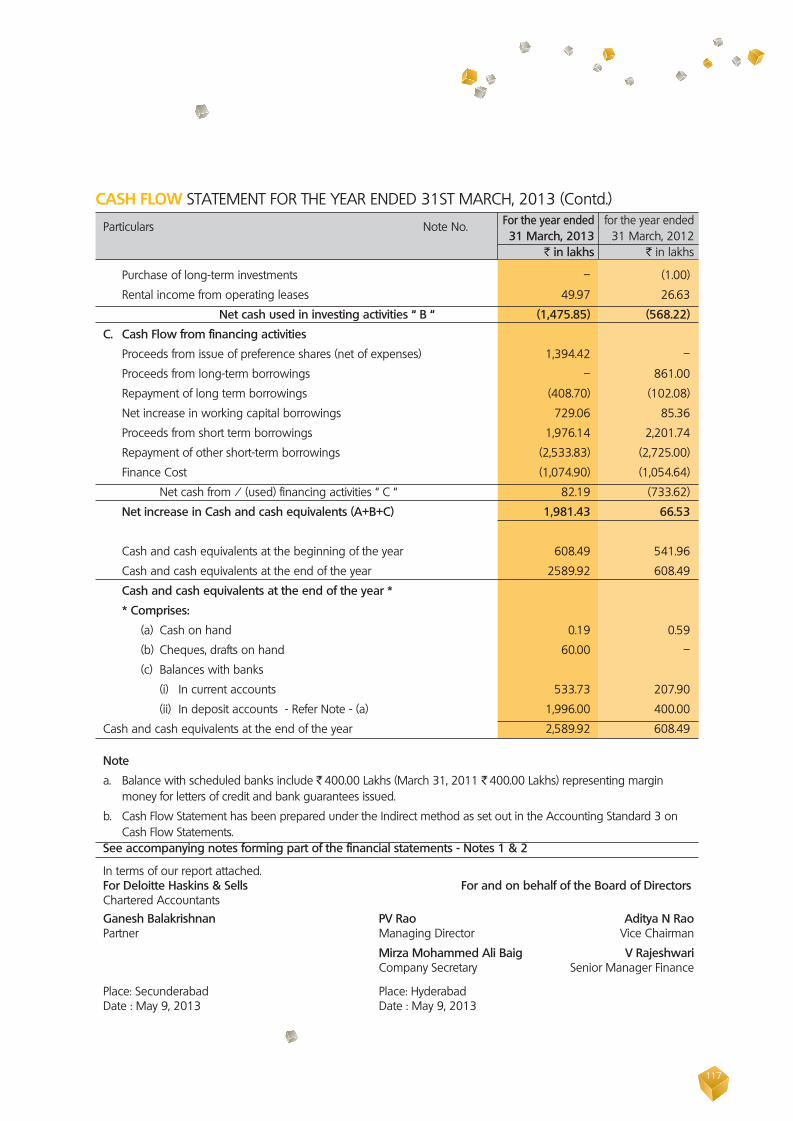
117
CASH FLOW STATEMENT FOR THE YEAR ENDED 31ST MARCH, 2013 (Contd.) Particulars Note No. For the year ended for the year ended 31 March, 2013 31 March, 2012 ` in lakhs ` in lakhs
Purchase of long-term investments – (1.00)
Rental income from operating leases 49.97 26.63
Net cash used in investing activities “ B “ (1,475.85) (568.22)
C. Cash Flow from financing activities
Proceeds from issue of preference shares (net of expenses) 1,394.42 –
Proceeds from long-term borrowings – 861.00
Repayment of long term borrowings (408.70) (102.08)
Net increase in working capital borrowings 729.06 85.36
Proceeds from short term borrowings 1,976.14 2,201.74
Repayment of other short-term borrowings (2,533.83) (2,725.00)
Finance Cost (1,074.90) (1,054.64)
Net cash from / (used) financing activities “ C “ 82.19 (733.62)
Net increase in Cash and cash equivalents (A+B+C) 1,981.43 66.53
Cash and cash equivalents at the beginning of the year 608.49 541.96
Cash and cash equivalents at the end of the year 2589.92 608.49
Cash and cash equivalents at the end of the year *
* Comprises:
(a) Cash on hand 0.19 0.59
(b) Cheques, drafts on hand 60.00 –
(c) Balances with banks
(i) In current accounts 533.73 207.90
(ii) In deposit accounts - Refer Note - (a) 1,996.00 400.00
Cash and cash equivalents at the end of the year 2,589.92 608.49
Note
a. Balance with scheduled banks include ` 400.00 Lakhs (March 31, 2011 ` 400.00 Lakhs) representing margin money for letters of credit and bank guarantees issued.
b. Cash Flow Statement has been prepared under the Indirect method as set out in the Accounting Standard 3 on Cash Flow Statements.
See accompanying notes forming part of the financial statements - Notes 1 & 2
In terms of our report attached. For Deloitte Haskins & Sells For and on behalf of the Board of Directors Chartered Accountants Ganesh Balakrishnan PV Rao Aditya N Rao Partner Managing Director Vice Chairman
Mirza Mohammed Ali Baig V Rajeshwari Company Secretary Senior Manager Finance
Place: Secunderabad Place: Hyderabad Date : May 9, 2013 Date : May 9, 2013

118
Notes forming part of the financial statements
1 Corporate information
Pennar Engineered Building Systems Limited is into design, manufacture, supply, service and installation of
pre engineered steel buildings, building components and erection for industries, warehouses, commercial centres,
Multi storied buildings, aircraft hangars, defence installations, many others.
The companies registered office is at Hyderabad and Manufacturing Plant is located at Sadashivpet, Medak district
of Andhra Pradesh“
2 Significant accounting policies
2.1 Basis of accounting and preparation of financial statements
The financial statements of the Company have been prepared in accordance with the Generally Accepted
Accounting Principles in India (Indian GAAP) to comply with the Accounting Standards notified under the
Companies (Accounting Standards) Rules, 2006 (as amended) and the relevant provisions of the Companies
Act, 1956. The financial statements have been prepared on accrual basis under the historical cost convention.
The accounting policies adopted in the preparation of the financial statements are consistent with those
followed in the previous year.
2.2 Use of estimates
The preparation of the financial statements in conformity with Indian GAAP requires the Management
to make estimates and assumptions considered in the reported amounts of assets and liabilities (including
contingent liabilities) and the reported income and expenses during the year. The Management believes that
the estimates used in preparation of the financial statements are prudent and reasonable. Future results could
differ due to these estimates and the differences between the actual results and the estimates are recognised
in the years in which the results are known / materialise.
2.3 Inventories
Inventories are valued at the lower of cost (weighted average basis) and the net realisable value after providing
for obsolescence and other losses, where considered necessary. Cost includes all charges in bringing the
goods to the point of sale, including octroi and other levies, transit insurance and receiving charges. Work-in-
progress and finished goods include appropriate proportion of overheads and where applicable, excise duty.

119
2.4 Cash and cash equivalents (for purposes of Cash Flow Statement)
Cash comprises cash on hand and demand deposits with banks. Cash equivalents are short-term (with an
original maturity of three months or less from the date of acquisition), highly liquid investments that are readily
convertible into known amounts of cash and which are subject to insignificant risk of changes in value.
2.5 Cash flow statement
Cash flows are reported using the indirect method, whereby profit before tax is adjusted for the effects of
transactions of non-cash nature and any deferrals or accruals of past or future cash receipts or payments. The
cash flows from operating, investing and financing activities of the Company are segregated based on the
available information.
2.6 Depreciation and amortisation
Depreciation has been provided on the straight-line method as per the rates prescribed in Schedule XIV to
the Companies Act, 1956 except in respect of the following categories of assets, in whose case the life of the
assets has been assessed as under:
Leasehold improvements are amortised over the duration of the lease
Electronic equipments are depreciated over the duration of 3 years
Assets costing less than ` 5,000 each are fully depreciated in the year of capitalisation
Intangible assets are amortised over their estimated useful life as follows:
Licence fees, over the duration of license or 10 years whichever is less
Software over the duration of 10 years
2.7 Revenue recognition
Sale of goods and income from services.
Sales are recognised, net of returns and trade discounts, on transfer of significant risks and rewards of
ownership to the buyer, which generally coincides with the delivery of goods to customers.
“Revenues from contracts are recognised with reference to the completion of the contract activity at the
reporting date and where the contract activity is extended beyond the reporting date, on the basis of
Percentage of Completion method. Foreseeable losses on such contracts are recognised when probable.“
Sales include excise duty, service tax and sales tax.
Notes forming part of the financial statements
120
2.8 Other income
Interest income is accounted on accrual basis.
2.9 Tangible fixed assets
Fixed assets are carried at cost less accumulated depreciation. The cost of fixed assets includes all the financial
costs and other incidental expenses upto the date of commissioning. Machinery spares which can be used
only in connection with an item of fixed asset and whose use is expected to be irregular are capitalised and
depreciated over the useful life of the principal item of the relevant assets. Subsequent expenditure on fixed
assets after its purchase / completion is capitalised only if such expenditure results in an increase in the future
benefits from such asset beyond its previously assessed standard of performance.
Fixed assets acquired and put to use for project purpose are capitalised and depreciation thereon is included
in the project cost till commissioning of the project.
Capital work-in-progress:
Projects under which tangible fixed assets are not ready for their intended use and other capital work-in-
progress are carried at cost, comprising direct cost, related incidental expenses and attributable interest.
2.10 Intangible assets
Intangible assets are carried at cost less accumulated amortisation. The cost of an intangible asset comprises
its purchase price, including any import duties and other taxes (other than those subsequently recoverable
from the taxing authorities), and any directly attributable expenditure on making the asset ready for its
intended use and net of any trade discounts and rebates. Subsequent expenditure on an intangible asset
after its purchase / completion is recognised as an expense when incurred unless it is probable that such
expenditure will enable the asset to generate future economic benefits in excess of its originally assessed
standards of performance and such expenditure can be measured and attributed to the asset reliably, in
which case such expenditure is added to the cost of the asset.
2.11 Foreign currency transactions and translations
Initial recognition
Transactions in foreign currencies entered into by the Company are accounted at the exchange
rates prevailing on the date of the transaction or at rates that closely approximate the rate at the date of
the transaction.
Notes forming part of the financial statements

121
Measurement at the balance sheet date
Foreign currency monetary items (other than derivative contracts) of the Company, outstanding at the
balance sheet date are restated at the year-end rates. Non-monetary items of the Company are carried at
historical cost.
Exchange differences arising out of these translations are charged to the Statement of Profit and Loss.
Accounting of forward contracts
Premium / discount on forward exchange contracts, which are not intended for trading or speculation
purposes, are amortised over the period of the contracts if such contracts relate to monetary items as at the
balance sheet date.
2.12 Government grants, subsidies and export incentives
Government grants and subsidies are recognised when there is reasonable assurance that the Company will
comply with the conditions attached to them and the grants / subsidy will be received. Government grants
whose primary condition is that the Company should purchase, construct or otherwise acquire capital assets
are presented by deducting them from the carrying value of the assets. The grant is recognised as income
over the life of a depreciable asset by way of a reduced depreciation charge.
Export benefits are accounted for in the year of exports based on eligibility and when there is no uncertainty
in receiving the same.
Other government grants and subsidies are recognised as income over a period necessary to match them
with the costs for which they are intended to compensate, on a systematic basis.
2.13 Investments
Long-term investments, are carried individually at cost less provision for diminution, other than temporary cost
of investments include acquisition charges such as brokerage, fees and duties.
Current Investment
Current investments are carried individually, at the lower of cost and fair value.
Notes forming part of the financial statements

122
2.14 Employee benefits
Employee benefits include provident fund, gratuity fund and compensated absences.
Defined contribution plans
The Company’s contribution to provident fund and employee state insurance scheme are considered
as defined contribution plans and are charged as an expense as they fall due based on the amount of
contribution required to be made.
Defined benefit plans
For defined benefit plans in the form of gratuity fund the cost of providing benefits is determined using the
Projected Unit Credit method, with actuarial valuations being carried out at each Balance Sheet date. Actuarial
gains and losses are recognised in the Statement of Profit and Loss in the year in which they occur. Past service
cost is recognised immediately to the extent that the benefits are already vested and otherwise is amortised
on a straight-line basis over the average period until the benefits become vested. The retirement benefit
obligation recognised in the Balance Sheet represents the present value of the defined benefit obligation as
adjusted for unrecognised past service cost.
Short-term employee benefits
The undiscounted amount of short-term employee benefits expected to be paid in exchange for the services
rendered by employees are recognised during the year when the employees render the service. These
benefits include performance incentive and compensated absences which are expected to occur within
twelve months after the end of the year in which the employee renders the related service. The cost of such
compensated absences is accounted as under :
(a) in case of accumulated compensated absences, when employees render the services that increase their
entitlement of future compensated absences; and
(b) in case of non-accumulating compensated absences, when the absences occur.
Long-term employee benefits
Compensated absences which are not expected to occur within twelve months after the end of the year
in which the employee renders the related service are recognised as a liability at the present value of the
defined benefit obligation as at the Balance Sheet date less the fair value of the plan assets out of which the
obligations are expected to be settled.

123
2.15 Leases
Lease arrangements where the risks and rewards incidental to ownership of an asset substantially vest with
the lessor are recognised as operating leases. Lease rentals under operating leases are recognised in the
Statement of Profit and Loss on a straight-line basis.
2.16 Earnings per share
Basic earnings per share is computed by dividing the profit after tax as adjusted for preference dividend by
the weighted average number of equity shares outstanding during the year. Diluted earnings per share is
computed by dividing the profit after tax, by the weighted average number of equity shares considered for
deriving basic earnings per share and the weighted average number of equity shares which could have
been issued on the conversion of all dilutive potential equity shares. Potential equity shares are deemed to
be dilutive only if their conversion to equity shares would decrease the net profit per share from continuing
ordinary operations.
2.17 Taxes on income
Current tax is the amount of tax payable on the taxable income for the year as determined in accordance with
the provisions of the Income Tax Act, 1961.
Minimum Alternate Tax (MAT) paid in accordance with the tax laws, which gives future economic benefits in
the form of adjustment to future income tax liability, is considered as an asset if there is convincing evidence
that the Company will pay normal income tax. Accordingly, MAT is recognised as an asset in the Balance
Sheet when it is probable that future economic benefit associated with it will flow to the Company.
Deferred tax is recognised on timing differences, being the differences between the taxable income and
the accounting income that originate in one period and are capable of reversal in one or more subsequent
periods. Deferred tax is measured using the tax rates and the tax laws enacted or substantially enacted as at
the reporting date. Deferred tax assets are reviewed at each Balance Sheet date for their realisability.
2.18 Impairment of assets
The carrying values of assets / cash generating units at each Balance Sheet date are reviewed for impairment.
If any indication of impairment exists, the recoverable amount of such assets is estimated and impairment is
recognised, if the carrying amount of these assets exceeds their recoverable amount. The recoverable amount
is the greater of the net selling price and their value in use. Value in use is arrived at by discounting the future
cash flows to their present value based on an appropriate discount factor.
124
2.19 Provisions and contingencies
A provision is recognised when the Company has a present obligation as a result of past events and it is
probable that an outflow of resources will be required to settle the obligation in respect of which a reliable
estimate can be made. Provisions (excluding retirement benefits) are not discounted to their present value
and are determined based on the best estimate required to settle the obligation at the Balance Sheet date.
These are reviewed at each Balance Sheet date and adjusted to reflect the current best estimates. Contingent
liabilities are disclosed in the Notes.Contingent assets are not recognised in the financial statements.
2.20 Share issue expenses
Share issue expenses are adjusted against the Securities premium account as permissible under Section
78(2) of the Companies Act, 1956, to the extent balance is available for utilisation in the Securities
Premium Account.
2.21 Insurance claims
Insurance claims are accounted for on the basis of claims admitted / expected to be admitted and to the
extent that there is no uncertainty in receiving the claims.
2.22 Service tax input credit
Service tax input credit is accounted for in the books in the year in which the underlying service received is
accounted and when there is no uncertainty in availing / utilising the credits.
2.23 Operating Cycle
Based on the nature of products / activities of the Company and the normal time between acquisition of
assets and their realisation in cash or cash equivalents, the Company has determined its operating cycle as
12 months for the purpose of classification of its assets and liabilities as current and non-current.

125
Note 3 : Share capital Particulars As at As at 31 March, 2013 31 March, 2012 No. of Shares ` in lakhs No. of Shares ` in lakhs (a) Authorised Equity shares of ` 10 each 31,500,000 3,150.00 25,500,000 2,550.00 Compulsorily convertible preference shares of ` 10 each 6,000,000 600.00 – – (b) Issued Subscribed and fully paid up Equity shares of ` 10 each 25,000,000 2,500.00 25,000,000 2,500.00 Compulsorily convertible preference shares of `10 each 2,490,530 249.05 – – Total 27,490,530 2,749.05 25,000,000 2,500.00
i) Reconciliation of number of shares and amount outstanding at the beginning and at the end of the reporting year
Particulars As at As at 31 March, 2013 31 March, 2012 No. of Shares ` in lakhs No. of Shares ` in lakhs Equity Shares Opening balance 25,000,000 2,500.00 25,000,000 2,500.00 Add: Movement during the year – – – – Closing balance 25,000,000 2,500.00 25,000,000 2,500.00
Compulsorily convertible preference shares Opening balance – – – – Add: Movement during the year 2,490,530 249.05 – –
Closing balance 2,490,530 249.05 – – (ii) Details of shares held by the holding company :
Particulars As at As at 31 March, 2013 31 March, 2012 Number of Shares Number of Shares
Equity shares Pennar Industries Limited 18,500,000 18,500,000
(iii) Details of shares held by each shareholder holding more than 5% shares:
Name of shareholder As at As at 31 March, 2013 31 March, 2012 Number of % holding in that Number of % holding in that shares class of shares shares class of shares Equity shares - Refer note 35 Aditya N Rao 1,515,000 6.06 1,515,000 6.06 J Rajya Lakshmi 1,355,000 5.42 1,355,000 5.42 Pennar Industries Limited 18,500,000 74.00 18,500,000 74.00 Preference Shares - Refer note 34 Zephyr Peacock India Fund III Limited 2,490,530 100.00 – –
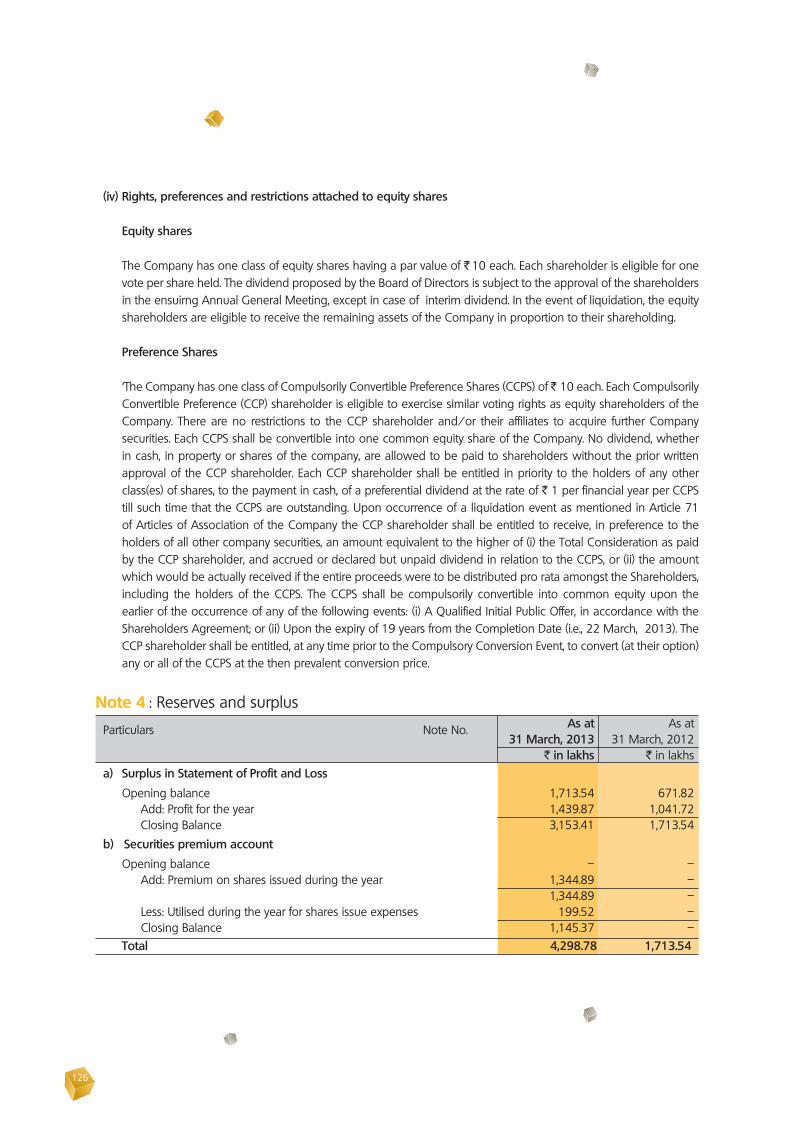
126
(iv) Rights, preferences and restrictions attached to equity shares
Equity shares The Company has one class of equity shares having a par value of ` 10 each. Each shareholder is eligible for one
vote per share held. The dividend proposed by the Board of Directors is subject to the approval of the shareholders in the ensuirng Annual General Meeting, except in case of interim dividend. In the event of liquidation, the equity shareholders are eligible to receive the remaining assets of the Company in proportion to their shareholding.
Preference Shares ‘The Company has one class of Compulsorily Convertible Preference Shares (CCPS) of ` 10 each. Each Compulsorily
Convertible Preference (CCP) shareholder is eligible to exercise similar voting rights as equity shareholders of the Company. There are no restrictions to the CCP shareholder and/or their affiliates to acquire further Company securities. Each CCPS shall be convertible into one common equity share of the Company. No dividend, whether in cash, in property or shares of the company, are allowed to be paid to shareholders without the prior written approval of the CCP shareholder. Each CCP shareholder shall be entitled in priority to the holders of any other class(es) of shares, to the payment in cash, of a preferential dividend at the rate of ` 1 per financial year per CCPS till such time that the CCPS are outstanding. Upon occurrence of a liquidation event as mentioned in Article 71 of Articles of Association of the Company the CCP shareholder shall be entitled to receive, in preference to the holders of all other company securities, an amount equivalent to the higher of (i) the Total Consideration as paid by the CCP shareholder, and accrued or declared but unpaid dividend in relation to the CCPS, or (ii) the amount which would be actually received if the entire proceeds were to be distributed pro rata amongst the Shareholders, including the holders of the CCPS. The CCPS shall be compulsorily convertible into common equity upon the earlier of the occurrence of any of the following events: (i) A Qualified Initial Public Offer, in accordance with the Shareholders Agreement; or (ii) Upon the expiry of 19 years from the Completion Date (i.e., 22 March, 2013). The CCP shareholder shall be entitled, at any time prior to the Compulsory Conversion Event, to convert (at their option) any or all of the CCPS at the then prevalent conversion price.
Note 4 : Reserves and surplus Particulars Note No. As at As at 31 March, 2013 31 March, 2012 ` in lakhs ` in lakhs a) Surplus in Statement of Profit and Loss
Opening balance 1,713.54 671.82 Add: Profit for the year 1,439.87 1,041.72 Closing Balance 3,153.41 1,713.54
b) Securities premium account Opening balance – – Add: Premium on shares issued during the year 1,344.89 – 1,344.89 – Less: Utilised during the year for shares issue expenses 199.52 – Closing Balance 1,145.37 – Total 4,298.78 1,713.54

127
Note 7 : Long-term provisions
Particulars As at As at 31 March, 2013 31 March, 2012 ` in lakhs ` in lakhs Provision for employee benefits: (Refer Note 31.2 b) (i) Provision for compensated absences 34.62 28.32 (ii) Provision for gratuity 72.67 38.87 Total 107.29 67.19
Note 5 : Long-term borrowings
Particulars As at As at 31 March, 2013 31 March, 2012 ` in lakhs ` in lakhs (a) Term loans From bank (Secured) Refer Note -ii (a) – 361.00
(b) Vehicle Loan From bank (Secured) Refer Note - ii (b) – 6.42 Total – 367.42
Note: i) Current maturities of long term borrowings have been disclosed under the head Other Current Liabilities
(Refer Note 10) ii) Secured loan from Bank comprises : (a) Term loan from Axis Bank of ` 361 lakhs (Previous Year: ` 761 lakhs) primarily secured by Pari passu first
charge on the entire fixed assets of the company, present and future, including equitable mortgage of land admeasuring Acre 25.21 1/2 guntas under Survey Numbers 88 to 92 (part) of Ankanapally Village & Survey Numbers 144 to 145 (part) of Chandapur Village Sadasivapet Mandal, Medak District ( the land on which the plant is located) and secured by second charge on the entire current assets, present and future. Further secured by personal guarantee of promoter director Nrupender Rao and corporate guarantee of Pennar Industries Limited. Term Loan is repayable in 3 quarterly instalments of ` 100 lakhs each and last instalment of ` 61 lakhs (previous year 7 quarterly instalments of ` 100 lakhs each and last instalment of ` 61 lakhs. The loan carries interest rate of 15.75% per annum.
(b) Car loan from Axis Bank of ` Nil (Previous Year ` 8.70 lakhs) secured by a lien on the asset purchased. The loan is repayable in 61 monthly installments of ` 0.25 lakhs each commencing from September 10, 2010 and carries an interest of 8.99 % per annum. Loan has been repaid on 30 March, 2013
Details of long-term borrowings guaranteed by holding company and some of the directors :
Particulars As at As at 31 March, 2013 31 March, 2012 ` in lakhs ` in lakhs
Directors 6,911.00 4,861.00 Holding Company 6,911.00 4,861.00
Note 6 : Other long-term liabilities
Particulars As at As at 31 March, 2013 31 March, 2012 ` in lakhs ` in lakhs (I) Trade Payables - (a) Dues to Micro and Small Enterprise (Refer Note : 29.1) – – (b) Others 148.03 58.01 (II) Security deposits received 17.89 11.89 Total 165.92 69.90
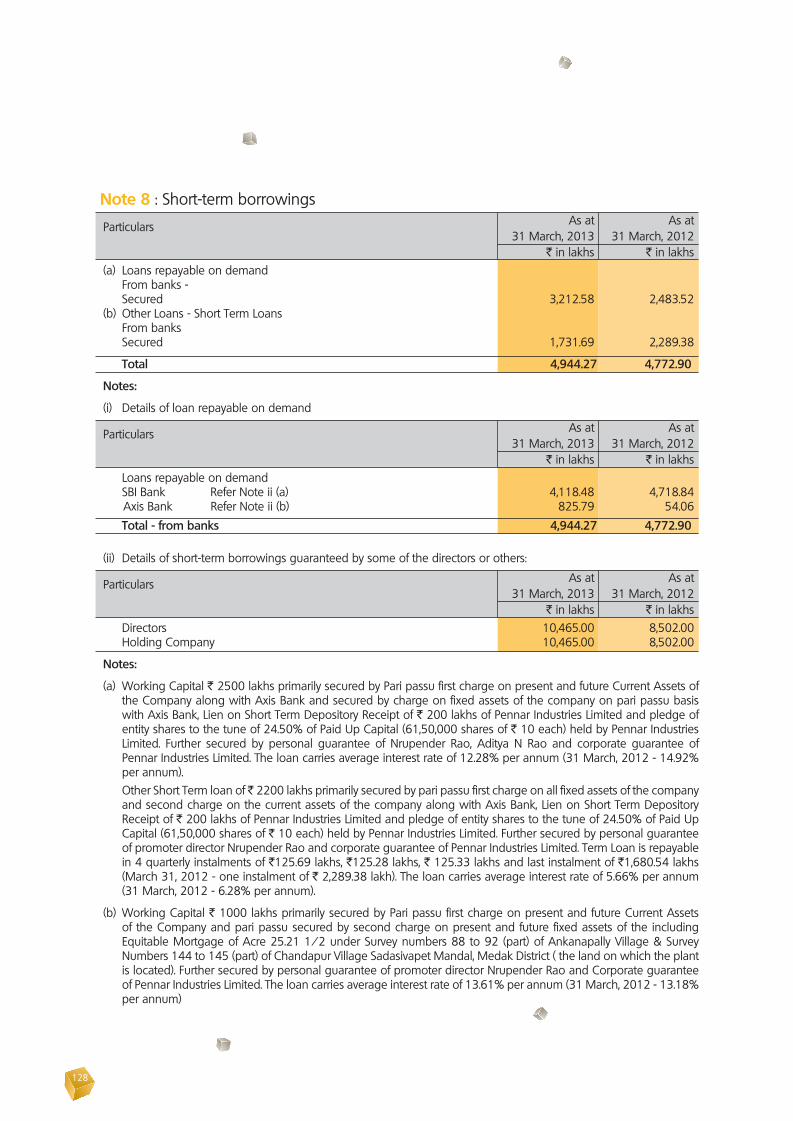
128
Note 8 : Short-term borrowings
Particulars As at As at 31 March, 2013 31 March, 2012 ` in lakhs ` in lakhs (a) Loans repayable on demand From banks - Secured 3,212.58 2,483.52 (b) Other Loans - Short Term Loans From banks Secured 1,731.69 2,289.38
Total 4,944.27 4,772.90
Notes:
(i) Details of loan repayable on demand
Particulars As at As at 31 March, 2013 31 March, 2012 ` in lakhs ` in lakhs Loans repayable on demand SBI Bank Refer Note ii (a) 4,118.48 4,718.84 Axis Bank Refer Note ii (b) 825.79 54.06
Total - from banks 4,944.27 4,772.90 (ii) Details of short-term borrowings guaranteed by some of the directors or others:
Particulars As at As at 31 March, 2013 31 March, 2012 ` in lakhs ` in lakhs Directors 10,465.00 8,502.00 Holding Company 10,465.00 8,502.00
Notes:
(a) Working Capital ` 2500 lakhs primarily secured by Pari passu first charge on present and future Current Assets of the Company along with Axis Bank and secured by charge on fixed assets of the company on pari passu basis with Axis Bank, Lien on Short Term Depository Receipt of ` 200 lakhs of Pennar Industries Limited and pledge of entity shares to the tune of 24.50% of Paid Up Capital (61,50,000 shares of ` 10 each) held by Pennar Industries Limited. Further secured by personal guarantee of Nrupender Rao, Aditya N Rao and corporate guarantee of Pennar Industries Limited. The loan carries average interest rate of 12.28% per annum (31 March, 2012 - 14.92% per annum).
Other Short Term loan of ̀ 2200 lakhs primarily secured by pari passu first charge on all fixed assets of the company and second charge on the current assets of the company along with Axis Bank, Lien on Short Term Depository Receipt of ` 200 lakhs of Pennar Industries Limited and pledge of entity shares to the tune of 24.50% of Paid Up Capital (61,50,000 shares of ` 10 each) held by Pennar Industries Limited. Further secured by personal guarantee of promoter director Nrupender Rao and corporate guarantee of Pennar Industries Limited. Term Loan is repayable in 4 quarterly instalments of `125.69 lakhs, `125.28 lakhs, ` 125.33 lakhs and last instalment of `1,680.54 lakhs (March 31, 2012 - one instalment of ` 2,289.38 lakh). The loan carries average interest rate of 5.66% per annum (31 March, 2012 - 6.28% per annum).
(b) Working Capital ` 1000 lakhs primarily secured by Pari passu first charge on present and future Current Assets of the Company and pari passu secured by second charge on present and future fixed assets of the including Equitable Mortgage of Acre 25.21 1/2 under Survey numbers 88 to 92 (part) of Ankanapally Village & Survey Numbers 144 to 145 (part) of Chandapur Village Sadasivapet Mandal, Medak District ( the land on which the plant is located). Further secured by personal guarantee of promoter director Nrupender Rao and Corporate guarantee of Pennar Industries Limited. The loan carries average interest rate of 13.61% per annum (31 March, 2012 - 13.18% per annum)
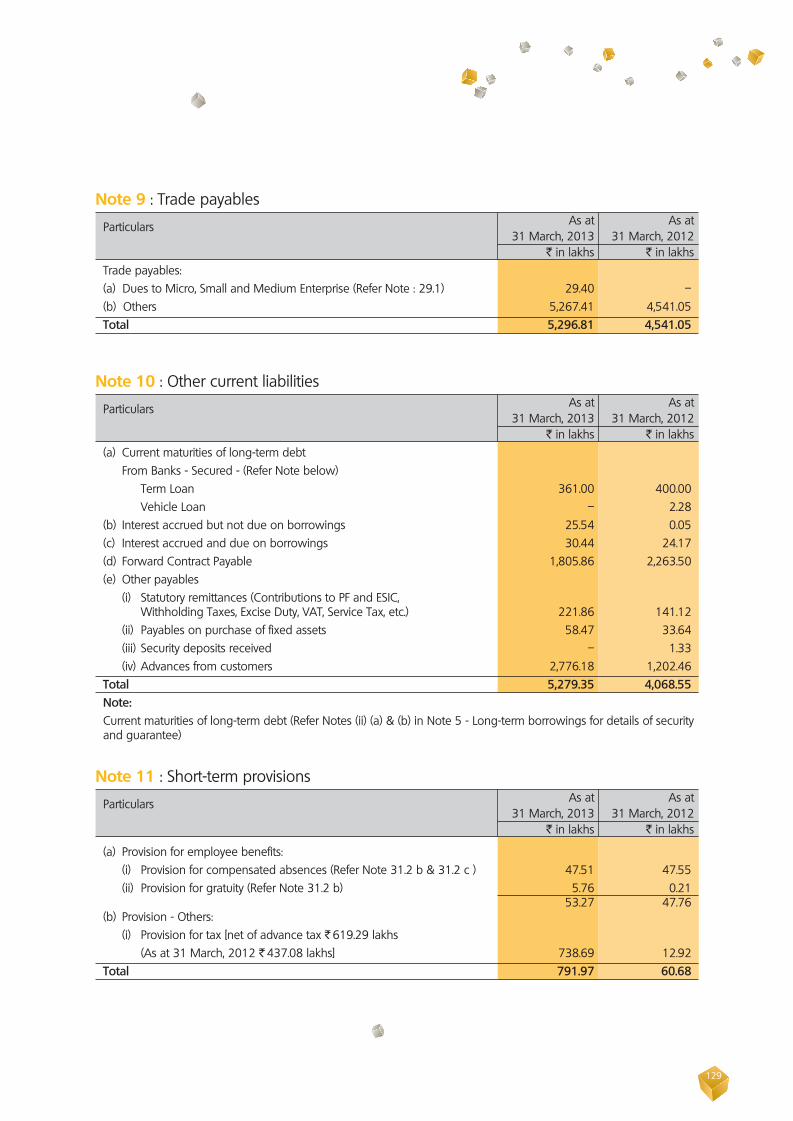
129
Note 9 : Trade payables
Particulars As at As at 31 March, 2013 31 March, 2012 ` in lakhs ` in lakhs Trade payables: (a) Dues to Micro, Small and Medium Enterprise (Refer Note : 29.1) 29.40 – (b) Others 5,267.41 4,541.05 Total 5,296.81 4,541.05
Note 10 : Other current liabilities
Particulars As at As at 31 March, 2013 31 March, 2012 ` in lakhs ` in lakhs (a) Current maturities of long-term debt From Banks - Secured - (Refer Note below) Term Loan 361.00 400.00 Vehicle Loan – 2.28 (b) Interest accrued but not due on borrowings 25.54 0.05 (c) Interest accrued and due on borrowings 30.44 24.17 (d) Forward Contract Payable 1,805.86 2,263.50 (e) Other payables (i) Statutory remittances (Contributions to PF and ESIC, Withholding Taxes, Excise Duty, VAT, Service Tax, etc.) 221.86 141.12 (ii) Payables on purchase of fixed assets 58.47 33.64 (iii) Security deposits received – 1.33 (iv) Advances from customers 2,776.18 1,202.46 Total 5,279.35 4,068.55 Note: Current maturities of long-term debt (Refer Notes (ii) (a) & (b) in Note 5 - Long-term borrowings for details of security
and guarantee)
Note 11 : Short-term provisions
Particulars As at As at 31 March, 2013 31 March, 2012 ` in lakhs ` in lakhs
(a) Provision for employee benefits: (i) Provision for compensated absences (Refer Note 31.2 b & 31.2 c ) 47.51 47.55 (ii) Provision for gratuity (Refer Note 31.2 b) 5.76 0.21 53.27 47.76 (b) Provision - Others: (i) Provision for tax [net of advance tax ` 619.29 lakhs (As at 31 March, 2012 ` 437.08 lakhs] 738.69 12.92 Total 791.97 60.68

130
Not
e 12
: Fix
ed a
sset
s
Parti
cula
rs
Gro
ss b
lock
Acc
umul
ated
dep
reci
atio
n an
d am
ortiz
atio
n N
et b
lock
Bala
nce
as a
t 1
Apr
il, 20
12
Add
ition
sD
ispos
als
Oth
er
adju
st-
men
ts
Bala
nce
as a
t 31
Mar
ch,
2013
Bala
nce
as a
t 1
Apr
il, 20
12
Dep
reci
a-tio
n /
am-
ortis
atio
n ex
pens
e fo
r the
yea
r
Elim
inat
ed
on d
ispos
al
of a
sset
s
Bala
nce
as a
t 31
Mar
ch,
2013
Bala
nce
as a
t 31
Mar
ch,
2013
Bala
nce
as a
t 31
Mar
ch,
2012
` in
lakh
s`
in la
khs
` in
lakh
s`
in la
khs
` in
lakh
s`
in la
khs
` in
lakh
s`
in la
khs
` in
lakh
s`
in la
khs
` in
lakh
s A
. Ta
ngib
le a
sset
s (a
) L
and
1
68.3
6 –
–
– 1
68.3
6 –
––
– 1
68.3
6 1
68.3
6 (P
revio
us Y
ear)
(142
.89)
(25.
47)
––
(168
.36)
––
––
(168
.36)
(142
.89)
(b)
Bui
ldin
gs
2,3
09.9
9 –
––
2,3
09.9
9 1
36.4
8 7
9.62
–
216
.10
2,0
93.8
9 2
,173
.51
(Pre
vious
Yea
r) (2
,219
.76)
(90.
23)
(2,3
09.9
9) (6
0.91
) (7
5.57
)–
(136
.48)
(2,1
73.5
1)(2
,158
.85)
(c)
Pla
nt a
nd E
quip
men
t 2
,064
.91
104
.78
––
2,1
69.6
9 2
19.2
2 1
13.1
2 –
332
.34
1,8
37.3
5 1
,845
.69
(Pre
vious
Yea
r) (2
,027
.62)
(37.
29)
––
(2,0
64.9
1) (1
01.2
4) (1
17.9
8)–
(219
.22)
(1,8
45.6
9)(1
,926
.38)
(d)
Ele
ctric
als
Equi
pmen
ts 8
5.87
–
––
85.
87
4.6
3 4
.08
– 8
.71
77.
16
81.
24
(Pre
vious
Yea
r) (9
0.33
) (7
.52)
– (1
1.98
) (8
5.87
) (0
.35)
(4.2
8)–
(4.6
3) (8
1.24
) (8
9.98
)(e
) F
urni
ture
and
Fix
ture
s 1
11.8
3 6
.11
––
117
.94
29.
39
8.7
3 –
38.
12
79.
82
82.
44
(Pre
vious
Yea
r) (9
7.46
) (1
4.37
)–
– (1
11.8
3) (1
3.35
) (1
6.04
)–
(29.
39)
(82.
44)
(84.
11)
(f) V
ehic
les
15.
59
––
– 1
5.59
2
.35
1.4
8 –
3.8
3 1
1.76
1
3.24
(P
revio
us Y
ear)
(15.
59)
––
– (1
5.59
) (0
.86)
(1.4
9)–
(2.3
5) (1
3.24
) (1
4.73
)(g
) O
ffice
equ
ipm
ent
75.
75
6.5
6 –
– 8
2.31
1
0.86
3
3.53
–
44.
39
37.
92
64.
89
(Pre
vious
Yea
r) (6
3.34
) (1
2.82
) (0
.41)
– (7
5.75
) (4
.89)
(5.9
9) (0
.02)
(10.
86)
(64.
89)
(58.
45)
(h)
Lea
seho
ld im
prov
emen
ts
Ow
ned
61.7
2–
––
61.7
219
.96
8.18
–28
.14
33.5
841
.76
Give
n un
er o
pera
ting
leas
e22
.06
––
–22
.06
6.39
4.53
–10
.92
11.1
415
.67
Tota
l 8
3.78
–
––
83.
78
26.
35
12.
71
– 3
9.06
4
4.72
5
7.43
(P
revio
us Y
ear)
(81.
92)
(1.8
6)–
– (8
3.78
) (9
.32)
(17.
03)
– (2
6.35
) (5
7.43
) (7
2.60
)(i)
Com
pute
rs
193
.32
16.
00
0.2
5 –
209
.07
65.
57
36.
08
0.0
7 1
01.5
8 1
07.4
9 1
27.7
5 (P
revio
us Y
ear)
(176
.11)
(17.
21)
––
(193
.32)
(35.
36)
(30.
21)
– (6
5.57
) (1
27.7
5) (1
40.7
5) T
otal
- ta
ngib
le a
sset
s 5
,109
.40
133
.45
0.2
5 –
5,2
42.6
0 4
94.8
5 2
89.3
5 0
.07
784
.13
4,4
58.4
7 4
,614
.55
(Pre
vious
Yea
r) (4
,915
.02)
(206
.77)
(0.4
1) (1
1.98
)(5
,109
.40)
(226
.28)
(268
.59)
(0.0
2) (4
94.8
5)(4
,614
.55)
(4,6
88.7
4) B
. In
tang
ible
ass
ets
––
Lic
ense
s
201
.19
4.7
7 –
– 2
05.9
6 3
6.26
2
0.39
–
56.
65
149
.31
164
.93
(Pre
vious
Yea
r) (1
48.4
5) (5
2.74
)–
– (2
01.1
9) (1
7.46
) (1
8.80
)–
(36.
26)
(164
.93)
(130
.99)
Com
pute
r Sof
twar
e
7.8
8 1
4.57
–
– 2
2.45
0
.33
1.5
4 –
1.8
7 2
0.58
7
.55
(Pre
vious
Yea
r) –
(7.8
8)–
– (7
.88)
–
(0.3
3)–
(0.3
3) (7
.55)
– T
otal
- In
tang
ible
ass
ets
209
.07
19.
34
––
228
.41
36.
59
21.
93
– 5
8.52
1
69.8
9 1
72.4
8 (P
revio
us Y
ear)
(148
.45)
(60.
62)
––
(209
.07)
(17.
46)
(19.
13)
– (3
6.59
) (1
72.4
8) (1
30.9
9) T
otal
5
,318
.47
152
.79
0.2
5 –
5,4
71.0
1 5
31.4
4 3
11.2
8 0
.07
842
.65
4628
.36
4,7
83.0
3(P
revio
us Y
ear)
(5,0
63.4
7)(2
67.3
9)(0
.41)
(11.
98)
(531
8.47
)(2
43.7
4)(2
87.7
2)(0
.02)
(531
.44)
(478
7.03
)(4
,819
.73)
Capi
tal w
ork-
in-p
rogr
ess@
1,37
4.98
148.
45
# G
over
nmen
t gra
nd re
ceive
d by
the
Com
pany
dur
ing
the
prev
ious
yea
r fro
m M
inist
ry o
f New
Ren
ewab
le E
nerg
y fo
r ins
talla
tion
of S
olar
equ
ipem
ent-R
efer
Not
e-30
.1@
Add
ition
s of
Cap
ital w
ork-
in-p
rogr
ess
incl
ude
expe
nditu
re c
apita
lised
-Ref
er N
ote
36.

131
C.
Dep
reci
atio
n an
d am
ortis
atio
n :
Parti
cula
rs
For t
he y
ear e
nded
F
or th
e ye
ar e
nded
31
Mar
ch, 2
013
31
Mar
ch, 2
012
` in
lakh
s `
in la
khs
On
tang
ible
ass
ets
as p
er N
ote
12 A
2
87.1
1
268
.59
On
inta
ngib
le a
sset
s as
per
Not
e 12
B
21.
92
19.
13
Dep
reci
atio
n an
d am
ortis
atio
n
309.
03
287
.72
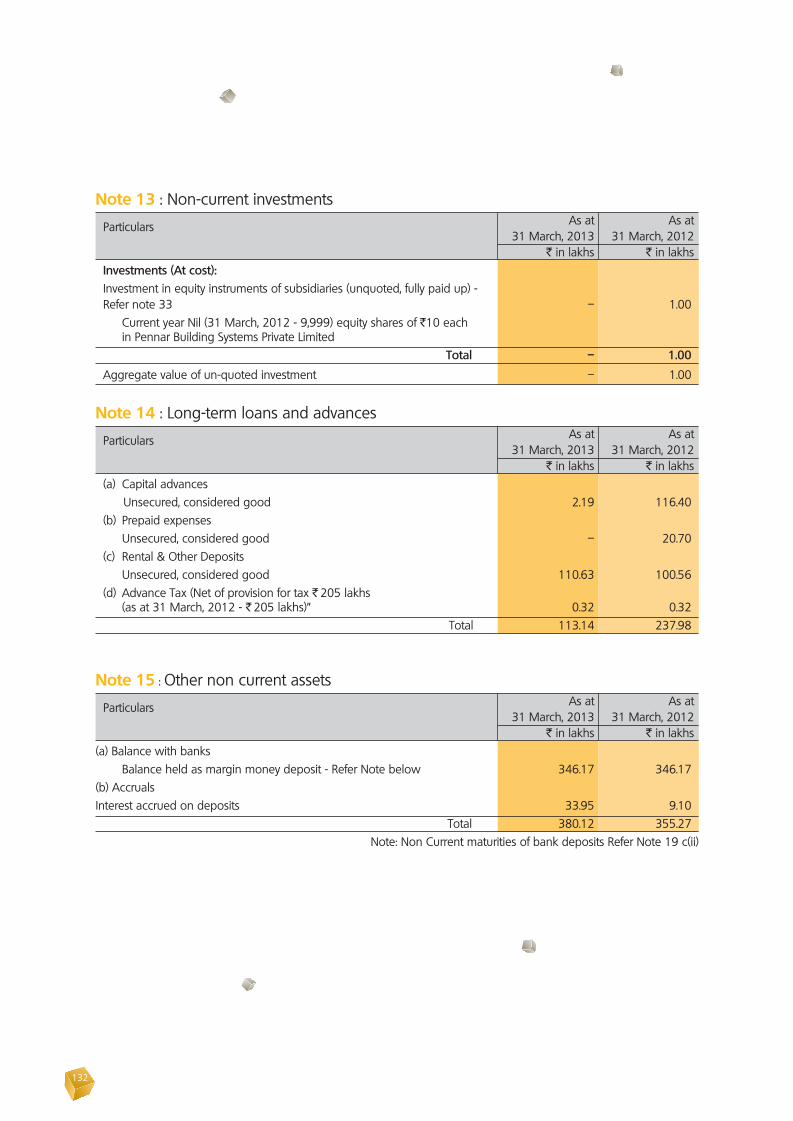
132
Note 13 : Non-current investments
Particulars As at As at 31 March, 2013 31 March, 2012 ` in lakhs ` in lakhs Investments (At cost): Investment in equity instruments of subsidiaries (unquoted, fully paid up) - Refer note 33 – 1.00 Current year Nil (31 March, 2012 - 9,999) equity shares of `10 each in Pennar Building Systems Private Limited Total – 1.00
Aggregate value of un-quoted investment – 1.00
Note 14 : Long-term loans and advances
Particulars As at As at 31 March, 2013 31 March, 2012 ` in lakhs ` in lakhs (a) Capital advances Unsecured, considered good 2.19 116.40 (b) Prepaid expenses Unsecured, considered good – 20.70 (c) Rental & Other Deposits Unsecured, considered good 110.63 100.56 (d) Advance Tax (Net of provision for tax ` 205 lakhs (as at 31 March, 2012 - ` 205 lakhs)” 0.32 0.32 Total 113.14 237.98
Note 15 : Other non current assets
Particulars As at As at 31 March, 2013 31 March, 2012 ` in lakhs ` in lakhs(a) Balance with banks Balance held as margin money deposit - Refer Note below 346.17 346.17 (b) AccrualsInterest accrued on deposits 33.95 9.10 Total 380.12 355.27
Note: Non Current maturities of bank deposits Refer Note 19 c(ii)

133
Note 16 : Current investments
Particulars As at As at 31 March, 2013 31 March, 2012 ` in lakhs ` in lakhs Other Current Investments Investment in equity instruments of subsidiaries (unquoted, fully paid up) - 1.00 Refer Note 33 9,999 Equity shares of ` 10 each in Pennar Building Systems Private Limited Less: Provision for diminution in value of investments 1.00 – Total – – Investment in mutual funds (Refer Note below) 330.00 – Total 330.00 – Aggregate value of quoted investment 330.00 – Aggregate market value of quoted investment 330.63 – Aggregate value of un-quoted investment – –
Note: Investment in mutual funds
Particulars As at As at 31 March, 2013 31 March, 2012 ` in lakhs ` in lakhs 998.07 (31 March, 2012 - Nil) units of SBI Magnum Insta Cash Fund (Growth) face value of `1000 each 20.00 – 16843.07 (31 March, 2012 - Nil) units of SBI Premier Liquid Fund (Growth) face value of ` 1000 each 310.00 – Total 330.00 –
Note 17 : Inventories (At lower of cost and net realisable value)
Particulars As at As at 31 March, 2013 31 March, 2012 ` in lakhs ` in lakhs (a) Raw materials 1,607.22 1,691.02 Goods-in-transit 38.37 (b) Work-in-progress 1,048.34 1,228.87 (c) Finished goods 1,009.97 573.80 Goods-in-transit – 394.07 (d) Stores and spares 736.09 425.70 Goods-in-transit 107.31 – (e) Scrap 8.60 9.30 Total 4,555.90 4,322.76
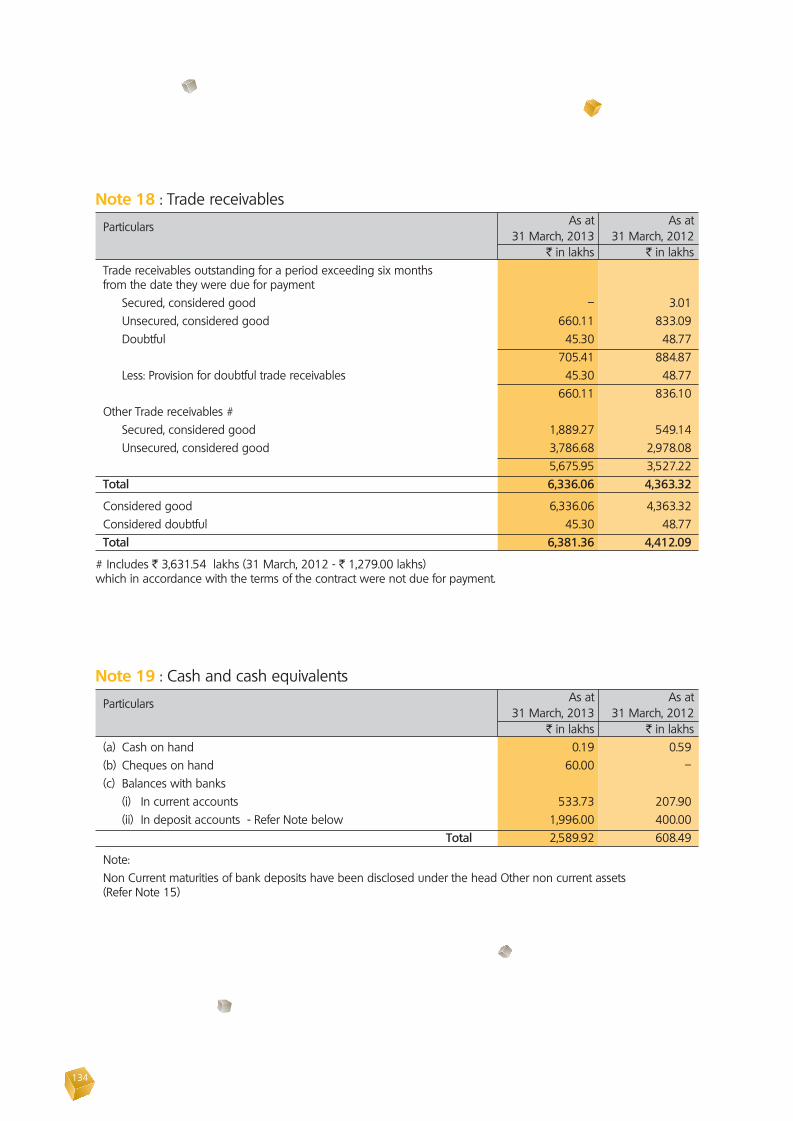
134
Note 18 : Trade receivables
Particulars As at As at 31 March, 2013 31 March, 2012 ` in lakhs ` in lakhs Trade receivables outstanding for a period exceeding six months from the date they were due for payment Secured, considered good – 3.01 Unsecured, considered good 660.11 833.09 Doubtful 45.30 48.77 705.41 884.87 Less: Provision for doubtful trade receivables 45.30 48.77 660.11 836.10 Other Trade receivables # Secured, considered good 1,889.27 549.14 Unsecured, considered good 3,786.68 2,978.08 5,675.95 3,527.22 Total 6,336.06 4,363.32
Considered good 6,336.06 4,363.32 Considered doubtful 45.30 48.77 Total 6,381.36 4,412.09
# Includes ` 3,631.54 lakhs (31 March, 2012 - ` 1,279.00 lakhs) which in accordance with the terms of the contract were not due for payment.
Note 19 : Cash and cash equivalents
Particulars As at As at 31 March, 2013 31 March, 2012 ` in lakhs ` in lakhs (a) Cash on hand 0.19 0.59 (b) Cheques on hand 60.00 – (c) Balances with banks (i) In current accounts 533.73 207.90 (ii) In deposit accounts - Refer Note below 1,996.00 400.00 Total 2,589.92 608.49
Note: Non Current maturities of bank deposits have been disclosed under the head Other non current assets (Refer Note 15)
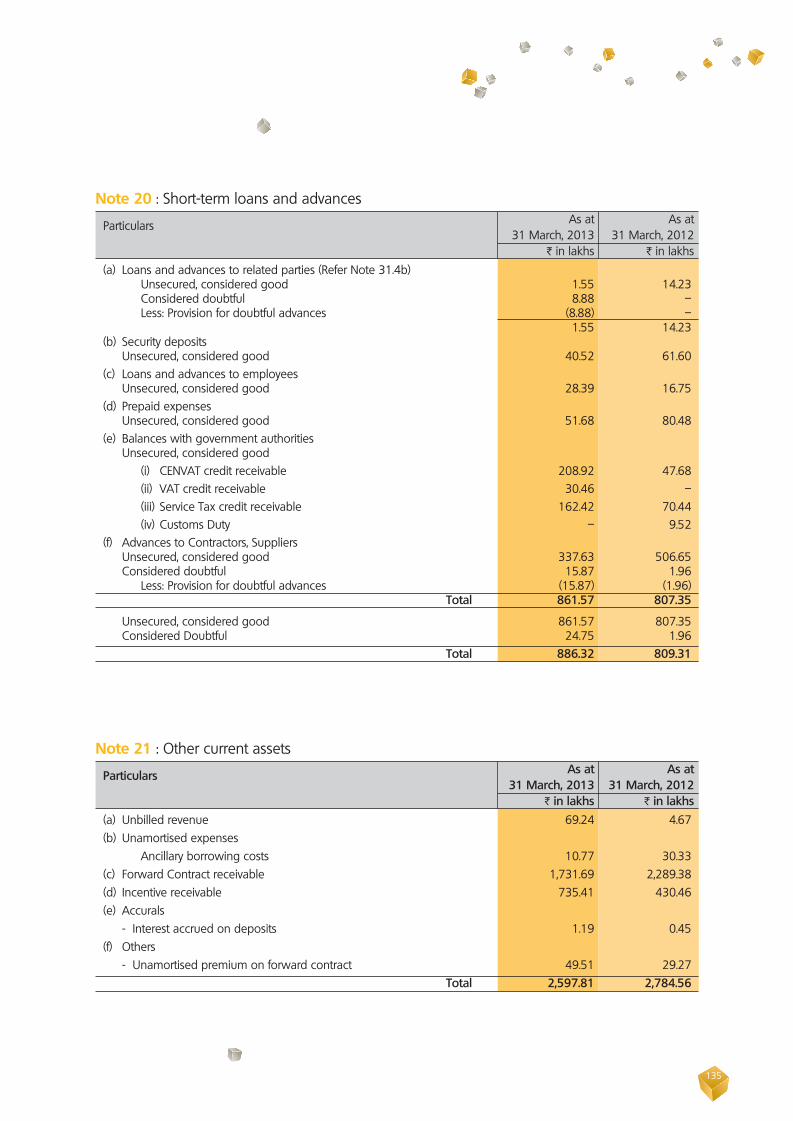
135
Note 20 : Short-term loans and advances
Particulars As at As at 31 March, 2013 31 March, 2012 I in lakhs I in lakhs (a) Loans and advances to related parties (Refer Note 31.4b) Unsecured, considered good 1.55 14.23 Considered doubtful 8.88 –
Less: Provision for doubtful advances (8.88) – 1.55 14.23 (b) Security deposits Unsecured, considered good 40.52 61.60 (c) Loans and advances to employees Unsecured, considered good 28.39 16.75 (d) Prepaid expenses Unsecured, considered good 51.68 80.48 (e) Balances with government authorities Unsecured, considered good (i) CENVAT credit receivable 208.92 47.68 (ii) VAT credit receivable 30.46 – (iii) Service Tax credit receivable 162.42 70.44 (iv) Customs Duty – 9.52 (f) Advances to Contractors, Suppliers Unsecured, considered good 337.63 506.65 Considered doubtful 15.87 1.96 Less: Provision for doubtful advances (15.87) (1.96) Total 861.57 807.35
Unsecured, considered good 861.57 807.35 Considered Doubtful 24.75 1.96 Total 886.32 809.31
Note 21 : Other current assets
Particulars As at As at 31 March, 2013 31 March, 2012 I in lakhs I in lakhs (a) Unbilled revenue 69.24 4.67 (b) Unamortised expenses Ancillary borrowing costs 10.77 30.33 (c) Forward Contract receivable 1,731.69 2,289.38 (d) Incentive receivable 735.41 430.46 (e) Accurals - Interest accrued on deposits 1.19 0.45 (f) Others - Unamortised premium on forward contract 49.51 29.27 Total 2,597.81 2,784.56
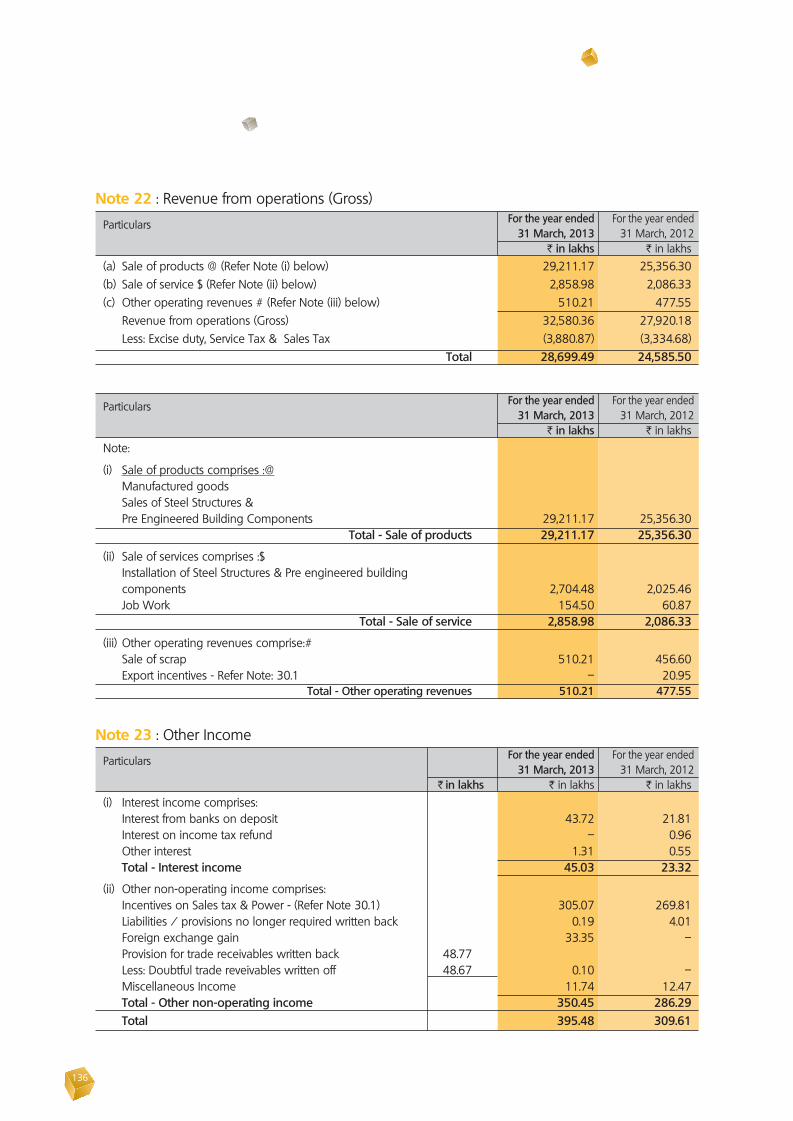
136
Note 22 : Revenue from operations (Gross)
Particulars For the year ended For the year ended 31 March, 2013 31 March, 2012 I in lakhs I in lakhs (a) Sale of products @ (Refer Note (i) below) 29,211.17 25,356.30 (b) Sale of service $ (Refer Note (ii) below) 2,858.98 2,086.33 (c) Other operating revenues # (Refer Note (iii) below) 510.21 477.55 Revenue from operations (Gross) 32,580.36 27,920.18 Less: Excise duty, Service Tax & Sales Tax (3,880.87) (3,334.68) Total 28,699.49 24,585.50
Particulars For the year ended For the year ended 31 March, 2013 31 March, 2012 I in lakhs I in lakhs Note:
(i) Sale of products comprises :@ Manufactured goods Sales of Steel Structures & Pre Engineered Building Components 29,211.17 25,356.30 Total - Sale of products 29,211.17 25,356.30
(ii) Sale of services comprises :$ Installation of Steel Structures & Pre engineered building components 2,704.48 2,025.46 Job Work 154.50 60.87 Total - Sale of service 2,858.98 2,086.33
(iii) Other operating revenues comprise:# Sale of scrap 510.21 456.60 Export incentives - Refer Note: 30.1 – 20.95 Total - Other operating revenues 510.21 477.55
Note 23 : Other Income
Particulars For the year ended For the year ended 31 March, 2013 31 March, 2012 I in lakhs I in lakhs I in lakhs (i) Interest income comprises: Interest from banks on deposit 43.72 21.81 Interest on income tax refund – 0.96 Other interest 1.31 0.55 Total - Interest income 45.03 23.32
(ii) Other non-operating income comprises: Incentives on Sales tax & Power - (Refer Note 30.1) 305.07 269.81 Liabilities / provisions no longer required written back 0.19 4.01 Foreign exchange gain 33.35 – Provision for trade receivables written back 48.77 Less: Doubtful trade reveivables written off 48.67 0.10 – Miscellaneous Income 11.74 12.47 Total - Other non-operating income 350.45 286.29 Total 395.48 309.61
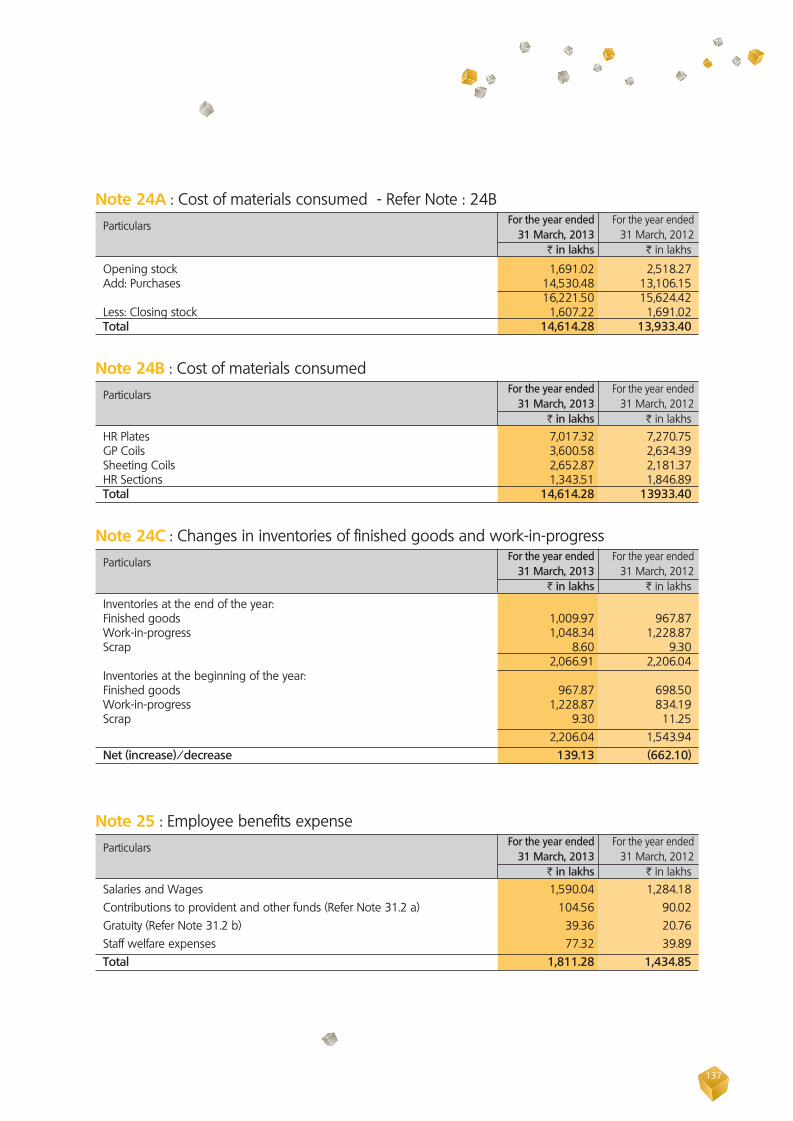
137
Note 25 : Employee benefits expense Particulars For the year ended For the year ended 31 March, 2013 31 March, 2012 I in lakhs I in lakhs Salaries and Wages 1,590.04 1,284.18 Contributions to provident and other funds (Refer Note 31.2 a) 104.56 90.02 Gratuity (Refer Note 31.2 b) 39.36 20.76 Staff welfare expenses 77.32 39.89 Total 1,811.28 1,434.85
Note 24A : Cost of materials consumed - Refer Note : 24B Particulars For the year ended For the year ended 31 March, 2013 31 March, 2012 I in lakhs I in lakhs
Opening stock 1,691.02 2,518.27 Add: Purchases 14,530.48 13,106.15 16,221.50 15,624.42 Less: Closing stock 1,607.22 1,691.02 Total 14,614.28 13,933.40
Note 24B : Cost of materials consumed Particulars For the year ended For the year ended 31 March, 2013 31 March, 2012 I in lakhs I in lakhs HR Plates 7,017.32 7,270.75 GP Coils 3,600.58 2,634.39 Sheeting Coils 2,652.87 2,181.37 HR Sections 1,343.51 1,846.89 Total 14,614.28 13933.40
Note 24C : Changes in inventories of finished goods and work-in-progress Particulars For the year ended For the year ended 31 March, 2013 31 March, 2012 I in lakhs I in lakhs Inventories at the end of the year: Finished goods 1,009.97 967.87 Work-in-progress 1,048.34 1,228.87 Scrap 8.60 9.30 2,066.91 2,206.04 Inventories at the beginning of the year: Finished goods 967.87 698.50 Work-in-progress 1,228.87 834.19 Scrap 9.30 11.25 2,206.04 1,543.94 Net (increase)/decrease 139.13 (662.10)

138
Note 26 : Other Expenses Particulars For the year ended For the year ended 31 March, 2013 31 March, 2012 I in lakhs I in lakhs I in lakhs Consumption of stores and spare parts 3,354.71 2,615.25 Increase / (decrease) of excise duty on inventory 47.68 24.45 Subcontracting 3,217.39 2,685.50 Power and fuel 180.07 103.53 Other Manufacturing cost 44.29 46.41 Rent including lease rentals (net) - (Refer note - 31.5) 153.57 120.34 Repairs and maintenance - Machinery 3.73 6.02 Repairs and maintenance - Others 4.17 5.01 Insurance 48.00 36.83 Rates and taxes 18.26 23.17 Communication 36.46 34.77 Travelling and conveyance 330.81 275.56 Printing and stationery 33.03 26.73 Freight and forwarding 848.35 813.91 Marketing and selling expenses 221.41 136.77 Office Maintenance 90.60 62.19 Security Charges 23.47 24.01 Donations and contributions 5.67 5.28 Legal and professional 119.07 120.58 Payments to auditors (Refer Note below) 12.06 10.14 Doubtful loans and advances writtem off 1.96 Less: Provisions for loans and advances written back 1.96 – – Provision for doubtful trade receivables 45.30 48.46 Provision for loans and adavances 24.75 – Net loss on foreign currency transactions and translation (other than considered finance cost) – 9.02 Provision for losses (diminution in value of investments) in subsidiary companies (net) 1.00 – Loss on fixed assets sold / scrapped / written off 0.02 0.23 Miscellaneous expenses 21.98 27.36
Total 8,885.85 7,261.52
Note Payments to the auditors comprises (net of service tax input credit): (a) To statutory auditors For audit 11.00 9.50 Reimbursement of expenses 0.31 0.21 (b) To cost auditors for cost audit 0.75 0.43 Total 12.06 10.14

139
Note 27 : Finance costs Particulars For the year ended For the year ended 31 March, 2013 31 March, 2012 I in lakhs I in lakhs (a) Interest expense on: (i) Borrowings 788.63 734.87 (ii) Others -Interest on delayed payment of Income Tax 47.10 12.76 (b) Other borrowing costs 282.39 347.78 (c) Loss on foreign currency transactions and translation (net) 35.54 – Total 1,153.66 1,095.41
Note 28 Disclosures under Accounting Standards Particulars For the year ended For the year ended 31 March, 2013 31 March, 2012 I in lakhs I in lakhs 28 Earnings per share
Basic Profit for the year ( I in lakhs) 1,439.87 1041.72 Less: Preference dividend ( I in lakhs) 24.91 – Net profit for the year attributable to the equity shareholders ( I in lakhs) 1,414.96 1,041.72 Weighted average number of equity shares 25,000,000 25,000,000 Par value per share ( I ) 10.00 10.00 Earnings per share - Basic ( I ) 5.66 4.17 Diluted Net profit for the year ( I in lakhs) 1,439.87 1,041.72 Weighted average number of equity shares - for diluted EPS 25,068,234 25,000,000 Par value per share (I) 10.00 10.00 Earnings per share - Diluted ( I )* 5.66 4.17
* Since anti-dilutive, basic EPS considered
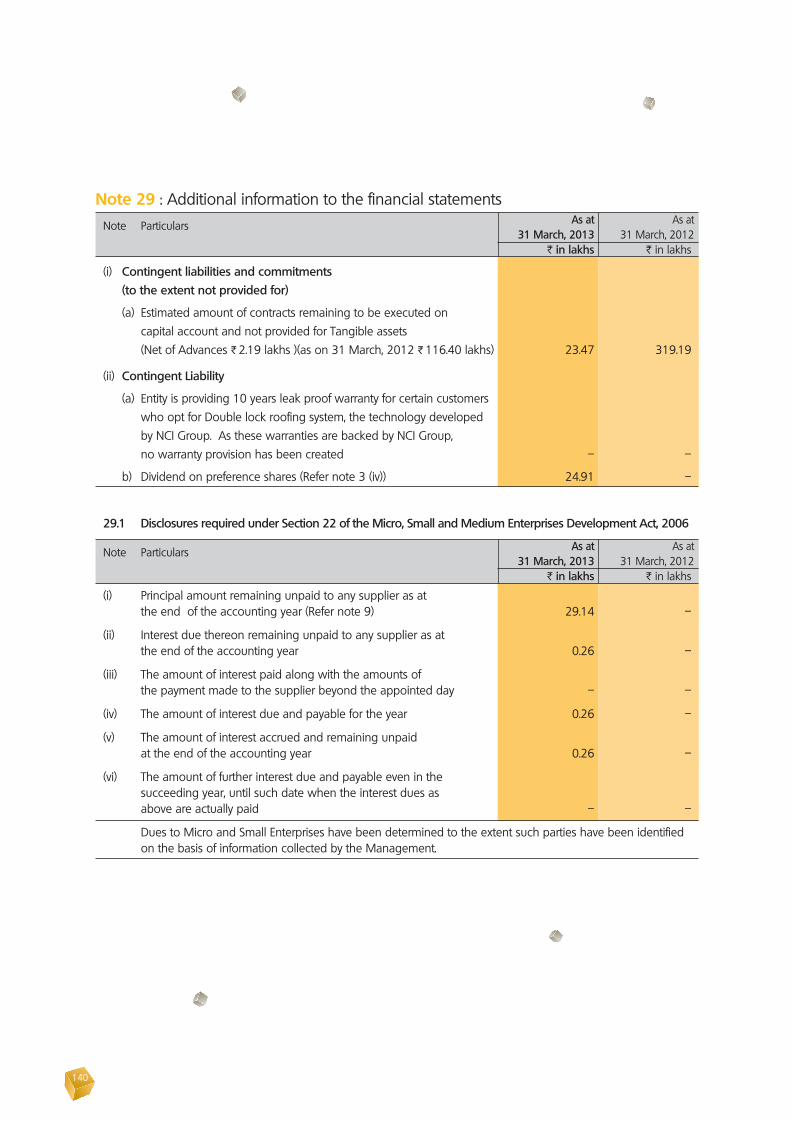
140
Note 29 : Additional information to the financial statements Note Particulars As at As at 31 March, 2013 31 March, 2012 I in lakhs I in lakhs
(i) Contingent liabilities and commitments (to the extent not provided for)
(a) Estimated amount of contracts remaining to be executed on capital account and not provided for Tangible assets (Net of Advances I 2.19 lakhs )(as on 31 March, 2012 I 116.40 lakhs) 23.47 319.19
(ii) Contingent Liability
(a) Entity is providing 10 years leak proof warranty for certain customers who opt for Double lock roofing system, the technology developed by NCI Group. As these warranties are backed by NCI Group, no warranty provision has been created – –
b) Dividend on preference shares (Refer note 3 (iv)) 24.91 –
29.1 Disclosures required under Section 22 of the Micro, Small and Medium Enterprises Development Act, 2006
Note Particulars As at As at 31 March, 2013 31 March, 2012 I in lakhs I in lakhs
(i) Principal amount remaining unpaid to any supplier as at the end of the accounting year (Refer note 9) 29.14 –
(ii) Interest due thereon remaining unpaid to any supplier as at the end of the accounting year 0.26 –
(iii) The amount of interest paid along with the amounts of the payment made to the supplier beyond the appointed day – –
(iv) The amount of interest due and payable for the year 0.26 –
(v) The amount of interest accrued and remaining unpaid at the end of the accounting year 0.26 –
(vi) The amount of further interest due and payable even in the succeeding year, until such date when the interest dues as above are actually paid – –
Dues to Micro and Small Enterprises have been determined to the extent such parties have been identified on the basis of information collected by the Management.
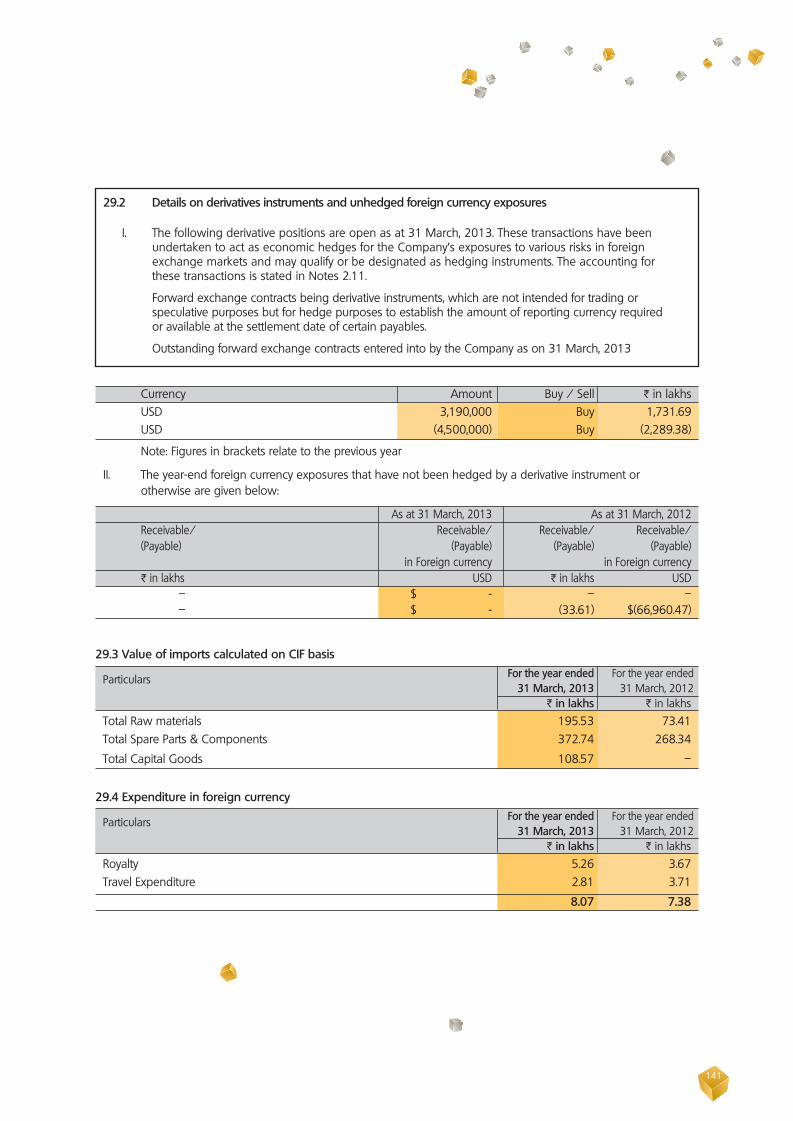
141
29.3 Value of imports calculated on CIF basis Particulars For the year ended For the year ended 31 March, 2013 31 March, 2012 I in lakhs I in lakhs Total Raw materials 195.53 73.41 Total Spare Parts & Components 372.74 268.34
Total Capital Goods 108.57 –
29.4 Expenditure in foreign currency Particulars For the year ended For the year ended 31 March, 2013 31 March, 2012 I in lakhs I in lakhs Royalty 5.26 3.67 Travel Expenditure 2.81 3.71
8.07 7.38
29.2 Details on derivatives instruments and unhedged foreign currency exposures
I. The following derivative positions are open as at 31 March, 2013. These transactions have been undertaken to act as economic hedges for the Company’s exposures to various risks in foreign exchange markets and may qualify or be designated as hedging instruments. The accounting for these transactions is stated in Notes 2.11.
Forward exchange contracts being derivative instruments, which are not intended for trading or speculative purposes but for hedge purposes to establish the amount of reporting currency required or available at the settlement date of certain payables.
Outstanding forward exchange contracts entered into by the Company as on 31 March, 2013
Currency Amount Buy / Sell I in lakhs USD 3,190,000 Buy 1,731.69 USD (4,500,000) Buy (2,289.38)
Note: Figures in brackets relate to the previous year
II. The year-end foreign currency exposures that have not been hedged by a derivative instrument or otherwise are given below:
As at 31 March, 2013 As at 31 March, 2012 Receivable/ Receivable/ Receivable/ Receivable/ (Payable) (Payable) (Payable) (Payable) in Foreign currency in Foreign currency I in lakhs USD I in lakhs USD – $ - – – – $ - (33.61) $(66,960.47)
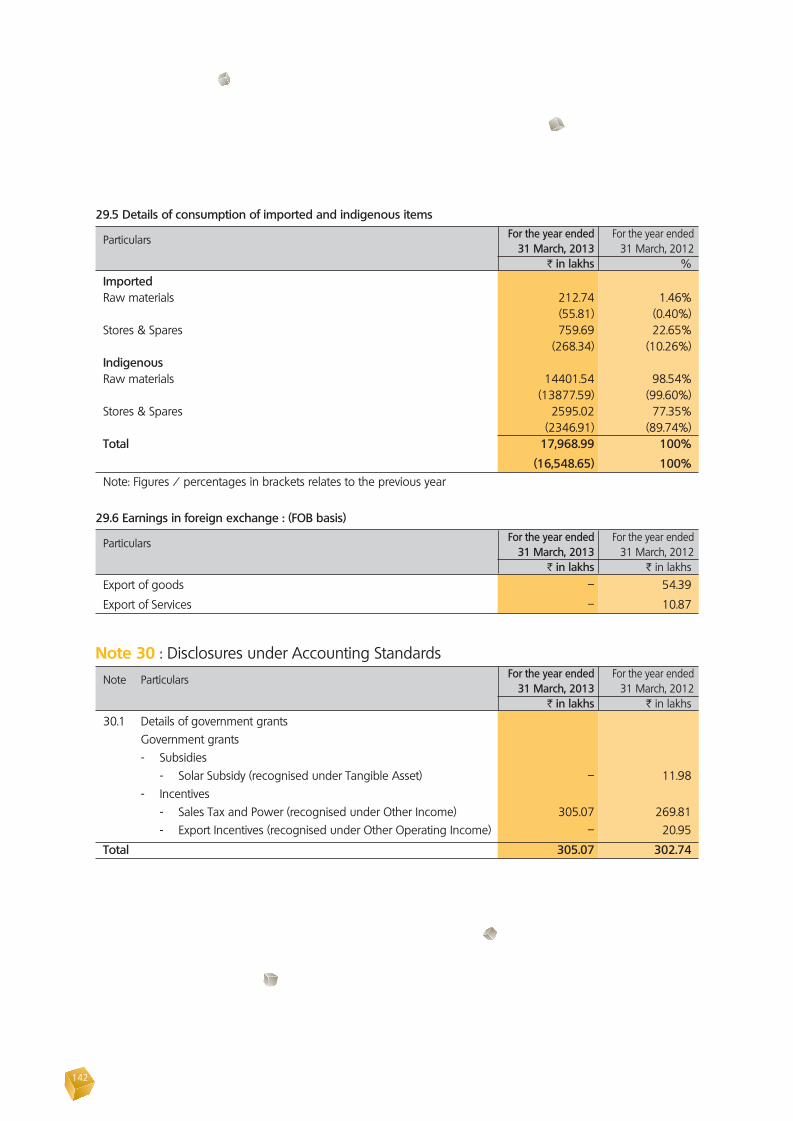
142
29.5 Details of consumption of imported and indigenous items Particulars For the year ended For the year ended 31 March, 2013 31 March, 2012 I in lakhs %
Imported Raw materials 212.74 1.46% (55.81) (0.40%) Stores & Spares 759.69 22.65% (268.34) (10.26%) Indigenous Raw materials 14401.54 98.54% (13877.59) (99.60%) Stores & Spares 2595.02 77.35% (2346.91) (89.74%) Total 17,968.99 100%
(16,548.65) 100% Note: Figures / percentages in brackets relates to the previous year
29.6 Earnings in foreign exchange : (FOB basis) Particulars For the year ended For the year ended 31 March, 2013 31 March, 2012 I in lakhs I in lakhs Export of goods – 54.39
Export of Services – 10.87
Note 30 : Disclosures under Accounting Standards Note Particulars For the year ended For the year ended 31 March, 2013 31 March, 2012 I in lakhs I in lakhs 30.1 Details of government grants Government grants - Subsidies - Solar Subsidy (recognised under Tangible Asset) – 11.98 - Incentives - Sales Tax and Power (recognised under Other Income) 305.07 269.81 - Export Incentives (recognised under Other Operating Income) – 20.95
Total 305.07 302.74

143
Note 31 Disclosures under Accounting Standards
31.1 Employee benefit plans 31.2.a Defined contribution plans
The Company makes Provident Fund and Employee State Insurance Scheme contributions which are defined contribution plans, for qualifying employees. Under the Schemes, the Company is required to contribute a specified percentage of the payroll costs to fund the benefits. The Company recognised I 95.22 lakhs (Year ended 31 March, 2012 I 81.67 lakhs ) for Provident Fund contributions and I 9.34 lakhs (Year ended 31 March, 2012 I 8.35 lakhs) for Employee State Insurance Scheme contributions in the Statement of Profit and Loss. The contributions payable to these plans by the Company are at rates specified in the rules of the schemes.
31.2.b Defined benefit plans
The Company offers the following employee benefit schemes to its employees: i. Gratuity
ii. Compensated Absences
The following table sets out the unfunded status of the defined benefit schemes and the amount
recognised in the financial statements:
For the year ended For the year ended 31 March, 2013 31 March, 2012 I in lakhs I in lakhs Particular Gratuity Compensated Gratuity Compensated Absences Absences Components of employer expense Current service cost 32.48 23.87 16.86 13.59 Interest cost 3.35 2.10 1.56 1.05 Acturial losses/(gains) 3.53 (3.04) 2.34 3.95
Total expense recognised in the Statement of Profit and Loss 39.36 22.93 20.76 18.59
Actual contribution and benefit payments for year Actual benefit payments – – – – Actual contributions – – – – Net asset/(liability) recognised in the Balance Sheet Present value of defined benefit obligation 39.08 30.05 18.32 13.20 Fair value of plan assets* – – – – Expenses as above 39.36 22.93 20.76 18.59 Settlements made – (11.17) – (1.74)
78.44 41.81 39.08 30.05
Classification of Net asset/(liability) recognised in the Balance Sheet
Long Term Provision 72.67 34.62 38.87 28.32
Short Term Provision 5.77 7.19 0.21 1.73
78.44 41.81 39.08 30.05
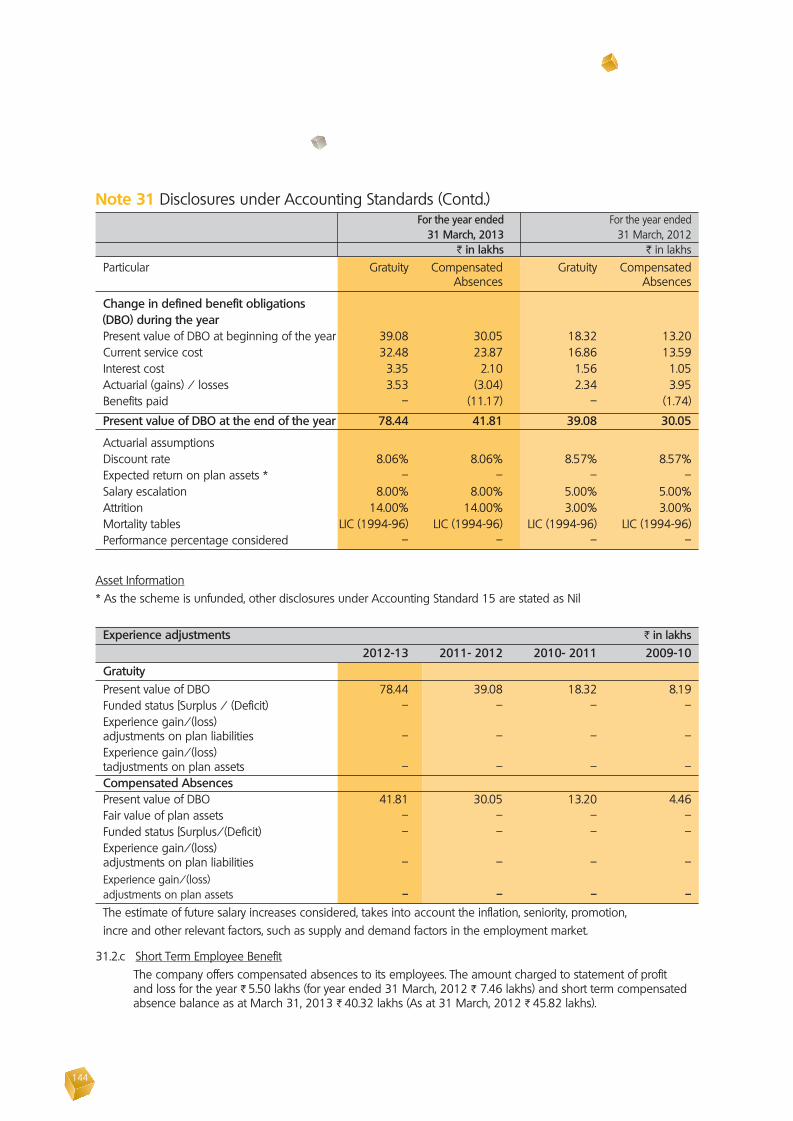
144
Note 31 Disclosures under Accounting Standards (Contd.) For the year ended For the year ended 31 March, 2013 31 March, 2012 I in lakhs I in lakhs Particular Gratuity Compensated Gratuity Compensated Absences Absences
Change in defined benefit obligations (DBO) during the year Present value of DBO at beginning of the year 39.08 30.05 18.32 13.20 Current service cost 32.48 23.87 16.86 13.59 Interest cost 3.35 2.10 1.56 1.05 Actuarial (gains) / losses 3.53 (3.04) 2.34 3.95 Benefits paid – (11.17) – (1.74)
Present value of DBO at the end of the year 78.44 41.81 39.08 30.05
Actuarial assumptions Discount rate 8.06% 8.06% 8.57% 8.57% Expected return on plan assets * – – – – Salary escalation 8.00% 8.00% 5.00% 5.00% Attrition 14.00% 14.00% 3.00% 3.00% Mortality tables LIC (1994-96) LIC (1994-96) LIC (1994-96) LIC (1994-96) Performance percentage considered – – – –
Asset Information * As the scheme is unfunded, other disclosures under Accounting Standard 15 are stated as Nil
Experience adjustments I in lakhs
2012-13 2011- 2012 2010- 2011 2009-10 Gratuity Present value of DBO 78.44 39.08 18.32 8.19 Funded status [Surplus / (Deficit) – – – – Experience gain/(loss) adjustments on plan liabilities – – – – Experience gain/(loss) tadjustments on plan assets – – – – Compensated Absences Present value of DBO 41.81 30.05 13.20 4.46 Fair value of plan assets – – – – Funded status [Surplus/(Deficit) – – – – Experience gain/(loss) adjustments on plan liabilities – – – – Experience gain/(loss) adjustments on plan assets – – – –
The estimate of future salary increases considered, takes into account the inflation, seniority, promotion, incre and other relevant factors, such as supply and demand factors in the employment market.
31.2.c Short Term Employee Benefit The company offers compensated absences to its employees. The amount charged to statement of profit
and loss for the year I 5.50 lakhs (for year ended 31 March, 2012 I 7.46 lakhs) and short term compensated absence balance as at March 31, 2013 I 40.32 lakhs (As at 31 March, 2012 I 45.82 lakhs).

145
Note Particulars31.3 The geographic segments individually contributing 10 percent or more of the Company’s revenues and segment assets are shown separately:31.3.(a) Geographic Segment Revenues Segment assets Capital expenditure incurred For the year ended As at during the year ended 31 March, 2013 31 March, 2013 31 March, 2013 I in lakhs I in lakhs I in lakhs Others 601.51 – – Others (54.39) – – India 31,978.85 23,767.86 152.78 India (27,865.79) (18,416.21) (267.39)
Note: Figures in bracket relates to the previous year
Segment reporting
31.3.(b) The company is engaged in manufacture and erection of steel products, i.e., pre engineered buildings, which in the context of Accounting Standard -17 issued by the Company’s Accounting ( Standard ) Rules, 2006 is a single segment.
Note 31 Disclosures under Accounting Standards (Contd.)
31.4 Related party transactions
31.4.a Details of related parties:
Description of relationship Names of related parties Holding Company Pennar Industries Limited Subsidiaries Pennar Building Systems Private Limited Key Management Personnel (KMP) Nrupender Rao PV Rao Aditya N Rao Relatives of KMP J Rajya Lakshmi (Wife of Nrupender Rao) Avanti Rao & Arathi Rao (Daughters of Nrupender Rao) Usha Ramani (Wife of P V Rao) D Sudeepta Rao (Wife of Aditya N Rao) Company in which KMP/Relatives of
KMP have significant influence Pennar Enviro Limited (formerly known as Pennar Chemical Limited) Pennar Management Services Limited (formerly known as Pennar Chemicals Limited) Saven Technologies Limited
Note: Related parties have been identified by the Management.
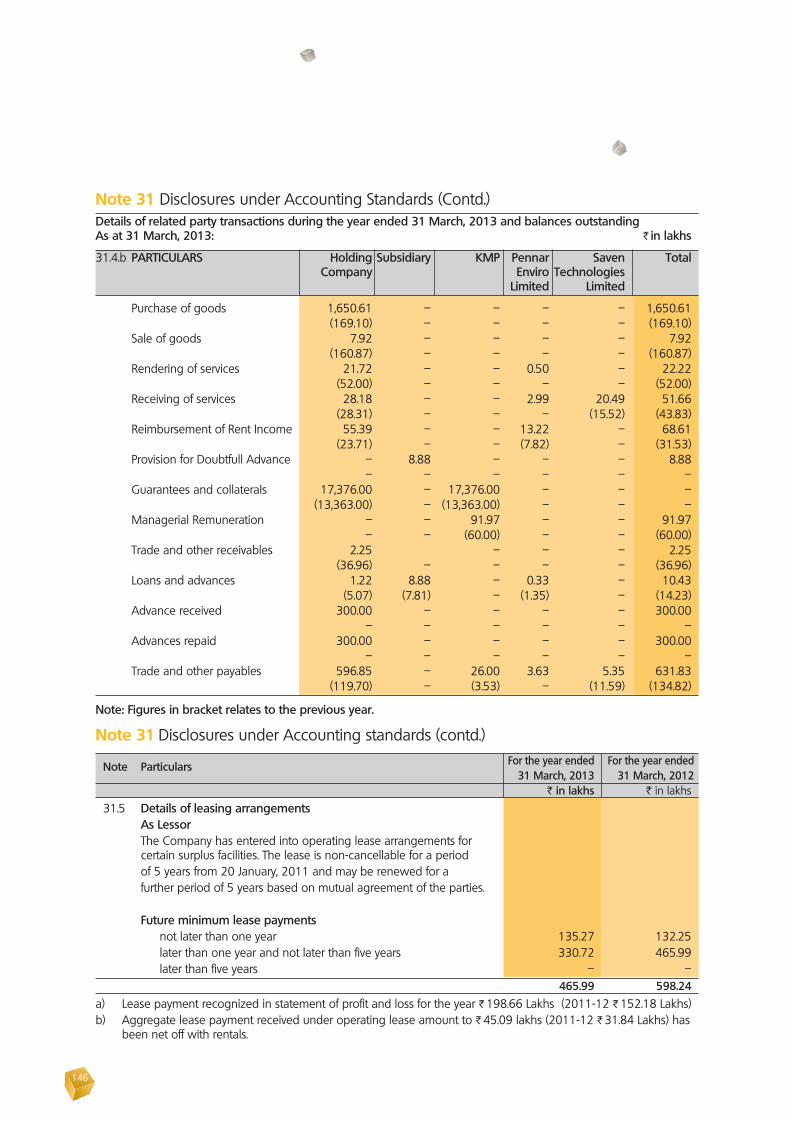
146
Note 31 Disclosures under Accounting Standards (Contd.)Details of related party transactions during the year ended 31 March, 2013 and balances outstanding As at 31 March, 2013: I in lakhs
31.4.b PARTICULARS Holding Subsidiary KMP Pennar Saven Total Company Enviro Technologies Limited Limited
Purchase of goods 1,650.61 – – – – 1,650.61 (169.10) – – – – (169.10) Sale of goods 7.92 – – – – 7.92 (160.87) – – – – (160.87) Rendering of services 21.72 – – 0.50 – 22.22 (52.00) – – – – (52.00) Receiving of services 28.18 – – 2.99 20.49 51.66 (28.31) – – – (15.52) (43.83) Reimbursement of Rent Income 55.39 – – 13.22 – 68.61 (23.71) – – (7.82) – (31.53) Provision for Doubtfull Advance – 8.88 – – – 8.88 – – – – – – Guarantees and collaterals 17,376.00 – 17,376.00 – – – (13,363.00) – (13,363.00) – – – Managerial Remuneration – – 91.97 – – 91.97 – – (60.00) – – (60.00) Trade and other receivables 2.25 – – – 2.25 (36.96) – – – – (36.96) Loans and advances 1.22 8.88 – 0.33 – 10.43 (5.07) (7.81) – (1.35) – (14.23) Advance received 300.00 – – – – 300.00 – – – – – – Advances repaid 300.00 – – – – 300.00 – – – – – – Trade and other payables 596.85 – 26.00 3.63 5.35 631.83 (119.70) – (3.53) – (11.59) (134.82)
Note: Figures in bracket relates to the previous year.
Note 31 Disclosures under Accounting standards (contd.) Note Particulars For the year ended For the year ended 31 March, 2013 31 March, 2012 I in lakhs I in lakhs 31.5 Details of leasing arrangements As Lessor The Company has entered into operating lease arrangements for
certain surplus facilities. The lease is non-cancellable for a period of 5 years from 20 January, 2011 and may be renewed for a further period of 5 years based on mutual agreement of the parties.
Future minimum lease payments not later than one year 135.27 132.25 later than one year and not later than five years 330.72 465.99 later than five years – – 465.99 598.24
a) Lease payment recognized in statement of profit and loss for the year I 198.66 Lakhs (2011-12 I 152.18 Lakhs)b) Aggregate lease payment received under operating lease amount to I 45.09 lakhs (2011-12 I 31.84 Lakhs) has
been net off with rentals.
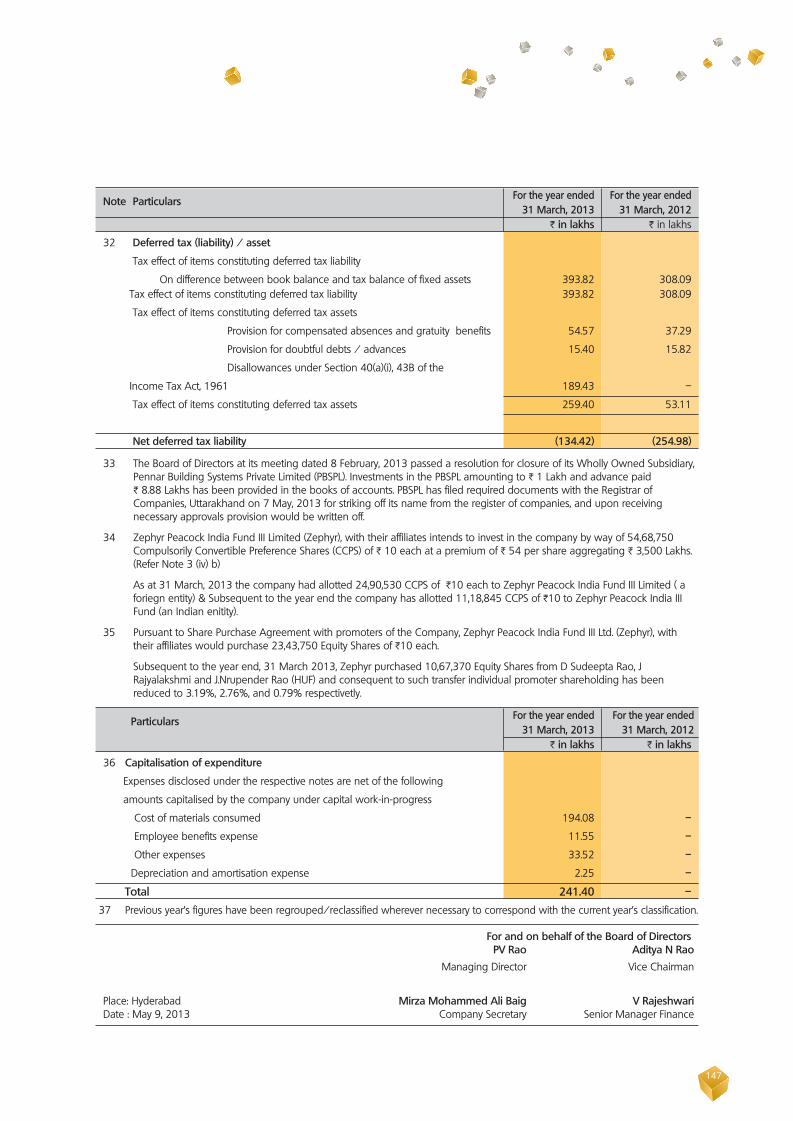
147
For and on behalf of the Board of Directors PV Rao Aditya N Rao
Managing Director Vice Chairman
Place: Hyderabad Mirza Mohammed Ali Baig V Rajeshwari Date : May 9, 2013 Company Secretary Senior Manager Finance
Note Particulars For the year ended For the year ended 31 March, 2013 31 March, 2012 I in lakhs I in lakhs
32 Deferred tax (liability) / asset
Tax effect of items constituting deferred tax liability
On difference between book balance and tax balance of fixed assets 393.82 308.09 Tax effect of items constituting deferred tax liability 393.82 308.09
Tax effect of items constituting deferred tax assets
Provision for compensated absences and gratuity benefits 54.57 37.29
Provision for doubtful debts / advances 15.40 15.82
Disallowances under Section 40(a)(i), 43B of the
Income Tax Act, 1961 189.43 –
Tax effect of items constituting deferred tax assets 259.40 53.11
Net deferred tax liability (134.42) (254.98)
33 The Board of Directors at its meeting dated 8 February, 2013 passed a resolution for closure of its Wholly Owned Subsidiary, Pennar Building Systems Private Limited (PBSPL). Investments in the PBSPL amounting to I 1 Lakh and advance paid I 8.88 Lakhs has been provided in the books of accounts. PBSPL has filed required documents with the Registrar of Companies, Uttarakhand on 7 May, 2013 for striking off its name from the register of companies, and upon receiving necessary approvals provision would be written off.
34 Zephyr Peacock India Fund III Limited (Zephyr), with their affiliates intends to invest in the company by way of 54,68,750 Compulsorily Convertible Preference Shares (CCPS) of I 10 each at a premium of I 54 per share aggregating I 3,500 Lakhs. (Refer Note 3 (iv) b)
As at 31 March, 2013 the company had allotted 24,90,530 CCPS of I10 each to Zephyr Peacock India Fund III Limited ( a foriegn entity) & Subsequent to the year end the company has allotted 11,18,845 CCPS of I10 to Zephyr Peacock India III Fund (an Indian enitity).
35 Pursuant to Share Purchase Agreement with promoters of the Company, Zephyr Peacock India Fund III Ltd. (Zephyr), with their affiliates would purchase 23,43,750 Equity Shares of I10 each.
Subsequent to the year end, 31 March 2013, Zephyr purchased 10,67,370 Equity Shares from D Sudeepta Rao, J Rajyalakshmi and J.Nrupender Rao (HUF) and consequent to such transfer individual promoter shareholding has been reduced to 3.19%, 2.76%, and 0.79% respectivetly.
Particulars For the year ended For the year ended 31 March, 2013 31 March, 2012 I in lakhs I in lakhs
36 Capitalisation of expenditure
Expenses disclosed under the respective notes are net of the following
amounts capitalised by the company under capital work-in-progress
Cost of materials consumed 194.08 –
Employee benefits expense 11.55 –
Other expenses 33.52 –
Depreciation and amortisation expense 2.25 –
Total 241.40 –
37 Previous year’s figures have been regrouped/reclassified wherever necessary to correspond with the current year’s classification.

148
Pennar Engineered Building Systems Limited Statement pursuant to Section 212(1)(e) of the Companies Act, 1956
for Pennar Engineered Building Systems Limited
Aditya N Rao P V Rao V Rajeshwari Mirza Mohammed Ali Baig
Vice Chairman Managing Director Sr. Manager - Finance Company Secretary
1 Name of the Subsidiary Pennar Building Systems Private Limited [PBSPL] *
2 Financial year of the Subsidiary ended on 31.03.2013
3 Shares of subsidiary held by the Company on the above date:
i. Number of Sharesii. Face Valueiii. Extent of Holding
9,999Equity shares of Rs.10/- each99.99%
4 Net aggregate amount of profits / (losses) of the Subsidiary for the above financial year so far as they concern members of the Company
i. dealt with in the accounts of the company for the year ended 31st March, 2013
ii. not dealt within the accounts of the company for the year ended 31st March, 2013
Nil
Nil
5 Net aggregate amount of Profits / (Losses) for previous years of the subsidiary, since it became a subsidiary so far as they concern members of the Company:
i. dealt within the accounts of the company for the year ended 31st March, 2013
ii. not dealt within the accounts of the company for the year ended 31st March, 2013
Nil
Nil
6 Change in the interest of the Company in the subsidiary between the end of the financial year of the subsidiary and that of the Company.
NA
7 Material Changes between the end of the financial year of the subsidiary and end of the financial year of the Company in respect of the subsidiary’s fixed assets, investments, lending and borrowing for the purpose other than meeting their current liabilities.
NA
8 Remarks Nil
* The Board of Directors of PBSPL has taken necessary steps to close the company.
Date : 9th May, 2013. Place : Hyderabad
149
Pennar Industries LimitedConsolidated Financial Statements Independent Auditor’s Report
To the Board of Directors of Pennar Industries Limited
Report on the Consolidated Financial Statements
1. We have audited the accompanying consolidated financial statements of M/s PENNAR INDUSTRIES LIMITED (‘the Company’) which comprise the consolidated Balance Sheet as at 31st March 2013, the consolidated Statement of Profit and Loss and Consolidated Cash Flow Statement for the year then ended, and a summary of significant Accounting policies and other explanatory information.
Management’s Responsibility for the Consolidated Financial Statements
2. Management is responsible for the preparation of these consolidated financial statements that give a true and fair view of the consolidated financial position, consolidated financial performance and consolidated cash flows of the Company in accordance with the Accounting Standards referred to in sub-section (3C) of section 211 of the Companies Act, 1956 (“the Act”). This responsibility includes the design, implementation and maintenance of internal control relevant to the preparation and presentation of the consolidated financial statements that give a true and fair view and are free from material misstatement, whether due to fraud or error.
Auditor’s Responsibility
3. Our responsibility is to express an opinion on these consolidated financial statements based on our audit. We conducted our audit in accordance with the Standards on Auditing issued by the Institute of Chartered Accountants of India. Those Standards require that we comply with ethical requirements and plan and perform the audit to obtain reasonable assurance about whether the consolidated financial statements are free from material misstatement.
4. An audit involves performing procedures to obtain audit evidence about the amounts and disclosures in the consolidated financial statements. The procedures selected depend on the auditor’s judgment, including the assessment of the risks of material misstatement of the consolidated financial statements, whether due to fraud or error. In making those risk assessments, the auditor considers internal control relevant to the Company’s preparation and fair presentation of
the consolidated financial statements in order to design audit procedures that are appropriate in the circumstances. An audit also includes evaluating the appropriateness of accounting policies used and the reasonableness of the accounting estimates made by management, as well as evaluating the overall presentation of the consolidated financial statements.
We believe that the audit evidence we have obtained is sufficient and appropriate to provide a basis for our audit opinion.
Opinion
5. In our opinion and to the best of our information and according to the explanations given to us, the consolidated financial statements give the information required by the Act in the manner so required and give a true and fair view in conformity with the accounting principles generally accepted in India:
(a) In the case of the consolidated Balance Sheet, of the state of affairs of the Company as at 31st March, 2013;
(b) In the case of the consolidated Statement of Profit and Loss, of the profit for the year ended on that date; and
(c) In the case of the consolidated Cash Flow Statement, of the cash flows for the year ended on that date.
Other Matters
6. We have audited the Financial statements of the subsidiary namely Pennar Enviro Limited which reflects total assets (net) of ` 1030.74 lakhs as at March 31, 2013, total revenue (net) of ` 567.42 lakhs and net cash flows amounting to ` 84.13 lakhs for the year ended 31st March, 2013.
7. We did not audit the financial statements of Subsidary namely, Pennar Engineered Building Systems Limited, whose financial statements reflect total assets (net) of ` 23,767.85 lakhs as at March 31, 2013, total revenues (net) of ` 28,699.49 lakhs and net cash flows amounting to ` 2,327.60 lakhs for the year ended 31st March, 2013. These financial statements have been audited by other auditors whose reports have been furnished to us and our opinion, is based solely on the reports of the other auditors.
RAMBABU & Co. Chartered Accountants Firm Reg No: 002976S
Ravi RambabuPlace: Hyderabad PartnerDate: 12-05-2013 M No. : 018541

150
In terms of our report attached. For RAMBABU & Co., For and on behalf of the Board of Directors Chartered Accountants Firm Reg No: 002976S Ravi Rambabu Nrupender Rao Aditya N Rao Partner Executive Chairman Vice Chairman Membership.No: 018541 Place: Hyderabad R. Ravi Suhas Baxi Date : May 12, 2013 V.P. Finance and Company Secretary President and CEO
Place: Hyderabad Date : May 10, 2013
Consolidated Balance Sheet as at 31.03.2013 Particulars Note No. As at As at 31 March, 2013 31 March, 2012 ` in lakhs ` in lakhs I EQUITY AND LIABILITIES 1 SHAREHOLDERS’ FUNDS a Share Capital 3 6,979 6,979 b Reserves & Surplus 4 27,809 24,433 c Minority Interest 2,452 1,095 37,240 32,507 2 NON CURRENT LIABILITIES a Long Term Borrowings - Secured
5 945 1,701
- Unsecured 2,327 2,331 b Deffered Tax Liability (Net) 6 1,484 1,473 c Other Long Term Liabilities 7 166 70 d Long Term Provisions 8 199 152 5,121 5,727 3 CURRENT LIABILITIES a Short Term Borrowings - Secured 9 12,274 12,587 b Trade Payables 10 10,943 11,027 c Other Current Liabilities 11 7,532 5,773 d Short Term Provisions 12 2,251 1,479 33,000 30,866 Total of (1+2+3) 75,361 69,100 II ASSETS 1 NON CURRENT ASSETS a Fixed Assets - Tangible Assets
13 23,172 24,247
- Intangible Assets 299 336 - Capital Work In Progress 1,699 158 b Non Current Investments 14 2 – c Long Term loans and advances 15 583 137 d Other Non Current Assets 16 674 377 26,429 25,255 2 CURRENT ASSETS a Current Investments 17 330 – b Inventories 18 16,583 16,141 c Trade Receivables 19 23,326 20,964 d Cash and Cash Equivalents 20 4,108 1,959 e Short Term Loans & Advances 21 1,675 1,306 f Other Current Assets 22 2,910 3,475 48,932 43,845 Total of (1+2) 75,361 69,100 Significant Accounting Policies and Notes on Financial Statements 1 to 44
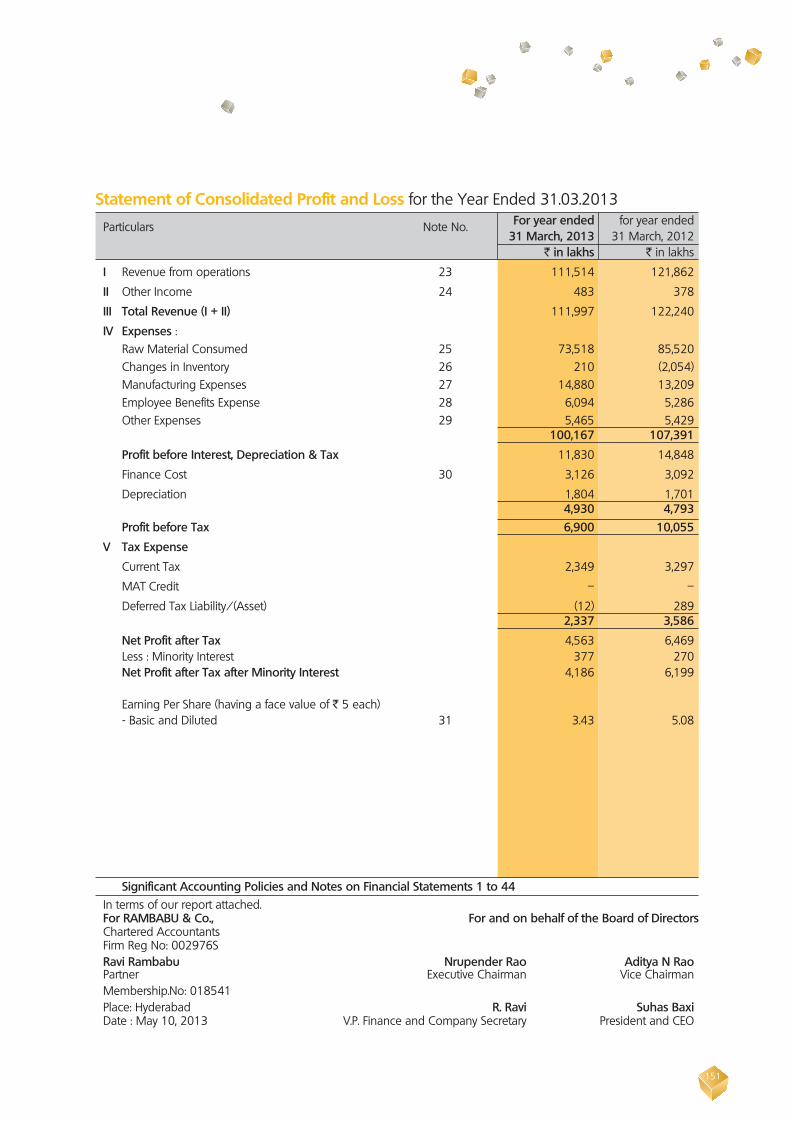
151
In terms of our report attached. For RAMBABU & Co., For and on behalf of the Board of Directors Chartered Accountants Firm Reg No: 002976S Ravi Rambabu Nrupender Rao Aditya N Rao Partner Executive Chairman Vice Chairman Membership.No: 018541 Place: Hyderabad R. Ravi Suhas Baxi Date : May 10, 2013 V.P. Finance and Company Secretary President and CEO
Statement of Consolidated Profit and Loss for the Year Ended 31.03.2013 Particulars Note No. For year ended for year ended 31 March, 2013 31 March, 2012 ` in lakhs ` in lakhs
I Revenue from operations 23 111,514 121,862
II Other Income 24 483 378
III Total Revenue (I + II) 111,997 122,240
IV Expenses : Raw Material Consumed 25 73,518 85,520 Changes in Inventory 26 210 (2,054) Manufacturing Expenses 27 14,880 13,209 Employee Benefits Expense 28 6,094 5,286 Other Expenses 29 5,465 5,429 100,167 107,391
Profit before Interest, Depreciation & Tax 11,830 14,848
Finance Cost 30 3,126 3,092
Depreciation 1,804 1,701 4,930 4,793 Profit before Tax 6,900 10,055
V Tax Expense
Current Tax 2,349 3,297
MAT Credit – –
Deferred Tax Liability/(Asset) (12) 289 2,337 3,586
Net Profit after Tax 4,563 6,469 Less : Minority Interest 377 270 Net Profit after Tax after Minority Interest 4,186 6,199 Earning Per Share (having a face value of ` 5 each) - Basic and Diluted 31 3.43 5.08
Significant Accounting Policies and Notes on Financial Statements 1 to 44

152
Consolidated Cash Flow Statement for the Year Ended 31.03.2013 Particulars For the year ended For the year ended 31 March, 2013 31 March, 2012 ` in lakhs ` in lakhs
A Cash Flows from operating activities :
Net Profit Before Tax 6,900 10,055
Add : Depreciation 1,809 1,701
Add : Finance Cost 3,097 2,314
Add: Bad Debts written off 2 67
Add: Provision for doubtful trade and other receivables, loans
and advances” 71 –
Add: Net unrealised exchange loss 29 –
Less: Liabilities no longer required written back – (4)
Less: Interest Received (45) (58)
Less: Rent Received (54) (45)
Less : Proceeding from sale of fixed assets (8) –
Operating Profit before working capital changes 11,801 14,030
Adjustment for:
Trade receivables (2,124) (4,427)
Inventories (370) (1,333)
Loans and Advances & other assets (424) (867)
Trade payables and Other Payables 1,701 5,409
(1,217) (1,218)
Cash Generated From Operation 10,584 12,812
Less : Income Tax Paid (1,773) (3,968)
Net cash from operating activities “A“ 8,811 8,844
B Cash Flows from Investing activities :
Purchase of fixed assets (2,046) (5,861)
Proceedings from sale of fixed assets 8 –
Purchase of Current Investments (330) –
Purchase of Long Term Investments (1) –
Investment in Subsidiary - Pennar Enviro Limited (406) –
Share Application Money - Pennar Enviro Limited – (21)
Interest Received 20 52
Rent Received 54 45
Net cash used in investing activities “B“ (2,701) (5,785)
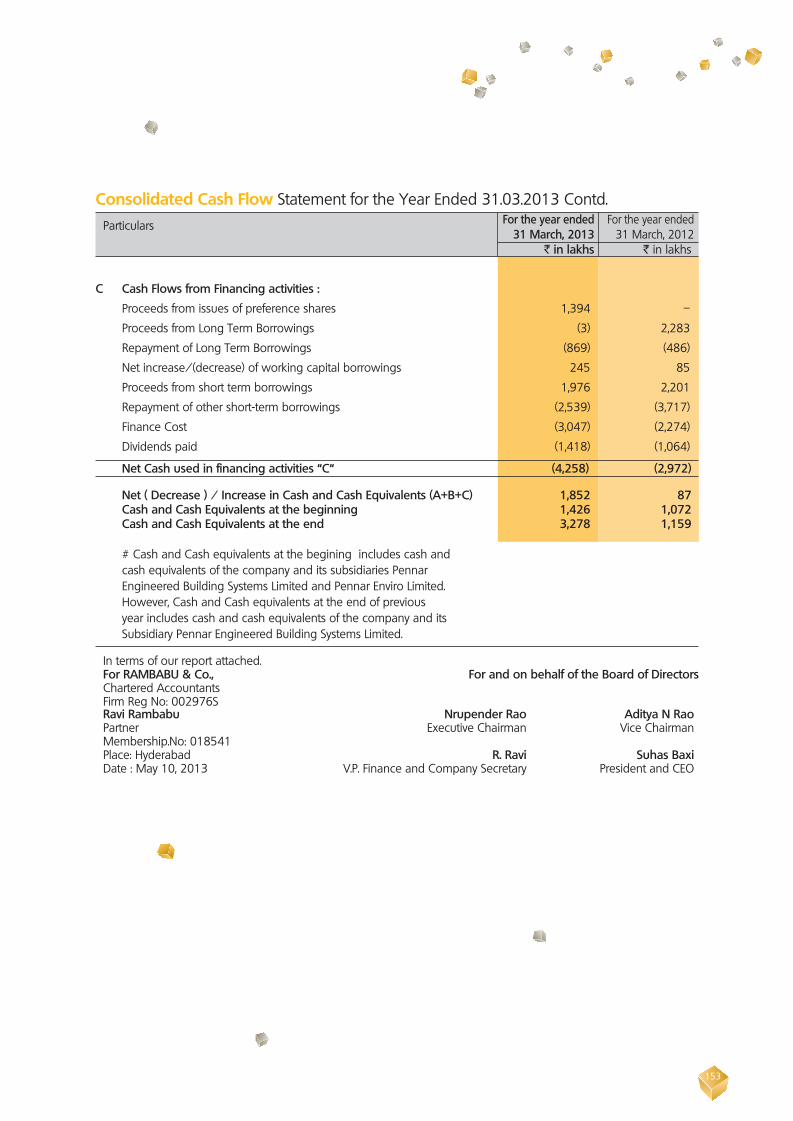
153
Consolidated Cash Flow Statement for the Year Ended 31.03.2013 Contd. Particulars For the year ended For the year ended 31 March, 2013 31 March, 2012 ` in lakhs ` in lakhs
C Cash Flows from Financing activities :
Proceeds from issues of preference shares 1,394 –
Proceeds from Long Term Borrowings (3) 2,283
Repayment of Long Term Borrowings (869) (486)
Net increase/(decrease) of working capital borrowings 245 85
Proceeds from short term borrowings 1,976 2,201
Repayment of other short-term borrowings (2,539) (3,717)
Finance Cost (3,047) (2,274)
Dividends paid (1,418) (1,064)
Net Cash used in financing activities “C“ (4,258) (2,972)
Net ( Decrease ) / Increase in Cash and Cash Equivalents (A+B+C) 1,852 87 Cash and Cash Equivalents at the beginning 1,426 1,072 Cash and Cash Equivalents at the end 3,278 1,159
# Cash and Cash equivalents at the begining includes cash and cash equivalents of the company and its subsidiaries Pennar Engineered Building Systems Limited and Pennar Enviro Limited. However, Cash and Cash equivalents at the end of previous year includes cash and cash equivalents of the company and its Subsidiary Pennar Engineered Building Systems Limited.
In terms of our report attached. For RAMBABU & Co., For and on behalf of the Board of Directors Chartered Accountants Firm Reg No: 002976S Ravi Rambabu Nrupender Rao Aditya N Rao Partner Executive Chairman Vice Chairman Membership.No: 018541 Place: Hyderabad R. Ravi Suhas Baxi Date : May 10, 2013 V.P. Finance and Company Secretary President and CEO

154

155

156
157
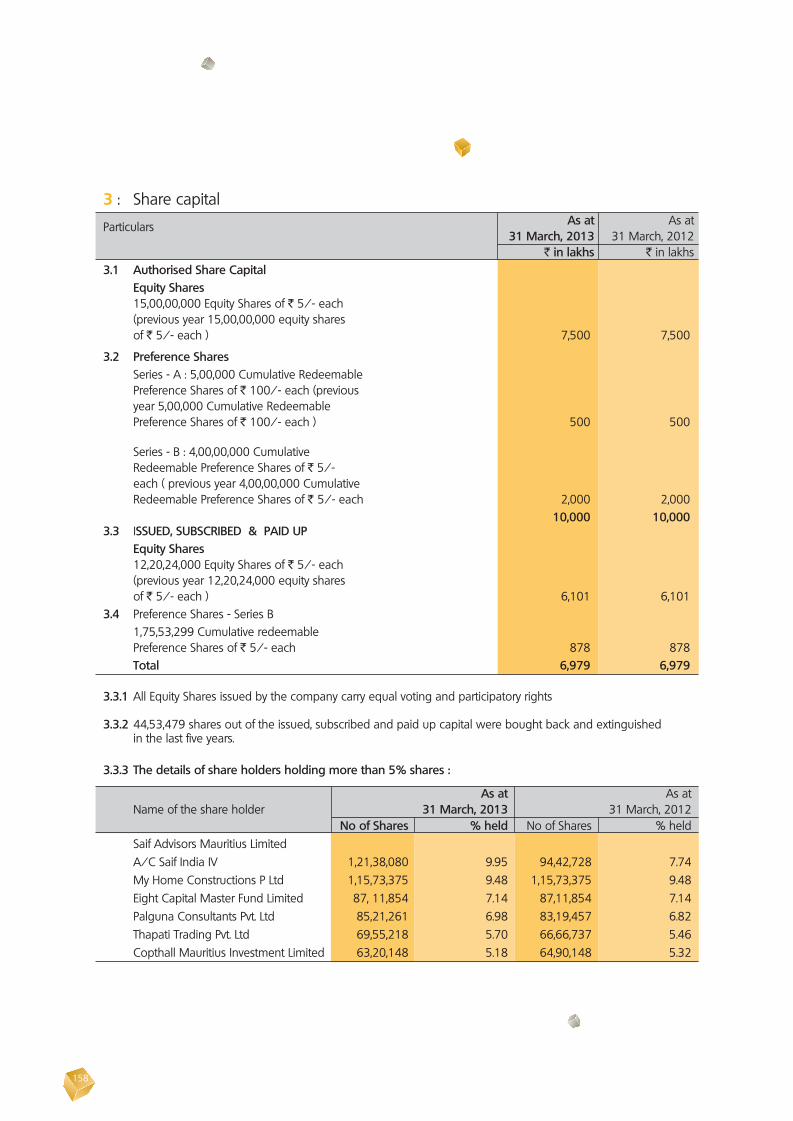
158
3 : Share capital Particulars As at As at 31 March, 2013 31 March, 2012 ` in lakhs ` in lakhs 3.1 Authorised Share Capital Equity Shares 15,00,00,000 Equity Shares of ` 5/- each (previous year 15,00,00,000 equity shares of ` 5/- each ) 7,500 7,500
3.2 Preference Shares Series - A : 5,00,000 Cumulative Redeemable Preference Shares of ` 100/- each (previous year 5,00,000 Cumulative Redeemable Preference Shares of ` 100/- each ) 500 500 Series - B : 4,00,00,000 Cumulative Redeemable Preference Shares of ` 5/- each ( previous year 4,00,00,000 Cumulative Redeemable Preference Shares of ` 5/- each 2,000 2,000 10,000 10,000 3.3 ISSUED, SUBSCRIBED & PAID UP Equity Shares 12,20,24,000 Equity Shares of ` 5/- each (previous year 12,20,24,000 equity shares of ` 5/- each ) 6,101 6,101 3.4 Preference Shares - Series B 1,75,53,299 Cumulative redeemable Preference Shares of ` 5/- each 878 878 Total 6,979 6,979
3.3.1 All Equity Shares issued by the company carry equal voting and participatory rights 3.3.2 44,53,479 shares out of the issued, subscribed and paid up capital were bought back and extinguished
in the last five years.
3.3.3 The details of share holders holding more than 5% shares :
As at As at Name of the share holder 31 March, 2013 31 March, 2012 No of Shares % held No of Shares % held Saif Advisors Mauritius Limited A/C Saif India IV 1,21,38,080 9.95 94,42,728 7.74 My Home Constructions P Ltd 1,15,73,375 9.48 1,15,73,375 9.48 Eight Capital Master Fund Limited 87, 11,854 7.14 87,11,854 7.14 Palguna Consultants Pvt. Ltd 85,21,261 6.98 83,19,457 6.82 Thapati Trading Pvt. Ltd 69,55,218 5.70 66,66,737 5.46 Copthall Mauritius Investment Limited 63,20,148 5.18 64,90,148 5.32

159
3.3.4 The reconciliation of the no of shares outstanding is set out below :
Particulars As at As at 31 March, 2013 31 March, 2012 No. of Shares No. of Shares Equity Shares at the beginning of the year 12,20,24,000 12,20,24,000 Add/(Less) : Movement during the year – – Equity Shares at the end of the year 12,20,24,000 12,20,24,000 3.4.1 Out of 1,75,53,299 cumulative redeemable preference shares, 1,66,49,119 number of Preference Shares of
` 5/- each fully paid up and carrying 0.01% rate of interest are redeemable at par in three equal annual instalments of ` 1.66, Rs.1.67 and Rs.1.67 per share respectively commencing from the year 2013 -14 and ending in the year 2015-16.
3.4.2 Out of 1,75,53,299 cumulative redeemable preference shares, 9,04,180 number Preference Shares of ` 5/- each issued to IFCI on conversion of Funded Interest Term Loans and carrying interest rate of 0.01% are redeemable at par in 10 quarterly instalments from 01.10.2013 to 01.01.2016.
4 : Reserves and Surplus Particulars As at As at 31 March, 2013 31 March, 2012 ` in lakhs ` in lakhs ` in lakhs ` in lakhs Revaluation Reserve Opening Balance 3,013 3,267 Less : Transferred to Statement of
Profit and Loss on account of depreciation on revalued assets. 254 254
Closing Balance 2,759 3,013
Capital Redemption Reserve Opening Balance 223 223 223 223
Capital Reserve on account of consolidation of Pennar Enviro Ltdt 23 23 – –
Profit on forfeiture of shares Opening Balance 6 6 6 6
Securities Premium Opening Balance 5,310 5,310 Add : Preimium on shares issued
during the year by PEBS 848 6,158 – 5,310

160
5 : Long Term Borrowings Particulars As at As at 31 March, 2013 31 March, 2012 ` in lakhs ` in lakhs Term Loans (Secured) Axis Bank Limited 942 1,674 IFCI 3 21 Vehicle Loan (Secured) – 6 945 1,701 Sales Tax Deferment Loan (Unsecured) 2,327 2,331 Total 3,272 4,032
5.1 During the year company has taken a term loan from Axis Bank amount to ` 1500 Lakhs for funding the CDW and Tubes project.The loan is repayable in 16 Quarterly instalments starting from Dec 2012. The loan carries the interest rate of 13.5% per annum.
5.2 Term Loans obtained from Axis Bank and IFCI Limited are secured by first charge on all immovable properties by deposit of title deeds and second charge on all current assets both present and future and guaranteed by a director of the company in his personal capacity.
4 : Reserves and Surplus (Contd.) Particulars As at As at 31 March, 2013 31 March, 2012 ` in lakhs ` in lakhs ` in lakhs ` in lakhs General Reserve Opening Balance 2,115 1,705
Add : Transferred from statement of Profit and Loss 236 410
Closing Balance 2,351 2,115 Profit and Loss Account Opening Balance 13,766 9,382 Add : Profit for the year 4,186 6,199 Add: Adjustment for last year intercompany transaction – 13 17,952 15,594 Less : Appropriations Proposed dividend on Equity Shares 1,220 1,220 Proposed dividend on Preference Shares - ` 8777 (Previous Year - ` 8777) – – Dividend Distribution Tax 207 198 General Reserve 236 410 Closing Balance 16,289 13,766 Total 27,809 24,433
4.1 Cumulative amount withdrawn on account of depreciation on revaluation reserve is ` 3,537 Lakhs as on 31.03.2013 out of ` 6296 lakhs.

161
6 : Deferred Tax Liability Particulars As at As at 31 March, 2013 31 March, 2012 ` in lakhs ` in lakhs Opening Deferred Tax Liability 1,496 1,184 Deferred Tax Liability recognised during the year On a/cc of depreciation (12) 289 Net Deferred Tax Liability 1,484 1,473
7 : Other Long Term Liabilities Particulars As at As at 31 March, 2013 31 March, 2012 ` in lakhs ` in lakhs Trade Payables 148 58 Trade/Security Deposits Received 18 12 Total 166 70
5 : Long Term Borrowings (Contd.) 5.3 Sales Tax deferment availed till the current account period is due for repayment after 12 months from balance
sheet date as under :
Year of Repayment ` in lakhs 2018-19 258 2019-20 375 2020-21 393 2021-22 431 2022-23 297 2023-24 335 2024-25 215 Total 2,304

162
9 : Short Term Borrowings Particulars As at As at 31 March, 2013 31 March, 2012 ` in lakhs ` in lakhs Secured Cash Credit from Banks State Bank of India 8,181 9,634 Axis Bank Limited 1,300 1,928 State Bank of Patiala 1,061 1,024 Others – 1
Term Loans repayable on demand 1,732 – Total 12,274 12,587 9.1 Working capital facilities sanctioned by State Bank of India, Axis Bank and State Bank of Patiala are secured by first
charge on all current assets both present and future. These are further secured by way of second charge on the immovable properties of the company and also guaranteed by a director of the company in his personal capacity.
10 : Trade Payables Particulars As at As at 31 March, 2013 31 March, 2012 ` in lakhs ` in lakhs Creditors for RM 5,396 5,787 Creditors for expenses 5,515 5,240 Due to Micro, Small and Medium Enterprises 32 – Total 10,943 11,027
8 : Long Term Provisions Particulars As at As at 31 March, 2013 31 March, 2012 ` in lakhs ` in lakhs Compensated absences 126 113 Gratuity 73 39 Total 199 152

163
11 : Other Current Liabilities Particulars As at As at 31 March, 2013 31 March, 2012 ` in lakhs ` in lakhs Current Maturities of Long Term Debt 770 788 Interest accrued but not due on borrowings 26 – Interest accrued and due on borrowings 30 24 Creditors for capital goods 17 79 Unclaimed Dividend 54 43 Advances from customers 2,782 1,321 Sales Tax Deferment Loan 44 77 VAT Payable 424 198 Forward Contract Payable 1,806 2,263 Other Liabilities 1,579 979 Trade/Security Deposits Received – 1 Total 7,532 5,773
11.1 Other liabilities consists of TDS,TCS,PF & ESI payable etc.
12 : Short Term Provisions Particulars As at As at 31 March, 2013 31 March, 2012 ` in lakhs ` in lakhs Provision for Gratuity 28 – Provision for Leave Encashment 57 – Provision for Equity Dividend 1,220 1,220 Provision for Preference Dividend - ` 8777 (Previous Year - Rs 8777) – – Provision for Dividend Distribution Tax 207 198 Provision for Employee Benefits – 48 Provision for Tax (net of advance tax) 739 13
Total 2,251 1,479

164
S.NO
ASSE
T G
ROUP
Gro
ss B
lock
(At C
ost)
Dep
recia
tion
& Am
ortis
atio
n N
et B
ook
Valu
e O
p Bl
ock
Add
itions
D
ispos
als
Oth
er A
djus
tmen
t A
s on
Op
Bloc
k Fo
r the
yea
r D
ispos
als
As o
n A
s on
As o
n A
s on
1.4.
2012
FY
- 201
2-13
FY
- 201
2-13
3
1.03
.201
3 A
s on
1.4.
2012
20
12 -
2013
Adj
FY 1
2-13
31.
03.2
013
31.
03.2
013
31.
03.2
012
TAN
GIB
LE A
SSET
S 1
LAN
D 1
,307
2
4 –
–
1
,331
–
–
–
–
1
,331
1
,307
(P
revio
us Y
ear)
(1,0
40)
(241
) –
–
(1
,281
) –
–
–
–
(1
,307
) (1
,040
)2
ROA
DS
495
–
–
–
4
95
23
8
–
31
464
4
71
(Pre
vious
Yea
r) (4
07)
(88)
–
–
(495
) (1
6) (7
) –
(2
3) (4
71)
(390
)3
BUILD
ING
S 9
,983
3
3 –
–
1
0,01
6 2
,028
3
18
–
2,3
46
7,6
70
7,9
11
(Pre
vious
Yea
r) (8
,201
) (1
,724
) –
–
(9
,922
) (1
,732
) (2
78)
–
(2,0
10)
(7,9
11)
(6,4
69)
4PL
AN
T &
MA
CHIN
ERY
24,
670
401
5
1 –
2
5,02
0 1
2,38
7 1
,348
5
1 1
3,68
4 1
1,33
6 1
2,28
3 (P
revio
us Y
ear)
(21,
090)
(3,4
85)
–
–
(24,
575)
(11,
030)
(1,3
18)
–
(12,
348)
(12,
283)
(10,
060)
5EL
ECTR
ICA
LS 2
,678
9
1 –
–
2
,769
1
,084
1
84
–
1,2
68
1,5
01
1,5
94
(Pre
vious
Yea
r) (2
,338
) (3
44)
–
(12)
(2,6
78)
(906
) (1
78)
–
(1,0
84)
(1,5
94)
(1,4
32)
6CO
MPU
TERS
584
8
9 –
–
6
73
364
6
6 –
4
30
243
2
13
(Pre
vious
Yea
r) (4
88)
(35)
–
–
(540
) (2
62)
(66)
–
(328
) (2
13)
(226
)7
OFF
ICE
EQ
UIP
MEN
TS 4
45
18
–
–
463
1
75
48
–
223
2
40
270
(P
revio
us Y
ear)
(301
) (5
7) –
–
(3
70)
(121
) (1
4) –
(1
36)
(270
) (1
79)
8FU
RNIT
URE
312
1
7 –
–
3
29
106
1
8 –
1
24
205
2
06
(Pre
vious
Yea
r) (2
08)
(47)
–
- (2
70)
(58)
(22)
–
(80)
(206
) (1
51)
9VE
HIC
LES
161
4
4 –
–
2
05
53
15
–
68
137
6
9 (P
revio
us Y
ear)
(101
) –
–
–
(1
01)
(24)
(9)
–
(33)
(69)
(78)
10LE
ASE
HO
LD IM
PRO
VEM
ENTS
84
–
–
–
84
26
13
39
45
57
(Pre
vious
Yea
r) (8
2) –
–
–
(8
4) (9
) (1
7) (2
6) (5
7) (7
3)SU
B TO
TAL–
1 4
0,71
9 7
17
51
(12)
4
1,38
5 1
6,24
6 2
,018
5
1 1
8,21
3 2
3,17
2 2
4,38
1
(34,
256)
(6,0
21)
–
– (4
0,31
6) (1
4,15
8) (1
,909
) –
(1
6,06
8) (2
4,38
1) (2
0,09
8)
INTA
NG
IBLE
ASS
ETS
11LIC
ENCE
FEE
417
1
9 –
–
4
36
81
56
–
137
2
99
336
(P
revio
us Y
ear)
(269
) (8
8) –
–
(4
17)
(37)
(44)
–
(44)
(336
) (2
32)
SUB
TOTA
L–2
417
1
9 –
–
436
8
1 5
6 –
1
37
299
3
36
(Pre
vious
Yea
r) (2
69)
(88)
–
– (4
17)
(37)
(44)
–
(44)
(336
) (2
32)
TOTA
L (1
+ 2
) 4
1,13
6 7
36
51
(12)
41,
821
16,
327
2,0
74
51
18,
350
23,
471
24,
717
(Pre
vious
Yea
r) (3
4,52
5) (6
,109
) –
–
(40,
733)
(14,
195)
(1,9
53)
–
(16,
112)
(24,
717)
(20,
330)
Not
e 13
: Fix
ed a
sset
s`
in La
khs

165
14 : Non Current Investments Particulars As at As at 31 March, 2013 31 March, 2012 ` in lakhs ` in lakhs Unquoted Mana Effluent Treatment Plant Limited 2 – During the year the company has invested in the Common ETP Plant at Mallapur for 200 equity shares at Rs 1000 each Total 2 –
15 : Long term loans and advances Particulars As at As at 31 March, 2013 31 March, 2012 ` in lakhs ` in lakhs Secured and Considered Good Capital Advances 2 116 Unsecured and Considered Good Prepaid Expenses – 21 Advance Tax (Net of Provision) 581 – Total 583 137
16 : Other Non Current Assets Particulars As at As at 31 March, 2013 31 March, 2012 ` in lakhs ` in lakhs Sales Tax Claims 124 55 Electricity Deposit 217 178 Rental and Other Deposit 163 132 Water Deposit 21 12 Unaccrued Finance Charges 2 – Deferred Revenue Expenses - Share Issue Expenses 2 – - Water Treatment Chemical Division 2 – - Water Projects Division 143 – Total 674 377
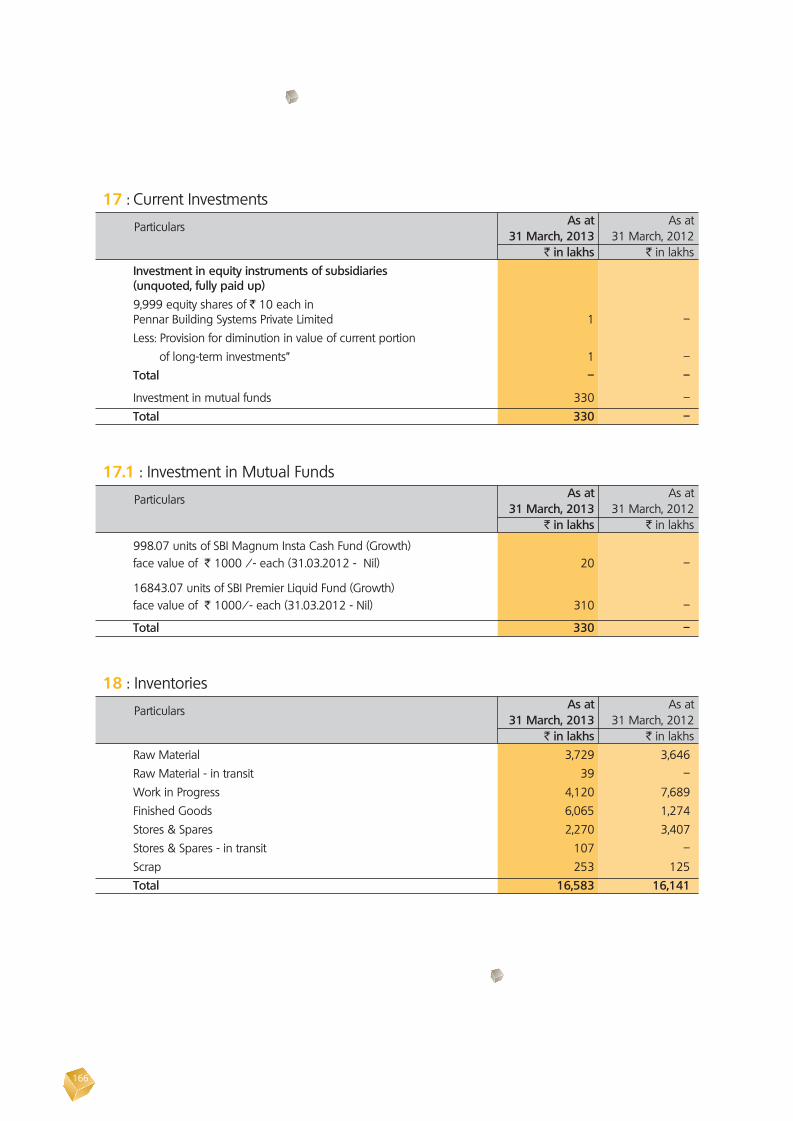
166
17 : Current Investments Particulars As at As at 31 March, 2013 31 March, 2012 ` in lakhs ` in lakhs Investment in equity instruments of subsidiaries (unquoted, fully paid up) 9,999 equity shares of ` 10 each in Pennar Building Systems Private Limited 1 – Less: Provision for diminution in value of current portion of long-term investments” 1 – Total – –
Investment in mutual funds 330 – Total 330 –
17.1 : Investment in Mutual Funds Particulars As at As at 31 March, 2013 31 March, 2012 ` in lakhs ` in lakhs
998.07 units of SBI Magnum Insta Cash Fund (Growth) face value of ` 1000 /- each (31.03.2012 - Nil) 20 –
16843.07 units of SBI Premier Liquid Fund (Growth) face value of ` 1000/- each (31.03.2012 - Nil) 310 –
Total 330 –
18 : Inventories Particulars As at As at 31 March, 2013 31 March, 2012 ` in lakhs ` in lakhs Raw Material 3,729 3,646 Raw Material - in transit 39 – Work in Progress 4,120 7,689 Finished Goods 6,065 1,274 Stores & Spares 2,270 3,407 Stores & Spares - in transit 107 – Scrap 253 125 Total 16,583 16,141

167
19 : Trade Receivable Particulars As at As at 31 March, 2013 31 March, 2012 ` in lakhs ` in lakhs Outstanding for more than 6 months Secured – 3 unsecured 1,494 1,766 Doubtful 45 49 Other Trade Receivables Secured 1,889 549 unsecured 19,943 18,646 23,371 21,013 Less : Provision for doubtful trade receivables (45) (49) Total 23,326 20,964
20 : Short Term Loans and Advances Particulars As at As at 31 March, 2013 31 March, 2012 ` in lakhs ` in lakhs Cash on hand 7 14 Cheques on hand 63 –
Balances with banks - in current accounts 699 239 - in deposit accounts 1,996 400 - in Collection accounts 471 463 - in unclaimed dividend accounts 42 43 - in margin money accounts 625 600 Other Bank Balances Fixed Deposit under lien 205 200 Total 4,108 1,959 Cash and Cash Equivalents for Cash Flow Statement 3,278 1,159
20.1 The company has provided a collateral security, a lien on fixed deposit of ` 200 lacs towards the Term Loans and Working Capital Loans taken by subsidiary M/s Pennar Engineered Building Systems Limited.
20.2 Out of the margin money balance, an amount of ` 225 lakhs has maturity period of more than 12 months.
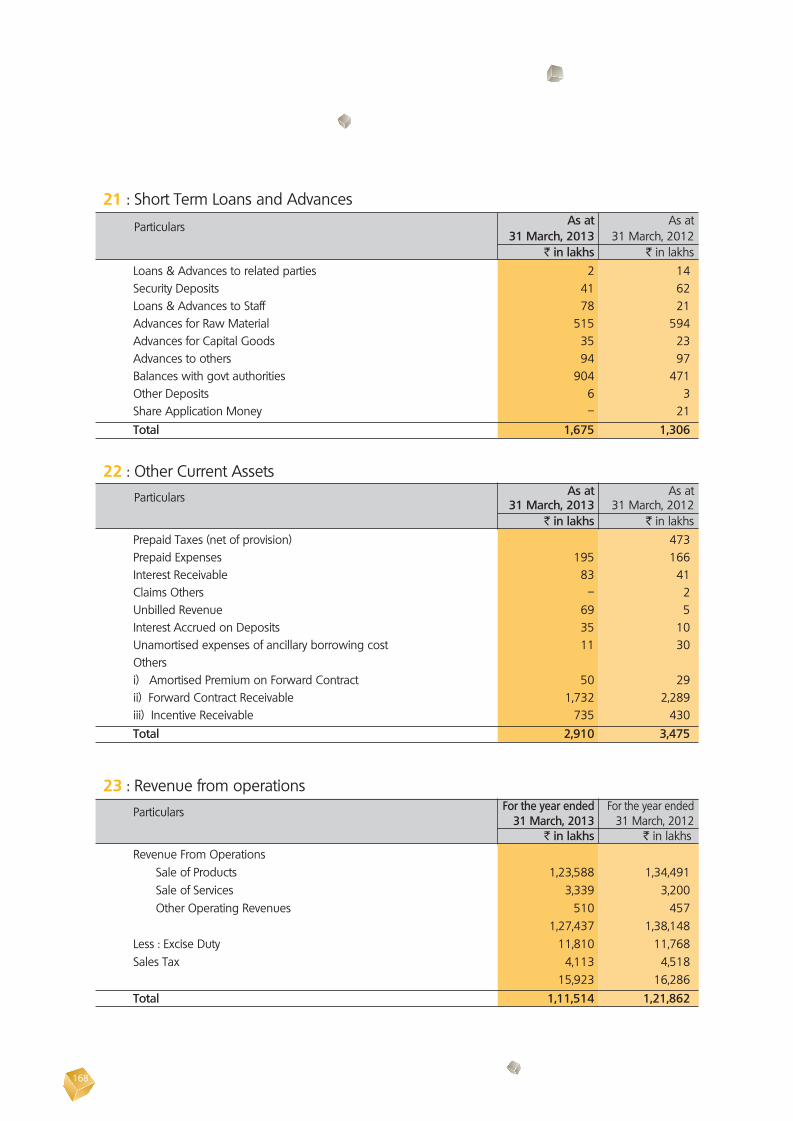
168
23 : Revenue from operations Particulars For the year ended For the year ended 31 March, 2013 31 March, 2012 ` in lakhs ` in lakhs Revenue From Operations Sale of Products 1,23,588 1,34,491 Sale of Services 3,339 3,200 Other Operating Revenues 510 457 1,27,437 1,38,148 Less : Excise Duty 11,810 11,768 Sales Tax 4,113 4,518 15,923 16,286 Total 1,11,514 1,21,862
21 : Short Term Loans and Advances Particulars As at As at 31 March, 2013 31 March, 2012 ` in lakhs ` in lakhs Loans & Advances to related parties 2 14 Security Deposits 41 62 Loans & Advances to Staff 78 21 Advances for Raw Material 515 594 Advances for Capital Goods 35 23 Advances to others 94 97 Balances with govt authorities 904 471 Other Deposits 6 3 Share Application Money – 21 Total 1,675 1,306
22 : Other Current Assets Particulars As at As at 31 March, 2013 31 March, 2012 ` in lakhs ` in lakhs Prepaid Taxes (net of provision) 473 Prepaid Expenses 195 166 Interest Receivable 83 41 Claims Others – 2 Unbilled Revenue 69 5 Interest Accrued on Deposits 35 10 Unamortised expenses of ancillary borrowing cost 11 30 Others i) Amortised Premium on Forward Contract 50 29 ii) Forward Contract Receivable 1,732 2,289 iii) Incentive Receivable 735 430 Total 2,910 3,475

169
24 : Other Income Particulars For the year ended For the year ended 31 March, 2013 31 March, 2012 ` in lakhs ` in lakhs
Interest Income 96 94 Profit on sale of fixed assets 8 – Rent received 13 (11) Gain on Exchange Fluctuations 36 1 Liabilities/Provision no longer required written back – 4 Incentives on Sales Tax 305 270 Miscellaneous Income 25 20 Total 483 378
25 : Raw Material Consumed Particulars For the year ended For the year ended 31 March, 2013 31 March, 2012 ` in lakhs ` in lakhs Opening Stocks 3,698 4,804 Add : Purchases 78,811 89,289 82,509 94,093
Less : Materials Capitalised 165 – Less : Closing Stocks 3,729 3,646
Consumption 78,615 90,447 Less : Scrap Sales (5,097) (4,926)
Consumption 73,518 85,520
26 : Changes in Inventory Particulars For the year ended For the year ended 31 March, 2013 31 March, 2012 ` in lakhs ` in lakhs Opening Stocks Work in Progress 7,689 4,376 Finished Goods 1,295 2,501 Scrap 125 117 9,109 6,994 Closing Stocks Work in Progress 6,087 7,689 Finished Goods 2,559 1,211 Scrap 253 124 8,899 9,024 Net (increase)/Decrease 210 (2,030) (Increase)/Decrease in Excise Duty - (24) Total 210 (2,054)

170
27.1 : Stores and Spares Consumption Particulars For the year ended For the year ended 31 March, 2013 31 March, 2012 ` in lakhs ` in lakhs Opening Stocks 3,407 2,970 Add : Purchases 6,994 7,562 10,401 10,532
Less : Closing Stocks 2,377 3,407 Consumption 8,024 7,125
28 : Employee Benefits Expense Particulars For the year ended For the year ended 31 March, 2013 31 March, 2012 ` in lakhs ` in lakhs
Salaries & Wages 5,109 4,512 Contribution to Gratuity,PF & Super Annuation 492 342 Staff Welfare Expenses 505 432 Less : Capitalised (12) – Total 6,094 5,286
Salaries & wages includes Bonus and Exgratia amounting to ` 146 lakhs (previous year - ` 218 lakhs)
27 : Manufacturing Expenses Particulars For the year ended For the year ended 31 March, 2013 31 March, 2012 ` in lakhs ` in lakhs Sub Contract Expenses 5,014 4,439 Stores & Spares 8,024 7,125 Power 1,362 1,117 Repairs & Maintenance - Buildings 56 102 Repairs & Maintenance - Plant & Machinery 116 113 Repairs & Maintenance - Others 80 122 Miscellaneous manufacturing expenses 228 191 Total 14,880 13,209

171
29 : Other Expenses Particulars For the year ended For the year ended 31 March, 2013 31 March, 2012 ` in lakhs ` in lakhs Insurance 57 44 Travelling & Conveyance 738 742 Rent 243 154 Rates & Taxes 66 59 Advertisement & Sales Promotion 141 101 Sales Commission 321 241 Communication Expenses 100 93 Freight Outward 2,741 2,782 Technical, Legal & Professional 324 319 Managerial Remuneration 305 484 Directors’ Fees & Expenses 2 10 Printing & Stationery 73 54 Bad Trade and Other Receivables 46 66 Provision for advances 25 – Provision for investment losses 1 – Net loss on foreign currency transactions and translation (other than considered as finance cost) – 9 Auditors’ Remuneration 33 29 Miscellaneous Expenses 279 243 Less : Capitalised (30) – Total 5,465 5,429
30 : Finance Cost Particulars For the year ended For the year ended 31 March, 2013 31 March, 2012 ` in lakhs ` in lakhs Interest on Term Loans 423 406 Interest on Working Capital 1,462 1,547 Interest on Income Tax 47 85 Premium on forward contract – 63 Bank Charges 1,157 990 Interest on Vehicle Loan 1 – Loss on foreign currency transactions 36 – Total 3,126 3,092
31 : Earning Per Share (EPS) Particulars For the year ended For the year ended 31 March, 2013 31 March, 2012 ` in lakhs ` in lakhs Net profit after adjusting minority interest ` in Lakhs) 4,186 6,199 Weighted Average No. of shares 12,2,024,000 12,20,24,000 Annualized Basic Earning per share (`) 3.43 5.08

172
32 : Contingent Liabilities Sl Particulars As at As at
No 31 March, 2013 31 March, 2012 ` in lakhs ` in lakhs i) Bank Guarantees given by banks 666 292 ii) Claims by Customs & Sales Tax 234 437 iii) Estimated amount of contracts remaining to be executed on capital account and not provided for (net) 177 3,105 iv) LC/Bills Discounted 4,128 5,531
32.1 Details of disputed dues to customs & Sales tax are given below: ` in lakhs
Sl No Nature of Statue Nature of dues Forum Where dispute is pending Amount
1 Customs Act 1962 Interest on Customs Duty Paid High Court 45 2 AP VAT Act Entry Tax on Cix The Supreme Court of India 219
32.2 Out of the disputed due amount of ` 218.6 Lakhs against Entry Tax on CIX, an amount of Rs.53.3 Lakhs has been deposited. The Unpaid amount is 165.3 Lakhs.
33 Disclosures required under Section 22 of the Micro, Small and Medium Enterprises Development Act, 2006 Particulars As at As at 31 March, 2013 31 March, 2012 ` in lakhs ` in lakhs
(i) Principal amount remaining unpaid to any supplier as at the end of the accounting year (Refer note 9) 32 –
(ii) Interest due thereon remaining unpaid to any supplier as at the end of the accounting year – –
(iii) The amount of interest paid along with the amounts of the payment made to the supplier beyond the appointed day – –
(iv) The amount of interest due and payable for the year – –
(v) The amount of interest accrued and remaining unpaid at the end of the accounting year – –
(vi) The amount of further interest due and payable even in the succeeding year, until such date when the interest dues as above are actually paid – –
34 : Managerial Remuneration Sl Particulars For the year For the year No ended 31.03.2013 ended 31.03.2012 ` in lakhs ` in lakhs
(i) Directors Salaries & Allowances 132 132
(ii) Providend Fund & Superannuation 26 26
(iii) Other Perquisites 34 34
(iv) Commission 113 292
Total 305 484
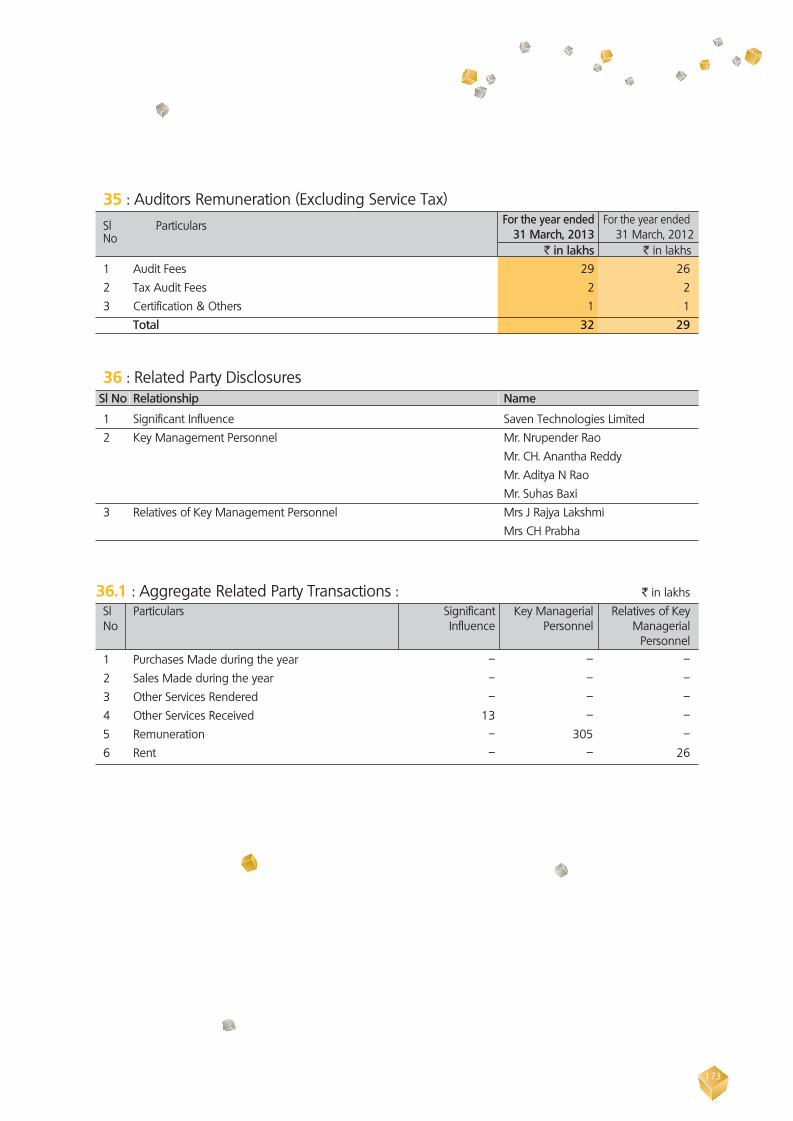
173
35 : Auditors Remuneration (Excluding Service Tax) Sl Particulars For the year ended For the year ended No 31 March, 2013 31 March, 2012 ` in lakhs ` in lakhs 1 Audit Fees 29 26 2 Tax Audit Fees 2 2 3 Certification & Others 1 1 Total 32 29
36 : Related Party Disclosures Sl No Relationship Name
1 Significant Influence Saven Technologies Limited 2 Key Management Personnel Mr. Nrupender Rao Mr. CH. Anantha Reddy Mr. Aditya N Rao Mr. Suhas Baxi 3 Relatives of Key Management Personnel Mrs J Rajya Lakshmi Mrs CH Prabha
36.1 : Aggregate Related Party Transactions : ` in lakhs Sl Particulars Significant Key Managerial Relatives of Key No Influence Personnel Managerial Personnel 1 Purchases Made during the year – – – 2 Sales Made during the year – – – 3 Other Services Rendered – – – 4 Other Services Received 13 – – 5 Remuneration – 305 – 6 Rent – – 26
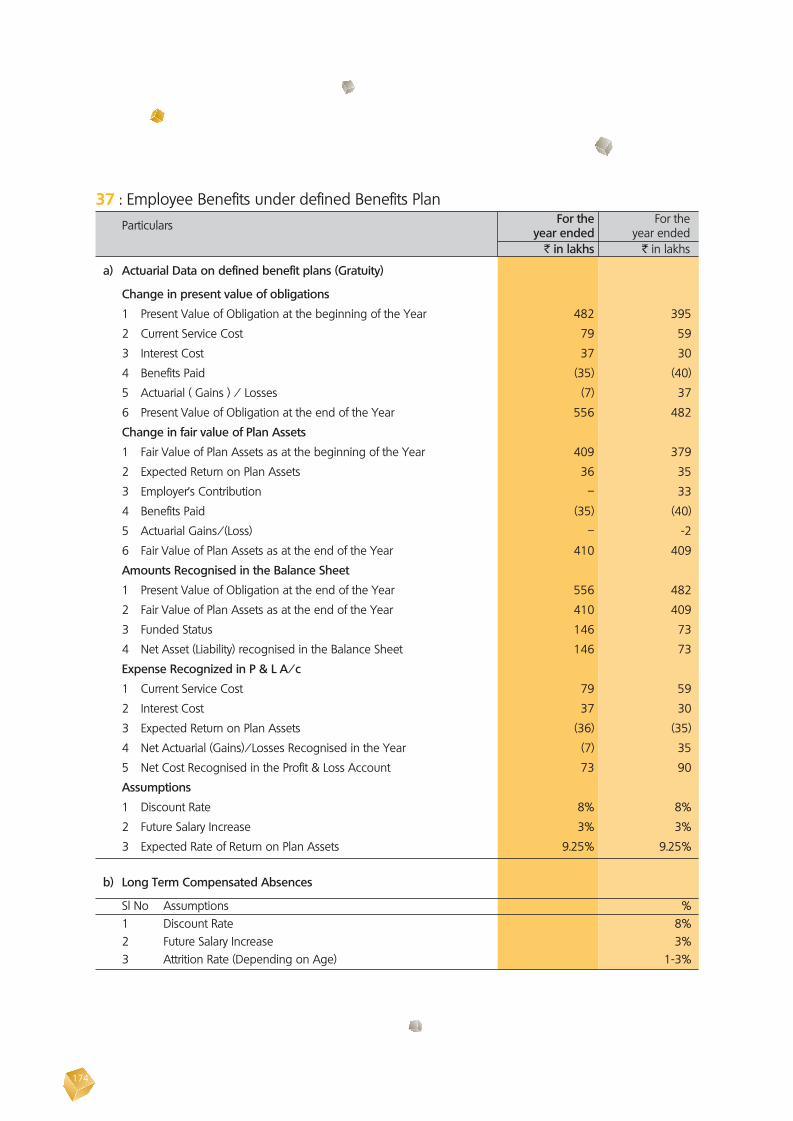
174
37 : Employee Benefits under defined Benefits Plan Particulars For the For the year ended year ended ` in lakhs ` in lakhs
a) Actuarial Data on defined benefit plans (Gratuity)
Change in present value of obligations
1 Present Value of Obligation at the beginning of the Year 482 395
2 Current Service Cost 79 59
3 Interest Cost 37 30
4 Benefits Paid (35) (40)
5 Actuarial ( Gains ) / Losses (7) 37
6 Present Value of Obligation at the end of the Year 556 482
Change in fair value of Plan Assets
1 Fair Value of Plan Assets as at the beginning of the Year 409 379
2 Expected Return on Plan Assets 36 35
3 Employer’s Contribution – 33
4 Benefits Paid (35) (40)
5 Actuarial Gains/(Loss) – -2
6 Fair Value of Plan Assets as at the end of the Year 410 409
Amounts Recognised in the Balance Sheet
1 Present Value of Obligation at the end of the Year 556 482
2 Fair Value of Plan Assets as at the end of the Year 410 409
3 Funded Status 146 73
4 Net Asset (Liability) recognised in the Balance Sheet 146 73
Expense Recognized in P & L A/c
1 Current Service Cost 79 59
2 Interest Cost 37 30
3 Expected Return on Plan Assets (36) (35)
4 Net Actuarial (Gains)/Losses Recognised in the Year (7) 35
5 Net Cost Recognised in the Profit & Loss Account 73 90
Assumptions
1 Discount Rate 8% 8%
2 Future Salary Increase 3% 3%
3 Expected Rate of Return on Plan Assets 9.25% 9.25%
b) Long Term Compensated Absences
Sl No Assumptions % 1 Discount Rate 8% 2 Future Salary Increase 3% 3 Attrition Rate (Depending on Age) 1-3%
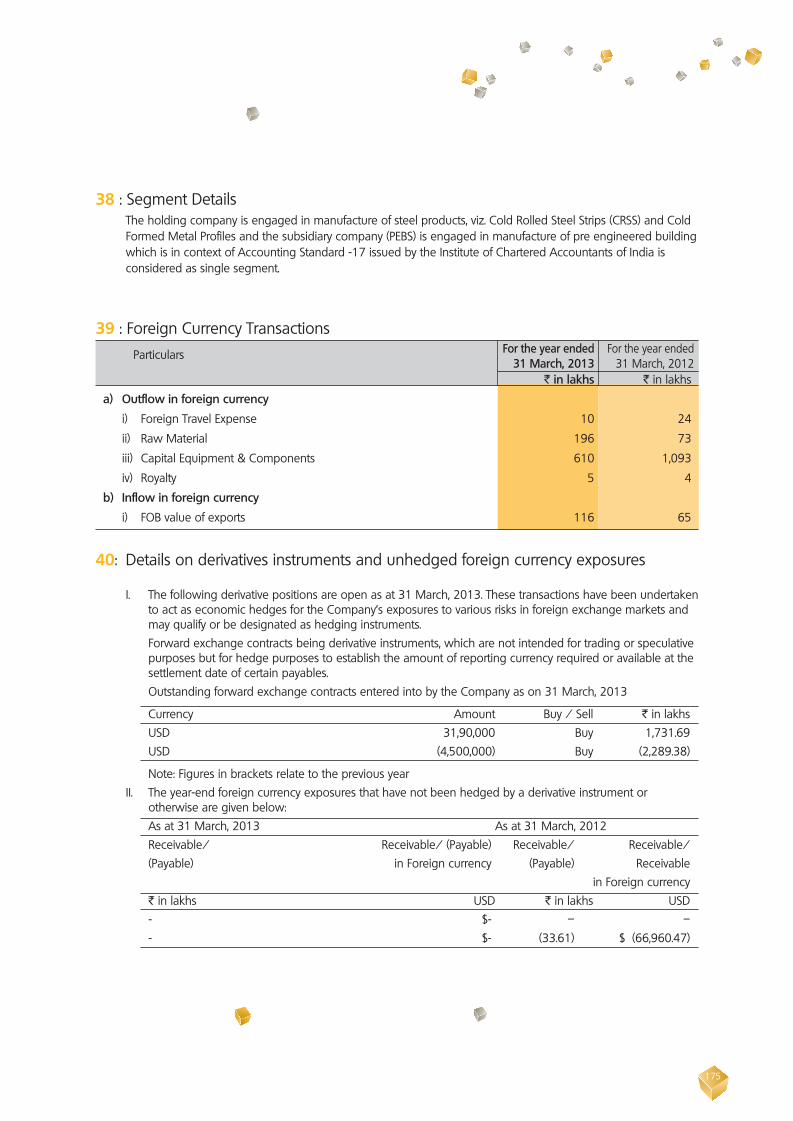
175
38 : Segment Details The holding company is engaged in manufacture of steel products, viz. Cold Rolled Steel Strips (CRSS) and Cold
Formed Metal Profiles and the subsidiary company (PEBS) is engaged in manufacture of pre engineered building which is in context of Accounting Standard -17 issued by the Institute of Chartered Accountants of India is considered as single segment.
39 : Foreign Currency Transactions Particulars For the year ended For the year ended 31 March, 2013 31 March, 2012 ` in lakhs ` in lakhs
a) Outflow in foreign currency
i) Foreign Travel Expense 10 24
ii) Raw Material 196 73
iii) Capital Equipment & Components 610 1,093
iv) Royalty 5 4
b) Inflow in foreign currency
i) FOB value of exports 116 65
40: Details on derivatives instruments and unhedged foreign currency exposures I. The following derivative positions are open as at 31 March, 2013. These transactions have been undertaken
to act as economic hedges for the Company’s exposures to various risks in foreign exchange markets and may qualify or be designated as hedging instruments.
Forward exchange contracts being derivative instruments, which are not intended for trading or speculative purposes but for hedge purposes to establish the amount of reporting currency required or available at the settlement date of certain payables.
Outstanding forward exchange contracts entered into by the Company as on 31 March, 2013
Currency Amount Buy / Sell ` in lakhs USD 31,90,000 Buy 1,731.69 USD (4,500,000) Buy (2,289.38)
Note: Figures in brackets relate to the previous year II. The year-end foreign currency exposures that have not been hedged by a derivative instrument or
otherwise are given below: As at 31 March, 2013 As at 31 March, 2012 Receivable/ Receivable/ (Payable) Receivable/ Receivable/ (Payable) in Foreign currency (Payable) Receivable in Foreign currency ` in lakhs USD ` in lakhs USD - $- – – - $- (33.61) $ (66,960.47)
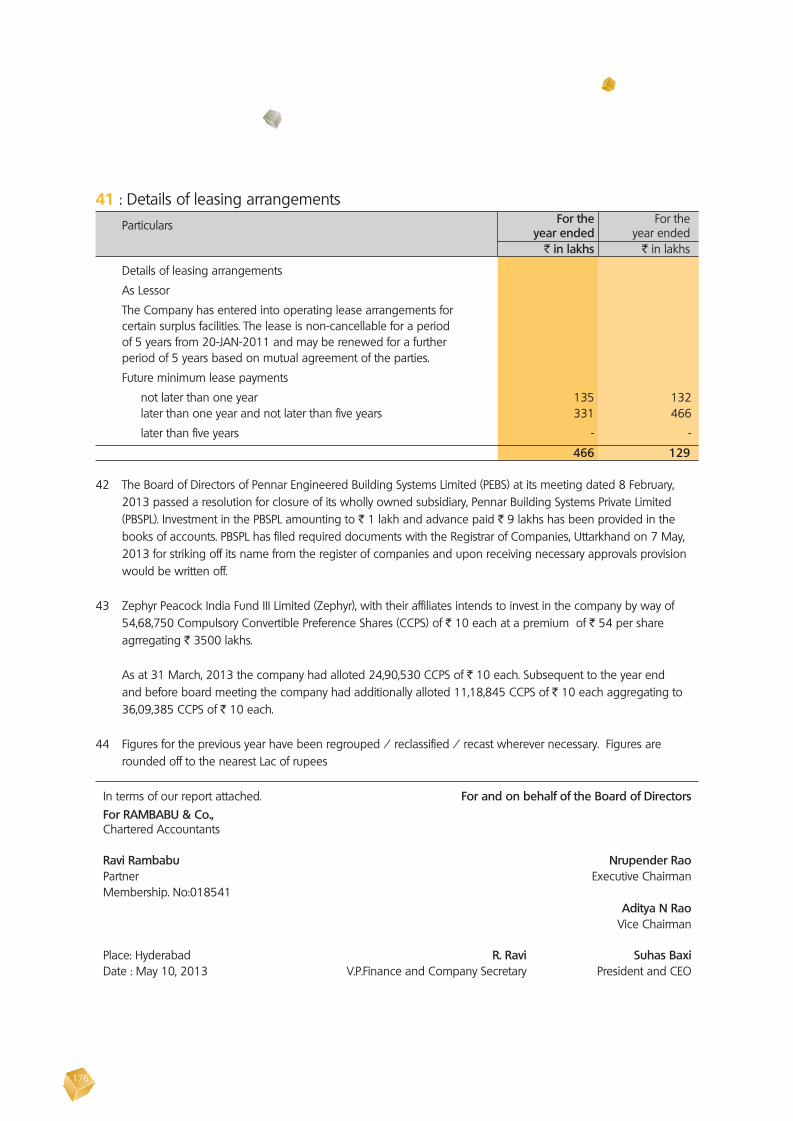
176
41 : Details of leasing arrangements Particulars For the For the year ended year ended ` in lakhs ` in lakhs
Details of leasing arrangements
As Lessor
The Company has entered into operating lease arrangements for certain surplus facilities. The lease is non-cancellable for a period of 5 years from 20-JAN-2011 and may be renewed for a further period of 5 years based on mutual agreement of the parties.
Future minimum lease payments
not later than one year 135 132 later than one year and not later than five years 331 466
later than five years - -
466 129
42 The Board of Directors of Pennar Engineered Building Systems Limited (PEBS) at its meeting dated 8 February, 2013 passed a resolution for closure of its wholly owned subsidiary, Pennar Building Systems Private Limited (PBSPL). Investment in the PBSPL amounting to ` 1 lakh and advance paid ` 9 lakhs has been provided in the books of accounts. PBSPL has filed required documents with the Registrar of Companies, Uttarkhand on 7 May, 2013 for striking off its name from the register of companies and upon receiving necessary approvals provision would be written off.
43 Zephyr Peacock India Fund III Limited (Zephyr), with their affiliates intends to invest in the company by way of
54,68,750 Compulsory Convertible Preference Shares (CCPS) of ` 10 each at a premium of ` 54 per share agrregating ` 3500 lakhs.
As at 31 March, 2013 the company had alloted 24,90,530 CCPS of ` 10 each. Subsequent to the year end and before board meeting the company had additionally alloted 11,18,845 CCPS of ` 10 each aggregating to 36,09,385 CCPS of ` 10 each.
44 Figures for the previous year have been regrouped / reclassified / recast wherever necessary. Figures are rounded off to the nearest Lac of rupees
In terms of our report attached. For and on behalf of the Board of Directors For RAMBABU & Co., Chartered Accountants
Ravi Rambabu Nrupender Rao Partner Executive Chairman Membership. No:018541 Aditya N Rao Vice Chairman
Place: Hyderabad R. Ravi Suhas Baxi Date : May 10, 2013 V.P.Finance and Company Secretary President and CEO


Annual Report 2012-13
Pennar Industries LtdFloor No.: 3, DHFLVC Silicon Towers,
Kondapur, Hyderabad - 500 084Andhra Pradesh, India.