Embed Size (px)
Citation preview

PEER-REVIEWED ARTICLE bioresources.com
Van Dyk et al. (2013). “Modeling dual fiber composites,” BioResources 8(3), 3672-3684. 3672
Modeling of the Mechanical Properties of a Wood-Fiber/Bicomponent-Fiber Composite
Herman van Dyk, Perry Peralta,* and Ilona Peszlen
An engineered composite that combines a wood fiber core, a bicomponent fiber face, and a bicomponent fiber back was evaluated for its elastic response using laminate theory. Using the properties of the individual laminae as input variables, the laminate’s elastic modulus, axial strain, and lateral strain were determined by means of the model, and compared with values determined experimentally. The model yielded an axial elastic modulus of 950 MPa, which did not differ substantially from the measured value of 920 MPa. Statistical analyses showed that the measured and calculated strains were not significantly different in either the axial or lateral directions. The model underpredicted the strains along the fiber direction of the bicomponent fiber sheets by approximately 4%. A greater difference (12%) between predicted and measured values was observed in the lateral direction.
Keywords: Bicomponent fiber; Fiberboard; Needlepunching; Composite; Laminate; Elastic modulus;
Shear modulus; Poisson’s ratio
Contact information: Department of Forest Biomaterials, North Carolina State University, Campus Box
8005, Raleigh, NC 27695 USA; *Corresponding author: [email protected]
INTRODUCTION
A composite in the engineering sense is any material that has been physically
assembled from two or more materials to form one single bulk, but the resulting product
would still have identifiable and distinct constituents within its structure. Composites are
engineered to take advantage of the characteristics of each of the materials.
Usually, composite materials will consist of two separate components, the matrix
and the filler. The matrix is the component that holds the filler together. It usually
consists of various epoxy-type polymers, but other materials may be used. Metal matrix
and thermoplastic matrix composites are some of the possibilities. The filler is the
material that has been imbedded into the matrix to lend its advantage (usually strength) to
the composite.
Composite materials have been widely utilized in the field of civil engineering,
both in new constructions as well as in the reinforcement of existing concrete structures
(Corradi et al. 2006). Most recently, these composites have also become popular in the
forest products industry. Carbon and glass fiber reinforcement, in conjunction with an
epoxy matrix, have been used for the reinforcement of wood and glulam beams
(Triantafillou 1997; Triantafillou and Plevris 1991; Gentile et al. 2000). These types of
reinforcement, called fiber-reinforced polymers (FRPs), are characterized by excellent
mechanical properties, but the cost of both the fiber and the resin material can be
prohibitive. Incompatible thickness swell characteristics also cause problems with regard
to delamination (Lopez-Anido et al. 2005; Prian and Barkatt 1999).

PEER-REVIEWED ARTICLE bioresources.com
Van Dyk et al. (2013). “Modeling dual fiber composites,” BioResources 8(3), 3672-3684. 3673
There is currently no feasible method for efficiently reinforcing wood fiber
products other than extruding the wood fiber with a polymer to form a wood plastic
composite. Bicomponent fiber sheets offer the potential of reinforcing a wood fiber
composite. Bicomponent fibers consist of at least two components, running parallel in the
fiber throughout the length (Hutten 2007). Each of the components of the fiber retains its
own characteristic properties. With sheath-core bicomponent fibers, the core component
is completely surrounded by the sheath component. The sheath component has areas of
interaction with the core and the surrounding medium. Commonly, the sheath polymer
has a lower melting temperature than the core. During heating, the sheath will melt and
diffuse through the surrounding fibers, acting as a binder (Bosak et al. 2005). Earlier
work described one method of reinforcing a wood fiber panel by using
polypropylene/polyester bicomponent fiber sheets in conjunction with needlepunching to
form a sandwich laminate composite panel (van Dyk et al. 2009). The panel in question
was manufactured by needlepunching a 1495 g/m2 wood fiber web placed in between
bicomponent fiber sheets. The panels were punched from both sides and then hot pressed
for 3 min at 177 °C at a minimum pressure of 68 MPa. In order to fully understand the
mechanical behavior of these panels, the elastic response of each of the laminae needs to
be investigated, along with the response of the laminate.
This study will present a method for quantifying the engineering constants of the
wood/bicomponent fiber composite developed by van Dyk et al. (2009), as well as the
constants of each of the composite’s constituent laminae. Furthermore, modeling of the
behavior of the laminate formed with the different materials in question will be discussed.
Model to Predict Elastic Constants of a Lamina If thickness strain is ignored, Hooke’s law for plane stress in the 1,2–plane for
orthotropic material may be written in terms of engineering constants as follows (Daniel
and Ishai 2006):
12
1 11
212
2 2
12
12
1
2
12
10
10
10 0
E E
E E
G
(1)
where σ1 and σ2 represent the axial stresses; τ12 is the shear stress; ε1 and ε2 are the axial
strains; γ12 is the shear strain; ν12 and ν21 are the Poisson’s ratios; E1 and E2 are the moduli
of elasticity; and G12 is the shear modulus. It can be seen that four independent elastic
constants are needed to characterize the material. The bicomponent layer of the laminate
will be considered as an orthotropic material subjected to plane stresses. Based on the
techniques used during the forming of the laminate panels, and data obtained for
thickness swell studies, it was decided that the wood fiber core of the wood–bicomponent
laminate panels was isotropic, and it was treated as such in the model. An isotropic
material has three material constants (E, ν, and G), two of which are independent.

PEER-REVIEWED ARTICLE bioresources.com
Van Dyk et al. (2013). “Modeling dual fiber composites,” BioResources 8(3), 3672-3684. 3674
Macromechanical Model to Determine Elastic Behavior of a Laminate The stresses in the different layers of a laminate can be expressed in terms of the
laminate mid-plane strains and curvatures as follows (Daniel and Ishai 2006):
11 12 16
12 22 26
16 26 66
o o
x xx
o o
y y y
o oxy xy xy
Q Q Q z
Q Q Q z
Q Q Q z
(2)
where,
extensional strain of the reference surface (midplane) in the x direction
extensional strain of the reference surface (midplane) in the y direction
inplane shear strain of the reference sur
o
x
o
y
o
xy face (midplane)
distance of a point from the midplane
curvature of the reference surface (midplane) in the x direction
curvature of the reference surface (midplane) in the y direction
twist
o
x
o
y
o
xy
z
ing curvature of the reference surface (midplane)
transformed reduced stiffness matrix Q
Equation 2 shows that the stresses vary linearly only through the thickness of each
lamina. The stresses may change in magnitude from lamina to lamina because the
transformed reduced stiffness matrix is dependent on the material and orientation of the
ply. The stresses can be integrated in the thickness direction to yield the force resultants
(N) and the moment resultants (M):
1
/ 2
1/ 2
z
k
x x xzh n
y y y
kh z
xy xy xy
N
N dz dz
N
(3)
1
/ 2
1/ 2
z
k
x x xzh n
y y y
kh z
xy xy xy
M
M z dz z dz
M
(4)
where,

PEER-REVIEWED ARTICLE bioresources.com
Van Dyk et al. (2013). “Modeling dual fiber composites,” BioResources 8(3), 3672-3684. 3675
=1
0
number of layers
index for the ply number
thickness of each ply (where =1 to )
thickness of the laminate
z coordinate of each ply (where =0 to )
Layer 1 is bounded by
k
n
k
k
i
n
k
h k n
h h
z i n
z
1
-1
-1
and
Layer is bounded by and
Layer n is bounded by and
force per unit width of the laminate cross section
moment per unit width of the laminate cross section
k k
n n
z
k z z
z z
N
M
Equations (2), (3), and (4) may be combined and then manipulated to give a single
equation for calculating the strains and curvatures at the reference surface in terms of the
force and moment resultants:
1
11 12 16 11 12 16
12 22 26 12 22 26
16 26 66 16 26 66
11 12 16 11 12 16
12 22 26 12 22 26
16 26 66 16 26 66
o
x x
o
y y
o
xy xy
oxx
oyy
oxy
xy
NA A A B B B
NA A A B B B
NA A A B B B
B B B D D D M
B B B D D D M
B B B D D D M
(5)
where,
1
1
2 2
1
1
3 3
1
1
1
2
1
3
n
ij k kij
k k
n
ij k kij
k k
n
ij k kij
k k
A Q z z
B Q z z
D Q z z
The [A] matrix, called the extensional stiffness matrix, relates the resultant in-plane
forces to the in-plane strains. The [D] matrix, called the bending stiffness matrix, relates
the resultant bending moments to the plate curvatures. The [B] matrix, called the
bending-extension coupling stiffness matrix, couples the force and moment terms to the
mid-plane curvatures and mid-plane strains. The 6 × 6 matrix consisting of the
components of [A], [B], and [D] is called the laminate stiffness matrix or the ABD matrix.

PEER-REVIEWED ARTICLE bioresources.com
Van Dyk et al. (2013). “Modeling dual fiber composites,” BioResources 8(3), 3672-3684. 3676
EXPERIMENTAL
One method for measuring the elastic constants and the shear modulus needed for
the model described in the previous section involves the use of two tensile test
specimens, one with the primary material axis oriented along the longitudinal axis of a
specimen and the second with the primary material axis oriented at 10 degrees to the
longitudinal axis of the specimen (Chamis and Sinclair 1977). A T-rosette is installed on
the on-axis specimen to measure the Poisson’s ratio, while a three-element rectangular
rosette is installed on the off- axis specimen (Fig. 1).
Fig. 1. Layout of the T-rosette (1a) and rectangular rosette (1b) strain gauge in the on-axis and 10-degree off-axis test specimens, respectively. P denotes the applied force. A, B, and C indicate the x, y, and 45° gages found on the rosettes, respectively.
The following describes strain gauge application techniques. Samples were
prepared for the application of the strain gauge by lightly scuffing the surfaces with a
high-grade sand paper. A placement grid was measured out on opposite faces to align the
gauges. The gauges were placed face up in the center of a 25 mm by approximately 75
mm piece of clear adhesive tape to assist and maintain gauge alignment during gluing.
Gauges were then held in place on the sample with the correct alignment by means of the
tape, and partially lifted off prior to gluing leaving 35 mm of the tape in contact with the
sample. An epoxy adhesive was prepared (Vishay M-Bond AE-10) in accordance with
the supplier’s specifications, and applied lightly to the surface of the gauge and the
sample with a glass applicator. The adhesive tape was gently rolled down from the still-
attached end by means of the applicator, squeezing out any excess resin. If done
correctly, the gauge alignment is maintained through the entire process. A 25 mm by 25
mm silicon rubber pad was then placed on the gauge to evenly distribute the pressure,
followed by a 25 mm by 25 mm block of wood. An 11-kg weight was placed on top of
the entire assembly. The resin was left to dry overnight.
The Poisson’s ratio, υ12, can be calculated as follows from the strain
measurements made with the T-rosette on the on-axis specimen:
12B
A
(6)

PEER-REVIEWED ARTICLE bioresources.com
Van Dyk et al. (2013). “Modeling dual fiber composites,” BioResources 8(3), 3672-3684. 3677
where εA is the normal strain along the principal material axis which has the highest
elastic modulus and εB is the strain along the material axis with the lowest elastic
modulus. The remaining calculations are based on υ12 and the strain measurements
obtained from the off-axis tensile test.
The strain gauge data obtained with the rectangular rosette shown in Fig. 1 can be
used to calculate the shear strain, γxy, as:
2 2
45 cos 45 sin 45
sin 45cos 45
x y
xy
(7)
where εx = εA, εy = εB, and ε45 = εC. Using standard strain transformations, the normal
strains in the principal material axis (ε1 and ε2) and the shear strain (γ12) can be calculated
with:
2 2
1 cos sin sin cosx y xy (8)
2 2
2 sin cos sin cosx y xy (9)
2 2
12 2 sin cos 2 sin cos cos sinx y xy (10)
where α is the counterclockwise rotation from the geometric axis to the material axis.
The normal stresses and shear stress for the principal material axis can be
calculated with:
2
1
cosP
bt
(11)
2
2
sinP
bt
(12)
12
sin cosP
bt
(13)
where P is the applied load, b is the specimen width, and t is the specimen thickness.
The elastic moduli, the shear modulus, and the remaining Poisson’s ratio can then
be calculated from:
1 12 21
1
( )E
(14)
1 22
1 2 1 12
EE
E
(15)
221 12
1
E
E (16)
1212
12
G
(17)
PEER-REVIEWED ARTICLE bioresources.com
Van Dyk et al. (2013). “Modeling dual fiber composites,” BioResources 8(3), 3672-3684. 3678
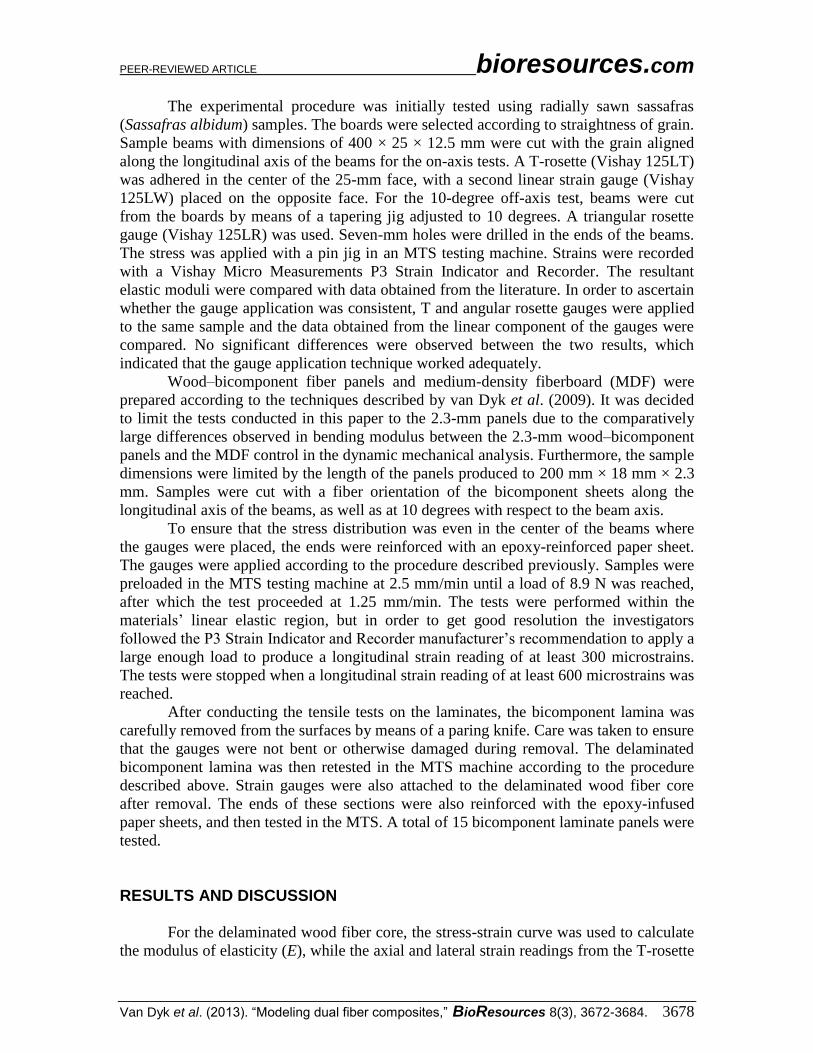
The experimental procedure was initially tested using radially sawn sassafras
(Sassafras albidum) samples. The boards were selected according to straightness of grain.
Sample beams with dimensions of 400 × 25 × 12.5 mm were cut with the grain aligned
along the longitudinal axis of the beams for the on-axis tests. A T-rosette (Vishay 125LT)
was adhered in the center of the 25-mm face, with a second linear strain gauge (Vishay
125LW) placed on the opposite face. For the 10-degree off-axis test, beams were cut
from the boards by means of a tapering jig adjusted to 10 degrees. A triangular rosette
gauge (Vishay 125LR) was used. Seven-mm holes were drilled in the ends of the beams.
The stress was applied with a pin jig in an MTS testing machine. Strains were recorded
with a Vishay Micro Measurements P3 Strain Indicator and Recorder. The resultant
elastic moduli were compared with data obtained from the literature. In order to ascertain
whether the gauge application was consistent, T and angular rosette gauges were applied
to the same sample and the data obtained from the linear component of the gauges were
compared. No significant differences were observed between the two results, which
indicated that the gauge application technique worked adequately.
Wood–bicomponent fiber panels and medium-density fiberboard (MDF) were
prepared according to the techniques described by van Dyk et al. (2009). It was decided
to limit the tests conducted in this paper to the 2.3-mm panels due to the comparatively
large differences observed in bending modulus between the 2.3-mm wood–bicomponent
panels and the MDF control in the dynamic mechanical analysis. Furthermore, the sample
dimensions were limited by the length of the panels produced to 200 mm × 18 mm × 2.3
mm. Samples were cut with a fiber orientation of the bicomponent sheets along the
longitudinal axis of the beams, as well as at 10 degrees with respect to the beam axis.
To ensure that the stress distribution was even in the center of the beams where
the gauges were placed, the ends were reinforced with an epoxy-reinforced paper sheet.
The gauges were applied according to the procedure described previously. Samples were
preloaded in the MTS testing machine at 2.5 mm/min until a load of 8.9 N was reached,
after which the test proceeded at 1.25 mm/min. The tests were performed within the
materials’ linear elastic region, but in order to get good resolution the investigators
followed the P3 Strain Indicator and Recorder manufacturer’s recommendation to apply a
large enough load to produce a longitudinal strain reading of at least 300 microstrains.
The tests were stopped when a longitudinal strain reading of at least 600 microstrains was
reached.
After conducting the tensile tests on the laminates, the bicomponent lamina was
carefully removed from the surfaces by means of a paring knife. Care was taken to ensure
that the gauges were not bent or otherwise damaged during removal. The delaminated
bicomponent lamina was then retested in the MTS machine according to the procedure
described above. Strain gauges were also attached to the delaminated wood fiber core
after removal. The ends of these sections were also reinforced with the epoxy-infused
paper sheets, and then tested in the MTS. A total of 15 bicomponent laminate panels were
tested.
RESULTS AND DISCUSSION
For the delaminated wood fiber core, the stress-strain curve was used to calculate
the modulus of elasticity (E), while the axial and lateral strain readings from the T-rosette

PEER-REVIEWED ARTICLE bioresources.com
Van Dyk et al. (2013). “Modeling dual fiber composites,” BioResources 8(3), 3672-3684. 3679
strain gage were used to determine the Poisson’s ratio (ν). From the E and ν values, the
shear modulus (G) was calculated using the following equation:
2(1 )
EG
(18)
The elastic moduli, Poisson’s ratios, and shear moduli for the delaminated wood
fiber cores are shown in Table 1. The core had a mean modulus of elasticity of 690 MPa
(standard deviation 50 MPa), a mean Poisson’s ratio of 0.29 (standard deviation 0.03),
and a mean shear modulus of 270 MPa (standard deviation 20 MPa). Cai (2006) obtained
values for the modulus of elasticity in tension for an MDF of 2000 MPa. This large
discrepancy between the values obtained during this research and those cited in the
literature can be attributed to the long press times used in this study to ensure that the
bicomponent fiber surface reinforcement had adequate time at high temperature to melt
the polypropylene sheath. Urea formaldehyde resin degrades when it is exposed to high
temperature for long periods of time.
Table 1. Elastic Moduli, Poisson’s Ratios, and Shear Moduli of Delaminated Wood Fiber Core (E, ν, and G) and of Delaminated Bicomponent Sheets (E1, E2, ν 21, and G12) Obtained from Wood–Bicomponent Laminate Panels
Sample No.
Wood Fiber Core Bicomponent Fiber Sheet
E (x10
9 Pa)
ν
G (x10
9 Pa)
E1 (x10
9 Pa)
E2 (x10
9 Pa)
ν12
G12 (x10
9 Pa)
1 0.68 0.29 0.26 2.06 0.48 0.28 0.71
2 0.73 0.26 0.29
4 0.70 0.21 0.29 2.24 0.64 0.28 0.85
5 0.60 0.28 0.24 2.38 0.72 0.29 0.53
6 0.66 0.30 0.25 2.05 0.34 0.28 0.63
7 0.73 0.30 0.28 2.20 0.35 0.32 0.70
8 0.73 0.33 0.27 2.21 0.53 0.28 0.87
9 0.66 0.29 0.25 2.10 0.42 0.28 0.82
10 0.68 0.30 0.26 2.27 0.58 0.30 0.84
11 0.70 0.30 0.27 2.17 0.49 0.28 0.68
12 0.78 0.29 0.30 2.05 0.38 0.30 0.77
14 0.69 0.29 0.27 2.20 0.42 0.28 0.77
15 0.63 0.30 0.24 2.38 0.72 0.29 0.53
Mean 0.69 0.29 0.27 2.19 0.51 0.29 0.73
St. Dev. 0.05 0.03 0.02 0.12 0.13 0.01 0.12
For the delaminated bicomponent fiber sheets, the Poisson’s ratios (ν12) were
obtained from on-axis tensile tests; while the elastic moduli in the fiber direction (E1),
elastic moduli in the lateral direction (E2), and the shear moduli (G12) were obtained from
the data produced by the off-axis tensile tests. Three samples were rejected after
completion of the experiments. Bicosheet2 was rejected because the load cell reading
from the testing machine did not register in the data acquisition system, Bicosheet3 was
rejected after issues were observed with the strain gage adhesion to the wood fiber core,
and Bicosheet13 was rejected due to one of the lead wires detaching during the testing
procedure. A mean E1 of 2200 MPa (standard deviation 120 MPa) and E2 of 510 MPa
(standard deviation 130 MPa) were observed. G12 and ν12 were 730 MPa (standard
deviation 120 MPa) and 0.29 (standard deviation 0.01), respectively (Table 1).

PEER-REVIEWED ARTICLE bioresources.com
Van Dyk et al. (2013). “Modeling dual fiber composites,” BioResources 8(3), 3672-3684. 3680
The values listed in Table 1 for the delaminated bicomponent sheets and the
corresponding values for the wood fiber core were used as inputs in the model described
earlier for the whole laminate (Equation 5). By multiplying the inverse of the ABD matrix
with the applied stress, the resultant strain at that stress level can be determined for the
wood–bicomponent panels. These values were compared with the measured strain values
obtained from on-axis tensile tests of the wood–bicomponent panels. In order to control
for the time-dependent effect on the elastic properties of the material, it was decided to
use stress and strain values taken at least 2 min after sample loading commenced in the
MTS. Table 2 lists the experimentally measured ε1 and ε2, as well as values calculated
from the model.
Table 2. Comparison of the Strains Measured During On-Axis Tensile Tests with the Calculated Strains for Each of the Wood–Bicomponent Panels Tested
Sample Measured ε1 (x 10−
4)
Calculated ε1 (x 10−−
4)
Measured ε2 (x 10−
4)
Calculated ε2 (x 10−
4)
% Deviation between Measured and
Modeled Strains
ε1 ε2
bicopanel1 3.33 3.37 −0.96 −0.97 −1.1 −1.2
bicopanel2 3.35 3.21 −0.97 −0.84 4.3 13.0
bicopanel4 3.44 3.20 −1.02 −0.87 7.0 15.0
bicopanel5 3.33 3.02 −0.90 −0.83 9.3 8.3
bicopanel6 3.35 3.34 −0.99 −0.90 0.4 8.9
bicopanel8 3.35 3.19 −1.13 −0.87 4.7 23.4
bicopanel9 3.16 3.10 −0.98 −0.90 1.9 8.6
bicopanel10 3.33 3.52 −0.97 −1.06 −5.8 −8.9
bicopanel12 3.33 3.19 −1.08 −0.95 4.1 12.1
bicopanel14 3.37 3.30 −1.31 −1.01 2.0 22.7
bicopanel15 3.35 3.12 −1.01 −0.91 6.8 10.5
Mean 3.32 3.22 −1.03 −0.91 4.3 12.0
St. dev. 0.06 0.14 0.11 0.07 2.8 6.5
T-tests conducted to compare the means of the measured and calculated strains for
the 1 and 2 directions showed no significant difference, indicating that the model
previously discussed fit the experimental values well. It can be seen from Table 2 that the
model underpredicts the strain in the bicomponent fiber direction by 4.3%. The model
overpredicts the strains for bicopanel1 and bicopanel10. The underprediction can be
attributed to interactions caused by the fibers passing through the thickness direction as a
result of needlepunching not incorporated by the model.
In the direction lateral to the main orientation of the bicomponent fibers, a mean
microstrain of −91 (standard deviation 7) was predicted by the model, while the measured
microstrain was −103 (standard deviation 11). The model underpredicted the strain in the
y-direction by 12.0% (standard deviation 6.5). The large deviation can be attributed to
Bicopanel8 and Bicopanel14, both of which showed deviations from the measured values
of greater than 20%. As was the case for the longitudinal strain, the model overpredicted
the strains for Bicopanel1 and Bicopanel10.
The data in Table 1 were also used to calculate the effective elastic constants of
the laminate. The model yielded a calculated elastic modulus of 950 MPa, which did not
differ substantially from the measured value of 920 MPa. These results highlight the

PEER-REVIEWED ARTICLE bioresources.com
Van Dyk et al. (2013). “Modeling dual fiber composites,” BioResources 8(3), 3672-3684. 3681
benefit of incorporating a stiffer material in a laminate. Since the mean modulus of
elasticity of the bicomponent fiber sheet along the fiber direction is almost three times the
modulus of elasticity of the isotropic wood fiber core, it is to be expected that a
bicomponent fiber sheet can serve as a reinforcing layer to a wood fiberboard. The
calculated laminate property of 950 MPa represents a 38% improvement in the
longitudinal elastic modulus over a fiberboard panel, even though the thickness of each of
the bicomponent fiber sheets was only 9% of the panel thickness. Modeling of the effect
of the bicomponent fiber sheet shows that increasing the thickness of each of the
reinforcement layers further to 20% or 30% of the panel thickness will, respectively,
result in 87% or 131% improvement in the composite panel modulus over a fiberboard
panel. The Poisson’s ratio of the bicomponent fiber sheet is about the same as the
Poisson’s ratio of the wood fiber core, thus the measured ratio of the laminate (ν12 = 0.30)
was close to the value predicted by the model (ν12 = 0.29).
To further investigate the effects of the various parameters on the results obtained
from the model, sensitivity analyses were conducted. Parameters investigated were the
bicomponent fiber sheet moduli (E1 and E2), the wood fiber core modulus (E), and the
wood fiber core Poisson’s ratio (ν). The mean values obtained for each of the parameters
were used as initial inputs in the model to calculate the longitudinal and lateral strains (ε1
and ε2). The parameters were then adapted according to the standard deviation approach
employed by Skaggs and Bender (1995), who changed the input values by 2 standard
deviation increments up to 6 standard deviations from the mean. The values calculated
using this approach were then expressed as a percentage deviation from the values
calculated using the mean inputs.
Figure 2 illustrates the variation from the mean when the parameter E1, the
longitudinal elastic modulus of the reinforcement, is changed. It can be seen that
increasing the longitudinal stiffness by 2 standard deviations from the mean results in a
4% reduction in the calculated ε1 and ε2. The reduction is expected, seeing that an
increase in elasticity will result in lower strains, if the stress is kept constant. The inverse
occurs when the modulus is decreased by 2 standard deviations. When taken into account
with the fact that model-calculated strains deviated from the measured strains by 4.3%,
the importance of correctly identifying E1 becomes apparent.
-15
-10
-5
0
5
10
15
20
1.0E+09 1.5E+09 2.0E+09 2.5E+09 3.0E+09
Stra
in, d
evia
tio
n f
rom
me
an v
alu
e (
%)
Longitudinal elastic modulus (Pa)
Longitudinal strain
Lateral strain
Fig. 2. Strains calculated with the macromechanical model by varying the mean longitudinal elasticity of the bicomponent fiber (E1) by 2 standard deviation increments, expressed as a percentage of the values obtained using the mean elasticity

PEER-REVIEWED ARTICLE bioresources.com
Van Dyk et al. (2013). “Modeling dual fiber composites,” BioResources 8(3), 3672-3684. 3682
A ±6 standard deviation change in lateral stiffness E2 of the bicomponent fiber
sheets resulted in less than 0.05% change in the panel’s longitudinal and lateral strains.
The low sensitivity of the strains to variations in this input variable can be attributed to
the closeness in the value of the mean E2 of the bicomponent fiber sheet to the mean E of
the wood fiber core, coupled with the low standard deviation of E2.
As expected, an increase in the Poisson’s ratio of the wood fiber core had a
negligible effect on ε1. It had, however, a strong effect on lateral strain ε2. Increasing the
Poisson’s ratio of the wood fiber core even by just 2 standard deviations resulted in a
17% increase in panel lateral strain. A 6 standard deviation increase resulted in a
whopping 51% increase in lateral strain. The effect of the elastic modulus E of the wood
fiber core on calculated strains was less dramatic than that of the Poisson’s ratio on ε2 but
nonetheless was significant. A 2 standard deviation decrease in E resulted in a 9%
increase in ε1 and ε2; a 6 standard deviation decrease in E resulted in a 32% increase in ε1
and ε2. As expected, the model is highly sensitive to the properties of the wood fiber core,
due to the fact that the core accounts for approximately 80% of the volume of the
material. These results show that care needs to be taken in obtaining the properties of the
core material when attempting to determine the tensile properties of the laminate.
To investigate the effect of needlepunching on the tensile properties of the
material, an on-axis tensile test was conducted on a non-needlepunched wood fiberboard
that was reinforced with bicomponent fiber sheets. The sample was prepared by
thermally bonding the bicomponent fiber sheets to the surfaces of the wood fiberboard.
Tensile tests were conducted as described previously. The modulus of elasticity of the
non-needlepunched wood–bicomponent panel was 890 MPa. The mean modulus of
elasticity obtained from on-axis tensile tests conducted on the needlepunched wood–
bicomponent panels was found to be 920 MPa. The E of the non-needlepunched wood–
bicomponent fiberboard was therefore slightly more than 1 standard deviation lower than
that of the needlepunched wood–bicomponent panels. It is worth noting that the wood
fiber core used for this particular experiment had an elastic modulus of 615 MPa, which
is about 75 MPa less than the mean modulus of the needlepunched wood fiber core.
Further experiments were also conducted to verify the effectiveness of the model
by adjusting the thickness of the bicomponent fiber reinforcement. These tests were
conducted on non-needlepunched wood–bicomponent fiber panels. The panels were
made with bicomponent fiber sheet thicknesses of 0.1, 0.2, 0.3, and 0.4 mm, after which
they were prepared and tested by means of on-axis tensile tests. The measured strains
were then compared with the calculated strains (Table 3). The means of the elastic
constants for the bicomponent fiber sheets shown in Table 1 were used as inputs, while
the constants for the non-needlepunched cores were obtained from on-axis tensile tests. It
can be seen from the calculated strain values that the model is able to account for changes
in the thickness of the reinforcement, with an increase in thickness resulting in a decrease
in strain as the effective stiffness of the composite rises.

PEER-REVIEWED ARTICLE bioresources.com
Van Dyk et al. (2013). “Modeling dual fiber composites,” BioResources 8(3), 3672-3684. 3683
Table 3. Measured and Calculated Strains of Non-Needlepunched Wood–Bicomponent Fiber Panels with a Change in Thickness of the Bicomponent Fiber Reinforcement
Thickness of Reinforcement
(mm)
Stress (Pa)
Measured ε1 (x 10−
4)
Calculated ε1 (x 10−
4)
Measured ε2 (x 10−
4)
Calculated ε2 (x 10−
4)
% Deviation between
Measured and Modeled Strains
ε1 ε2
0.1 303590 3.8 4.1 −0.99 −1.2 6.19 15.1
0.2 305280 3.6 3.2 −0.89 −0.93 −11.1 4.51
0.3 303900 3.1 2.7 −0.71 −0.78 −14.9 8.56
0.4 307340 2.6 2.3 −0.54 −0.66 −12.5 18.8 CONCLUSIONS
1. A model for predicting the mechanical properties of a composite panel, which
contains wood fiber in the core and a bicomponent fiber sheet used as surface
reinforcement, was discussed. This model was successfully validated by means of
experimental data obtained from tensile tests.
2. Sensitivity analyses were conducted to determine which parameters had the greatest
effect on strains calculated by means of the model. It was found that lateral strains are
especially sensitive to changes in lateral stiffness of the bicomponent fiber
reinforcement, as well as the Poisson's ratio of the wood fiber core.
3. The model proved to be sensitive to changes in the thickness of the reinforcement,
and the ability of the model to predict strains at different reinforcement thicknesses
was experimentally verified.
REFERENCES CITED
Bosak, D. R., Ogale, A. A., and van Dun, J. (2005). “Bicomponent fibers derived from
immiscible polymer blends,” Textile Research Journal 75(1), 50-56.
Cai, Z. (2006). “Selected properties of MDF and flakeboard overlaid with fiberglass
mats,” Forest Products Journal 56(11/12), 142-146.
Chamis, C. C., and Sinclair, J. H. (1977). “10-deg off-axis test for shear properties in
fiber composites,” Experimental Mechanics 17(9), 339-346.
Corradi, M., Speranzini, E., Borri, A., and Vignoli, A. (2006). “In-plane shear
reinforcement of wood beam floors with FRP,” Composites Part B: Engineering
37(4-5), 310-319.
Daniel, I. M., and Ishai, O. (2006). Engineering Mechanics of Composite Materials, 2nd
edition, Oxford University Press, New York.
Gentile, C., Svecova, D., Saltzberg, W., and Rizkalla, S. H. (2000). “Flexural
strengthening of timber beams using GFRP,” Proceedings, Third International
Conference on Advanced Composite Materials in Bridge and Structures; Ottawa,
Canada; August 15-18, 2000.

PEER-REVIEWED ARTICLE bioresources.com
Van Dyk et al. (2013). “Modeling dual fiber composites,” BioResources 8(3), 3672-3684. 3684
Hutten, I. M. (2007). Handbook of Non-Woven Filter Media, Elsevier Science &
Technology, Oxford, UK.
Lopez-Anido, R. A., Muszynski, L., Gardner, D. J., Goodell, B., and Herzog, B. (2005).
“Performance-based material evaluation of fiber-reinforced polymer-wood interfaces
in reinforced glulam members,” Journal of Testing and Evaluation 33(6), 385-394.
Prian, L., and Barkatt, A. (1999). “Degradation mechanism of fiber-reinforced plastics
and its implications to prediction of long-term behavior,” Journal of Materials
Science 34(16), 3977-3989.
Skaggs, T. D., and Bender, D. A. (1995). “Shear deflection of composite beams,” Wood
and Fiber Science 27(3), 327-338.
Triantafillou, T. C. (1997). “Shear reinforcement of wood using FRP materials,” Journal
of Materials in Civil Engineering 9(2), 65-69.
Triantafillou, T. C., and Plevris, N. (1991) “Post-strengthening of R/C beams with epoxy
bonded fiber composite materials,” Proceedings, ASCE Specialty Conference on
Advanced Composites Materials in Civil Engineering Structures, pp. 245-256.
van Dyk, H., Peralta, P., Peszlen, I., and Banks-Lee, P. (2009). “An innovative wood-
fiber composite incorporating nonwoven textile technologies,” Forest Products
Journal 59(11/12), 11-17.
Article submitted: October 31, 2012; Peer review completed: February 10, 2013; Revised
version accepted: May 23, 2013; Published: May 23, 2013.