Embed Size (px)
Citation preview

PEER-REVIEWED ARTICLE bioresources.com
Giacomozzi et al. (2019). “Porosity change,” BioResources 14(2), 2827-2841. 2827
The Processing of Pinus radiata: Pore Size Distribution Changes in the Cell Wall Structure Studied by Pressure Plate Technique and Mercury Intrusion Porosimetry
Dante Giacomozzi,a Olli Joutsimo,a and Samuel L. Zelinka b
The pore size distribution of cell walls in softwood pulps was studied using the pressure plate technique and mercury intrusion porosimetry, which together make it possible to cover the range from 101 to 106 nm in pore sizes (mesopores and macropores). The differences in pore size distribution between never-dried pulp from a fiber line, industrially-dried pulp, and laboratory-dried pulps were evaluated. The results showed an increase in the relative pore volume (100 to 2,000 nm) between industrial washing and bleaching stages. Also, mercury porosimetry showed a broadening of the pore size distribution of cell walls after industrial drying. Results showed that, besides the changes in micropore and mesopore size distributions, the macropore range is also affected by processing and drying.
Keywords: Cell wall; Pore size distribution; Mercury intrusion; Pressure plate
Contact information: a: Bioforest S. A., Coronel, Región del Bio-Bio, Chile; b: Forest Products Laboratory,
Forest Service, United States Department of Agriculture, USA;
* Corresponding author: [email protected]
INTRODUCTION
During kraft processing, the main components of wood (lignin, cellulose,
hemicelluloses, and extractives) are subjected to dissolution and removal to different
extents. These chemical changes are accompanied by physical changes such as the
development of an inner porous structure in the cell wall (Stone and Scallan 1965, 1968;
Allan et al. 1991; Andreasson et al. 2003). This porous structure evolves during processing
and modifies properties, e.g., the surface and bulk charges, fiber shape, conformability,
strength, swelling behavior, water holding ability, and others (de Ruvo and Htun 1983;
Andreasson et al. 2003). Additional changes in the pore structure and properties of the
pulps are observed during drying and rewetting cycles, which are integrated in the
hornification concept (Jayme 1944). Available techniques to measure changes in porosity
of the cell wall are: nitrogen adsorption (Stone and Scallan 1965), mercury porosimetry
(MIP) (Moura et al. 2005; Giesche 2006; Yamauchi 2007), solute exclusion (Stone and
Scallan 1968; Lin et al. 1987; Allan 1991), proton nuclear magnetic resonance (H-NMR)
(Li 1993), differential scanning calorimetry (Maloney and Paulapuro 1998; Park et al.
2006), atomic force microscopy AFM (Fahlén and Salmén 2005), scanning electron
microscopy SEM (Lovikka et al. 2016), and transmission electron microscopy (TEM),
among others.
Hill and Papadopoulos (2001) reviewed various methods to measure the porosity
of the cell wall. Each technique has a fixed range of pore sizes that can be measured, and
each method has specimen preparation limitations. For example, size exclusion

PEER-REVIEWED ARTICLE bioresources.com
Giacomozzi et al. (2019). “Porosity change,” BioResources 14(2), 2827-2841. 2828
chromatography measures pores in the range of approximately 0.8 nm to 13 nm (Lin et al.
1987; Berthold and Salmén 1997), while H-NMR measures pores in the range of 0 nm to
30 nm (Li and Henriksson 1993; Andreasson et al. 2005). The ranges for nitrogen
adsorption technique varies between authors from 1 to 50 nm (Anovitz and Cole 2015), 1
to 300 nm (Westermarck 2000), and even <400 nm (Kimura et al. 2014, 2016). In
comparison, X-ray methods are limited to determining the volume of pores that are no more
than 300 Å (30 nm) in radius. A summary of available methods and the ranges in pore
diameter are presented in Fig. 1.
Fig. 1. Techniques to measure porosity and pore size distribution and typical ranges
One of the main questions regarding porosity changes of the pulp fibers is related
to how the macropores behave during processing and drying (presence, absence, creation
or loss of larger pores). According to Anovitz and Cole (2015), useful techniques to
measure porosity in a wide range (including macropores up to 100 µm), are mercury
intrusion porosimetry (MIP), mercury picnometry and water immersion porosimetry,
optical microscopy, SEM, and AFM (to a slightly lower pore sizes compared to SEM).
In MIP, the relative pore volume is determined by the mercury volume imbibed by
a dry pulp sample at a given pressure. The main advantages of MIP are related to the
possibility of measuring a wide range of pore sizes, between 3.5 nm and 500 µm (Giesche
2006). Also, it provides information about the pore size distribution, total pore volume, and
specific surface area of a sample. The main drawback of this technique is related to the
assumption of cylindrical geometry of the pores, which requires a careful analysis of the
results (Moura 2005). Along the same lines, sample compressibility, assumption of
interconnected pores and inability of identifying narrow necked voids must also be
considered and overcome by correction procedures (Chinga 2002).
The pressure plate technique is used to measure the pore size distribution over a
similar range of pore sizes as MIP but it requires water-saturated samples. Samples are
Optical Microscopy
SEM
AFM
Mercury Porosimetry
N2 Ads. BET
Pressure Plate
<2 nm 2 - 50 nm > 50 nm
MacroporesMesoporesMicropores
H-NMR
TEM
10 nm 0.1 m 1 m 10 m 100 m 1000 m1 nm

PEER-REVIEWED ARTICLE bioresources.com
Giacomozzi et al. (2019). “Porosity change,” BioResources 14(2), 2827-2841. 2829
subjected to increasing pressures until an equilibrium condition is reached (Stone and
Scallan 1967).
Scanning electron microscopy (SEM) offers high resolution, magnification power,
and image quality. When SEM is used in combination with image analysis techniques, it
can be used to study fibres dimensions, porosity, paper morphology, and coating layer
structure details (Chinga 2002). SEM is useful in covering a size range from mesopores to
macropores (Anovitz and Cole 2015; Lovikka et al. 2016),
While these techniques measure over a similar range of pore sizes, the MIP
technique utilizes dry samples whereas the pressure plate technique measures from the
saturated state. Furthermore, by extending the moisture retention curve using the water
vapor sorption isotherm in the hygroscopic region, it is possible to extend the projections
of the pore size distribution to nanopores (Roels et al. 2001; Carmeliet and Roels 2002;
Zillig 2009). Therefore, the pore size distribution of industrial and laboratory pulps was
studied using a combination of the pressure plate technique, MIP, and desorption
isotherms.
EXPERIMENTAL
Materials The pore size distribution studies were conducted with 10 Pinus radiata pulp
samples from industrial and laboratory sources (Table 1).
Table 1. Mill and Laboratory Never Dried and Dried Pulp Samples
Sample Sample Description Source Condition
S0 Brown pulp from industrial chips Laboratory Never dried
S1 Bleached pulp from industrial chips Laboratory Never dried
S2 Digester pulp – Blow line Mill Never dried
S3 Pulp from atmospheric diffuser (discharge) Mill Never dried
S4 Discharge from washing area (pre O2 press) Mill Never dried
S5 Discharge from post O2 press Mill Never dried
S6 Bleached pulp – Machine chest Mill Never dried
S7 Industrially-dried (pulp sheets) Mill Dried
S8 Lab-dried (from S6) – Air-dried to 92% dryness Mill/Laboratory Dried
S9 Lab-dried (from S6) – Oven-dried at 105 °C to
92% dryness Mill/Laboratory Dried
Methods Sampling of the industrial pulp and sample management
The industrial pulp samples (S2 through S7) were obtained during the normal
operation of a softwood mill (Arauco Mill Line 2, Horcones, Arauco, Chile). Each sample
(5 kg oven-dried) was taken from three batches, and they were sampled within a period of
2 h.
The residence times along the fiber line were also considered between samples.
After completion of the three batches, the pulp from each sampling point were thoroughly
mixed and homogenized. The pulp suspensions (S2 through S6) were gently dewatered by

PEER-REVIEWED ARTICLE bioresources.com
Giacomozzi et al. (2019). “Porosity change,” BioResources 14(2), 2827-2841. 2830
hand to avoid mechanical damage and stored at 2 °C before testing. The industrially-dried
pulp sheets (S7) were hand chopped, homogenized, and stored after discarding the edges.
Production of the laboratory pulp
The laboratory pulp was produced with industrial P. radiata chips (200 kg) that
were obtained from the wood yard of the mill where the industrial pulp was sampled. The
chips were homogenized (TAPPI 257 cm-02 (2002)) and screened (SCAN CM 40:01
(2001)) to a separate the accepted fraction that was used for the study. Other screening
fractions were discarded. After homogenization, the dry content of the accepted chips was
measured (SCAN CM 39:94 (1994)), and the sample was later separated into sealed bags
(850 g of dry chips in each) for storage at 4 °C in a cold chamber until cooking.
The chips were cooked in the laboratory using batch digesters (10-L, MK Systems
Inc., Peabody, Massachusetts, USA) equipped with liquor circulation and electrical
heating. White and weak black liquors for cooking were obtained from the mill, specifically
from the causticizing and evaporators area, and characterized via SCAN-N 30:85 (1985)
and SCAN-N 33:94 (1994), respectively. The white liquor alkalinity was 121.4 g/L
effective alkali (as NaOH) and the sulfidity was 27.9%. The liquor to wood ratio was 4:1
and the alkali charge was 21.45% EA (NaOH). The cooking temperature was 170 °C and
the Kappa target was 30 ± 1. After cooking, the pulp was screened (Somerville screen,
Testing Machines Inc, Delaware, USA; according to the TAPPI T275 sp12 (2012)
standard) and gently dewatered by hand. A total of three cooking processes were performed
and the screened pulp was mixed and homogenized to produce a base sample
(approximately 1.2 kg oven-dried). Half of the brown pulp sample was stored for the pore
size distribution analyses (Sample S0) and the other half was oxygen delignified (one stage,
20 kg/ADt NaOH, 10% consistency, target Kappa = 14 ± 1) and bleached (DEDD
sequence, target brightness = 89% ISO) to produce the bleached pulp sample (S1).
Laboratory drying of the industrial pulp
Fractions of sample S6 were dried in the laboratory to produce samples S8 and S9.
Sample S8 was obtained after air-drying at 25 °C (free drying, 92% to 93% final dryness),
and S9 was obtained after oven-drying at 105 °C (free drying, 92% to 93% final dryness).
All of the laboratory samples (S0, S1, S8, and S9) were stored in a cold chamber (2 °C)
until further analysis.
Mercury intrusion porosimetry
The pulps were freeze-dried and stored before the MIP studies. MIP requires dry
samples, and this method was used to preserve as much structure as possible. However,
even freeze-drying may affect the smallest pores (Jin et al. 2004). Freeze-drying was
performed by squeezing the pulp by hand followed by freezing with liquid nitrogen. The
samples were after transferred to a freeze dryer and exposed to a vacuum of 5 μm to 7 μm
Hg (0.6 Pa to 0.9 Pa) for three days. After releasing the vacuum, the samples were stored
in a desiccator over P2O5 until further testing. The mercury filling was measured at 820
different pressures at 28 °C, over a range of 1.4 kPa to 140 MPa. These pressures
corresponded to a pore radius range between 450 μm to 4.5 nm; however, the measurement
of the smallest pores may be affected by the predrying or the high pressures required to
measure them
PEER-REVIEWED ARTICLE bioresources.com
Giacomozzi et al. (2019). “Porosity change,” BioResources 14(2), 2827-2841. 2831
Pressure plate technique
Samples were placed on ceramic plates and treated with 0.01% thimerosal solution
to prevent fungal growth. The plates were placed in a chamber where increasing pressures
were applied, which caused water to leave the pulp through the plate (the applied pressure
was equal in magnitude, but opposite in sign to the capillary pressure). The water was
collected and measured daily. Measurements were conducted at 22 °C until the samples
reached equilibrium (output water was less than or equal to 0.05 mL over 48 h). The pulp
was then oven-dried so that the moisture content (MC; mass of water per mass of dry
material) could be calculated based on Eq. 1,
MC = 𝑚at pressure− 𝑚dry
𝑚dry (1)
where mat pressure is the mass under equilibrium condition (g) and mdry is the mass at the
oven-dry condition (g) as stated in ASTM C1699. Fifteen different pressures were
examined from 0.01 MPa to 1.5 MPa, which corresponded to the pore radius range of
14000 nm (14 μm) to 96 nm.
Sorption isotherms
Sorption isotherms were collected during desorption from a saturated state. Nine
relative humidity (RH) values were examined (from 90% to 10%). The pulp was separated
into small quantities (approximately 10 mg to 20 mg) and treated with a droplet of 0.01%
thimerosal aqueous solution. After that, the pulp was completely saturated with liquid
water prior to the measurements. The samples were first conditioned in a 95% RH
environment by suspending them over a saturated solution of potassium nitrate (KNO3) for
several weeks until they reached equilibrium. The sorption isotherms were collected with
a dynamic vapor sorption analyzer (IGAsorp, Hiden Isochema, Warrington, UK confirm),
which had a microbalance with a sample basket that was suspended in a gas stream where
the RH could be precisely controlled at a constant temperature (25 °C). The mass was
collected as a function of time and the data were extrapolated by kinetic models to
determine the equilibrium moisture content. In these experiments, the RH was held at 90%
for at least 18 h. After the 90% step, the RH was held constant for 5 h at each RH, and the
equilibrium mass was found by fitting the data to the parallel exponential kinetics model.
The specimens were then oven-dried and the moisture content calculated using Eq. 2.
MC = 𝑚at RH− 𝑚dry
𝑚dry (2)
The capillary pressures (RH values between 10% and 90%) ranged between 14 MPa and
320 MPa, which corresponded to a pore radius range of 10 nm to 0.5 nm.
Data Analysis Mercury intrusion porosimetry
The MIP tests show the relative amount of mercury intrusion as a function of the
mercury pressure. For these results, the capillary pressure was calculated from the mercury
pressure with Eq. 3 (Zillig 2009),
𝑃𝑐 = −𝑃𝐻𝑔 ∗ 𝛾water
𝛾Hg cos𝜃Hg (3)

PEER-REVIEWED ARTICLE bioresources.com
Giacomozzi et al. (2019). “Porosity change,” BioResources 14(2), 2827-2841. 2832
where PHg is the mercury pressure (Pa), water is the surface tension of water (0.0715 N/m
at 28 °C), Hg is the surface tension of mercury (0.480 N/m), and Hg is the contact angle
of mercury (commonly taken as 140°). The contact angle of water was assumed to be 180°
(perfectly wetting) following the convention of Zillig (2009).
The volume of mercury intruded was related to the volume of water, and thus the
MC (g of water per g of dry material) was calculated with Eq. 4 (Roels et al. 2001; Zillig
2009),
MC = [𝜑−𝜌bulk (𝑣Hg−𝑣Hg
0 )
𝜌bulk ] ∗ 𝜌H2O (4)
where (Hg - °Hg) represents the specific volume of mercury (m3/kg of dry material)
intruded at that pressure minus the specific volume of mercury intruded at the lowest
pressure, is the total porosity determined from the bulk and skeletal densities, and bulk
is the bulk density (kg/m3). This data was then truncated at a log|pc| of 7.15, which was
equivalent to 90% RH and the first point from the sorption curve. The sorption curve was
then linked with the MIP curve. To make a continuous curve, a constant (equal to the
difference between MIP and sorption isotherm measurements at log|pc| = 7.15) was added
to the MIP data. The data was then normalized by dividing it by the maximum moisture
content. The resultant moisture retention curve gave the degree of moisture saturation for
the capillary pressures of 0.3 kPa to 300 MPa. The pore size distribution was determined
by numerically differentiating the moisture retention curve. To reduce noise in the
derivative, the data was filtered with the method of Savitzky-Golay (1964).
Pressure plate technique
The data results were in the form of moisture content as a function of the capillary
pressure (20 points). The moisture retention curve was fit with a Van Genuchten equation
(Carmeliet and Roels 2002; Roels et al. 2001),
𝑀𝐶 = 𝑀𝐶𝑚𝑎𝑥 ∑ 𝑙𝑖[1 + (𝑎𝑖𝑝𝑐)𝑛𝑖]−𝑚𝑖𝑍𝑖=1 (5)
where Z is the number of pore systems present.
This function is frequently used to describe the moisture retention curve in soils and
other porous materials and can be analytically differentiated to determine the pore size
distribution (Carmeliet and Roels 2002; Roels et al. 2001; Zelinka et al. 2016; Zillig et al.
2006). The Van Genuchten equation treats each pore distribution independently (i.e.
parallel); the pore systems are summed to get the total moisture content at a given capillary
pressure. The data were fit with Z=2 and Z=3. It was found that the data were best fit with
Z=2, implying that there were two independent pore systems in this pressure regime.
RESULTS AND DISCUSSION
In this section, the pore size distribution results are presented and discussed for
mercury intrusion porosity and pressure plate technique. Note that pore size distributions
presented are normalized. This allows for the partitioning of the two pore systems to be
compared across different treatments. Furthermore, the total porosity was not able to be

PEER-REVIEWED ARTICLE bioresources.com
Giacomozzi et al. (2019). “Porosity change,” BioResources 14(2), 2827-2841. 2833
accurately determined in either the MIP or the pressure plate technique, as the sample
volumes of the water saturated pulps are ill-defined.
Mercury Intrusion Porosimetry
The pore size distributions based on the MIP data are presented in Figs. 2 through 5.
Fig. 2. Pore size distribution results for the laboratory pulp from the cooking stage (S0) and after bleaching (S1) based on the MIP data taken on freeze-dried pulps
Fig. 3. Pore size distribution results for the industrial pulp sampled during the process, from digester discharge to bleaching (S2 through S6), based on the MIP data taken on freeze-dried pulps
In Fig. 2, where the laboratory pulp from bleaching (S1) and cooking (S0) are
compared, in the S1 sample the radii of both pore systems was smaller than the pore
systems in S0. This shift was observable in both main peaks. The peak from the largest

PEER-REVIEWED ARTICLE bioresources.com
Giacomozzi et al. (2019). “Porosity change,” BioResources 14(2), 2827-2841. 2834
pore system decreased from 30 µm to 20 µm, and the smaller pore system peak decreased
from 2 µm to 1 µm. In Fig. 3, the industrial pulps (from S2 to S6) showed similar shifts
towards lower pore radii for the peaks above and below 10 µm. These changes in pore size
distribution are probably due to creation of new pores in the cell walls during processing
(related to chemical dissolution and an increase in the accessibility of the cell wall). In the
pore size range of 0.1 µm to 1 µm (Fig. 4), the relative peak height and tail of the
distribution increased, which indicated that more pores between 100 nm to 1000 nm were
created. Most of the changes in the pore size distribution occurred between the washing
(S4) and oxygen delignification (S5) steps, with a remarkable increase in the relative
volume for pores in the range of 100 nm to 2000 nm in size.
Fig. 4. Pore size distribution results in the range of 1 m to 4 m for the industrial pulp sampled during the process, from digester discharge to bleaching (S2 to S6), based on the MIP data
Fig. 5. Pore size distribution results for the dried final pulps derived from MIP: pulp S6- freeze dried, pulp S7- dried industrially, and pulps S8 and S9 were dried in the laboratory at two different temperatures (25 °C for S8 and 105 °C for S9).
PEER-REVIEWED ARTICLE bioresources.com
Giacomozzi et al. (2019). “Porosity change,” BioResources 14(2), 2827-2841. 2835
Figure 5 presents the changes in the pore size distribution of the pulp that was dried
industrially (S7) and in the laboratory (S8 and S9). They are compared against pulp S6
which was processed in the same manner but freeze dried in the laboratory. The figure
shows results for an identical pulp (S6) dried with four different techniques. What is most
apparent is that the industrially-dried pulp had a much wider relative pore size distribution
curve. While the other dried pulps exhibited two distinct peaks, only one was visible for
the industrially dried pulp. Furthermore, of the drying methods examined, the freeze-dried
pulp retains the highest amount of micron-sized pores. This difference in pore size
distribution between laboratory and industrially dried pulps could be due to opening of
macropores in the cell wall due to industrial drying. A similar behavior has been previously
described by Joutsimo (2004) and Joutsimo and Asikainen (2013) as being the result of the
mechanical treatment applied to pulps in laboratory, simulating pulp mill fiber line
conditions.
Pressure Plate The pore size distributions measured by the pressure plate technique are presented
in Figs. 6 through 9.
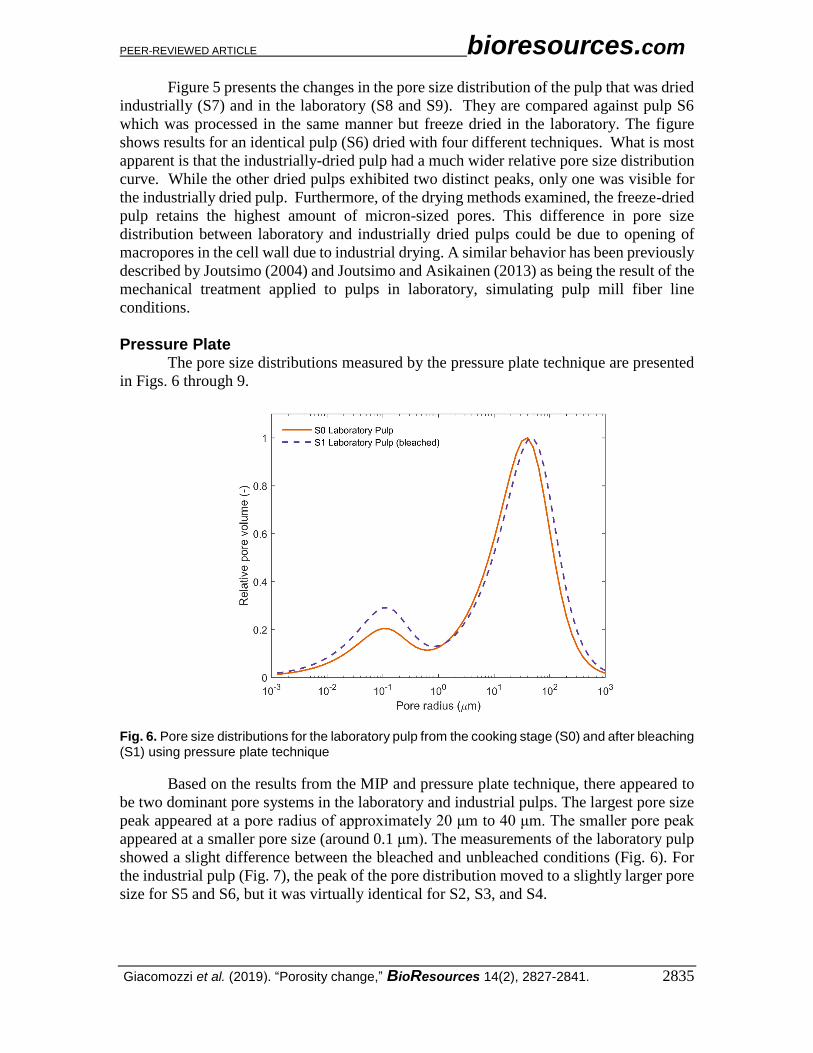
Fig. 6. Pore size distributions for the laboratory pulp from the cooking stage (S0) and after bleaching (S1) using pressure plate technique
Based on the results from the MIP and pressure plate technique, there appeared to
be two dominant pore systems in the laboratory and industrial pulps. The largest pore size
peak appeared at a pore radius of approximately 20 μm to 40 μm. The smaller pore peak
appeared at a smaller pore size (around 0.1 μm). The measurements of the laboratory pulp
showed a slight difference between the bleached and unbleached conditions (Fig. 6). For
the industrial pulp (Fig. 7), the peak of the pore distribution moved to a slightly larger pore
size for S5 and S6, but it was virtually identical for S2, S3, and S4.

PEER-REVIEWED ARTICLE bioresources.com
Giacomozzi et al. (2019). “Porosity change,” BioResources 14(2), 2827-2841. 2836
Fig. 7. Pore size distributions for the industrial pulp sampled during the process, from digester discharge to bleaching (S2 to S6) using pressure plate technique
The effect of the pulping process was most clearly apparent for the smaller of the
two peaks. This peak occurred in the range of 10 nm to 1000 nm in the pressure plate data
(Fig. 8) and 1 µm to 3 μm in the MIP data (Figs. 2 through 4). Likewise, the “valley”
between the two peaks represents the absence of pores. For the dried pulps examined in
MIP, these valleys occurred between 3 and 10 µm, whereas in the pressure plate
measurements the valleys are wider, extending from less than 1 µm to more than 10 µm.
Fig. 8. Pore size distribution results over the range of 0.01 m to 1 m for the industrial pulp sampled during the process, from digester discharge to bleaching (S2 to S6)

PEER-REVIEWED ARTICLE bioresources.com
Giacomozzi et al. (2019). “Porosity change,” BioResources 14(2), 2827-2841. 2837
Figure 9 shows the relative pore size distribution of pulps that were dried and then
rewetted in the range of 100 nm to 300 nm (smaller peaks) showed a reduction in the
relative pore volume and shifted to a slightly higher pore radius for the industrially-dried
pulp (S7) compared with the laboratory-dried pulp (S8 and S9).
Fig. 9. Pore size distribution results for the dried final pulps derived from pressure plate: pulp S6- freeze dried, pulp S7- dried industrially, and pulps S8 and S9 were dried in the laboratory at two different temperatures (25 °C for S8 and 105 °C for S9).
The pore size distribution results of the cell walls measured with the pressure plate
technique and MIP showed an increase in the pore size distribution above 100 nm during
processing and drying. According to Joutsimo (2004), the separation of structural elements
occurred during processing increases irregularities in the surface of fibers and reduces
bonding ability, which leads to changes in the strength, optical, and water holding
properties. Along the same lines, Lovikka et al. (2016), using SEM analysis showed that
large pores or cracks appeared on the surface of dried fibers, and that these pores were
outside of the range of the traditional BET method.
Previous studies by Giacomozzi and Joutsimo (2015) and Giacomozzi and
Joutsimo (2017) using NMR technique showed decreases in the pore volume and average
pore sizes for dried pulp (pores under 220 nm in size), and increase in the inner crystallinity
of the cellulose upon drying, which was also previously reported by other authors (Stone
and Scallan 1965; Minor 1994; Duchesne 2001; Fernandes Diniz et al. 2004; Newman
2004; Brancato 2008).
Based on the above, it is hypothesized that, besides the changes in pore size
distribution in the micropore (<2 nm) and mesopore range (2 to 50 nm), also the macropore
range is affected by processing and drying, and further research is required on this field. In
future studies in the macropore region, it is recommended to also include SEM as a
complementary technique to MIP and pressure plate technique.

PEER-REVIEWED ARTICLE bioresources.com
Giacomozzi et al. (2019). “Porosity change,” BioResources 14(2), 2827-2841. 2838
CONCLUSIONS 1. Pore size distribution results for the radiata pine pulp measured by MIP showed that
processing and drying induced changes in the cell wall structure.
2. The industrial pulp showed an increase in the relative pore volume in the range of 100
nm to 2000 nm (digester to bleaching) and a shift of the maximum pore size to lower
values for pores in the range of 2000 nm to 10000 nm when the pulp was processed.
3. For measurements on dried pulps, the relative pore size distribution appeared quite
different for the industrially-dried pulp when compared against the laboratory dried
pulps.
ACKNOWLEDGEMENTS
The authors wish to express their gratitude to Celulosa Arauco y Constitución S.A.
and Bioforest S.A. for the financial support of this study.
REFERENCES CITED Allan, G. G., Ko, Y., and Ritzenthaler, P. (1991). “The microporosity of pulp: The nature
of the pore size distribution,” TAPPI J. 74(3), 205-212.
Andreasson, B., Forsström, J., and Wågberg, L. (2003). “The porous structure of pulp
fibres with different yields and its influence on paper strength,” Cellulose 10(2), 111-
123. DOI: 10.1023/A:1024055406619
Andreasson, B., Forsström, J., and Wågberg, L. (2005). “Determination of fibre pore
structure: Influence of salt, pH and conventional wet strength resins,” Cellulose 12(3),
253-265. DOI: 10.1007/s10570-004-5837-6
Anovitz, L. M., and Cole, D. R. (2015). “Characterization and analysis of porosity and
pore structures,” Reviews in Mineralogy & Geochemistry 80(1), 61-164. DOI:
10.2138/rmg.2015.80.04
ASTM C1699-09 (2009). “Moisture retention curves of porous building materials using
pressure plates,” ASTM International, 100 Barr Harbor Drive, PO Box C700, West
Conshohocken, PA 19428-2959. United States
Berthold, J., and Salmén, L. (1997). “Inverse size exclusion chromatography (ISEC) for
determining the relative pore size distribution of wood pulps,” Holzforschung 51(4),
361-368. DOI: 10.1515/hfsg.1997.51.4.361
Brancato, A. (2008). Effect of Progressive Recycling on Cellulose Fiber Surface
Properties, Ph.D. Dissertation, School of Chemical and Biomolecular Engineering,
Georgia Institute of Technology, Atlanta, GA. DOI: 10.1.1.562.8354.
Carmeliet, J., and Roels, S. (2002) “Determination of the moisture capacity of porous
building materials,” Journal of Building Physics 25(3), 209-237. 10.1106/109719602022835
Chinga, G. (2002). Structural Studies of LWC Paper Coating Layers Using SEM and
Image Analysis Techniques, Thesis submitted in partial fulfilment of the Doktor

PEER-REVIEWED ARTICLE bioresources.com
Giacomozzi et al. (2019). “Porosity change,” BioResources 14(2), 2827-2841. 2839
Ingeniør degree, Norwegian University of Science and Technology, Department of
Chemical Engineering.
de Ruvo, A., and Htun, M. (1983). “Fundamental and practical aspects of papermaking
with recycled fibers,” in: The Role of Fundamental Research in Papermaking, Vol. 1,
J. Brander (ed.), Mechanical Engineering Pub. Ltd., London, UK, pp.195-225.
Duchesne, I., Hult, E-L., Molin, U., Daniel, G., Iversen, T., and Lennholm, H. (2001)
“The influence of hemicellulose on fibril aggregation of kraft pulp fibres as revealed
by FE-SEM and CP/MAS 13C-NMR,” Cellulose 8(2), 103-111.
DOI: 10.1023/A:1016645809958
Fahlén, J., and Salmén, L. (2005). “Pore and matrix distribution in the fiber wall revealed
by atomic force microscopy and image analysis,” Biomacromolecules 6(1), 433-438.
DOI: 10.1021/bm040068x.
Fernandes Diniz, J., Gil, M., and Castro, J. (2004). “Hornification—its origin and
interpretation in wood pulps,” Wood Sci. Technol. 37(6), 489-494.
DOI 10.1007/s00226-003-0216-2.
Giacomozzi, D., and Joutsimo, O. (2015). “Drying temperature and hornification of
industrial never-dried Pinus radiata pulps. 1. Strength, optical, and water holding
properties,” BioResources 10(3), 5791-5808. DOI: 10.15376/biores.10.3.5791-5808.
Giacomozzi, D., and Joutsimo, O. (2017). “Drying temperature and hornification of
industrial never-dried Pinus radiata pulps. 2. Voith Sulzer refining,” BioResources
12(1), 1532-1547. DOI: 10.15376/biores.12.1.1532-1547.
Giesche, H. (2006). “Mercury porosimetry: A general (practical) overview,” Part. Part.
Syst. Char. 23(1), 9-19. DOI: 10.1002/ppsc.200601009.
Hill, C., and Papadopoulos, A. (2001). “A review of methods used to determine the size
of the cell wall microvoids of wood,” Journal of the Institute of Wood Science 15(6),
337-345. ISSN 0200-3203.
ISO 534:2005 (2005). “Determination of thickness, density and specific volume,”
International Organization for Standardization (ISO), Geneva, Switzerland.
ISO 5264-2:2003 (2003). “Laboratory beating – Part 2: PFI mill method,” International
Organization for Standardization (ISO), Geneva, Switzerland.
ISO 23714:2007 (2007). “Determination of water retention value (WRV),” International
Organization for Standardization (ISO), Geneva, Switzerland.
Jin, H., Nishiyama, Y., Wada, M., Kuga, S. (2004). “Nanofibrillar cellulose aerogels,”
Colloids and Surfaces A: Physicochem. Eng. Aspects 240(1-3), 63-67. DOI:
10.1016./j.colsurfa.2004.03.007.
Joutsimo, O. (2004). Effect of Mechanical Treatment on Softwood Kraft Fiber Properties,
Ph.D. Dissertation, Helsinki University of Technology, Helsinki, Finland.
Joutsimo, O., and Asikainen, S. (2013). “Effect of fiber wall pore structure on pulp sheet
density of softwood kraft pulp fibers,” BioResources 8(2), 2719-2737.
DOI: 10.15376/biores.8.2.2719-2737.
Kimura, M., Qi, Z-D., Fukuzumi, H., Kuga, S., and Isogai, A. (2014). “Mesoporous
structures in never-dried softwood cellulose fibers investigated by nitrogen
adsorption,” Cellulose 21(5), 3193-3201. DOI: 10.1007/s10570-014-0342-z.
Kimura, M., Qi, Z-D, and Isogai, A. (2016). “Analysis of mesopore structures in wood
cell walls and pulp fibers by nitrogen adsorption method,” Nordic Pulp & Paper
Research Journal 31(2), 198-204. DOI: 10.3183/npprj-2016-31-02-p198-204.

PEER-REVIEWED ARTICLE bioresources.com
Giacomozzi et al. (2019). “Porosity change,” BioResources 14(2), 2827-2841. 2840
Li, T.-Q., and Henriksson, U. (1993). “Determination of pore sizes in wood cellulose
fibers by 2H and 1H NMR,” Nord. Pulp Pap. Res. J. 8(3), 326-330.
DOI: 10.3183/NPPRJ-1993-08-03-p326-330.
Lin, J. K., Ladisch, M., Patterson, J. A., and Noller, C. (1987). “Determining pore size
distribution in wet cellulose by measuring solute exclusion using a differential
refractometer,” Biotechnol. Bioeng. 29(8), 976-981.
Lovikka, V. A., Khanjani, P., Väisänen, S., Vuorinen, T., and Maloney, T. (2016).
“Porosity of wood pulp fibers in the wet and highly open dry state,” Micropor.
Mesopor. Mat. 234, 326-335. DOI: 10.1016/j.micromeso.2016.07.032.
Maloney, T. C., and Paulapuro, H. (1998) “Hydration and swelling of pulp fibres
measured with differential scanning calorimetry,” Nordic Pulp and Paper Res. J.
13(1), 31-36.
Minor, J. L. (1994). “Hornification-its origin and meaning,” Prog. Pap. Recycl. 3(2), 93-
95.
Moura, M. J., Ferreira, P. J., and Figueiredo, M. M. (2005). “Mercury intrusion
porosimetry in pulp and paper technology,” Powder Technol. 160(2), 61-66.
DOI: 10.1016/j.powtec.2005.08.033.
Newman, R. H. (2004) “Carbon-13 NMR evidence for cocrystallization of cellulose as a
mechanism for hornification of bleached kraft pulp,” Cellulose 11(1), 45-52.
DOI: 10.1023/B:CELL.0000014768.28924.0c.
Park, S., Venditti, R., Jameel, H., and Pawlak, J. (2006). “Changes in pore size
distribution during the drying of cellulose fibers as measured by differential scanning
calorimetry,” Carbohyd. Polym. 66(1), 97-103. DOI: 10.1016/j.carbpol.2006.02.026.
Roels, S., Elsen, J., Carmeliet, J., Hens, H. (2001). “Characterisation of pore structure by
combining mercury porosimetry and micrography,” Materials and Structures 34(2),
76-82.
Savitzky, A., and Golay, M. J. E. (1964). “Smoothing and differentiation of data by
simplified least squares procedures,” Analytical Chemistry 36(8), 1627-1639.
DOI: 10.1021/ac60214a047.
SCAN-CM 39:94 (1994). “Dry matter content,” Scandinavian Pulp, Paper and Board
Testing Committee (SCAN), Stockholm, Sweden.
SCAN-CM 40:01 (2001). “Size distribution,” Scandinavian Pulp, Paper and Board Testing
Committee (SCAN), Stockholm, Sweden.
SCAN-N 30:85 (1985). “Total, active and effective alkali,” Scandinavian Pulp, Paper and
Board Testing Committee (SCAN), Stockholm, Sweden.
SCAN-N 33:94 (1994). “Residual alkali (Hydroxide ion content),” Scandinavian Pulp,
Paper and Board Testing Committee (SCAN), Stockholm, Sweden.
Stone, J. E., and Scallan, A. M. (1965). “Influence of drying on the pore structures of the
cell wall. Consolidation of the paper web,” in: Transactions of the 3rd Fundamental
Research Symposium, Cambridge, UK, pp. 145-167.
Stone, J. E., and Scallan, A. M. (1967). “The effect of component removal upon the
porous structure of the cell wall of wood. Part II. Swelling in water and the fiber
saturation point,” TAPPI J. 50(10), 496-501.
Stone, J. E., and Scallan, A. M. (1968). “The effect of component removal upon the
porous structure of the cell wall of wood. Part III. A comparison of the sulphite and
kraft process,” Pulp Paper Mag. Can. 69(12), 69-74.

PEER-REVIEWED ARTICLE bioresources.com
Giacomozzi et al. (2019). “Porosity change,” BioResources 14(2), 2827-2841. 2841
TAPPI 205 sp-06 (2006). “Forming handsheets for physical tests of pulp,” Technical
Association of the Pulp and Paper Industry (TAPPI), Atlanta, Georgia, USA.
TAPPI 220 sp-01 (2001). “Physical testing of pulp handsheets,” Technical Association of
the Pulp and Paper Industry (TAPPI), Atlanta, Georgia, USA.
TAPPI 257 cm-02 (2002). “Sampling and preparing wood for analysis,” Technical
Association of the Pulp and Paper Industry (TAPPI), Atlanta, Georgia, USA.
TAPPI 275 sp-12 (2012). “Screening of pulp (Somerville type equipment,” Technical
Association of the Pulp and Paper Industry (TAPPI), Atlanta, Georgia, USA.
Westermarck, S. (2000). Use of Mercury Porosimetry and Nitrogen Adsorption
in Characterization of the Pore Structure of Mannitol and Microcrystalline Cellulose
Powders, Granules and Tablets, Ph.D. Dissertation, Faculty of Science of the
University of Helsinki, Finland.
Yamauchi, T. (2007). “A method to determine lumen volume and collapse degree of pulp
fibers by using bottleneck effect of mercury porosimetry,” J. Wood Sci. 53(6), 516-
519. DOI: 10.1007/s10086-007-0895-7.
Zelinka, S. L., Glass, S. V., Boardman, C. R., and Derome, D. (2016). "Moisture storage
and transport properties of preservative treated and untreated southern pine wood,"
Wood Material Science & Engineering 11(4), 228-238. DOI:
10.1080/17480272.2014.973443
Zillig, W., Janssen, H., Carmeliet, J., and Derome, D. (2006). "Liquid water transport in
wood: Towards a mesoscopic approach," in: P. Fazio, H. Ge, J. Rao, and G.
Desmarais (eds.), Research in Building Physics and Building Engineering, Taylor and
Francis Group, London, pp. 107-114.
Zillig, W. (2009). Moisture Transport in Wood using a Multiscale Approach, Ph.D.
Dissertation, Katholieke Universiteit Leuven, Leuven, Belgium.
Article submitted: December 8, 2017; Peer review completed: June 5, 2018; Revised
version received and accepted: January 28, 2019; Published: February 19, 2019.
DOI: 10.15376/biores.14.2.2827-2841