Embed Size (px)
Citation preview
PEER-REVIEWED ARTICLE bioresources.com
Prokkola et al. (2014). “Condensate biodegradation,” BioResources 9(3), 3761-3778. 3761
Chemical Study of Wood Chip Drying: Biodegradation of Organic Pollutants in Condensate Waters from the Drying Process
Hanna Prokkola,a Matti Kuokkanen,
a Toivo Kuokkanen,
a and Ulla Lassi
a,b
In 2008, the European Union Commission put forward a proposal for a new directive on renewable forms of energy. Each of the member states should increase its share of renewable energies in an effort to boost the total share of the EU from the current 8.5% to 20% by 2020. The level of renewable energy in Finland was 28.5% in 2005, and the national target share of renewable energy by 2020 is 38%. To assist in reaching this goal, one solution is to further develop drying techniques of biomasses and utilization of untapped biomasses, because in Finland, up to 20 million tons of waste wood biomass per year are left unused during forestry operations. In this study the drying of biomasses and the condensate, including biodegradation of organic pollutants, is examined. The cost-efficiency and energy-efficiency of wood chips combustion can be increased by drying the wood to optimize moisture content before being utilized in different applications. However, the removal of moisture is the most expensive unit process in combustion. Studied wood species were pine (Pinus sylvestris), spruce (Picea abies), aspen (Populus tremula) and two birch species (Betula pendula and Betula pubescens). The biodegradation degrees of studied organic pollutants in condensing waters were between 25% and 61%. Furthermore, the biodegradation of organic compounds in condensing waters showed that at least the studied condensates can be safely disposed via municipal wastewater treatment plant (WWTP).
Keywords: Wood chip; Drying; Condensing water; Biodegradation; Moisture
Contact information: a: University of Oulu, Department of Chemistry, P.O. Box 3000, FI-90014 University
of Oulu, Finland; b: Kokkola University Consortium Chydenius, Unit of Applied Chemistry,
Talonpojankatu 2 B, Kokkola, Finland; Corresponding author: [email protected]
INTRODUCTION Moisture in Wood
The water within growing biomass organisms is essential for their survival, as
plants produce glucose and oxygen from water and carbon dioxide by photosynthesis.
From glucose, plants produce other materials important to their growth, including
cellulose, hemicellulose, and lignin, in addition to many other manufactured substances
known as extractives. Water in wood is composed of two different forms: i) part of it is
combined with the cell walls through adsorption with hydrogen bonds to cellulose
molecules; and ii) when the cellulose fibers are saturated, the excess part of water is
present in liquid form in the cell cavities (Bengtsson 2004).
The moisture content of wood is dependent on the wood species, season of the
year, location, and duration of storage (Thuvander et al. 2002). Typically, biomass
PEER-REVIEWED ARTICLE bioresources.com
Prokkola et al. (2014). “Condensate biodegradation,” BioResources 9(3), 3761-3778. 3762
feedstocks have a moisture content of 30 to 55 wt%, and they have to be dried to a typical
moisture content of about 10 to 15 wt%, depending on the proposed use (Fagernäs et al.
2010; McKendry 2002). Wood chips should be preheated before raising the heat to the
drying temperature, because the dry surface may hinder water passing to the surface. A
study by Rosenkilde et al. (2004) showed that a dry shell forms in the surface layer
shortly after drying has begun. This dry shell controls the drying rate until the mean
moisture content in the bulk decreases to the fiber saturation level. During drying, free
water leaves the cell cavity first. When the cavity is empty, the cell walls are saturated
with bound water and wood is said to be at the fiber saturation point (FSP) (Granström
and Månsson 2008) at about 20 to 23% of wet matter. However, the commonly accepted
value of FSP from oven dried wood is 30%.
Composition of Condensate Waters The condensate often includes varying amounts of volatile organic compounds
(VOCs), which are released during oven drying of biofuel into ambient air (Samuelsson
et al. 2006). Some of the burnable material may be lost if the wood is dried too much or
at too high a temperature. Benefits of the drying process are mostly self-evident; drying
increases the efficiency of the thermal process by increasing the caloric heat value of the
fuel (wood chips in this case). However, drying itself is an energy-consuming process,
and therefore the total energy efficiency should be considered on a case by case basis to
optimize the moisture content of wood chips before processing.
Moisture Content Requirements for Different Systems Drying is the most energy demanding part of the mechanical forest industry.
Thermal treatment of biomass (e.g. combustion of pellets, pyrolysis, or gasification)
provides a possibility to respond to the rapidly increasing demand of renewable energy
consumption. Gasification of biomass (wood chips) is thought to provide one of the most
potentially viable routes for producing syngas. The main factors affecting wood drying
are the wood species, temperature, as well as the air and mass flows. The boiler design is
also an important factor. Dried wood is more suited to combined heat and power
production (CHP) in small plants (under 5 MW) because they usually do not have a heat
recovery mechanism in the chimney and this causes moderate energy losses. The
moisture content for these applications should be under 25%. The larger plants (over 5
MW) usually have a gas scrubber and are able to burn wetter raw material, and therefore
less waste heat is produced. If the CHP plant uses wood gas in its combustion engine,
then the required moisture content is about 25%. The heat can be recovered directly from
the gasifier or the internal combustion engine, whilst a generator can be used to provide
electricity. In fixed bed combustion (size about 0.1 to 3 MW), the boilers are designed to
operate with a moisture content under 40%. However if the moisture content increases
towards 60% in the fixed bed combustion, then water vapor increases the flow rate in gas
and high temperature flue gases, which causes a loss of energy and an increase in
particulate emissions. Other production processes include BFB (bubbling fluidized bed)
combustion, which is well suited for biomass and recycled fuels (in plants usually over 5
MW), and CFB (circulating fluidized bed) technology, which is optimal for higher
heating value fuels, such as drier biomass, recycled fuels, fossil fuels, and co-combustion.
For pellet production, the wood must be dried to the range 8 to 12% of moisture content.
If the raw material in pellet production is cutter chips or saw dust from dried wood, they
PEER-REVIEWED ARTICLE bioresources.com
Prokkola et al. (2014). “Condensate biodegradation,” BioResources 9(3), 3761-3778. 3763
are so dry already that there is no need for further processing. However, because of an
increase in production, the supply of these raw materials may not be sufficient, and new
materials such as moist wood particles may be taken into use (Ståhl et al. 2004).
For gasification, the need for drying combustible material is lower than for other
purposes. For example, in an updraft gasifier, drying of wood is not necessary, since fuel
is dried at the top of the gasifier due to an internal heat exchange, and therefore fuels with
high moisture content (up to 60%) can be used. However, downdraft gasifiers require
tighter limits on the moisture content of fuel. The required moisture content of the fuel is
typically less than 25% (Knoef 2005).
Moisture Demands for Wood during Storage In Finland and other Nordic countries, wood can be dried outside after harvesting
to achieve a moisture content of 40%. However, for longer periods of storage, the
moisture content should be reduced to 25%, a level where mold growing and insect attack
is prevented (Lehtikangas 2006). Generally speaking, moisture content in dried wood
settles at 25% in winter time. In summer time the moisture content in Finland typically
settles between 15 and 25% after it is dried, being largely dependent on the weather. If
the wood chips are too moist during storage in the stack, they may start to warm up, and
there is also a risk of auto-ignition (Jirjis 1995).
A completely healthy tree may contain bacteria, but it is more likely that any
bacteria present will enter the tree after it is logged. Bacteria are able to biodegrade many
compounds of wood, and a few commonly known ones are able to biodegrade cellulose
too (Bhat and Bhat 1997).
Content of Evaporated Compounds During the wood drying process, free water in the cell cavities is released first,
followed by bound water at higher temperatures. These phase transformations can be
observed by thermoanalytic methods (TGA). According to the studies of McDonald
(1999), emissions during the drying process are released by volatilization, by steam
distillation, and/or by thermal degradation. Organic emissions can be categorized into
volatile organic compounds (VOCs) and into condensable compounds. At low drying
temperatures (below 100 °C), the compounds emitted to air are mainly monoterpenes and
sesquiterpenes (Rupar and Sanati 2003). Volatiles released into the atmosphere are a
complex mixture of terpenes, methanol, acetic acid, formaldehyde, resin acids, and fatty
acids (Banerjee 2001; McDonald et al. 1999). At these hot temperatures (much higher
than used in this study: 60 to 130 °C), emitted VOCs were about 90% monoterpenes
(C5H8)2. In softwoods, the most notable VOCs are α- and β-pinenes. Sometimes reactions
occur in the gas phase and all emitted compounds are not necessarily from the wood. For
example, air oxidation of α-pinene with aldehydes, ketones, and hydroxyl groups form
ringed compounds (Milota 2000). HAPs (hazardous air pollutants) belong to VOCs and
they are also emitted during drying. These include mostly methanol, and lesser amounts
of acetaldehyde and formaldehyde (Milota 2000). VOC emissions, in the presence of
NOx and sunlight, cause the formation of low level ozone and other photochemical
oxidants, which irritate the respiratory system (Burnett et al. 1999; Krupnick et al. 1990).
These have a detrimental effect on asthmatics (Levy et al. 2001; Peden 2002) and prevent
photosynthesis of plants (Heath 1980; Laurence and Weinstein 1981). During the drying
of hardwood sawdust, emissions increased exponentially when the moisture content of
PEER-REVIEWED ARTICLE bioresources.com
Prokkola et al. (2014). “Condensate biodegradation,” BioResources 9(3), 3761-3778. 3764
sawdust decreased. Approximately 20 mg of sesquiterpenes is emitted for every 1 kg
when oven-drying sawdust (Granström and Månson 2008). The temperature in the actual
dryer should not be greater than 130 °C, because VOCs start to evaporate.
MATERIALS AND METHODS The Origin of Water Samples Condensing water samples were collected from the biomass (wood chips) drying
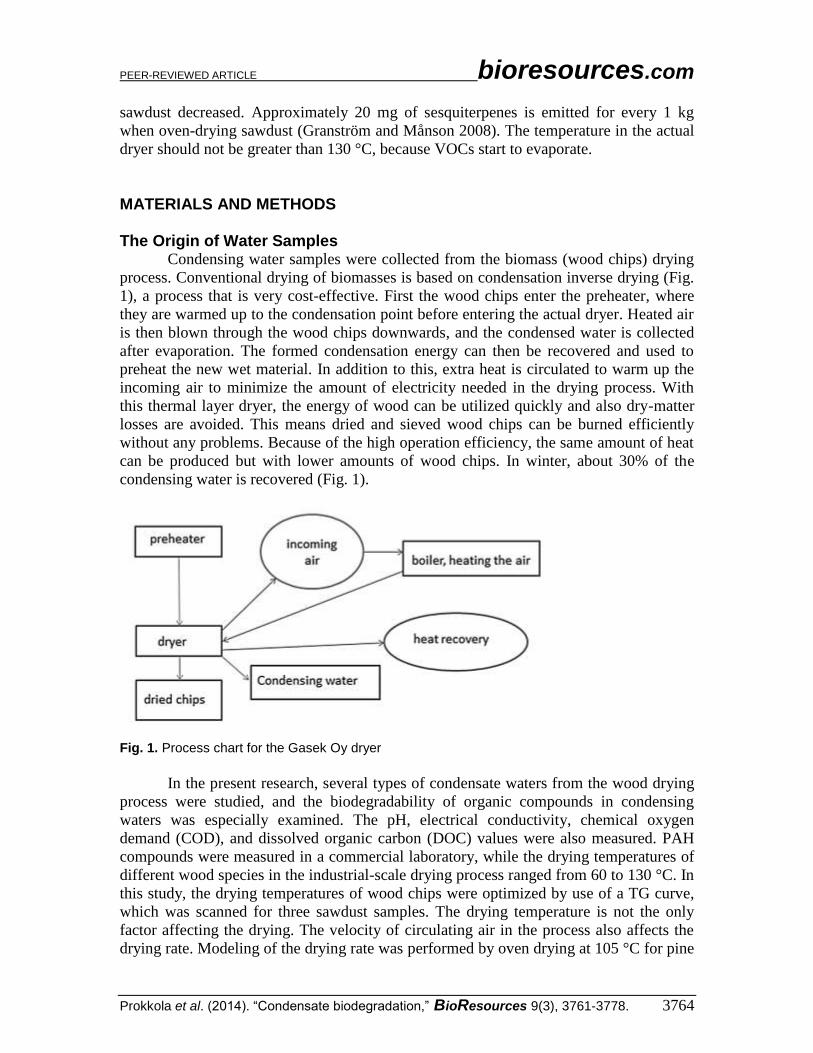
process. Conventional drying of biomasses is based on condensation inverse drying (Fig.
1), a process that is very cost-effective. First the wood chips enter the preheater, where
they are warmed up to the condensation point before entering the actual dryer. Heated air
is then blown through the wood chips downwards, and the condensed water is collected
after evaporation. The formed condensation energy can then be recovered and used to
preheat the new wet material. In addition to this, extra heat is circulated to warm up the
incoming air to minimize the amount of electricity needed in the drying process. With
this thermal layer dryer, the energy of wood can be utilized quickly and also dry-matter
losses are avoided. This means dried and sieved wood chips can be burned efficiently
without any problems. Because of the high operation efficiency, the same amount of heat
can be produced but with lower amounts of wood chips. In winter, about 30% of the
condensing water is recovered (Fig. 1).
Fig. 1. Process chart for the Gasek Oy dryer
In the present research, several types of condensate waters from the wood drying
process were studied, and the biodegradability of organic compounds in condensing
waters was especially examined. The pH, electrical conductivity, chemical oxygen
demand (COD), and dissolved organic carbon (DOC) values were also measured. PAH
compounds were measured in a commercial laboratory, while the drying temperatures of
different wood species in the industrial-scale drying process ranged from 60 to 130 °C. In
this study, the drying temperatures of wood chips were optimized by use of a TG curve,
which was scanned for three sawdust samples. The drying temperature is not the only
factor affecting the drying. The velocity of circulating air in the process also affects the
drying rate. Modeling of the drying rate was performed by oven drying at 105 °C for pine
PEER-REVIEWED ARTICLE bioresources.com
Prokkola et al. (2014). “Condensate biodegradation,” BioResources 9(3), 3761-3778. 3765
and spruce chips. The initial moisture contents of wood chips were 56% for spruce and
51% for pine (Figs. 2 and 3). Other chemical properties of the wood samples were
measured as well. For example, the biodegradation of organic material in condensing
waters was measured, since the results of this are important when the disposal of such
waters is considered. Other properties such as pH, electrical conductivity, COD, and
DOC were also measured.
Water from the Wood Drying Process In this research, several types of condensing waters from the wood drying process
were studied. The dried wood species were pine (100%), spruce (100%), birch (100%),
and a mixture of aspen and pine (80% and 20%, respectively). In Finland, one pine
species Pinus sylvestris, one spruce species Picea abies, one aspen species Populus
tremula, and three birch species Betula pendula, Betula pubescens, and Betula nana
grow. The birch samples in this study were a mixture of Betula pendula and Betula
pubescens. Biodegradability of organic compounds released with condensing waters
during the drying process was examined closely. Condensate waters from an industrial-
scale wood drying process were provided by Gasek Oy, in Northern Finland.
Characterization of Wood Samples Graphing of the wood chips drying process was carried out by determining the
drying curves (moisture content vs. time) of two softwood samples (pine and spruce) at a
constant temperature, 105 °C. The size distribution of sawdust and wood chips samples
was determined with different size sieves. The sizes of the sieves used were: 32 mm, 22
mm, 16 mm, 9.52 mm, 6.73 mm, 3.36 mm, 2.38 mm, 1.41 mm, 0.59 mm, and 0.297 mm
for wood chips, and 1.41 mm, 0.59 mm, and 0.297 mm for sawdust. The longest side of
wood chips was 5 to 7 cm. Caloric heat values of three sawdust samples (birch, pine, and
spruce) were determined with an IKA C200 calorimeter, which was calibrated with a
benzoic acid tablet (1 g). The calorific heat value was only measured for samples that
contained some moisture. Once the calorimeter constant C had been determined, the
gross calorific values of the air dry samples Qgr,ad were calculated using Eq. 1. The gross
calorific values of the dry samples (Qgr,d) were calculated using Eq. 2 (Kuokkanen et al.
2009, 2011),
Qgr,ad = {(ΔT1 – ΔT2) • C}/m1 (1)
where ΔT1 is the change in temperature from the combustion of the air dry sample [°C],
ΔT2 is the change in temperature from ignition and burning of the cotton twist [°C], and
m1 is the mass of the dry sample [g]. Likewise,
Qgr,d = Qgr,ad • 100/(100 – Mad) (2)
where Mad is the moisture content of the air dry sample [wt%].
TG graphs were measured for three different types of sawdust (birch, spruce, and
pine) without further drying. The moisture contents of the samples were 3.26% for birch,
4.65% for pine, and 4.08% for spruce. These values are based on the measure of weight
loss when a material is heated with a constant heating rate, which can be quantified by
the determination of the mass of the evaporated or burned material. The TG graph was
PEER-REVIEWED ARTICLE bioresources.com
Prokkola et al. (2014). “Condensate biodegradation,” BioResources 9(3), 3761-3778. 3766
scanned in an air atmosphere, since the water formed in combustion can be seen in mass
spectra as its own peak.
Carbon and hydrogen contents were measured by elemental analysis from
sawdust samples by using a Perkin Elmer 2400 Series II CHNS/O device. The moisture
content was measured according to a standard method (SFS-EN 14774-2:en) by oven
drying for 24 h at 105 (± 2.0) °C. The amount of organic material, nitrogen, sulfur, and
ash were also measured, whilst metal contents, Cl (chlorine), and P (phosphorus) were
measured with ICP-OES.
Characterization of Condensing Waters DOC of condensing waters was measured with a (total organic carbon) TOC
analyzer (Sievers 900 portable), and the theoretical value of carbon for calculating the
degree of biodegradation was based on this determination of carbon content. Condensing
waters contain only a small amount of solids, but they have to be filtered with coarse
filter paper (pore size approximately 25 μm) before any DOC measurement takes place.
This solid material contains only small wood particles from the drying process and does
not affect the results. Nitrogen content was also measured for two condensing water
samples. The measured CODCr of the condensing waters is the chemical oxygen demand,
and the result contains almost all of the carbon and oxidable metals. Potassium
dichromate and sulphuric acid used for oxidation in COD measurements are usually not
able to oxidize all the organic carbon. COD analyses were performed with the Hach
Lange cuvette test and measured with a Hach Lange DR 2800 Photometer. The same
spectrometer was used to determine the contents of ammonia and total nitrogen. The pH
and electrical conductivity of condensing waters were also measured. Organic
compounds were measured by GC-MS from water and after extraction with 1,2-
dichloroethane. The organic compounds were concentrated with 10 mL of 1,2-
dichloroethane, and the sample volume was 400 mL. Different condensing waters of
birch samples were taken at different points in time from the dryer. Time between
sampling was about one hour.
Biodegradation of Organic Pollutants in Condensing Waters The biodegradation of organic material in condensing waters is very important
when considering the environmental friendliness of these wastewaters. If the organic
material in water is easily biodegradable, it could be discharged directly to the WWTP,
avoiding any harmful effect on the system. If the biodegradation of the sample is low,
some inhibitive or toxic substances that are harmful to the environment or to the
wastewater purification process may still be present. During the biodegradation reaction
the sample is biodegraded by bacteria, which consume oxygen in their corresponding
respiration reaction. The reaction produces carbon dioxide, water, new biomass, and
ammonia (Prokkola et al. 2012). Since the condensing waters contained mostly wood
extractives, they were already moderately biodegradable without dilution or inoculum
addition. This indicates that there was no significant inhibitive effect on the
biodegradation.
Biodegradation of organic compounds in condensing waters was measured with
the OxiTop® Control method (Prokkola et al. 2012; Roppola et al. 2006; Kuokkanen et
al. 2004). Samples were not diluted for the biodegradation measurements, since dilution
is only necessary when the sample is concentrated (BOD value over 4000 mg/L). The
PEER-REVIEWED ARTICLE bioresources.com
Prokkola et al. (2014). “Condensate biodegradation,” BioResources 9(3), 3761-3778. 3767
addition of inoculum was not performed during the measurements because the use of
inoculum was first tested with four samples, and the results were not affected.
RESULTS AND DISCUSSION Characteristics of Wood Chip and Sawdust Samples This examination included condensate waters from the drying process of four
different tree samples: 100% birch, 100% spruce, 100% pine, and a mixture of aspen and
pine (80% and 20%, respectively). In addition, there were also three sawdust samples:
pine, spruce, and birch. The wood chips studied were spruce and pine.
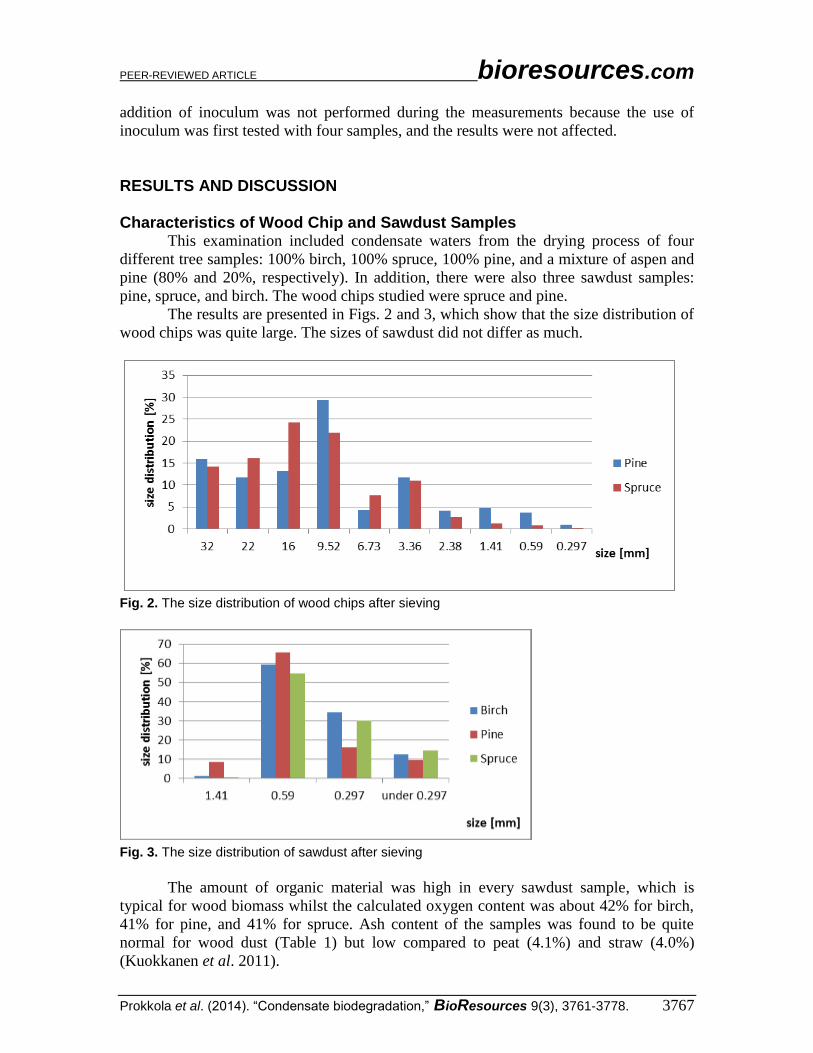
The results are presented in Figs. 2 and 3, which show that the size distribution of
wood chips was quite large. The sizes of sawdust did not differ as much.
Fig. 2. The size distribution of wood chips after sieving
Fig. 3. The size distribution of sawdust after sieving
The amount of organic material was high in every sawdust sample, which is
typical for wood biomass whilst the calculated oxygen content was about 42% for birch,
41% for pine, and 41% for spruce. Ash content of the samples was found to be quite
normal for wood dust (Table 1) but low compared to peat (4.1%) and straw (4.0%)
(Kuokkanen et al. 2011).
PEER-REVIEWED ARTICLE bioresources.com
Prokkola et al. (2014). “Condensate biodegradation,” BioResources 9(3), 3761-3778. 3768
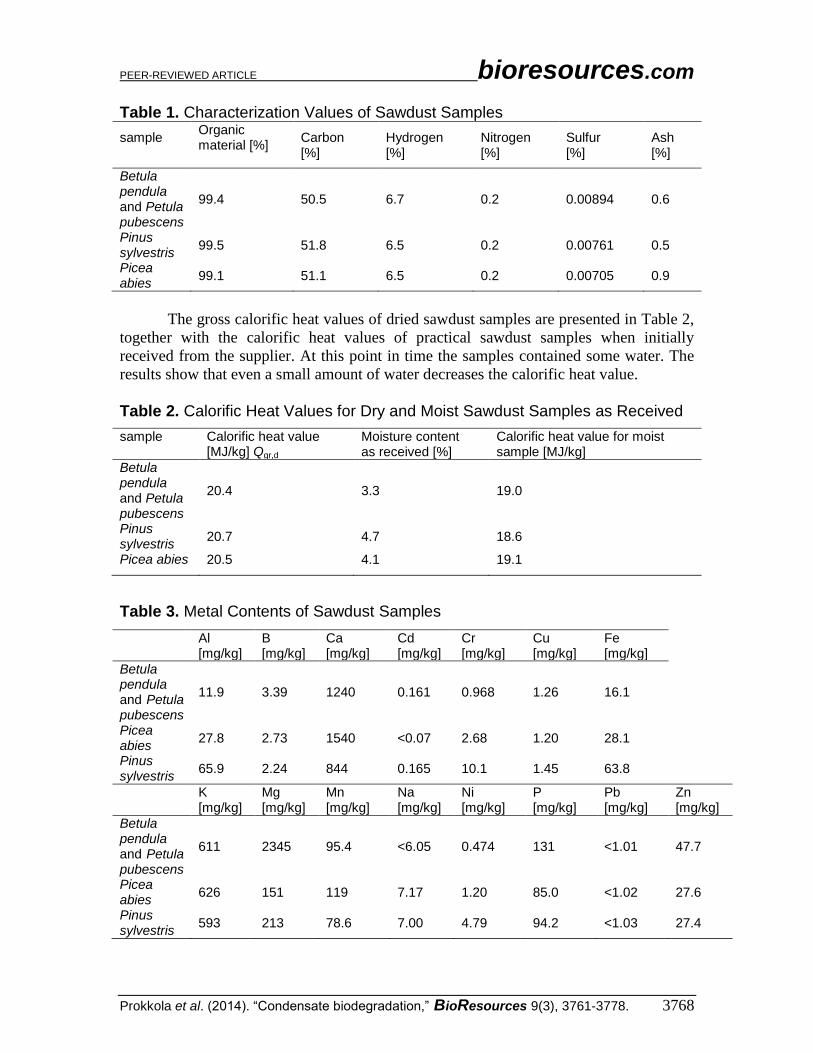
Table 1. Characterization Values of Sawdust Samples
sample
Organic material [%]
Carbon [%]
Hydrogen [%]
Nitrogen [%]
Sulfur [%]
Ash [%]
Betula pendula and Petula pubescens
99.4 50.5 6.7 0.2 0.00894 0.6
Pinus sylvestris
99.5 51.8 6.5 0.2 0.00761 0.5
Picea abies
99.1 51.1 6.5 0.2 0.00705 0.9
The gross calorific heat values of dried sawdust samples are presented in Table 2,
together with the calorific heat values of practical sawdust samples when initially
received from the supplier. At this point in time the samples contained some water. The
results show that even a small amount of water decreases the calorific heat value.
Table 2. Calorific Heat Values for Dry and Moist Sawdust Samples as Received
sample Calorific heat value [MJ/kg] Qgr,d
Moisture content as received [%]
Calorific heat value for moist sample [MJ/kg]
Betula pendula and Petula pubescens
20.4 3.3 19.0
Pinus sylvestris
20.7 4.7 18.6
Picea abies 20.5 4.1 19.1
Table 3. Metal Contents of Sawdust Samples
Al [mg/kg]
B [mg/kg]
Ca [mg/kg]
Cd [mg/kg]
Cr [mg/kg]
Cu [mg/kg]
Fe [mg/kg]
Betula pendula and Petula pubescens
11.9 3.39 1240 0.161 0.968 1.26 16.1
Picea abies
27.8 2.73 1540 <0.07 2.68 1.20 28.1
Pinus sylvestris
65.9 2.24 844 0.165 10.1 1.45 63.8
K [mg/kg]
Mg [mg/kg]
Mn [mg/kg]
Na [mg/kg]
Ni [mg/kg]
P [mg/kg]
Pb [mg/kg]
Zn [mg/kg]
Betula pendula and Petula pubescens
611 2345 95.4 <6.05 0.474 131 <1.01 47.7
Picea abies
626 151 119 7.17 1.20 85.0 <1.02 27.6
Pinus sylvestris
593 213 78.6 7.00 4.79 94.2 <1.03 27.4
PEER-REVIEWED ARTICLE bioresources.com
Prokkola et al. (2014). “Condensate biodegradation,” BioResources 9(3), 3761-3778. 3769
The sawdust samples contained some negligible amounts of heavy metals.
However, some of the metals (Ca, K, Mg, and Fe) are essential for the growth of trees.
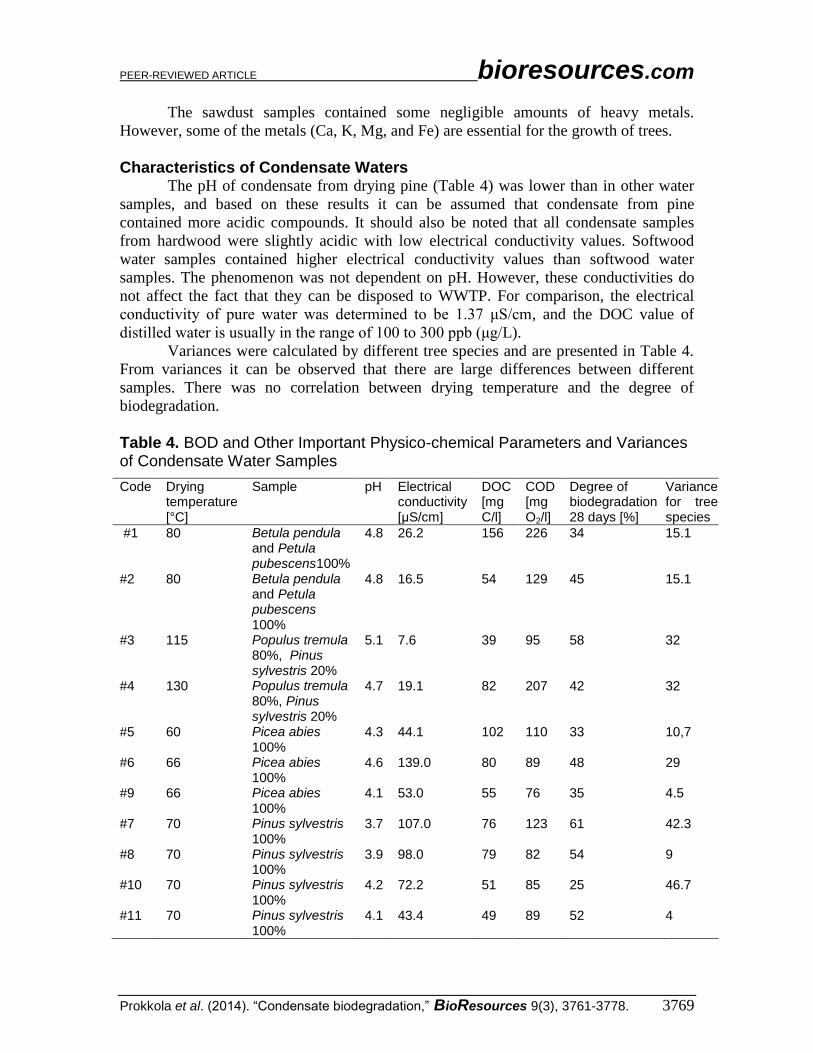
Characteristics of Condensate Waters The pH of condensate from drying pine (Table 4) was lower than in other water
samples, and based on these results it can be assumed that condensate from pine
contained more acidic compounds. It should also be noted that all condensate samples
from hardwood were slightly acidic with low electrical conductivity values. Softwood
water samples contained higher electrical conductivity values than softwood water
samples. The phenomenon was not dependent on pH. However, these conductivities do
not affect the fact that they can be disposed to WWTP. For comparison, the electrical
conductivity of pure water was determined to be 1.37 μS/cm, and the DOC value of
distilled water is usually in the range of 100 to 300 ppb (μg/L).
Variances were calculated by different tree species and are presented in Table 4.
From variances it can be observed that there are large differences between different
samples. There was no correlation between drying temperature and the degree of
biodegradation.
Table 4. BOD and Other Important Physico-chemical Parameters and Variances of Condensate Water Samples
Code Drying temperature [°C]
Sample pH Electrical conductivity [μS/cm]
DOC [mg C/l]
COD [mg O2/l]
Degree of biodegradation 28 days [%]
Variance for tree species
#1 80 Betula pendula and Petula pubescens100%
4.8 26.2 156 226 34 15.1
#2 80 Betula pendula and Petula pubescens 100%
4.8 16.5 54 129 45 15.1
#3 115
Populus tremula 80%, Pinus sylvestris 20%
5.1 7.6 39 95 58 32
#4 130 Populus tremula 80%, Pinus sylvestris 20%
4.7 19.1 82 207 42 32
#5 60 Picea abies 100%
4.3 44.1 102 110 33 10,7
#6 66 Picea abies 100%
4.6 139.0 80 89 48 29
#9 66 Picea abies 100%
4.1 53.0 55 76 35 4.5
#7 70 Pinus sylvestris 100%
3.7 107.0 76 123 61 42.3
#8 70 Pinus sylvestris 100%
3.9 98.0 79 82 54 9
#10 70 Pinus sylvestris 100%
4.2 72.2 51 85 25 46.7
#11 70 Pinus sylvestris 100%
4.1 43.4 49 89 52 4
PEER-REVIEWED ARTICLE bioresources.com
Prokkola et al. (2014). “Condensate biodegradation,” BioResources 9(3), 3761-3778. 3770
The composition of condensate water was found to be quite similar at all the used
drying temperatures (60, 66, 70, 80, 115, and 130 °C). Water samples did not have any
smell of tar, just a fresh wood aroma. Furthermore, it can be seen from DOC and COD
results that the organic load of the condensed water vapor is very low. Condensate
samples #5 and #6 contained small amounts of nitrogen: 0.2 ppm and under 0.3 ppm,
respectively. However, 50% of the nitrogen in both samples was in the form of ammonia.
These nitrogen results are not presented in this paper because the concentrations were
below our measuring range and unfortunately are not accurate.
Harmful tar residues were not found in the pipelines of the dryer after hundreds of
hours of operation. In this examination only one PAH compound, naphthalene, was
found, and its concentration was as low as 0.11 ppb (0.00011 ppm). The total amount of
PAH compounds was under 1.0 μg/L (1.0 ppb) for 100% birch chips at a drying
temperature of 130 °C. The PAH content was not measured for softwoods. The PAH
compounds are byproducts of an incomplete combustion, and therefore the formation of
PAH compounds in drying is not likely, at least in range of temperatures considered
(O´Neill 1993). The results from COD measurements contain all other oxidizable
compounds beside carbon. These results were in line with the DOC measurements (Table
5) and were supported by the GC-MS results, which showed that there were very small
amounts of any organic compounds. As observed from the mass spectra of condensate
water, molecular peaks of a few long chain hydrocarbons were at m/z 355, m/z 323, and
m/z 281. Furthermore, there was a small amount of isopropanol. After extraction and
concentrating with 1,2-dichroloethane, the main groups found from the sample were for
example 1-trans-isopro-penyl-4-methyl-2-methylene cyclohexane, 1,2-dimethoxy-4-
prop-2-en-1-ylbenzene, and 2,4-bis(1,1-dimethyl)-phenol.
Variations in the drying temperature had no effect on the quality of condensate
water, at least when the drying temperature stayed at 130 °C or below. There was also no
effect on the condensate quality from the wood species employed other than pH and a
slight variation in electrical conductivity presented above. Finally, the electrical
conductivity of softwood condensate samples was larger than in hardwood water
samples. This indicates that condensate from the softwood contained more ions than the
condensing waters from the hardwood.
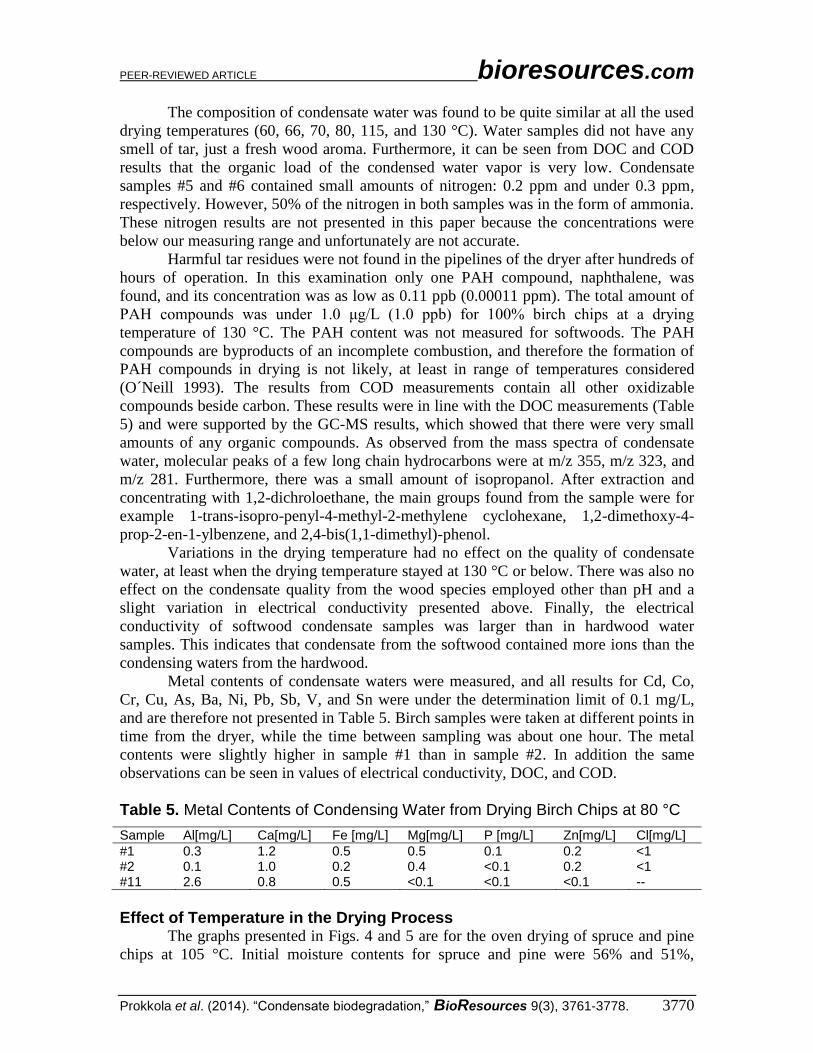
Metal contents of condensate waters were measured, and all results for Cd, Co,
Cr, Cu, As, Ba, Ni, Pb, Sb, V, and Sn were under the determination limit of 0.1 mg/L,
and are therefore not presented in Table 5. Birch samples were taken at different points in
time from the dryer, while the time between sampling was about one hour. The metal
contents were slightly higher in sample #1 than in sample #2. In addition the same
observations can be seen in values of electrical conductivity, DOC, and COD.
Table 5. Metal Contents of Condensing Water from Drying Birch Chips at 80 °C
Sample Al[mg/L] Ca[mg/L] Fe [mg/L] Mg[mg/L] P [mg/L] Zn[mg/L] Cl[mg/L]
#1 0.3 1.2 0.5 0.5 0.1 0.2 <1 #2 0.1 1.0 0.2 0.4 <0.1 0.2 <1 #11 2.6 0.8 0.5 <0.1 <0.1 <0.1 --
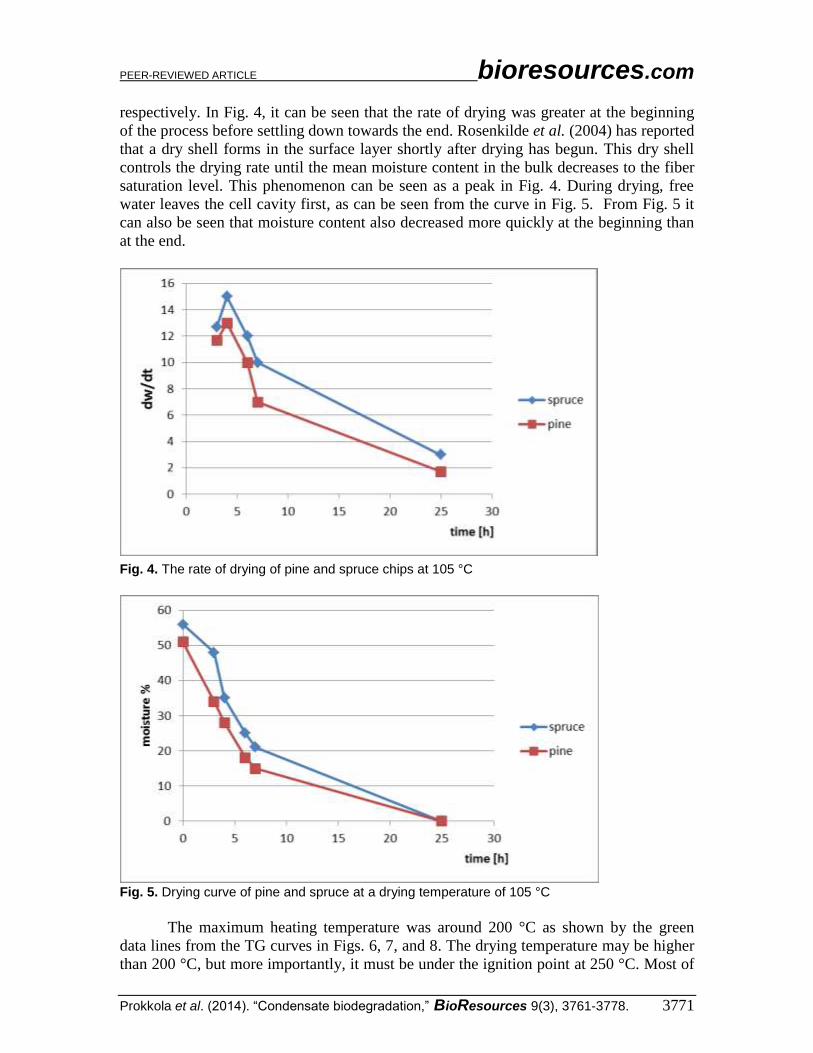
Effect of Temperature in the Drying Process The graphs presented in Figs. 4 and 5 are for the oven drying of spruce and pine
chips at 105 °C. Initial moisture contents for spruce and pine were 56% and 51%,
PEER-REVIEWED ARTICLE bioresources.com
Prokkola et al. (2014). “Condensate biodegradation,” BioResources 9(3), 3761-3778. 3771
respectively. In Fig. 4, it can be seen that the rate of drying was greater at the beginning
of the process before settling down towards the end. Rosenkilde et al. (2004) has reported
that a dry shell forms in the surface layer shortly after drying has begun. This dry shell
controls the drying rate until the mean moisture content in the bulk decreases to the fiber
saturation level. This phenomenon can be seen as a peak in Fig. 4. During drying, free
water leaves the cell cavity first, as can be seen from the curve in Fig. 5. From Fig. 5 it
can also be seen that moisture content also decreased more quickly at the beginning than
at the end.
Fig. 4. The rate of drying of pine and spruce chips at 105 °C
Fig. 5. Drying curve of pine and spruce at a drying temperature of 105 °C
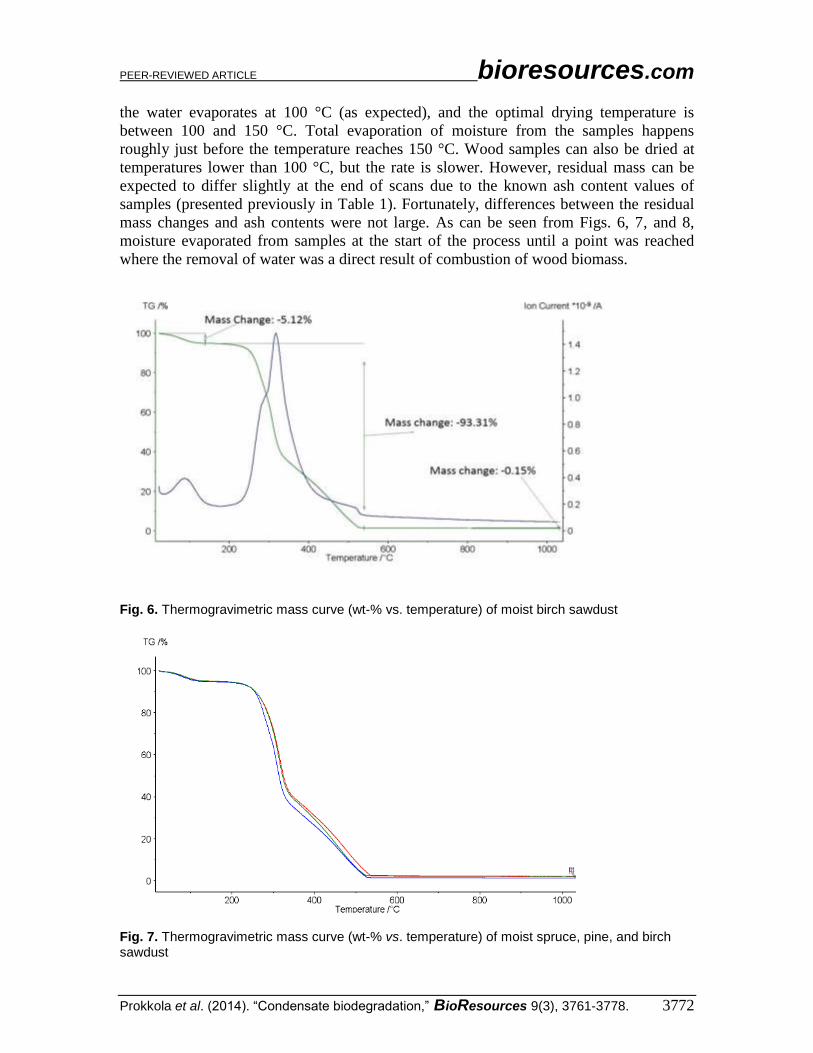
The maximum heating temperature was around 200 °C as shown by the green
data lines from the TG curves in Figs. 6, 7, and 8. The drying temperature may be higher
than 200 °C, but more importantly, it must be under the ignition point at 250 °C. Most of
PEER-REVIEWED ARTICLE bioresources.com
Prokkola et al. (2014). “Condensate biodegradation,” BioResources 9(3), 3761-3778. 3772
the water evaporates at 100 °C (as expected), and the optimal drying temperature is
between 100 and 150 °C. Total evaporation of moisture from the samples happens
roughly just before the temperature reaches 150 °C. Wood samples can also be dried at
temperatures lower than 100 °C, but the rate is slower. However, residual mass can be
expected to differ slightly at the end of scans due to the known ash content values of
samples (presented previously in Table 1). Fortunately, differences between the residual
mass changes and ash contents were not large. As can be seen from Figs. 6, 7, and 8,
moisture evaporated from samples at the start of the process until a point was reached
where the removal of water was a direct result of combustion of wood biomass.
Fig. 6. Thermogravimetric mass curve (wt-% vs. temperature) of moist birch sawdust
Fig. 7. Thermogravimetric mass curve (wt-% vs. temperature) of moist spruce, pine, and birch sawdust
PEER-REVIEWED ARTICLE bioresources.com
Prokkola et al. (2014). “Condensate biodegradation,” BioResources 9(3), 3761-3778. 3773
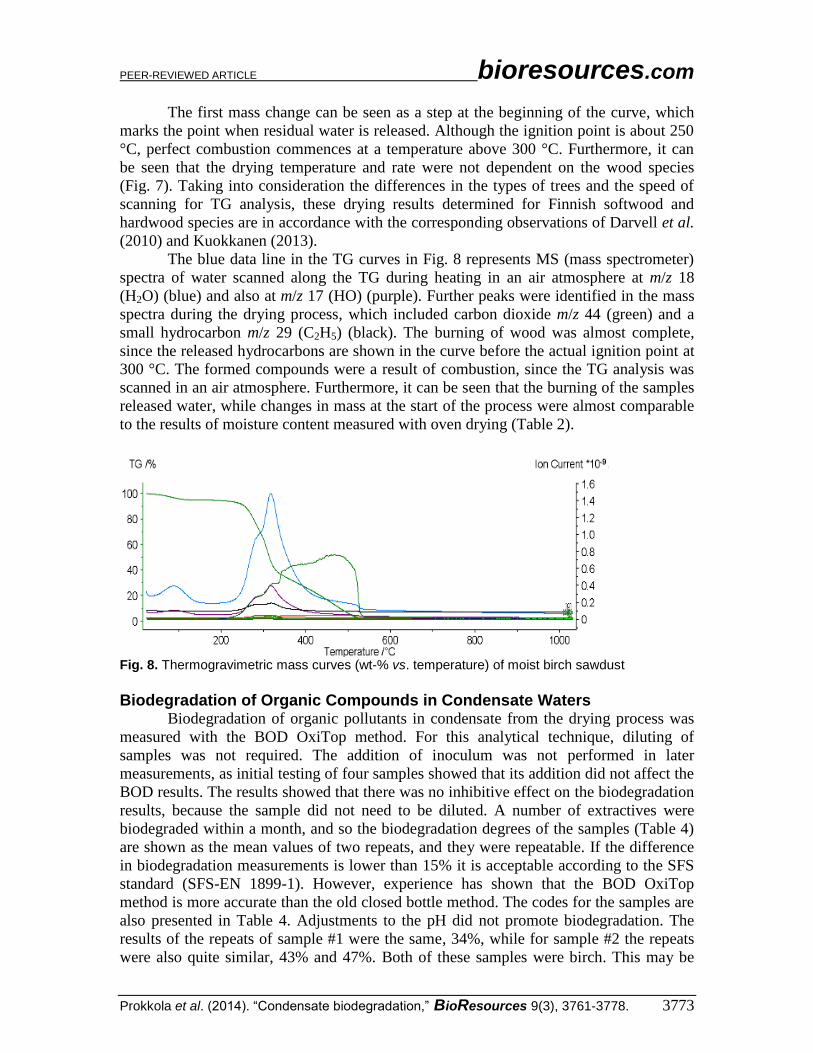
The first mass change can be seen as a step at the beginning of the curve, which
marks the point when residual water is released. Although the ignition point is about 250
°C, perfect combustion commences at a temperature above 300 °C. Furthermore, it can
be seen that the drying temperature and rate were not dependent on the wood species
(Fig. 7). Taking into consideration the differences in the types of trees and the speed of
scanning for TG analysis, these drying results determined for Finnish softwood and
hardwood species are in accordance with the corresponding observations of Darvell et al.
(2010) and Kuokkanen (2013).
The blue data line in the TG curves in Fig. 8 represents MS (mass spectrometer)
spectra of water scanned along the TG during heating in an air atmosphere at m/z 18
(H2O) (blue) and also at m/z 17 (HO) (purple). Further peaks were identified in the mass
spectra during the drying process, which included carbon dioxide m/z 44 (green) and a
small hydrocarbon m/z 29 (C2H5) (black). The burning of wood was almost complete,
since the released hydrocarbons are shown in the curve before the actual ignition point at
300 °C. The formed compounds were a result of combustion, since the TG analysis was
scanned in an air atmosphere. Furthermore, it can be seen that the burning of the samples
released water, while changes in mass at the start of the process were almost comparable
to the results of moisture content measured with oven drying (Table 2).
Fig. 8. Thermogravimetric mass curves (wt-% vs. temperature) of moist birch sawdust
Biodegradation of Organic Compounds in Condensate Waters Biodegradation of organic pollutants in condensate from the drying process was
measured with the BOD OxiTop method. For this analytical technique, diluting of
samples was not required. The addition of inoculum was not performed in later
measurements, as initial testing of four samples showed that its addition did not affect the
BOD results. The results showed that there was no inhibitive effect on the biodegradation
results, because the sample did not need to be diluted. A number of extractives were
biodegraded within a month, and so the biodegradation degrees of the samples (Table 4)
are shown as the mean values of two repeats, and they were repeatable. If the difference
in biodegradation measurements is lower than 15% it is acceptable according to the SFS
standard (SFS-EN 1899-1). However, experience has shown that the BOD OxiTop
method is more accurate than the old closed bottle method. The codes for the samples are
also presented in Table 4. Adjustments to the pH did not promote biodegradation. The
results of the repeats of sample #1 were the same, 34%, while for sample #2 the repeats
were also quite similar, 43% and 47%. Both of these samples were birch. This may be
PEER-REVIEWED ARTICLE bioresources.com
Prokkola et al. (2014). “Condensate biodegradation,” BioResources 9(3), 3761-3778. 3774
due to the point in time when the samples were taken from batch dryer. At the beginning
of the process, the water contained more pollutants compared to the end of the process.
The results of the biodegradation degrees of sample #3 (pine 20% and aspen 80%) were
similar, 60% and 57%, but when the pH was adjusted to 7.7 the repeat only gave 46%.
Another pine and aspen sample #4 had some variation in the repeat results, 41 % and 45
%, but when the pH was adjusted to 7.2, the biodegradation degree was 35 %. However,
between samples #3 and #4 the results were quite different. As can be seen from these
results the condensate samples contained varying amounts of organic pollutants. It should
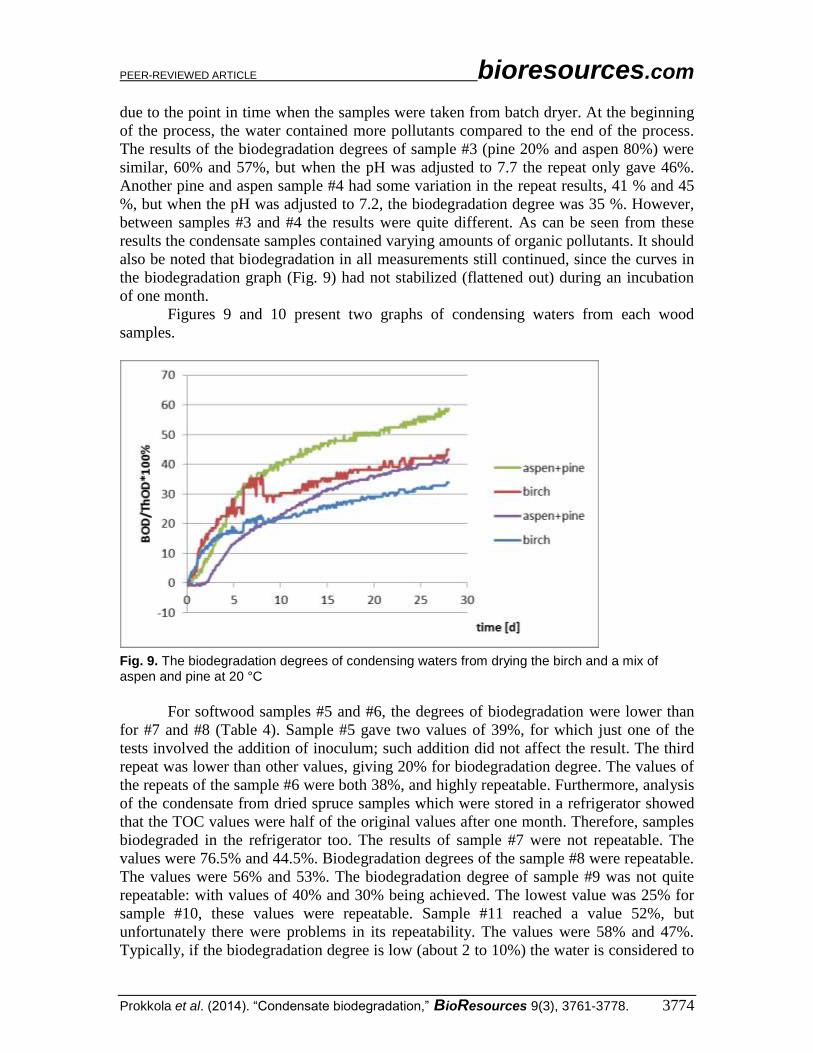
also be noted that biodegradation in all measurements still continued, since the curves in
the biodegradation graph (Fig. 9) had not stabilized (flattened out) during an incubation
of one month.
Figures 9 and 10 present two graphs of condensing waters from each wood
samples.
Fig. 9. The biodegradation degrees of condensing waters from drying the birch and a mix of aspen and pine at 20 °C
For softwood samples #5 and #6, the degrees of biodegradation were lower than
for #7 and #8 (Table 4). Sample #5 gave two values of 39%, for which just one of the
tests involved the addition of inoculum; such addition did not affect the result. The third
repeat was lower than other values, giving 20% for biodegradation degree. The values of
the repeats of the sample #6 were both 38%, and highly repeatable. Furthermore, analysis
of the condensate from dried spruce samples which were stored in a refrigerator showed
that the TOC values were half of the original values after one month. Therefore, samples
biodegraded in the refrigerator too. The results of sample #7 were not repeatable. The
values were 76.5% and 44.5%. Biodegradation degrees of the sample #8 were repeatable.
The values were 56% and 53%. The biodegradation degree of sample #9 was not quite
repeatable: with values of 40% and 30% being achieved. The lowest value was 25% for
sample #10, these values were repeatable. Sample #11 reached a value 52%, but
unfortunately there were problems in its repeatability. The values were 58% and 47%.
Typically, if the biodegradation degree is low (about 2 to 10%) the water is considered to
PEER-REVIEWED ARTICLE bioresources.com
Prokkola et al. (2014). “Condensate biodegradation,” BioResources 9(3), 3761-3778. 3775
be toxic, which is not the case in this study. There are also some toxicity tests (Microtox)
available, but in practice these results clearly indicate that these condensing waters were
not toxic before the biodegradation measurement. However, it is possible that the reaction
products may be toxic although the reactants are not toxic. Furthermore, there were no
pH adjustments in any of these samples, whilst nitrogen content in two samples was
negligible, and so this is not included in the calculations. One explanation often given for
the jumps in the curves is due to a change in the temperature in the incubation chamber
during the measurement, but this would show in all the graphs. A better explanation than
a temperature jump is the sample itself. We are dealing with a biological system, not
solely a chemical one and so we cannot control everything that happens in the reaction
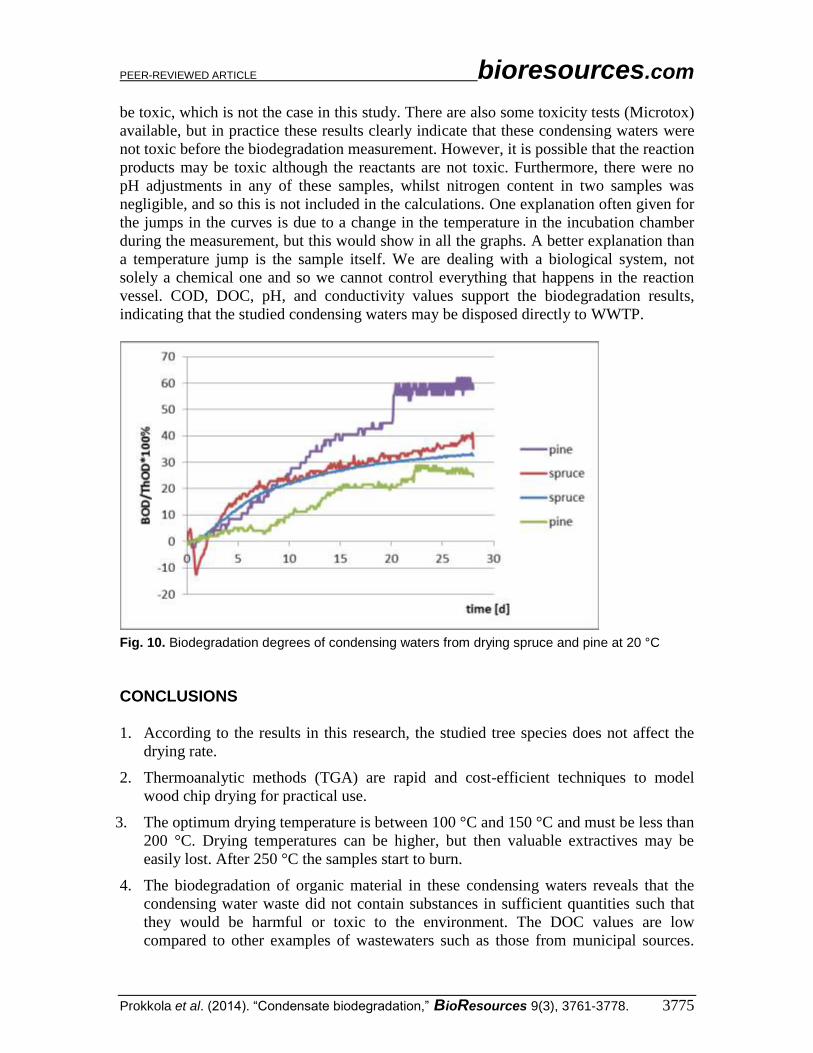
vessel. COD, DOC, pH, and conductivity values support the biodegradation results,
indicating that the studied condensing waters may be disposed directly to WWTP.
Fig. 10. Biodegradation degrees of condensing waters from drying spruce and pine at 20 °C
CONCLUSIONS
1. According to the results in this research, the studied tree species does not affect the
drying rate.
2. Thermoanalytic methods (TGA) are rapid and cost-efficient techniques to model
wood chip drying for practical use.
3. The optimum drying temperature is between 100 °C and 150 °C and must be less than
200 °C. Drying temperatures can be higher, but then valuable extractives may be
easily lost. After 250 °C the samples start to burn.
4. The biodegradation of organic material in these condensing waters reveals that the
condensing water waste did not contain substances in sufficient quantities such that
they would be harmful or toxic to the environment. The DOC values are low
compared to other examples of wastewaters such as those from municipal sources.
PEER-REVIEWED ARTICLE bioresources.com
Prokkola et al. (2014). “Condensate biodegradation,” BioResources 9(3), 3761-3778. 3776
Therefore, they can be disposed directly to WWTP, however in some cases toxicity
tests still need to be done first.
5. The biodegradation degrees of organic material in condensing waters from inverse
dryers were determined to be between 25% and 61%. So, the composition of the
pollutants in condensate varies largely.
6. Adjusting the pH from about 5 to the range 7.2 to 7.7 did not affect the
biodegradation of pollutants in condensing waters.
7. Condensate waters do not need the addition of extra inoculum for a biodegradation
reaction.
8. The condensate water samples can also biodegrade in the refrigerator (1 to 4 °C) too.
9. Condensate waters from birch drying contained a very small amount of PAH
compounds (0.11 ppb).
10. Some of the organic components of condensing water can be identified with mass
spectroscopy.
ACKNOWLEDGEMENTS
The authors wish to thank M.Sc. Tommi Kokkonen and M.Sc. Riku Mattila from
University of Oulu for their co-operation in TG analysis, Pekka Ahvensalmi from Gasek
Oy Finland for experiments in wood chips drying, the technical staff of the Trace
Element Laboratory at the University of Oulu for the chemical analysis, and Päivi
Joensuu for GC-MS experiments. The authors acknowledge HighBio2 project “Biomass
to fuels and chemicals” (EU Interreg funding, 304-8455-10) and accompanying
companies for financial and technical support. Thanks also to Mark Jackson for revising
the language.
REFERENCES Banerjee, S. (2001). “Mechanisms of terpene release during sawdust and flake drying,”
Holzforschung 55(4), 413-416.
Bengtsson, P. (2004), “The release of hydrocarbons from softwood drying: Measurement
and modeling,” Maderas, Ciencia y tecnologia, 6(2), 109-122.
Bhat, M. K., and Bhat, S. (1997). “Cellulose degrading enzymes and their potential
industrial applications,” Biotechnology Advances 15(3/4), 583-620.
Burnett, R. T., Smith-Doiron, M., Stieb, D., Cakmak, S., and Brook, J. R. (1999).
“Effects of particulate and gaseous air pollution on cardiorespiratory
hospitalizations,” Arch. Environ. Health 54(2), 130-139.
Darvell, L. I., Jones, J. M., Gudka, B., Baxter, X. C., Williams, A., and Malmgren, A.
(2010). “Combustion properties of some power station biomass fuels,” Fuel 89(12),
2881-2890.
Fagernäs, L., Brammer, J., Wileń, C., Lauer, M., and Verhoeff, F. (2010). “Drying of
PEER-REVIEWED ARTICLE bioresources.com
Prokkola et al. (2014). “Condensate biodegradation,” BioResources 9(3), 3761-3778. 3777
biomass for second generation synfuel production,” Biomass and Bioenergy 34(9),
1267-1277.
Granström, K. M., and Månson, B. (2008). “Volatile organic compounds emitted from
hardwood drying as a function of processing parameters,” International Journal of
Environmental Science and Technology 5(2), 141-148.
Heath, R. L. (1980). “Initial events in injury to plants and air-pollutants,” Annu. Rev.
Plant Phys. 31, 395-431.
Jirjis, R. (1995). “Storage and drying of wood fuel,” Biomass and Bioenergy 9(1-5), 181-
190.
Knoef, H. A. M. (2005). Handbook of Biomass Gasification, BTG Biomass Technology
Group, Netherlands, pp. 1-73.
Krupnick, A. J., Harrington, W., and Ostro, B. (1990). “Ambient ozone and acute health-
effects – Evidence from daily data,” 18: 1-18.
Kuokkanen, M. (2009). “Chemical methods in the development of eco-efficient wood-
based pellet production and technology,” Waste Managements and Research 27,
561-571.
Kuokkanen, M., Vilppo, T., Kuokkanen, T., Stoor, T., and Niinimäki, J. (2011).
“Additives in wood pellet production – A pilot-scale study of binding agent usage,”
BioResources 6(4), 4331-4355.
Kuokkanen, M. (2014). “Development of an eco- and material-efficient pellet production
chain – A chemical study,” Doctoral thesis, University of Oulu, Finland, Acta
Universitatis Ouluensis, URI; http://urn.fi/urn:isbn:9789526201047. Cited
2014/4/15.
Kuokkanen, T., Vähäoja, P., Välimäki, I., and Lauhanen R. (2004). “Suitability of the
respirometric BOD OxiTop method for determining the biodegradability of oils in
ground water using forestry hydraulic oils as model compounds,” Intern. J. Environ.
Anal. Chem. 84(9), 677-689.
Laurence, J. A., and Weinstein, L. H. (1981). “Effects of air-pollutants on plant
productivity,” Annu. Rev. Phytopathol. 19, 257-271.
Lehtikangas, P. (2006). “Storage effects on pelletized sawdust, logging residues and
bark,” Biomass and Bioenergy 19(5), 287-293.
Levy, J. I., Carrothers, T. J. Tuomisto, J. T., Hammit, J. K., and Evans, J. S. (2001).
“Assessing the public health benefits of reduced ozone concentrations,” Environ.
Health Persp. 109(12), 1215-1226.
McDonald, A. G., Gifford, J. S., Dare, P. H., and Steward, D. (1999). “Characterization
of the condensate generated from vacuum-drying of radiate pine wood,” Holz als
Roh- und Werkstoff 57(4), 251-258.
McKendry, P. (2002). “Energy production from biomass (Part 3): Gasification
technologies,” Bioresource Technology 83(1), 55-63.
Milota, M. R. (2000). “Emissions from wood drying – The science and the issues,”
Forest Products Journal 50(6), 10-20.
O´Neill, P. (1993). Environmental Chemistry, 2nd
edition, University of Plymouth,
Department of Environmental Sciences, Plymouth, UK, Chapman & Hall, 268 pp.
Peden, D. B. (2002). “Pollutants and asthma: Role of air toxics,” Environ. Health
Persp.110(4), 565-568.
Prokkola, H., Kuokkanen, T., and Lassi, U. (2012). “Material-efficient utilization of
PEER-REVIEWED ARTICLE bioresources.com
Prokkola et al. (2014). “Condensate biodegradation,” BioResources 9(3), 3761-3778. 3778
waste oils – Biodegradability and other chemical properties of vegetable recycling
oils,” Green and Sustainable Chemistry 2(4), 133-140.
Roppola, K., Kuokkanen, T., Nurmesniemi, H., Rämö, J., Pöykiö, R., and Prokkola, H.,
(2006). “Comparison study of manometric respirometric test and common chemical
methods in the determination of BOD7 in a pulp and paper mill´s wastewaters,”
Journal of Automated Methods and Management in Chemistry, Article ID 90384, 1-5,
DOI 10.1155/JAMMC/2006/90384.
Rosenkilde, A., Gorce, J.-P., and Barry, A. (2004). “Measurement of moisture content
profiles during drying of Scots pine using magnetic resonance imaging,”
Holzforschung 58, 138-142.
Rupar, K., and Sanati, M. (2003). “The release of organic compounds during biomass
drying depends upon the feedstock and/or altering drying heating medium,” Biomass
and Bioenergy 25(6), 615-622.
Samuelsson, R., Burvall, J., and Jirjis, R. (2006). “Comparison of different methods for
the determination of moisture content of biomass,” Biomass and Bioenergy 30(11),
929-934.
SFS-EN 14774-2:en. “Solid biofuels. Determination of moisture content. Oven dry
method. Part 2: Total moisture. Simplified method”.
SFS-EN 1899-1:1998. “Water quality – Determination of biochemical oxygen demand
after n days (BODn) – Part 1: Dilution and seeding method with allylthiourea
addition (ISO 5815:1989, modified)”.
Ståhl, M., Granström, K., Berghel, J., and Renström, R. (2004). “Industrial processes for
biomass drying and their effects on the quality properties of wood pellets,” Biomass
and Bioenergy 27(6), 621-628.
Thuvander, F., Kifetew, G., and Berglund, L. A. (2002). “Modeling of cell wall drying
stresses in wood,” Wood Science and Technology 36(3), 241-254.
Article submitted: January 22, 2014; Peer review completed: March 27, 2014; Revised
version received: April 30, 2014; Accepted: May 1, 2014; Published: May 5, 2014.