Embed Size (px)
Citation preview
PEER-REVIEWED ARTICLE bioresources.com
Nasr et al. (2013). “Anaerobic biohydrogen production,” BioResources 8(4), 4951-4968. 4951
Biological Hydrogen Production from Starch Wastewater Using a Novel Up-flow Anaerobic Staged Reactor
Mahmoud Nasr,a,* Ahmed Tawfik,
a Shinichi Ookawara,
a,b and Masaaki Suzuki
a, b
Continuous and batch tests were conducted to evaluate fermentative biohydrogen production from starch wastewater via a mesophillic up-flow anaerobic staged reactor (UASR). The effects of organic loading rate (OLR) and food to micro-organisms ratio (F/M) on hydrogen yield (HY) and hydrogen production rate (HPR) were investigated. The bioreactor was continuously operated at a constant hydraulic retention time (HRT) of 6.7 h. The optimal OLR and F/M ratios were 54 g-COD/L.d and 1.4 g-COD/g-VSS.d, respectively. The maximum HY and HPR were 1.87 mol-H2/mol-glucose and 246 mmol-H2/L.d, respectively. Batch experimental results indicated that the optimal initial cultivation pH ranged from 5.5 to 6.5 with a hydrogen potential (P) of 1435-1420 mL-H2, while the initial substrate concentration of 20 g-starch/L showed a maximum HPR (Rm) of 300 mL-H2/h. Zero, 1
st and 2
nd order kinetic studies were used to
develop a model of the experimental data. The 2nd
order model adequately fitted with the experimental results (R
2>0.97) better than
those for a zero- or a 1st order kinetic reaction.
Keywords: Bio-energy; High strength organic wastewater; Optimum condition for anaerobic treatment;
F/M ratio
Contact information: a: Egypt-Japan University of Science and Technology (E-JUST); Department of
Energy Resources and Environmental Engineering; P.O. Box 179 – New Borg El Arab City – Postal Code
21934 - Alexandria – Egypt; b: Tokyo Institute of Technology. 2-12-1, O-okayama, Meguro-ku, Tokyo 152-
8552, Japan; *Corresponding author: [email protected]; [email protected]
INTRODUCTION
The starch processing industry consumes a lot of water, resulting in a huge
amount of industrial wastewater. Unfortunately, this wastewater is mainly discharged
into sewerage networks without any treatment, which causes serious environmental
pollution problems. The chemical oxygen demand (COD) levels of starch wastewater
range from 10 to 30 g/L, and it undoubtedly imposes heavy loads on the environment,
causing high expenses in terms of sewer disposal (Jin et al. 2002). Fortunately, starch
wastewater is rich with biodegradable organic matter and its temperature is relatively
high (35 to 40 °C). Moreover, starch wastewater contains a high percentage of
carbohydrates, cellulose, protein, and nutrients, representing an important energy-rich
source that can potentially be converted to a wide variety of useful products. A
bioconversion process is an advantaged way to recover useful resources from starch
wastewater, especially to produce more valuable products, such as microbial biomass
protein (Jamuna and Ramakrishna 1989) and biopesticide (Lu et al. 2007). However, end
users hesitate to use the microbial biomass protein because of its unappetizing taste, high
nucleic acid content, and slow rate of digestion. The high production cost and technical
barriers to large-scale implementation also limit the application of biopesticides (Lee et
PEER-REVIEWED ARTICLE bioresources.com
Nasr et al. (2013). “Anaerobic biohydrogen production,” BioResources 8(4), 4951-4968. 4952
al. 2008). Therefore, it is worthwhile to find a promising sustainable approach for
simultaneous treatment and conversion of starch wastewater into renewable energy in the
form of H2. Hydrogen energy has been recognized to be environmentally safe and an
alternative to fossil fuel (Singh et al. 1994). It has triple the energy yield of conventional
hydrocarbon fuels per unit mass (Rifkin 2002). In the course of its combustion, hydrogen
produces only water without harmful emissions such as CO, CO2, hydrocarbons, or fine
particles (Liu 2008). The dark fermentation process for hydrogen production of starch
wastewater has been extensively investigated for its advantageous low operational cost
and effectiveness. The rate of hydrogen production using an anaerobic fermentation
process depends on several parameters such as pH, substrate concentration, and hydraulic
retention time (HRT) (Kumar and Das 2001; Wu et al. 2006). The optimum conditions
for maximum hydrogen and acetic acid production from starch processing wastewater
using a mixed culture of anaerobes have been reported as 0.56 day HRT, pH 5.9, and
36.1 °C (Lee et al. 2004). Zhang et al. (2003) found that an increase in starch
concentration of the influent resulted in a decrease of acetic acid but an increase in
butyric acid production. Arooj et al. (2008) concluded that only butyrate concentration
instead of butyrate to acetate ratio (B/A) governs the trend of hydrogen yield (HY) at
short HRTs. Moreover, the study stated that the highest HY of 0.92 mol-H2/mol-glucose-
added was achieved from starch wastewater at a HRT of 12 h. Due to the accumulation of
VFAs in the reactors, the pH decreased from 8 to 5, inhibiting the production of methane
and enhancing the hydrogen production (Tawfik and Salem 2012). The optimum pH, iron
concentration, and nitrogen concentration for hydrogen production from starch
wastewater at a substrate concentration of 15 g/L were 7.0 to 8.0, Fe2+
10 mg/L, and
NH4HCO3 5.64 g/L, respectively (Liu and Shen 2004). Lo et al. (2008) found that
combining enzymatic hydrolysis, dark fermentation, and photo-fermentation led to a
marked improvement of overall H2 yield (up to 16.1 mmol-H2/g-COD or 3.09 mol-
H2/mol-glucose) and COD removal efficiency (54.3%), suggesting the potential of using
the proposed integrated process for efficient and high-yield biohydrogen production from
starch feedstock.
This study presents anaerobic degradation of starch wastewater using an up-flow
anaerobic staged reactor (UASR). This reactor is economically feasible, simple, and
applicable for hydrogen energy production from wastes (Tawfik et al. 2013; Nasr et al.
2012). Moreover, the main advantages of this bioreactor are rapid biodegradation, low
yields of sludge, excellent process stability, reduced land area required, and easy
construction. Therefore, the aim of this investigation is to assess the performance of the
UASR for continuous hydrogen production from starch wastewater with emphasis on the
COD removal and carbohydrate conversion. Factors affecting on hydrogen production
rate were extensively investigated.
EXPERIMENTAL
Seed Microorganisms The bacterial culture (sludge) used in this study was enriched from the thickener
of a sewage treatment plant situated in Alexandria, Egypt. The harvested sludge was
allowed to settle for 24 h. The supernatant was withdrawn and the concentrate was boiled
at 90 ºC for 30 min to inhibit the bioactivity of hydrogen consumers (Hafez et al. 2010).
The organisms responsible for hydrogen production were dominated by Clostridium
PEER-REVIEWED ARTICLE bioresources.com
Nasr et al. (2013). “Anaerobic biohydrogen production,” BioResources 8(4), 4951-4968. 4953
pasteurianum, which is resistant to high temperatures. The pH and volatile suspended
solids (VSS) concentration were 7.4 and 38 g/L, respectively for the inoculums sludge.
The UASR was inoculated with 10 L sludge, which represented 40% of the total reactor
volume.
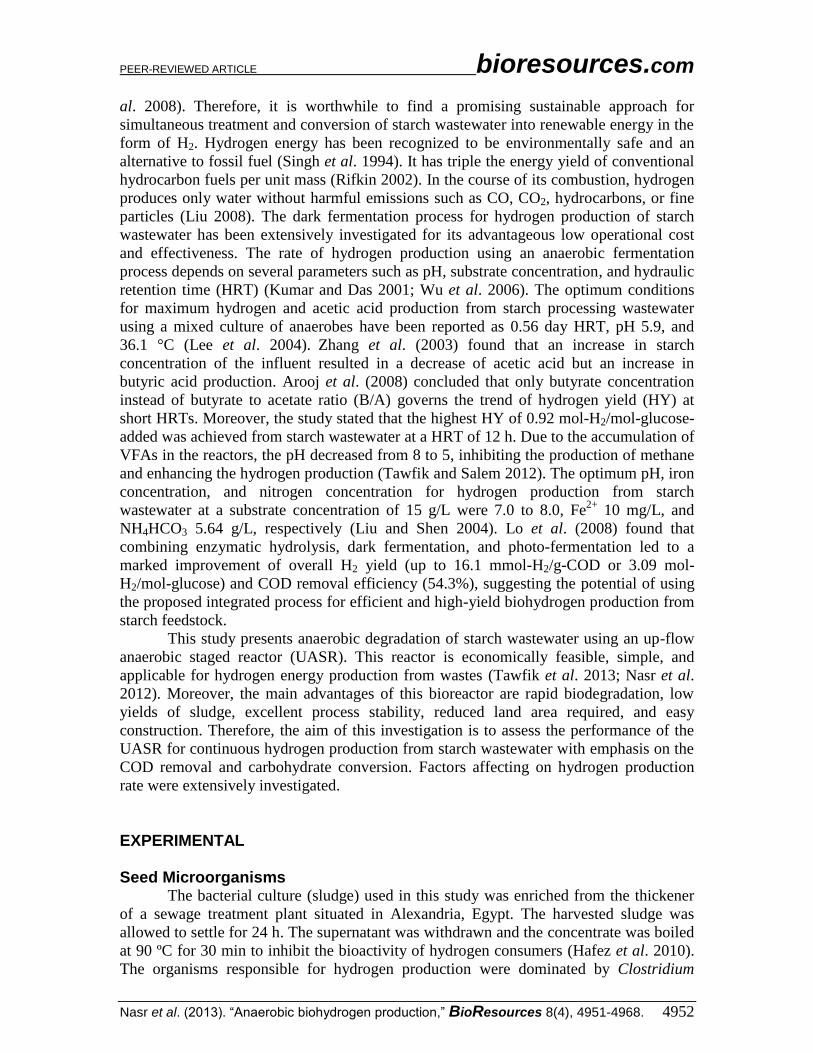
Bioreactor and substrate Figure 1 shows the schematic of the up-flow anaerobic staged reactor (UASR)
used in this study. The working volume of the reactor was 28 L. The reactor dimensions
were 19.5 cm in length, 19.5 cm in width, and 75 cm in height. The reactor was
manufactured from Perspex material with a pyramid shape at the bottom. The reactor was
provided by inclined baffles to increase the contact time between the H2 producing
bacteria and the influent substrate. Five sampling ports were distributed along the height
of the reactor in order to assess the intermediate products, pH, and the residual COD
concentrations. The gas volume was daily measured by a gas meter (Drum type –
thermometer – packing fluid). The wastewater was continuously stirred to avoid
precipitation of coarse suspended solids, and the temperature was maintained at 35 °C
using a controlled thermostatic heater.
Fig. 1. Schematic diagram of an up-flow anaerobic staged reactor (UASR) used for (a) continuous and (b) batch experiments
Starch wastewater was used as the sole substrate throughout the study. Waste-
water was collected from a starch manufacturing company situated in 10th
Ramadan city,
Egypt. The substrate was diluted with tap water to attain COD concentrations in a range
from 5 to 30 g/L. The characteristics of starch wastewater used in the experiments are
presented in Table 1.
PEER-REVIEWED ARTICLE bioresources.com
Nasr et al. (2013). “Anaerobic biohydrogen production,” BioResources 8(4), 4951-4968. 4954
Table 1. Characteristics of the Starch Processing Wastewater Used in the Experiments
Parameters COD (g/L) Carbohydrates (g/L)
Nitrogen (mg/L) TSS (g/L) pH
Total soluble Total soluble NH4-N TKj-N
Values 5–30 1–6 4.25–25.5
0.85–5.1 20–60 82–148 2.8–18 6.4–6.8
COD: Chemical oxygen demand; NH4–N: Ammonium nitrogen; TKj-N: Total Kjeldahl nitrogen; TSS: Total suspended solid
Experimental Procedures Continuous experiments
Continuous experiments were conducted to investigate the effect of different
organic loading rates (OLRs) of 18, 36, 54, 72, and 108 g-COD/L.d and food to
microorganism (F/M) ratios of 0.5, 0.9, 1.4, 1.9, and 2.8 (g-COD/g-VSS.d) on the
hydrogen production from starch wastewater using UASR.
The bioreactor was operated at a constant hydraulic retention time (HRT) of 6.7 h.
Steady-state operating conditions were reached after 3 months when hydrogen gas
content and effluent volatile fatty acids (VFAs) concentration were stable (less than 10%
variation).
Batch experiments
After operating the reactor continuously for 6 months, the influent wastewater
was stopped. The supernatant was withdrawn leaving hydrogen-producing bacteria in the
reactor. Afterwards, the reactor was operated without an acclimatization period in a
closed cycle for 24 h. Two series of experiments were conducted in the UASR at a
temperature of 35 °C.
Series 1 examined the effect of pH (from 4.5 to 8.5 in increments of 1.0) on the
treatment of wastewater containing 15 g-starch/L.
Experiments in series 2 investigated hydrogen production at different substrate
concentration of 5, 10, 15, 20, and 30 g-starch/L and a constant pH of 6.5.
Calculations
The daily volumetric and specific hydrogen production rate and hydrogen yield
were calculated by the following equations (1), (2), and (3),
V
VVHPR
H2 (1)
where VHPR is the volumetric hydrogen production rate (mL-H2/L.d), VH2 is the daily
hydrogen gas production (mL-H2/d), and V is the volume of inocula (L)
VX
VSHPR
H
.2 (2)
In Eq. 2, SHPR is the specific hydrogen production rate (mL-H2/g-biomass.d), and X is
the biomass concentration in the inocula at steady-state (g-VSS/L),
PEER-REVIEWED ARTICLE bioresources.com
Nasr et al. (2013). “Anaerobic biohydrogen production,” BioResources 8(4), 4951-4968. 4955
SSQ
VHY
H
0
2 (3)
where HY is the hydrogen yield (mL-H2/g-COD or mol-H2/mol-glucose); Q is the feed
flow rate (L/d), and S0 and S are the influent and effluent of total COD concentrations
(g/L). HY was calculated based on the glucose/COD ratio (0.94) and the molecular
weight of glucose (180 g/mol).
Kinetic studies
The modified Gompertz equation was used to fit the cumulative hydrogen
production in each batch experiment (Zwietering et al. 1990). This was found to be a
suitable equation for describing the progress of cumulative hydrogen production obtained
from a batch experiment, where H represents the cumulative hydrogen production, P is
the hydrogen potential (mL-H2), Rm is the maximum hydrogen production rate (mL-
H2/h), t is the incubation time (h), and λ is the duration of the lag phase (h). The values of
P, Rm, and λ for each batch experiment were determined by best fitting the hydrogen
production data for equation (4).
}1)(.
expexp{.)(
t
P
eRPtH
m (4)
Kinetic modeling is an analytical approach to describe the specific parameters
affecting HY and HPR. The results of kinetic studies obtained from experimental data
can be certainly used for estimating treatment efficiencies of full-scale reactors at the
same operational conditions of HRT and OLR (Debik and Coskun 2009). Moreover,
reaction rates describe the reactor performance and its design. Therefore, in this study
three reaction kinetic models (zero, 1st, and 2
nd order) were used to predict organics
removal and conversion rates in the reactor (Tchobanoglous et al. 2003). In order to
determine the kinetic coefficients, a graph was plotted with time (h) on x-axis and S, -
ln(S/So), and 1/S on the y-axis for zero, 1st, and 2
nd order reaction, respectively.
Analytical Methods Chemical oxygen demand (COD), ammonium nitrogen (NH4–N), total Kjehldal
nitrogen (TKj-N), and volatile suspended solids (VSS) were analyzed in the influent and
the effluent twice a week. All analyses were carried out according to APHA (1998).
Soluble components were determined by filter paper (0.45 μm-Whatman, 7141-104,
Japan).
The carbohydrate was measured according to the phenol–sulfuric acid method,
using glucose as the standard. Analysis of VFAs in terms of acetate (HAc) and butyrate
(HBu) were performed on a Shimadzu HPLC system (Kyoto, Japan). The
chromatographic system consisted of: degasser (20A5), pump (LC-20AT), column oven
(CTO-20A), and prominences Diode Array Detector (SPD-M20A). The biogas
constituents (H2, CO2, and CH4) were analyzed by gas chromatogram (GC, Agilent
4890D) with a thermal conductivity detector (TCD) and a 2.0 m stainless column packed
with Porapak TDS201 (60/80 mesh).
PEER-REVIEWED ARTICLE bioresources.com
Nasr et al. (2013). “Anaerobic biohydrogen production,” BioResources 8(4), 4951-4968. 4956
RESULTS AND DISCUSSION
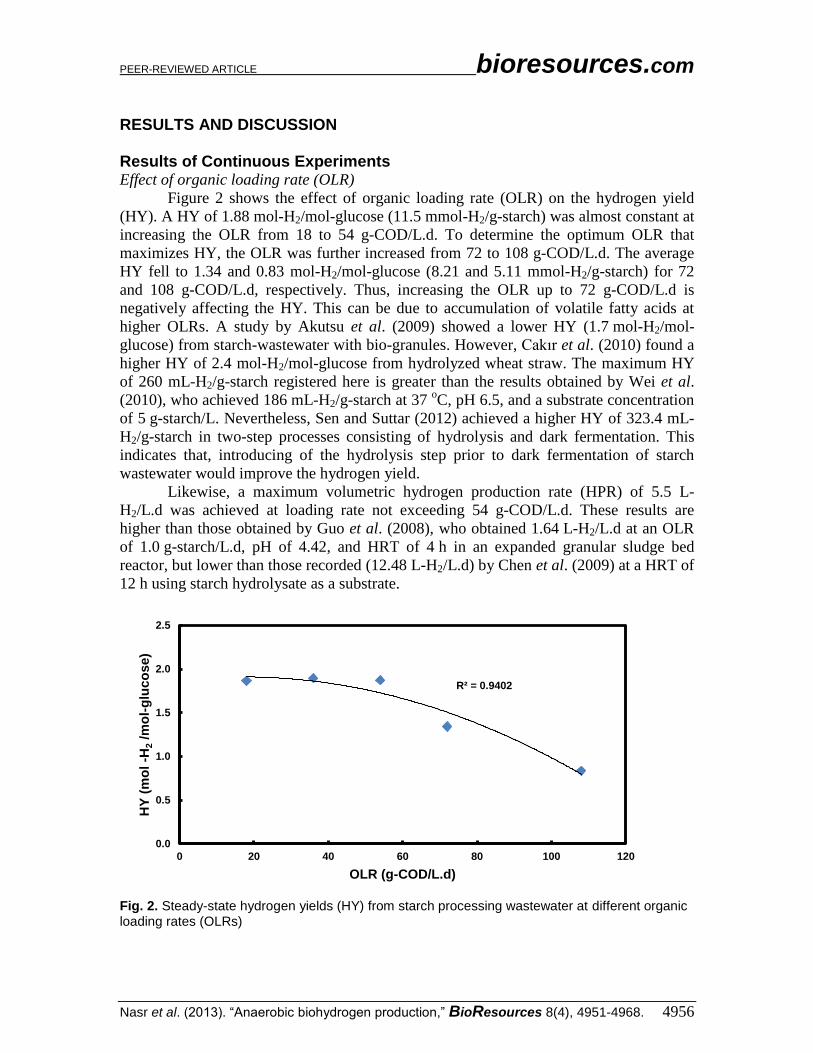
Results of Continuous Experiments Effect of organic loading rate (OLR)
Figure 2 shows the effect of organic loading rate (OLR) on the hydrogen yield
(HY). A HY of 1.88 mol-H2/mol-glucose (11.5 mmol-H2/g-starch) was almost constant at
increasing the OLR from 18 to 54 g-COD/L.d. To determine the optimum OLR that
maximizes HY, the OLR was further increased from 72 to 108 g-COD/L.d. The average
HY fell to 1.34 and 0.83 mol-H2/mol-glucose (8.21 and 5.11 mmol-H2/g-starch) for 72
and 108 g-COD/L.d, respectively. Thus, increasing the OLR up to 72 g-COD/L.d is
negatively affecting the HY. This can be due to accumulation of volatile fatty acids at
higher OLRs. A study by Akutsu et al. (2009) showed a lower HY (1.7 mol-H2/mol-
glucose) from starch-wastewater with bio-granules. However, Cakır et al. (2010) found a
higher HY of 2.4 mol-H2/mol-glucose from hydrolyzed wheat straw. The maximum HY
of 260 mL-H2/g-starch registered here is greater than the results obtained by Wei et al.
(2010), who achieved 186 mL-H2/g-starch at 37 oC, pH 6.5, and a substrate concentration
of 5 g-starch/L. Nevertheless, Sen and Suttar (2012) achieved a higher HY of 323.4 mL-
H2/g-starch in two-step processes consisting of hydrolysis and dark fermentation. This
indicates that, introducing of the hydrolysis step prior to dark fermentation of starch
wastewater would improve the hydrogen yield.
Likewise, a maximum volumetric hydrogen production rate (HPR) of 5.5 L-
H2/L.d was achieved at loading rate not exceeding 54 g-COD/L.d. These results are
higher than those obtained by Guo et al. (2008), who obtained 1.64 L-H2/L.d at an OLR
of 1.0 g-starch/L.d, pH of 4.42, and HRT of 4 h in an expanded granular sludge bed
reactor, but lower than those recorded (12.48 L-H2/L.d) by Chen et al. (2009) at a HRT of
12 h using starch hydrolysate as a substrate.
Fig. 2. Steady-state hydrogen yields (HY) from starch processing wastewater at different organic loading rates (OLRs)
R² = 0.9402
0.0
0.5
1.0
1.5
2.0
2.5
0 20 40 60 80 100 120
HY
(m
ol
-H2 /m
ol-
glu
co
se)
OLR (g-COD/L.d)
PEER-REVIEWED ARTICLE bioresources.com
Nasr et al. (2013). “Anaerobic biohydrogen production,” BioResources 8(4), 4951-4968. 4957
The acetate and butyrate pathways were deduced by using the following
stoichiometric equations,
C6H12O6+2H2O→2CH3COOH+2CO2+4H2, (5)
C6H12O6→CH3CH2CH2COOH+2CO2+2H2, (6)
where production of 1 mol of acetate or butyrate is accompanied by the production of 2
mol of hydrogen.
The results in Table 2 show that, at an OLR of 18 g-COD/L.d, 64% and 36% of
the hydrogen was produced through the acetate and butyrate pathways, respectively. The
acetate (HAc) concentrations increased in the treated effluent from 860 to 1480 mg/L,
while the butyrate varied from 600 to 1110 mg/L, at increasing the OLR from 36 to 54 g-
COD/L.d respectively. Acetate (HAc) and butyrate (HBu) pathways contributed 68 and
32% of the hydrogen production at OLR of 36 g-COD/L.d, and 66 and 34% with OLR of
54 g-COD/L.d, respectively. Furthermore, in OLR of 72 and 108 g-COD/L.d, the acetate
concentration significantly dropped to 780 and 530 mg/L, respectively, and both acetate
and butyrate pathways equally contributed to hydrogen production at 50% each. This
indicates that the generation of volatile fatty acids (VFAs) is OLR dependent. Likely, Lee
et al. (2004) found that acetic acid concentration was increased up to 1681 ± 49 mg/L in
the treated effluent of starch wastewater using a mixed culture of anaerobes at HRT of
0.56 d.
Conversion of starch wastewater to hydrogen gas by dark-fermentation process
occurs in two steps. The first step is the enzymatic hydrolysis of starch containing
wastewater to glucose and maltose. The second reaction is the fermentation of glucose
into volatile fatty acids (VFAs), H2, and CO2 by Clostridium bacteria. Since the
theoretical hydrogen yield (HY) from glucose with acetate formation of 4 mol-H2/mol-
glucose is twice that of butyrate formation, previous studies indicate that the HY
increases with the molar ratio of HAc/HBu (Wang et al. 2008). The steady-state average
molar ratios of HAc/HBu were 1.2, 1.43, and 1.33 for OLRs of 18, 36, and 54 g-
COD/L.d, respectively, but dropped to 0.68 at OLRs of 72 and 108 g-COD/L.d. This
certainly confirmed a peak (HY) of 1.89 mol-H2/mol-glucose at the highest HAc/HBu
ratio of 1.43. Maximum HY of 0.92 mol-H2/mol-glucose-added was observed by Arooj et
al. (2008) in an anaerobic continuous stirred-tank reactor (CSTR) using corn starch as a
substrate at 12 h HRT with HBu/HAc ratio of 4.3. These results suggest the superiority of
UASR for HY from starch wastewater at a short HRT of 6.7 h, as compared to CSTR.
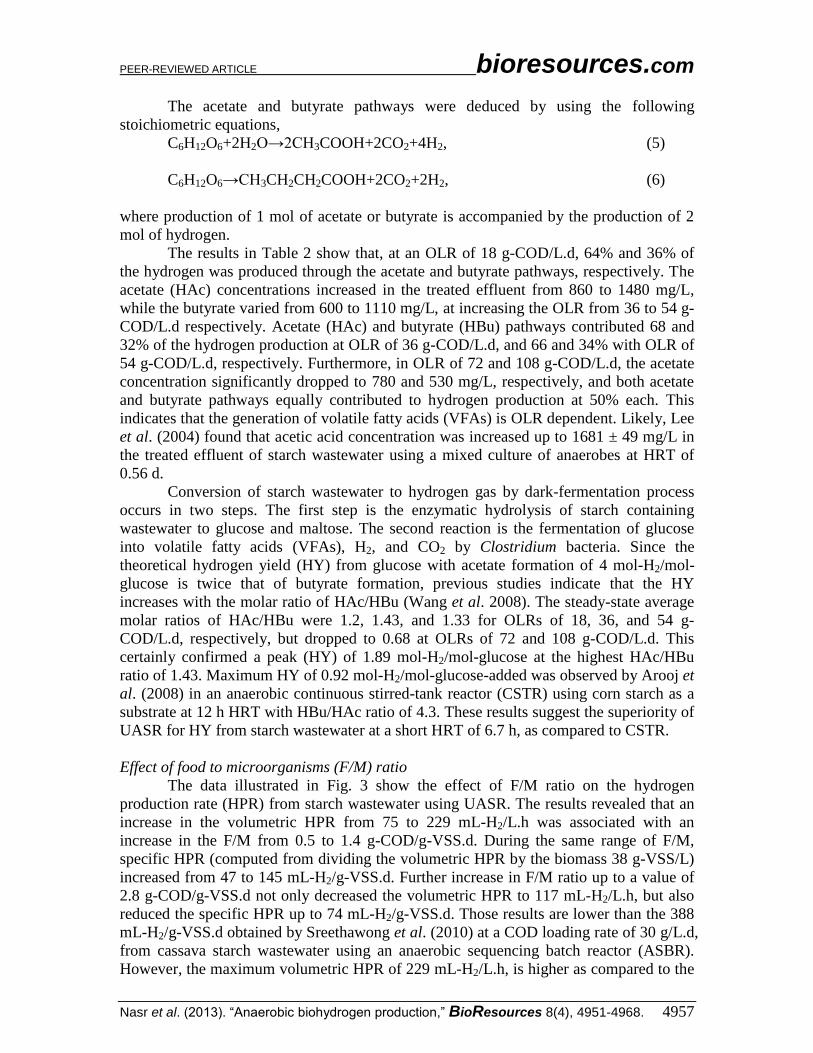
Effect of food to microorganisms (F/M) ratio
The data illustrated in Fig. 3 show the effect of F/M ratio on the hydrogen
production rate (HPR) from starch wastewater using UASR. The results revealed that an
increase in the volumetric HPR from 75 to 229 mL-H2/L.h was associated with an
increase in the F/M from 0.5 to 1.4 g-COD/g-VSS.d. During the same range of F/M,
specific HPR (computed from dividing the volumetric HPR by the biomass 38 g-VSS/L)
increased from 47 to 145 mL-H2/g-VSS.d. Further increase in F/M ratio up to a value of
2.8 g-COD/g-VSS.d not only decreased the volumetric HPR to 117 mL-H2/L.h, but also
reduced the specific HPR up to 74 mL-H2/g-VSS.d. Those results are lower than the 388
mL-H2/g-VSS.d obtained by Sreethawong et al. (2010) at a COD loading rate of 30 g/L.d,
from cassava starch wastewater using an anaerobic sequencing batch reactor (ASBR).
However, the maximum volumetric HPR of 229 mL-H2/L.h, is higher as compared to the
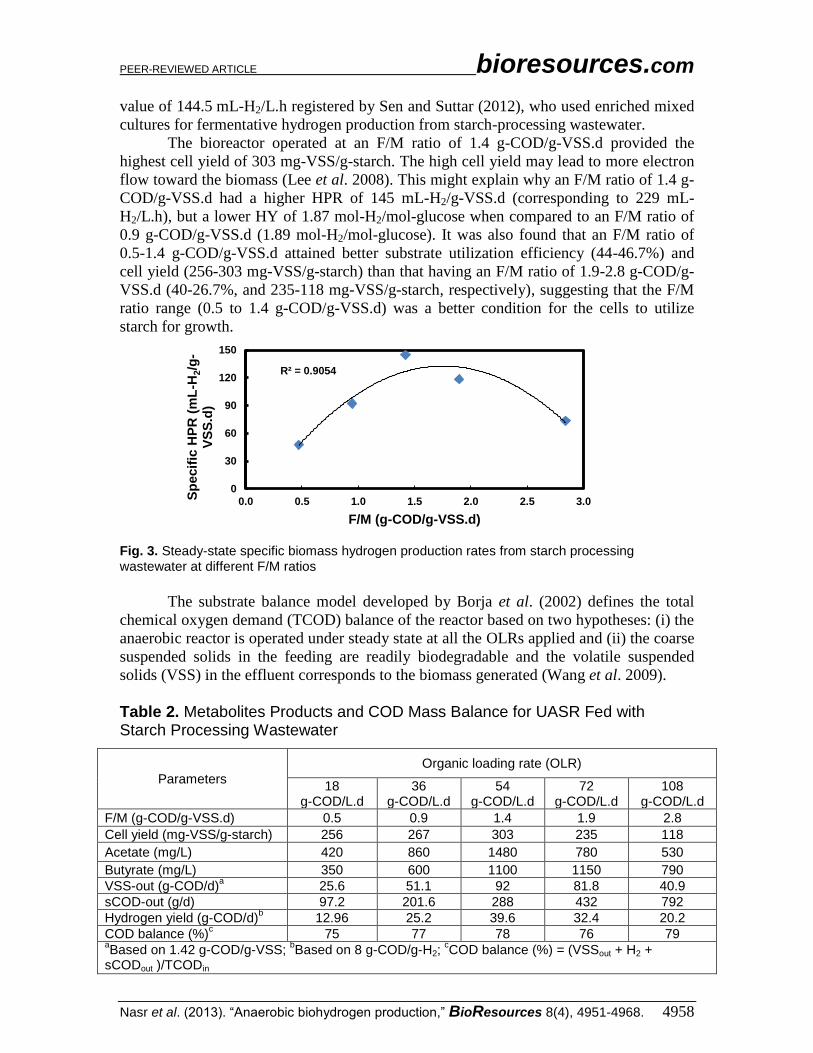
PEER-REVIEWED ARTICLE bioresources.com
Nasr et al. (2013). “Anaerobic biohydrogen production,” BioResources 8(4), 4951-4968. 4958
value of 144.5 mL-H2/L.h registered by Sen and Suttar (2012), who used enriched mixed
cultures for fermentative hydrogen production from starch-processing wastewater.
The bioreactor operated at an F/M ratio of 1.4 g-COD/g-VSS.d provided the
highest cell yield of 303 mg-VSS/g-starch. The high cell yield may lead to more electron
flow toward the biomass (Lee et al. 2008). This might explain why an F/M ratio of 1.4 g-
COD/g-VSS.d had a higher HPR of 145 mL-H2/g-VSS.d (corresponding to 229 mL-
H2/L.h), but a lower HY of 1.87 mol-H2/mol-glucose when compared to an F/M ratio of
0.9 g-COD/g-VSS.d (1.89 mol-H2/mol-glucose). It was also found that an F/M ratio of
0.5-1.4 g-COD/g-VSS.d attained better substrate utilization efficiency (44-46.7%) and
cell yield (256-303 mg-VSS/g-starch) than that having an F/M ratio of 1.9-2.8 g-COD/g-
VSS.d (40-26.7%, and 235-118 mg-VSS/g-starch, respectively), suggesting that the F/M
ratio range (0.5 to 1.4 g-COD/g-VSS.d) was a better condition for the cells to utilize
starch for growth.
Fig. 3. Steady-state specific biomass hydrogen production rates from starch processing wastewater at different F/M ratios
The substrate balance model developed by Borja et al. (2002) defines the total
chemical oxygen demand (TCOD) balance of the reactor based on two hypotheses: (i) the
anaerobic reactor is operated under steady state at all the OLRs applied and (ii) the coarse
suspended solids in the feeding are readily biodegradable and the volatile suspended
solids (VSS) in the effluent corresponds to the biomass generated (Wang et al. 2009).
Table 2. Metabolites Products and COD Mass Balance for UASR Fed with Starch Processing Wastewater
Parameters
Organic loading rate (OLR)
18 g-COD/L.d
36 g-COD/L.d
54 g-COD/L.d
72 g-COD/L.d
108 g-COD/L.d
F/M (g-COD/g-VSS.d) 0.5 0.9 1.4 1.9 2.8
Cell yield (mg-VSS/g-starch) 256 267 303 235 118
Acetate (mg/L) 420 860 1480 780 530
Butyrate (mg/L) 350 600 1100 1150 790
VSS-out (g-COD/d)a 25.6 51.1 92 81.8 40.9
sCOD-out (g/d) 97.2 201.6 288 432 792
Hydrogen yield (g-COD/d)b 12.96 25.2 39.6 32.4 20.2
COD balance (%)c 75 77 78 76 79
aBased on 1.42 g-COD/g-VSS;
bBased on 8 g-COD/g-H2;
cCOD balance (%) = (VSSout + H2 +
sCODout )/TCODin
R² = 0.9054
0
30
60
90
120
150
0.0 0.5 1.0 1.5 2.0 2.5 3.0Sp
ecif
ic H
PR
(m
L-H
2/g
-V
SS
.d)
F/M (g-COD/g-VSS.d)
PEER-REVIEWED ARTICLE bioresources.com
Nasr et al. (2013). “Anaerobic biohydrogen production,” BioResources 8(4), 4951-4968. 4959
The COD mass balance for the UASR (Table 2) was computed considering all the
metabolites products, the hydrogen gas produced, and the equivalent COD for the
biomass produced. Due to neglecting the fraction of TCODin consumed for cell
maintenance, the COD mass balance was in the range of 75 to 79%.
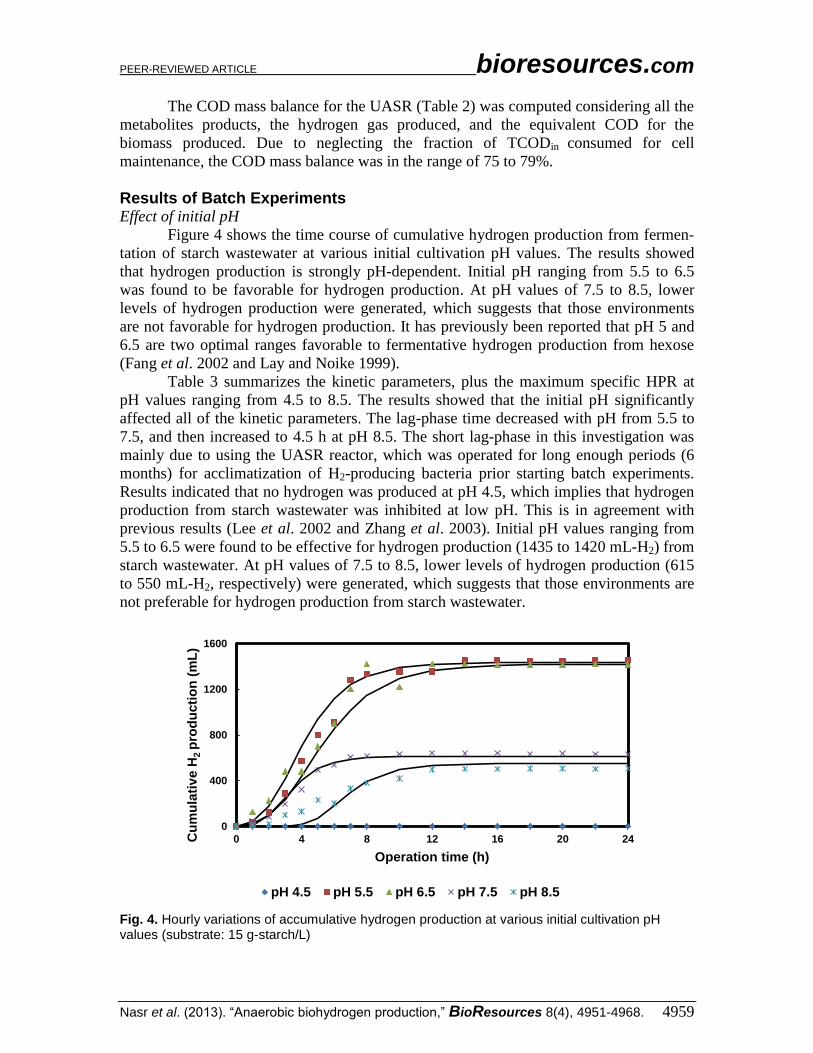
Results of Batch Experiments Effect of initial pH
Figure 4 shows the time course of cumulative hydrogen production from fermen-
tation of starch wastewater at various initial cultivation pH values. The results showed
that hydrogen production is strongly pH-dependent. Initial pH ranging from 5.5 to 6.5
was found to be favorable for hydrogen production. At pH values of 7.5 to 8.5, lower
levels of hydrogen production were generated, which suggests that those environments
are not favorable for hydrogen production. It has previously been reported that pH 5 and
6.5 are two optimal ranges favorable to fermentative hydrogen production from hexose
(Fang et al. 2002 and Lay and Noike 1999).
Table 3 summarizes the kinetic parameters, plus the maximum specific HPR at
pH values ranging from 4.5 to 8.5. The results showed that the initial pH significantly
affected all of the kinetic parameters. The lag-phase time decreased with pH from 5.5 to
7.5, and then increased to 4.5 h at pH 8.5. The short lag-phase in this investigation was
mainly due to using the UASR reactor, which was operated for long enough periods (6
months) for acclimatization of H2-producing bacteria prior starting batch experiments.
Results indicated that no hydrogen was produced at pH 4.5, which implies that hydrogen
production from starch wastewater was inhibited at low pH. This is in agreement with
previous results (Lee et al. 2002 and Zhang et al. 2003). Initial pH values ranging from
5.5 to 6.5 were found to be effective for hydrogen production (1435 to 1420 mL-H2) from
starch wastewater. At pH values of 7.5 to 8.5, lower levels of hydrogen production (615
to 550 mL-H2, respectively) were generated, which suggests that those environments are
not preferable for hydrogen production from starch wastewater.
Fig. 4. Hourly variations of accumulative hydrogen production at various initial cultivation pH values (substrate: 15 g-starch/L)
0
400
800
1200
1600
0 4 8 12 16 20 24Cu
mu
lati
ve H
2 p
rod
ucti
on
(m
L)
Operation time (h)
pH 4.5 pH 5.5 pH 6.5 pH 7.5 pH 8.5
PEER-REVIEWED ARTICLE bioresources.com
Nasr et al. (2013). “Anaerobic biohydrogen production,” BioResources 8(4), 4951-4968. 4960
The Rm value varied with pH and peaked at pH 5.5 (280 mL-H2/h) as shown in
Table 3. The increment of Rm value at pH 5.5 relative to that at pH 6.5 was 27%.
Maximum specific HPR of 17.68 mL-H2/g-VSS.d is lower than that obtained by Liu et
al. (2004), who observed 146 mL-H2/g-VSS.d at pH value of 7.0–8.0. Additionally, a
higher specific HPR of 365 mL-H2/g-VSS.d was achieved by Zhang et al. (2003) at
pH=7. Such a discrepancy could be due to many factors, including differences in
microbial population and mixing of culture medium (Lamed et al. 1988).
Table 3. Modified Gompertz Equation Parameters for Various Initial Cultivation pH Values at an Initial Substrate Concentration of 15 g-Starch/L
pH initial P
(mL-H2) Rm
(mL-H2/h) Volumetric HPR
(mL-H2/L.d) Specific HPR
(mL-H2/g-VSS.d) λ
(h) R
2
4.5 0 0 0 0 -- --
5.5 1435 280 672 17.68 1.5 0.983
6.5 1420 220 528 13.89 2 0.972
7.5 615 170 408 10.74 1.5 0.984
8.5 550 120 288 7.58 4.5 0.957
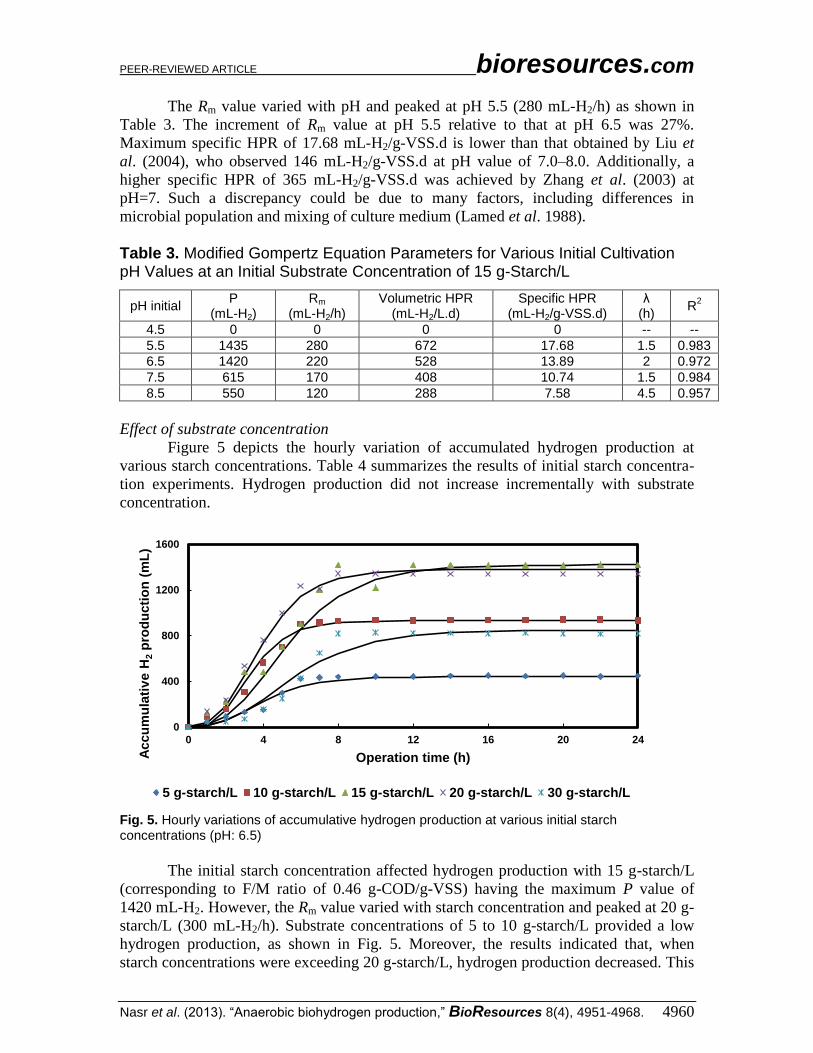
Effect of substrate concentration
Figure 5 depicts the hourly variation of accumulated hydrogen production at
various starch concentrations. Table 4 summarizes the results of initial starch concentra-
tion experiments. Hydrogen production did not increase incrementally with substrate
concentration.
Fig. 5. Hourly variations of accumulative hydrogen production at various initial starch concentrations (pH: 6.5)
The initial starch concentration affected hydrogen production with 15 g-starch/L
(corresponding to F/M ratio of 0.46 g-COD/g-VSS) having the maximum P value of
1420 mL-H2. However, the Rm value varied with starch concentration and peaked at 20 g-
starch/L (300 mL-H2/h). Substrate concentrations of 5 to 10 g-starch/L provided a low
hydrogen production, as shown in Fig. 5. Moreover, the results indicated that, when
starch concentrations were exceeding 20 g-starch/L, hydrogen production decreased. This
0
400
800
1200
1600
0 4 8 12 16 20 24
Accu
mu
lati
ve H
2 p
rod
ucti
on
(m
L)
Operation time (h)
5 g-starch/L 10 g-starch/L 15 g-starch/L 20 g-starch/L 30 g-starch/L
PEER-REVIEWED ARTICLE bioresources.com
Nasr et al. (2013). “Anaerobic biohydrogen production,” BioResources 8(4), 4951-4968. 4961
suggests that hydrogen production is strongly affected by the substrate concentration via
the bacterial metabolism, the microbial community structure, and the sludge loading rate
(Akutsu et al. 2009). Those results are higher than a study of Wang et al. (2007), who
obtained (43.1 mL-H2/h) from hydrolyzed starch by anaerobic mixed micro-flora with
phosphate-buffered medium. Similarly, Yang and Shen (2006) reported that a high starch
concentration of 20 to 40 g/L had no remarkable effect on hydrogen production, and
obtained a maximum P value of 260.5 mL-H2 at a starch concentration of 20 g/L.
Maximum volumetric HPR of 720 mL-H2/L.d is lower than those obtained by Thanwised
et al. (2012) who showed 883 mL-H2/L.d at 6 h HRT from tapioca starch using anaerobic
mixed cultures in an anaerobic baffled reactor.
Once again, this discrepancy with previous investigations might be due to the
different microbial communities resulting from differences in the inocula, in the various
pretreatments methods used, in the start-up period of the inoculums sludge, and in
substrates and/or the reactor operational conditions in terms of HRT and OLR.
Table 4. Modified Gompertz Equation Parameters for Various Initial Starch Concentrations at an Initial pH of 6.5
Starch (g/L)
P (mL-H2)
Rm (mL-H2/h)
Volumetric HPR (mL-H2/L.d)
Specific HPR (mL-H2/g-VSS.d)
λ (h)
R2
5 440 90 216 5.68 1.5 0.969
10 930 260 624 16.42 1.5 0.987
15 1420 220 528 13.89 2 0.972
20 1380 300 720 18.95 1.5 0.993
30 850 120 288 7.58 2 0.964
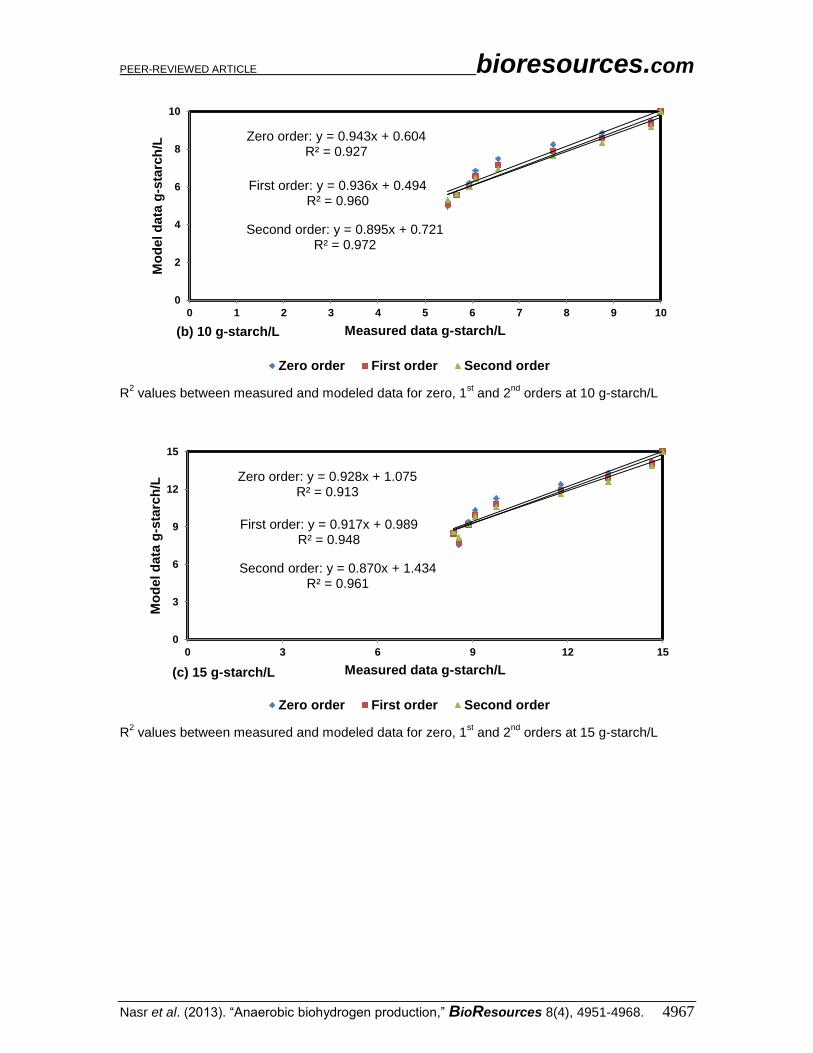
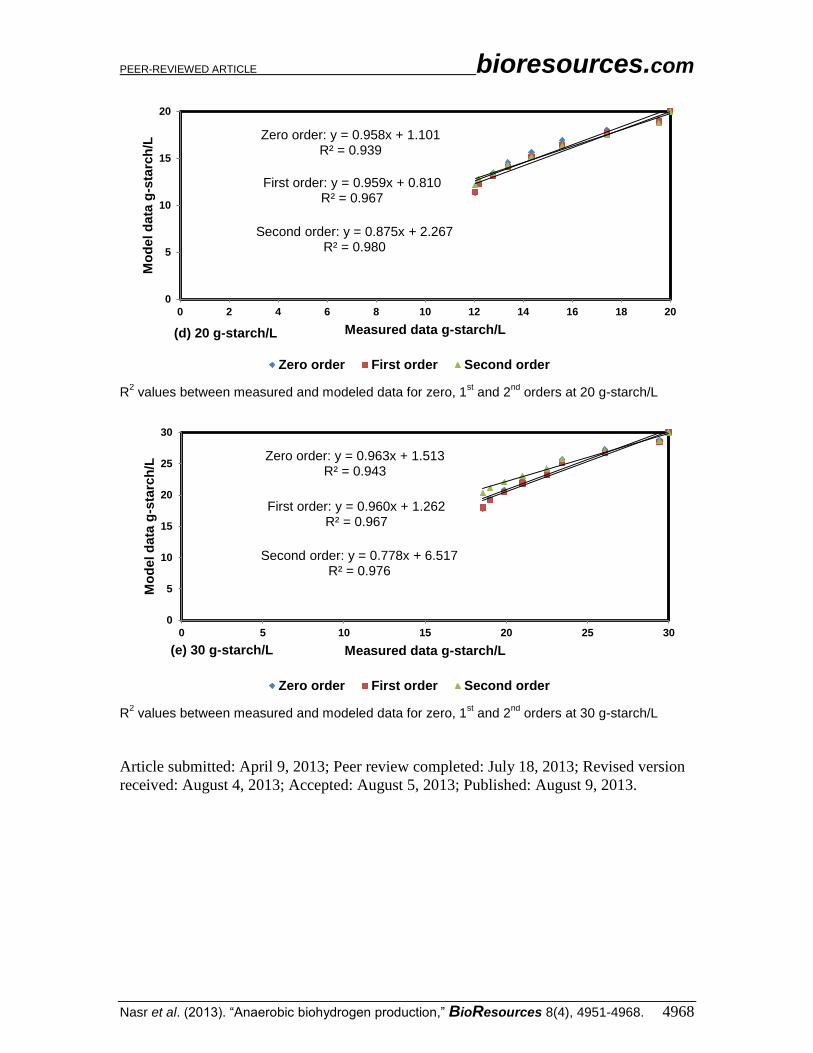
Kinetic studies
Table 5 shows the kinetic parameters and the corresponding R2 values. According
to the simulated results, the 2nd
order kinetic constant, k2, related to substrate
concentrations of 5, 10, 15, 20, and 30 g-starch/L were 0.022, 0.011, 0.007, 0.004, and
0.002, respectively. This indicates that the bioreactor is capable of reducing organics of 5
g-starch/L more than 10, 15, 20, and 30 g-starch/L. This phenomenon needs further
research for examining the suitability of 2nd
order kinetics to assess HPR.
Table 5. Results of Kinetics Model for Batch Experiments at Various Starch Concentrations
Kinetic model Parameter 5 g-starch/L
10 g-starch/L
15 g-starch/L
20 g-starch/L
30 g-starch/L
Zero order k0 0.306 0.629 0.933 1.089 1.53
R2 0.915 0.923 0.907 0.939 0.945
1st order
k1 0.081 0.084 0.082 0.07 0.064
R2 0.944 0.944 0.922 0.96 0.967
2nd
order k2 0.022 0.011 0.007 0.004 0.002
R2 0.964 0.96 0.933 0.975 0.982
Function ode45 in MATLAB was applied to simulate the ordinary differential
equations of the biochemical conversion processes. Model validation was corroborated
when plotting the experimental and modeled data, resulting in the correlation regression
(R2 value). The equations obtained confirmed that a second order model for substrate
kinetics fit adequately with the experimental results obtained (R2>0.97) (data are shown
PEER-REVIEWED ARTICLE bioresources.com
Nasr et al. (2013). “Anaerobic biohydrogen production,” BioResources 8(4), 4951-4968. 4962
in the Appendix). Consequently, the 2nd
order can simulate the substrate removal in the
bioreactor more efficiently than that of zero and 1st orders.
CONCLUSIONS
1. Biohydrogen was successfully produced from starch wastewater via an up-flow
anaerobic staged reactor (UASR).
2. Hydrogen yield (HY), hydrogen production rate (HPR), and specific HPR (SHPR)
peaked at OLR of 54 g-COD/L.d and F/M of 1.4 g-COD/g-VSS.d, resulting 1.87 mol-
H2/mol-glucose, 246 mmol-H2/L.d, and 145 mL-H2/g-VSS.d, respectively.
3. The initial cultivation pH and substrate concentration markedly affected hydrogen-
producing bioactivity.
4. Starch wastewater had an optimal initial cultivation pH of 5.5 with a maximum HPR
of 1.25 mmol-H2/L.h and initial substrate concentration of 20 g-starch/L with a
maximum specific HPR of 0.85 mmol-H2/g-VSS.d.
5. For all substrate concentrations, the 2nd
order kinetic was effectively able to track the
measured data with R2> 0.97.
ACKNOWLEDGMENTS
The 1st author is very grateful for the Ministry of Higher Education (MOHE) of
Egypt, for providing him financial support (PhD scholarship) for this research.
REFERENCES CITED
Akutsu, Y., Lee, D.Y., Chi, Y.Z., Li, Y.Y., Harada, H., and Yu, H.Q. (2009).
“Thermophilic fermentative hydrogen production from starch-wastewater with bio-
granules,” International Journal of Hydrogen Energy 34(12), 5061-5071.
APHA, AWWA, WPCF (1998). Standard Methods for Examination of Water and
Wastewaters, 20th
ed. American Public Health Association, Washington, DC.
Arooj, M. F., Han, S. K., Kim, S. H., Kim, D. H., and Shin, H. S. (2008). “Continuous
biohydrogen production in a CSTR using starch as a substrate,” International Journal
of Hydrogen Energy 33(13), 3289-3294.
Borja, R., González, E., Raposo, F., Millán, F., and Martín, A. (2002). “Kinetic analysis
of the psychrophilic anaerobic digestion of wastewater derived from the production of
proteins from extracted sunflower flour,” J. Agric. Food Chem. 50(16), 4628-4633.
Cakır, A., Ozmihci, S., and Kargi, F. (2010). “Comparison of bio-hydrogen production
from hydrolyzed wheat starch by mesophilic and thermophilic dark fermentation,”
International Journal of Hydrogen Energy 35(24), 13214-13218.
Chen, S. D., Lo, Y. C., Lee, K. S., Huang, T. I., and Chang, J. S. (2009). “Sequencing
batch reactor enhances bacterial hydrolysis of starch promoting continuous bio-
hydrogen production from starch feedstock,” International Journal of Hydrogen
Energy 34(20), 8549-8557.

PEER-REVIEWED ARTICLE bioresources.com
Nasr et al. (2013). “Anaerobic biohydrogen production,” BioResources 8(4), 4951-4968. 4963
Debik, E., and Coskun, T. (2009). “Use of the static granular bed reactor (SGBR) with
anaerobic sludge to treat poultry slaughterhouse wastewater and kinetic modeling,”
Bioresource Technology 100(11), 2777-2782.
Fang, H. H. P., Liu, H., and Zhang, T. (2002). “Characterization of a hydrogen producing
granular sludge,” Biotechnol Bioeng. 78(1), 44-52.
Guo, W. Q., Ren, N. Q., Chen, Z. B., Liu, B. F., Wang, X. J., Xiang, W. S., and Ding, J.
(2008). “Simultaneous biohydrogen production and starch wastewater treatment in an
acidogenic expanded granular sludge bed reactor by mixed culture for long-term
operation,” International Journal of Hydrogen Energy 3, 7397-7404.
Hafez, H., Nakhla, G., El-Naggar, M. H., Elbeshbishy, E., and Baghchehsaraee, B.
(2010). “Effect of organic loading on a novel hydrogen bioreactor,” International
Journal of Hydrogen Energy 35(1), 81-92.
Jamuna, R., and Ramakrishna, S. V. (1989). “SCP production and removal of organic
load from cassava starch industry by yeasts,” J. Ferment. Bioeng. 67, 126-131.
Jin, B., Yan, X. Q., Yu, Q., and Van-Leeuwen, H. J. (2002). “A comprehensive pilot
plant system for fungal biomass protein production and wastewater reclamation,”
Adv. Environ. Res. 6, 179-189.
Kumar, N., and Das, D. (2001). “Continuous hydrogen production by immobilized
Enterobacter cloacae IIT-BT 08 using lignocellulosic materials as solid matrices,”
Enzyme Microb Technol. 29(4-5), 280-287.
Lamed, R. J., Lobos, J. H., and Su, T. M. (1988). “Effect of stirring and hydrogen on
fermentation products of Clostridium thermocellum,” Appl. Environ. Microbiol. 54,
1216-1221.
Lay, J. J., and Noike, T. (1999). “Feasibility of biological hydrogen production from
organic fraction of municipal solid waste,” Water Res. 33(11), 2579-2586.
Lee, K. S., Hsu, Y. F., Lo, Y. C., Lin, P. J., Lin, C. Y., and Chang, J. S. (2008).
“Exploring optimal environmental factors for fermentative hydrogen production from
starch using mixed anaerobic microflora,” International Journal of Hydrogen Energy
33(5), 1565-1572.
Lee, S., Yang, K., and Hwang, S. (2004). “Use of response surface analysis in selective
bioconversion of starch wastewater to acetic acid using a mixed culture of
anaerobes,” Process Biochemistry 39(9), 1131-1135.
Lee, Y.J., Miyahara, T., and Noike, T. (2002). “Effect of pH on microbial hydrogen
fermentation,” J. Chem. Technol. Biotechnol. 77, 694-698.
Liu, D. (2008). “Bio-hydrogen production by dark fermentation from organic wastes and
residues,” Ph.D. Thesis, Department of Environmental Engineering, Technical
University of Denmark.
Liu, G., and Shen, J. (2004). “Effects of culture and medium conditions on hydrogen
production from starch using anaerobic bacteria,” Journal of Bioscience and
Bioengineering 98(4), 251-256.
Lo, Y. C., Chen, S. D., Chen, C. Y., Huang, T. I., Lin, C. Y., and Chang, J. S. (2008).
“Combining enzymatic hydrolysis and dark–photo fermentation processes for
hydrogen production from starch feedstock: A feasibility study,” International
Journal of Hydrogen Energy 33 (19), 5224-5233.
Lu, N., Zhou, S.G., Chang, M., and Ni, J.R. (2007). “Factors affecting the production of
Bacillus thuringiensis biopesticide using corn steep water as raw material,” Chin. J.
Environ. Eng. 1(9), 126-130.
PEER-REVIEWED ARTICLE bioresources.com
Nasr et al. (2013). “Anaerobic biohydrogen production,” BioResources 8(4), 4951-4968. 4964
Nasr, M., Tawfik, A., Ookawara, S., and Suzuki, M. (2012). “Simultaneous H2
production and treatment of starch wastewater in a combined up-flow anaerobic
staged reactor followed by down-flow hanging sponge system,” International
Conference on Environment, Chemistry and Biology 49, 46-50.
Rifkin, J. (2002). The Hydrogen Economy: The Creation of the Worldwide Energy Web
and the Redistribution of the Power on Earth, Jeremy P. Tercher/Putnam, New York.
Sen, B., and Suttar, R. (2012). “Mesophilic fermentative hydrogen production from sago
starch-processing wastewater using enriched mixed cultures,” International Journal
of Hydrogen Energy 37(20), 15588-15597.
Singh, S. P., Srivastava, S. C., and Pandey, K. D. (1994). “Hydrogen production by
Rhodopseudomonas at the expense of vegetable starch, sugarcane juice and whey,”
International Journal of Hydrogen Energy 19(5), 437-440.
Sreethawong, T., Chatsiriwatana, S., Rangsunvigit, P., and Chavadej, S. (2010).
“Hydrogen production from cassava wastewater using an anaerobic sequencing batch
reactor: Effects of operational parameters, COD:N ratio, and organic acid
composition,” International Journal of Hydrogen Energy 35(9), 4092-4102.
Tawfik, A., and Salem, A. (2012). “Effect of organic loading rate on bio-hydrogen
production from pre-treated rice straw waste via mesophillic up-flow anaerobic
staged reactor,” Bioresour Technol. 107, 186-190.
Tawfik, A., Salem, A., El-Qelish, M., Fahmi, A. A., and Moustafa, M. E. (2013).
“Factors affecting hydrogen production from rice straw wastes in a mesophillic up-
flow anaerobic staged reactor,” Renewable Energy 50, 402-407.
Tchobanoglous, G., Burton, F., and Stensel, H. (2003). Wastewater Engineering
Treatment, Disposal and Reuse, 4th
Ed. McGraw-Hill, New York.
Thanwised, P., Wirojanagud, W., and Reungsang, A. (2012). “Effect of hydraulic
retention time on hydrogen production and chemical oxygen demand removal from
tapioca wastewater using anaerobic mixed cultures in anaerobic baffled reactor
(ABR),” International Journal of Hydrogen Energy 37(20), 15503-15510.
Wang, C. H., Lu, W. B., and Chang, J. S. (2007). “Feasibility study on fermentative
conversion of raw and hydrolyzed starch to hydrogen using anaerobic mixed
microflora,” International Journal of Hydrogen Energy 32(16), 3849-3859.
Wang, J. L., and Wan, W. (2008). “The effect of substrate concentration on biohydrogen
production by using kinetic models,” Sci. China Ser. B-Chem. 51(11), 1110-1117.
Wang, S., Rao, N. C., Qiu, R., and Moletta, R. (2009). “Performance and kinetic
evaluation of anaerobic moving bed biofilm reactor for treating milk permeate from
dairy industry,” Bioresour. Technol. 100(23), 5641-5647.
Wei, J., Liu, Z. T., and Zhang, X. (2010). “Biohydrogen production from starch
wastewater and application in fuel cell,” International Journal of Hydrogen Energy
35(7), 2949-2952.
Wu, S. Y., Hung, C. H., Lin, C. N., Chen, H. W., Lee, A. S., and Chang, J. S. (2006).
“Fermentative hydrogen production and bacterial community structure in high-rate
anaerobic bioreactors containing silicone-immobilized and self-flocculated sludge,”
Biotechnol. Bioeng. 93(5), 934-946.
Yang, H., and Shen, J. (2006). “Effect of ferrous iron concentration on anaerobic bio-
hydrogen production from soluble starch,” International Journal of Hydrogen Energy
31(15), 2137-2146.
Zhang, T., Liu, H., and Fang, H.H.P. (2003). “Biohydrogen production from starch in
wastewater under thermophilic condition,” J. Environ. Manage. 69(2), 149-156.
PEER-REVIEWED ARTICLE bioresources.com
Nasr et al. (2013). “Anaerobic biohydrogen production,” BioResources 8(4), 4951-4968. 4965
Zwietering, M. H., Jongenburger, L., Rombouts, F. M., and Riet, K. (1990). “Modelling
the bacterial growth curve,” Appl. Environ. Microbiol. 56(6), 1875-1881.
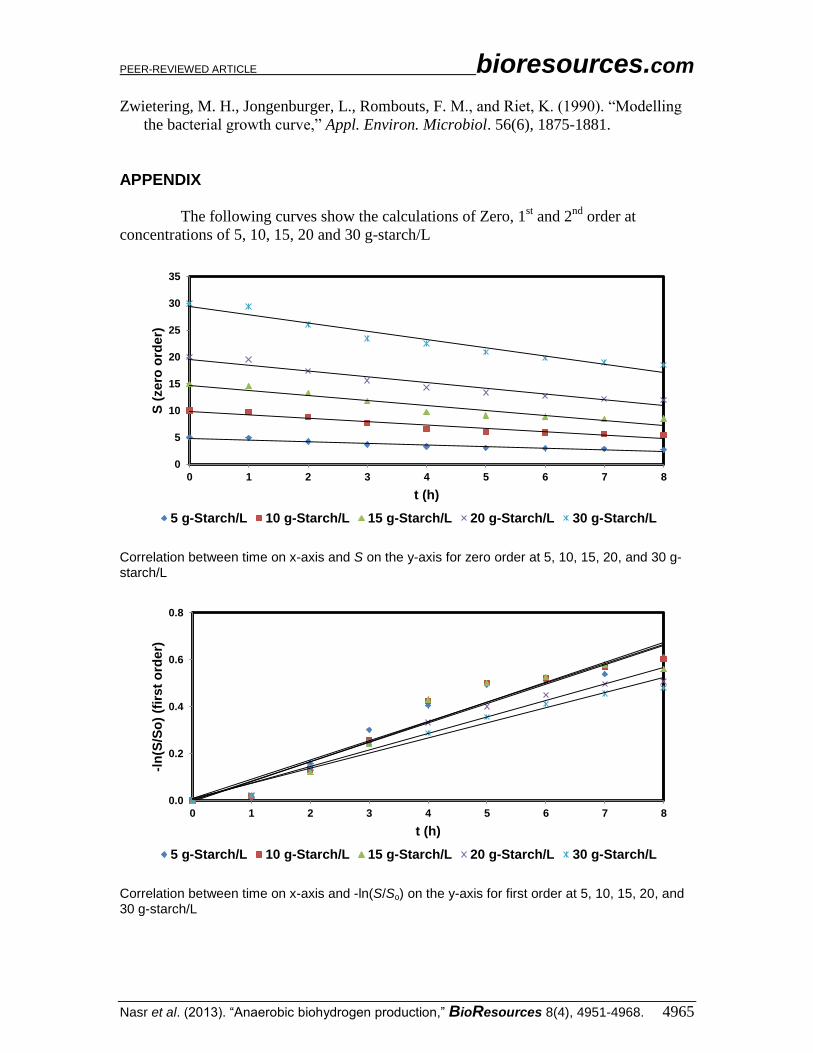
APPENDIX
The following curves show the calculations of Zero, 1st and 2
nd order at
concentrations of 5, 10, 15, 20 and 30 g-starch/L
Correlation between time on x-axis and S on the y-axis for zero order at 5, 10, 15, 20, and 30 g-starch/L
Correlation between time on x-axis and -ln(S/So) on the y-axis for first order at 5, 10, 15, 20, and 30 g-starch/L
0
5
10
15
20
25
30
35
0 1 2 3 4 5 6 7 8
S (
zero
ord
er)
t (h)
5 g-Starch/L 10 g-Starch/L 15 g-Starch/L 20 g-Starch/L 30 g-Starch/L
0.0
0.2
0.4
0.6
0.8
0 1 2 3 4 5 6 7 8
-ln
(S/S
o)
(fir
st
ord
er)
t (h)
5 g-Starch/L 10 g-Starch/L 15 g-Starch/L 20 g-Starch/L 30 g-Starch/L
PEER-REVIEWED ARTICLE bioresources.com
Nasr et al. (2013). “Anaerobic biohydrogen production,” BioResources 8(4), 4951-4968. 4966
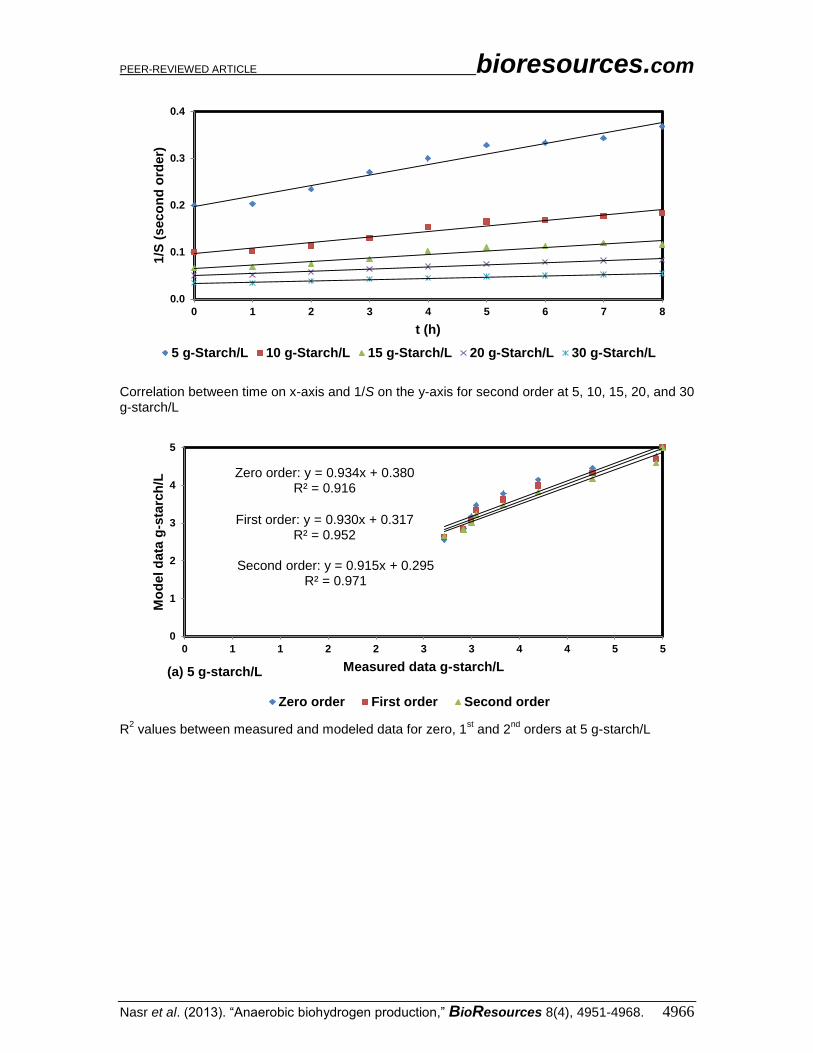
Correlation between time on x-axis and 1/S on the y-axis for second order at 5, 10, 15, 20, and 30 g-starch/L
R
2 values between measured and modeled data for zero, 1
st and 2
nd orders at 5 g-starch/L
0.0
0.1
0.2
0.3
0.4
0 1 2 3 4 5 6 7 8
1/S
(seco
nd
ord
er)
t (h)
5 g-Starch/L 10 g-Starch/L 15 g-Starch/L 20 g-Starch/L 30 g-Starch/L
Zero order: y = 0.934x + 0.380 R² = 0.916
First order: y = 0.930x + 0.317 R² = 0.952
Second order: y = 0.915x + 0.295 R² = 0.971
0
1
2
3
4
5
0 1 1 2 2 3 3 4 4 5 5
Mo
del d
ata
g-s
tarc
h/L
Measured data g-starch/L
Zero order First order Second order
(a) 5 g-starch/L
PEER-REVIEWED ARTICLE bioresources.com
Nasr et al. (2013). “Anaerobic biohydrogen production,” BioResources 8(4), 4951-4968. 4967
R
2 values between measured and modeled data for zero, 1
st and 2
nd orders at 10 g-starch/L
R
2 values between measured and modeled data for zero, 1
st and 2
nd orders at 15 g-starch/L
Zero order: y = 0.943x + 0.604 R² = 0.927
First order: y = 0.936x + 0.494 R² = 0.960
Second order: y = 0.895x + 0.721 R² = 0.972
0
2
4
6
8
10
0 1 2 3 4 5 6 7 8 9 10
Mo
del d
ata
g-s
tarc
h/L
Measured data g-starch/L
Zero order First order Second order
(b) 10 g-starch/L
Zero order: y = 0.928x + 1.075 R² = 0.913
First order: y = 0.917x + 0.989 R² = 0.948
Second order: y = 0.870x + 1.434 R² = 0.961
0
3
6
9
12
15
0 3 6 9 12 15
Mo
del d
ata
g-s
tarc
h/L
Measured data g-starch/L
Zero order First order Second order
(c) 15 g-starch/L
PEER-REVIEWED ARTICLE bioresources.com
Nasr et al. (2013). “Anaerobic biohydrogen production,” BioResources 8(4), 4951-4968. 4968
R
2 values between measured and modeled data for zero, 1
st and 2
nd orders at 20 g-starch/L
R
2 values between measured and modeled data for zero, 1
st and 2
nd orders at 30 g-starch/L
Article submitted: April 9, 2013; Peer review completed: July 18, 2013; Revised version
received: August 4, 2013; Accepted: August 5, 2013; Published: August 9, 2013.
Zero order: y = 0.958x + 1.101 R² = 0.939
First order: y = 0.959x + 0.810 R² = 0.967
Second order: y = 0.875x + 2.267 R² = 0.980
0
5
10
15
20
0 2 4 6 8 10 12 14 16 18 20
Mo
del d
ata
g-s
tarc
h/L
Measured data g-starch/L
Zero order First order Second order
(d) 20 g-starch/L
Zero order: y = 0.963x + 1.513 R² = 0.943
First order: y = 0.960x + 1.262 R² = 0.967
Second order: y = 0.778x + 6.517 R² = 0.976
0
5
10
15
20
25
30
0 5 10 15 20 25 30
Mo
del d
ata
g-s
tarc
h/L
Measured data g-starch/L
Zero order First order Second order
(e) 30 g-starch/L