Embed Size (px)
Citation preview

PEER AND ASPIRANT ANALYSIS
1
A Case Study to Examine
Peer Grouping and Aspirant Selection
Dr. Mary Lou D’Allegro, Associate Vice-President for Academic Affairs
Kai Zhou, Institutional Research Analyst
Institutional Effectiveness, Siena College
Special Thanks to Kristina Wilcox, Accreditation Specialist

PEER AND ASPIRANT ANALYSIS
2
A Case Study to Examine
Peer Grouping and Aspirant Selection
Abstract
The case study demonstrated that the use of institutional characteristics, alone, may be an
insufficient peer selection strategy. Several other considerations including clarity of purpose,
alignment of institutional information to that purpose, identification of appropriate statistical
procedures, review of preliminary peer sets, and the application of additional metrics improved
the accuracy of the institutional peer and aspirant lists created for this college. As such, this
applied research describes how institutional peer and aspirant groups were identified for a private
non-profit four-year liberal arts college. At the heart of the peer analyses are the nearest
neighbor and cluster analysis statistical procedures. In addition, an aspirant index, proposed by
the authors, was applied to a preliminary set of institutions to further refine the aspirant list.

PEER AND ASPIRANT ANALYSIS
3
A Case Study to Examine
Peer Grouping and Aspirant Selection
Peer comparisons have become increasingly more common (Gater, 2003; Huxley, 2009;
McLaughlin, Howard, & McLaughlin, 2011; Trainer, 2008). Comparative analyses address the
demand for accountability, provide benchmark targets, justify budget and planning decisions,
and complement competitor appraisals (McLaughlin & Howard, 2005). Accordingly,
comparisons with other institutions seems to be gaining credibility (Eckles, 2010).
Yet, there seems to be no expectation to perfectly match an institution with other colleges
and universities (Andres, 1999). Hence, the reliance is on identifying peers or institutions with
similar characteristics. Institutions without existing associations that are similar in certain
delineating factors are deemed as peers (Andres, 1999; Trainer, 2008). Regardless, the challenge
lies with the definition of similar. This is evident from the variety of previously reported
selection methodologies. Some will be addressed in this paper. Likewise, there is no clear
delineation of the most appropriate methods or under the best circumstances and intentions to
implement.
Method
Data Elements
Selection of Data Elements. Identification of institutional characteristics and relevant
data elements is an iterative process of classifying and reorganizing the information by role and
function. First, key institutional characteristics are determined to select the initial set of
institutions. This includes Carnegie Classifications such as type of institution, size, and setting.
Also location and enrollment factors may be engaged at this stage (Carnegie Foundation., 2011).
Second, alternate institutional characteristics help to reduce the number of peers from that initial

PEER AND ASPIRANT ANALYSIS
4
set. For this case study, religious affiliation, transfer mix, and residential proportion were among
the data elements used to potentially reduce the number of institutions in the initial set. Third,
key institutional performance indicators (KPIs) are identified for both peer and aspirant groups.
Finally, deliberation about the factors that influence the KPIs and, hence, academic quality must
be collected (Cohodes & Goodman, 2012). Among the influencers considered in this study were
tuition, total price of attendance, total enrollment, financial expenditures, SAT scores, admit
yield, and quality of faculty were collected. Predictive ability, determined by regression models,
determine inclusion (Hom, 2008). All data elements should be chosen within the context and
priorities of the institution, confounding factors eliminated, and the list reviewed and revised by
college constituents.
Variable choice was informed by several sources. All data elements used in a previous
Siena College peer analysis were also included in this case study. Data from that peer selection
originated from the National Center for Education Statistics (NCES) Integrated Postsecondary
Education Data System (IPEDS) and US News & World Report rankings. A review of the
literature confirmed the appropriateness of these variables but also brought to light additional
institutional factors to consider (Merisotis & Shedd, 2001). Other variables were included at this
stage consequential to a comprehensive exploration of the IPEDS Data Center. The relevance of
some of these data elements were confirmed by college stakeholders and aligned with the
College’s KPIs (Siena College, 2012).
Information from several national survey projects were also considered including : (a)
National Survey of Student Engagement (NSSE) benchmarks, (b) Association of University
Professors (AAUP) faculty salary data, and (c) Noel Levitz Student Satisfaction Inventory
(NLSI). Data from these sources were not used because of at least two limitations. First, some

PEER AND ASPIRANT ANALYSIS
5
of the information is duplicative to IPEDS and US News & World Report rankings data.
Second, several potential peer institutions do not administer the NSSE and NLSI. With this in
mind, the variables were primarily sourced from IPEDS and the US News & World Report
rankings. A list of 32 variables resulted, listed in Appendix A. Descriptions of each are
provided in Appendix B.
Data Element Conversion. The enrollment and number of applicants at Siena College
were almost double that of the other institutions. To control for institutional size, each
institution’s reported full-time equivalent (FTE) were divided into many of the data elements.
This computation mitigated the size discrepancy among institutions (Gater, 2003; Huxley, 2009).
Variables expressed as proportions were not converted. For example, full time faculty
proportions were computed by using the sum of both full and part time instructional faculty.
Faculty salaries were already reported as an average and, therefore, not changed. Similarly,
downloaded SAT scores remained unaltered. The percent of transfers were classified into two
categories, low and high.
Selection of Institutions
Initial Peer Formation. Peer analysis is a multitier and iterative process (McLaughlin,
Howard, & McLaughlin, 2011). Moreover, this study undertook a hybrid approach,
amalgamating the methodologies of previous peer analyses case studies reported in the literature.
Using multiple methods in this study affords a practical balance between analytical and
stakeholder judgment (Trainer, 2008). The initial set of institutions was chosen from an original
list of private, non-profit institutions that submitted data to IPEDS from the Data Center website:
http://nces.ed.gov/ipeds/datacenter/. The list was generated using the EZ group option. Data for
these institutions were collected for 2010 and 2011, the most recent data available. All four year

PEER AND ASPIRANT ANALYSIS
6
private non-profit institutions were included at this initial stage if it met the following criteria:
(a) highest degree awarded is Bachelor’s or Master’s or both, (b) enrolled full-time
undergraduate students, (c) Baccalaureate College- Arts &Sciences or Baccalaureate Balanced
Arts & Sciences, diverse fields Carnegie classifications, (d) Title IV participant (federal financial
aid eligibility), (e) located in US or designated as US Service School (ex. US Naval Academy),
and (f) not a tribal college. This is on par with selection parameters recommended by previous
studies (Andres, 1999). As a result of applying these criteria, 286 institutions were selected. In
general, the initial selection of peers is colleges and universities were attentive to liberal arts
disciplines and enrolled between 1,000 and 9,999 students.
Peer Affiliation Determined by Institutional Characteristics. A workable peer group
size was sought to abet further analysis and peer selection. Depending on purpose, a reasonable
peer group size has been identified to be between 5 and 40 institutions (McLaughlin, Howard, &
McLaughlin, 2011). Five sub-groups were assembled based on institutional characteristics: (a)
Catholic affiliation, (b) primarily baccalaureate, (c) highly residential, (d) low transfer
proportion, and (e) more selective. Previously identified peer and competitor groups were the
basis for the sub-groups. Aggregate information was compiled for 22 standardized data elements
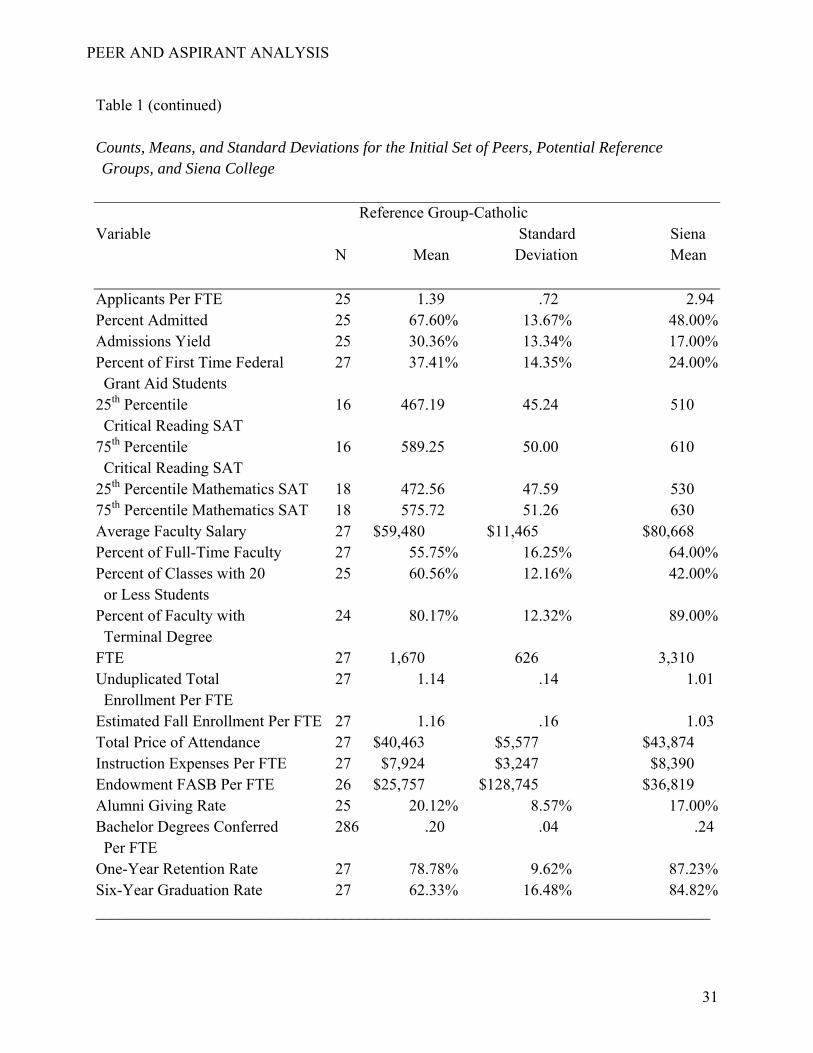
for all 286 institutions, the five institution sub-sets, and for Siena College. Results are shown in
Table 1.
A precursory examination reveals that Siena College is similar to the sub-groups in some
aspects but no group is predominantly comparable to the institution. The mean instructional
expenses for Catholic institutions are less disparate to Siena College than the other sub-groups.
Siena College’s endowment and alumni giving rate is most like the Catholic institutions and
other baccalaureate schools. Siena College is most like the more selective schools with respect

PEER AND ASPIRANT ANALYSIS
7
to the percent admitted, admissions yield, SAT percentiles, proportion of first time students
receiving federal grant aid. On the other hand, Siena College’s total price of attendance, full-
time faculty proportion, and the percent of full-time faculty with terminal degrees are similar to
the low transfer school group. Siena College exceeds the all the peer sets for average full-time
faculty salary with more selective schools having the second highest average salary. Retention
and graduation rates make the task of peer selection more impenetrable. Siena College exceeds
all but more selective schools in retention rate. Siena College also exceeds all groups in
graduation rates.
Based on the inconclusiveness of these comparisons, a peer set was formed by combining
three of the above criteria: (a) low transfer, (b) highly residential, and (c) more selective.
Revealed from these additional selection criteria is that more selective schools are also low
transfer schools but low transfer schools include 85 selective institutions. Regardless, the means
and standard deviations compiled for the data elements were not necessarily more similar to
Siena College than the other five potential peer sets. Results are shown in Table 2. In fact, the
differences between Siena College and the new group means were only smaller for seven
variables than any of the first five proposed reference groups: (a) applicants per FTE, (b) percent
of full-time faculty with terminal degree, (c) 25th percentile Mathematics SAT score, (d) FTE,
(e) classes with 20 or less students, (f) total price of attendance, and (g) one-year retention rate.
In this case study, the use of institutional parameters both singularly and in combination
failed to produce a convincingly valid set of peers. As these comparisons demonstrate, selecting
an initial set of peers based on institutional characteristics may seem to be a practical and logical
approach but can be ineffectual (Shin, 2009).
PEER AND ASPIRANT ANALYSIS
8
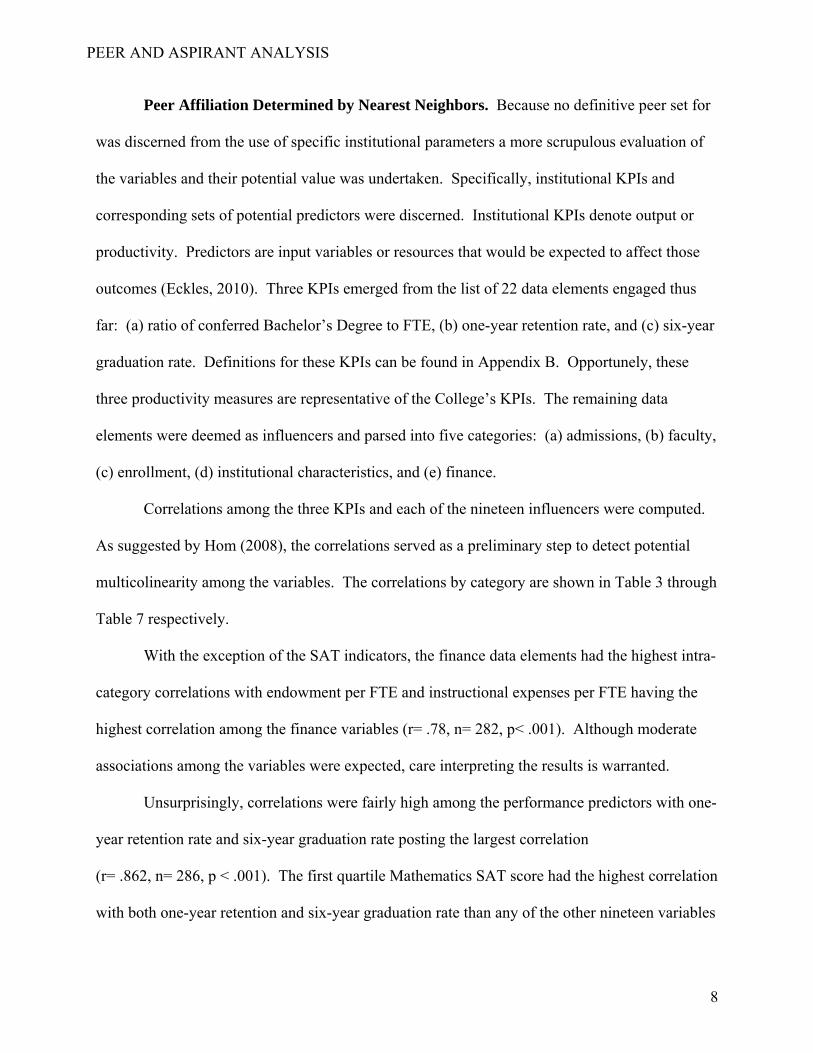
Peer Affiliation Determined by Nearest Neighbors. Because no definitive peer set for
was discerned from the use of specific institutional parameters a more scrupulous evaluation of
the variables and their potential value was undertaken. Specifically, institutional KPIs and
corresponding sets of potential predictors were discerned. Institutional KPIs denote output or
productivity. Predictors are input variables or resources that would be expected to affect those
outcomes (Eckles, 2010). Three KPIs emerged from the list of 22 data elements engaged thus
far: (a) ratio of conferred Bachelor’s Degree to FTE, (b) one-year retention rate, and (c) six-year
graduation rate. Definitions for these KPIs can be found in Appendix B. Opportunely, these
three productivity measures are representative of the College’s KPIs. The remaining data
elements were deemed as influencers and parsed into five categories: (a) admissions, (b) faculty,
(c) enrollment, (d) institutional characteristics, and (e) finance.
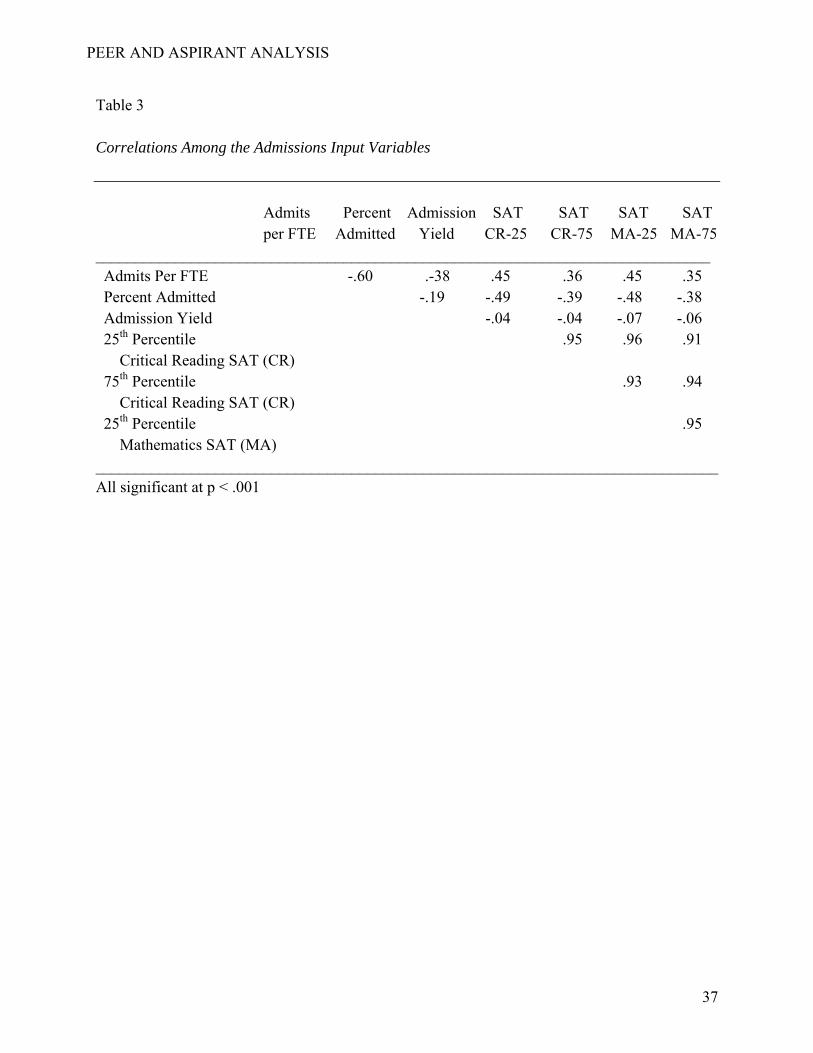
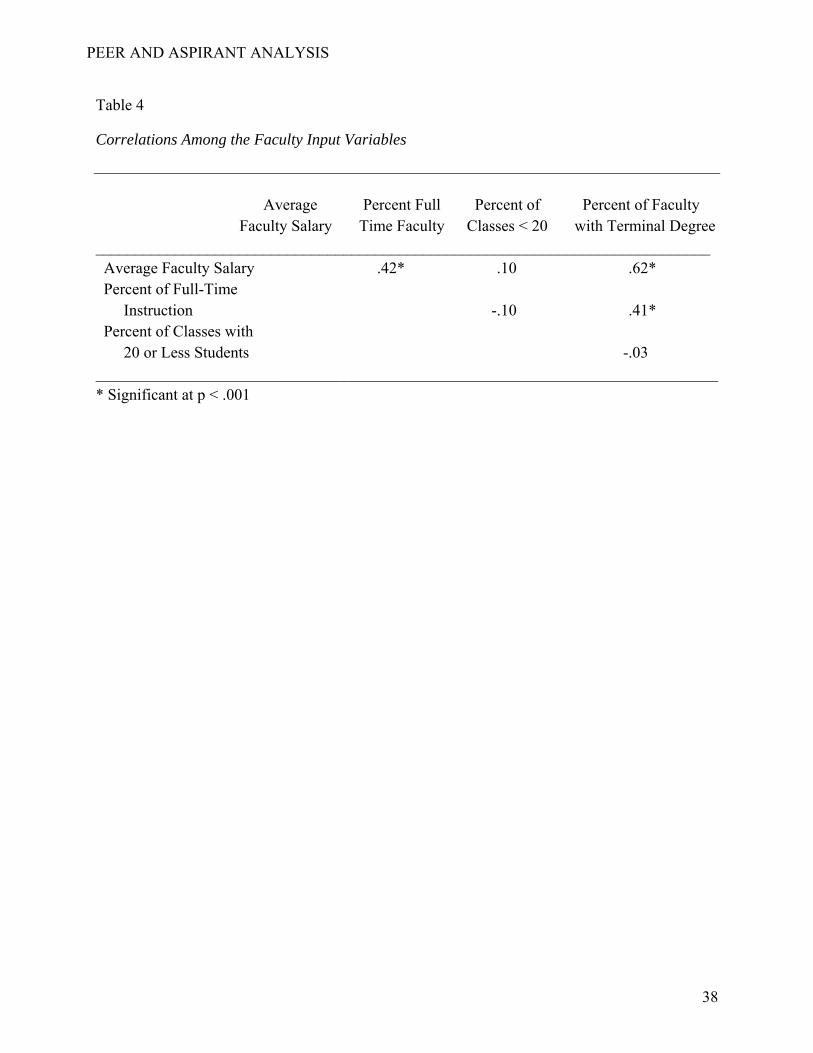
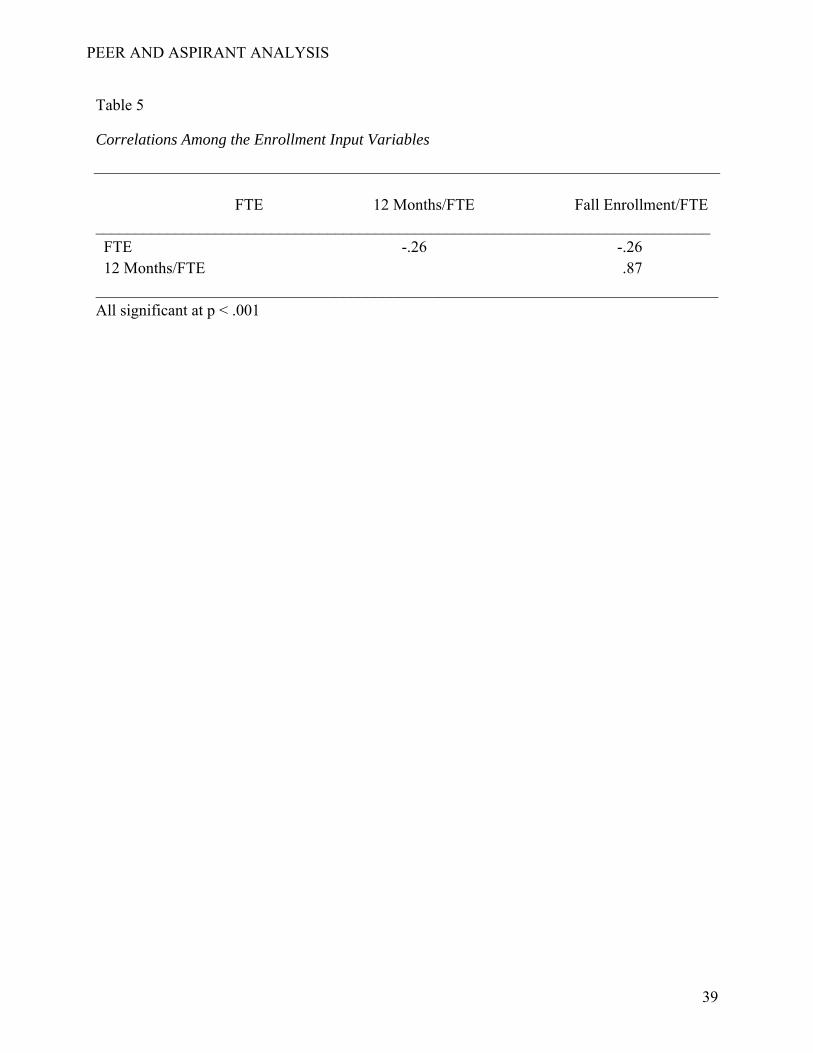
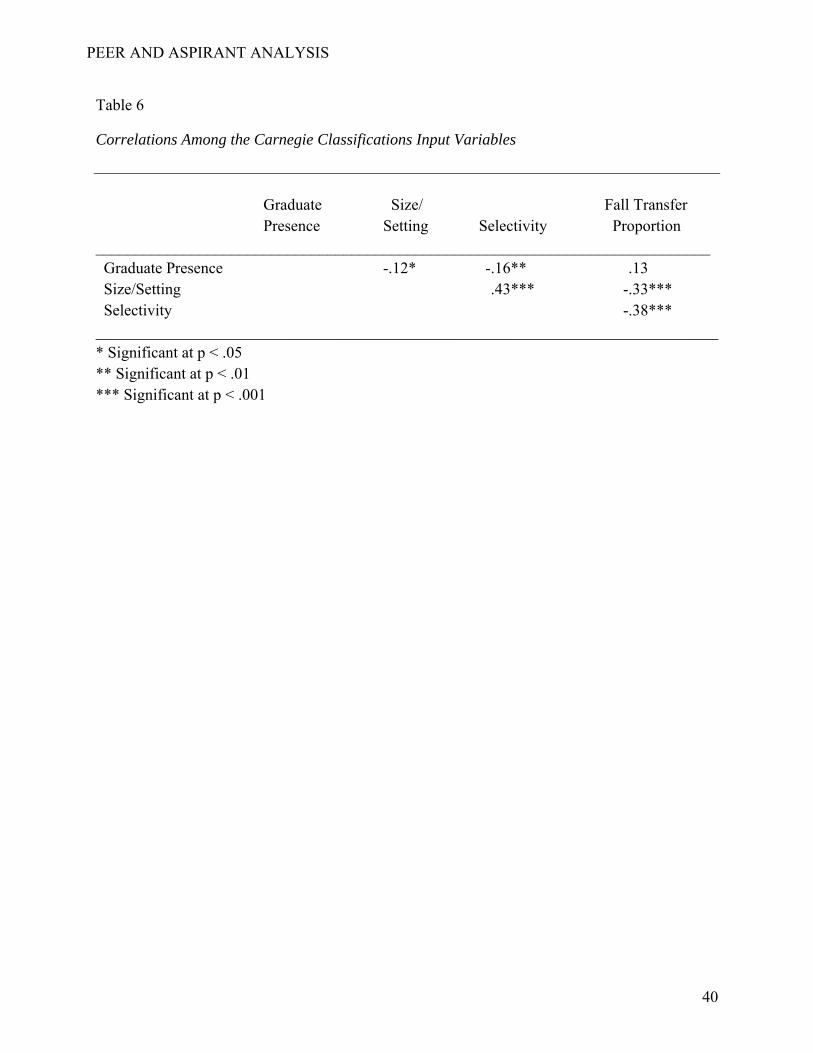
Correlations among the three KPIs and each of the nineteen influencers were computed.
As suggested by Hom (2008), the correlations served as a preliminary step to detect potential
multicolinearity among the variables. The correlations by category are shown in Table 3 through
Table 7 respectively.
With the exception of the SAT indicators, the finance data elements had the highest intra-
category correlations with endowment per FTE and instructional expenses per FTE having the
highest correlation among the finance variables (r= .78, n= 282, p< .001). Although moderate
associations among the variables were expected, care interpreting the results is warranted.
Unsurprisingly, correlations were fairly high among the performance predictors with one-
year retention rate and six-year graduation rate posting the largest correlation
(r= .862, n= 286, p < .001). The first quartile Mathematics SAT score had the highest correlation
with both one-year retention and six-year graduation rate than any of the other nineteen variables

PEER AND ASPIRANT ANALYSIS
9
(r= .85, n= 231, p < .001 and r= .88, n= 231, p < .001 respectively). The institutional
characteristic, size and setting Carnegie Classification, was best associated with the ratio of
Bachelor’s degrees to FTE compared to the other criteria (r= .56, n= 282, p < .001).
An ordinary least square (OLS) regression analyses determined the best combination of
data element predictors for each KPI. Regressions using the enter method in SPSS were
compiled separately for the five variable categories for each KPI, a total of fifteen models. The
enter method was preferred over other models because it ensured that all category variables were
placed in the model enabling comparisons among the variables (SPSS, 2008). An overall model
was also computed using the best predictor or predictors from each of the five category
regressions. The variable with the best significance of the standardized beta coefficients was
deemed as the best predictor. The significance of a beta weight indicates if the variable is a
predictor relative to the variable’s absence in the model (Cohen & Cohen, 1983). Because of the
high correlations among the variables, the statistical design intended only one variable to be
chosen from each category for each KPI. Note that the interpretation of the four institutional
characteristics may be problematic because unlike the other variables these are ordinal scale
variables.
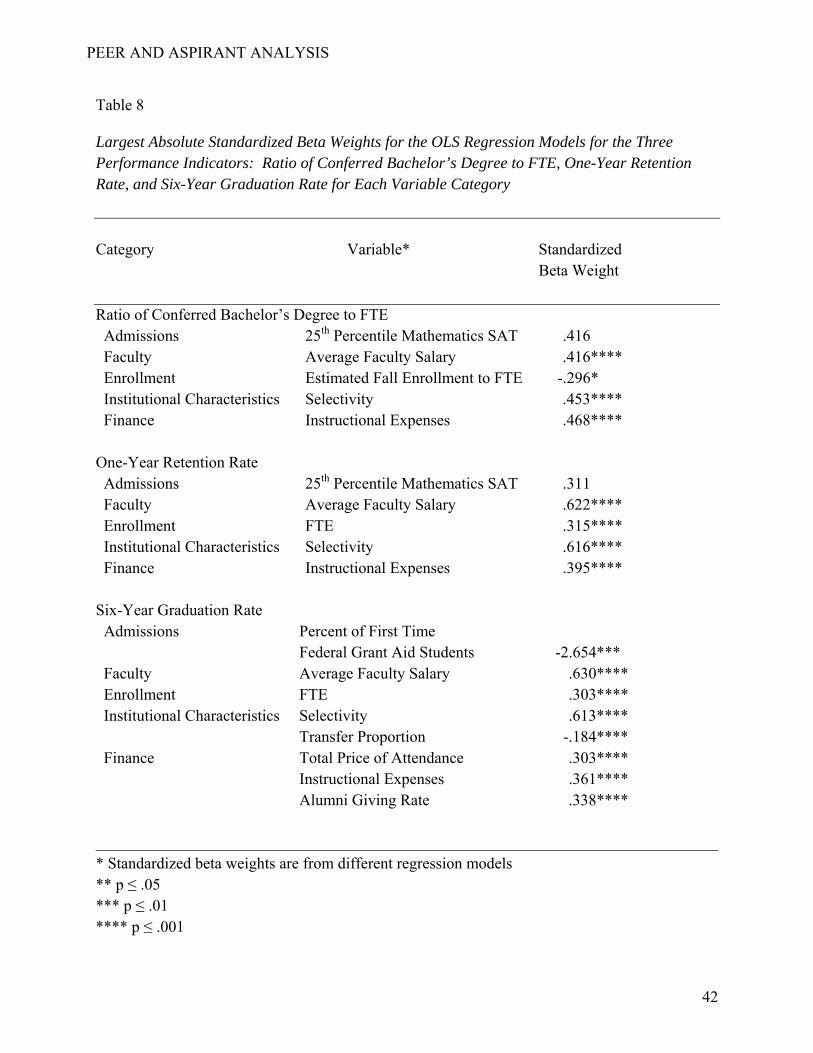
The variables in each category that emerged as the best predictor for the ratio of
conferred Bachelor’s degree to FTE are shown in Table 8. Although not significant, the 25th
percentile Mathematics SAT score had the highest beta coefficient for the admissions variables
(β = .416, p≥ .05). Unexpectedly, average faculty salary emerged as the best predictor for the
faculty variables and estimated fall enrollment to FTE for the enrollment category ((β = .400, p ≤
.001 and β = -.296, p ≤.05 respectively). Selectivity had the largest standardized beta coefficient
among the institutional characteristics and the only variable that was significant in the regression

PEER AND ASPIRANT ANALYSIS
10
model. (β = .453, p ≤ .001). Instructional expenses per FTE had the highest standardized beta
coefficient among the finance variables (β = .468, p ≤ .001).
As seen in Table 8, the 25th percentile Mathematics SAT score was also the best
predictor for one-year retention rate (β = .311, p≥ .05). As with the ratio for conferred
Bachelor’s degree to FTE, average faculty salary was the best predictor of the faculty variables
(β= .622, p ≤ .001), FTE for the enrollment category (β = .315, p ≤ .001), and selectivity among
the institutional characteristics (β = .616, p ≤ .001). Likewise, instructional expenses per FTE
was also the best predictor for the finance variables (β = .395, p ≤ .001).
Results for the six-year graduation rate OLS regression model are also posted in Table 8.
For the six-year graduation rate, the percent of students receiving federal grant aid posted the
largest absolute beta coefficient among the admissions variables (β = -2.654, p ≤ .01). Again,
average faculty salary was the best predictor of the faculty variables and FTE fared best for the
enrollment categories (β = .630, p ≤ .001; β = .303, p ≤ .001 respectively). Both selectivity and
transfer proportion were significant institutional characteristics (β = .613, p ≤ .001; β = -.184, p ≤
.001 respectively). For the finance variables, total price of attendance, instructional expenses per
FTE, and alumni giving posted the lowest significance (β = .303, p ≤ .001; β = .361, p ≤ .001; and
β = .338, p ≤ .001 respectively).
Ideally, the fewest variables that can best reflect the institution’s priorities should be used
for determining comparison institutions (Hom, 2008). A balance of institutional metrics for peer
selection was sought by using the best predictors from each of the five variable categories rather
than five best predictors regardless of category. Therefore, three additional OLS regression
models were generated using the best predictor(s) from each of the five variable categories.
Results are shown in Table 9.
PEER AND ASPIRANT ANALYSIS
11
Only the 25th percentile Mathematics SAT score and selectivity variables posted a
significant result for the ratio of conferred Bachelor’s degree to FTE (β = .348, p ≤ .001;
β = .282, p ≤ .001 respectively). The 25th percentile Mathematics SAT score and selectivity
variables were also the lone significant predictors for the one-year retention rate (β = .465, p ≤
.001; β = .301, p ≤ .001 respectively). On the other hand, of the eight potential predictors that
were entered into the regression equation for the six-year graduation rate, all but two were
significant, FTE and total price of attendance ((β = .090, p ≥ .05 and β = .006, p ≥ .05
respectively).
The previous step identified the variables that were best associated and predicted the
three KPIs most aligned with Siena College’s priorities: (a) ratio of conferred Bachelor’s degree
to FTE, (b) one-year retention rate, and (c) six-year graduation rate. A collective examination of
these KPIs was undertaken to determine their value to the peer selection process. The three
regression models that correspond to three KPIs are very similar. One difference was the
enrollment variables that were entered, notably FTE versus estimated fall enrollment to FTE that
emerged as the best predictor of six-year graduation rates. Since the latter did not post a
significant result, it was eliminated from further consideration. Another exception was the six-
year graduation rate regression model that included percent of new students receiving federal
grant aid instead of the 25th percentile Mathematics SAT score parameter. In fact, the six-year
graduation rate OLS models included three other variables not in the two other regression
models: (a) transfer proportion, (b) total price of attendance, and (c) alumni giving rate.
Consequently, the five variables used in the conferred Bachelor’s degree to FTE and one-year
retention rate regression models: (a) 25th percentile Mathematics SAT score, (b) average faculty

PEER AND ASPIRANT ANALYSIS
12
salary, (c) FTE, (d) selectivity, and (e) instructional expenses along with the additional four six-
year graduation rate model variables were deemed the most credible data elements.
Nearest neighbor methodology is a multi-step process that consists of determining the
most relevant parameters, the numerical difference between the reference and comparative
institution on each of those parameters, and deciding the range that constitutes a proximate or
“near neighbor” difference. As such, peer institutions are determined by having metrics that are
proximate to the target institution (McLaughlin, Howard, & McLaughlin, 2011). The numeric
difference between Siena College and each institution was determined for these nine variables.
In turn, these differences determined peer proximity or nearest neighbor. A proximity score was
compiled using the standard deviation of each performance measure and variable as reference to
the extent of nearness. Specifically, a proximity score of 1 was assigned to any institution that
was between one-half and one standard deviation of Siena’s metric, a score of 2 was given if the
institution was within one-half a standard deviation. The average of the nine equally weighted
proximity scores derived the proximity index.
This case study departs from the nearest neighbor methodology in at least two ways.
First, a small number of data elements were used to compute the proximity index, an aggregate
score across nine predictor variables. Nevertheless, a large number of variables that are highly
correlated make the interpretation difficult to interpret (Gater, 2003). Second, no data element
weighting scheme was devised as reported by previous studies (Hom, 2008; McLaughlin,
Howard, & McLaughlin, 201 1).
The proximity indices for these institutions range from 0 to 1.78. Two peer sets emerged
from examining the proximity index percentiles. The first set of peers, near peers, comprised the
19 institutions that had proximity indices that corresponded to the 95th percentile or higher.

PEER AND ASPIRANT ANALYSIS
13
Another 19 institutions constituted the next tier of peer institutions. These “almost peers” had
proximity indices between the 90th and 95th percentiles. The two peer groups are listed in
Appendix C.
Aspirant Selection Determined by Cluster Analysis. Most studies focus on a single
methodology to select a peer set of institutions or an aspirant group. Seldom, do these studies
distinguish between peer group formation methodology and the process to determine aspirant
institutions. In this respect, this case study differs from previous research. A different statistical
method, cluster analysis, was used to determine a list of aspirant institutions. That said, the same
nine predictor variables and KPIs, used in the peer selection, were slated for the aspirant
analyses.
A cluster analysis was performed for each KPI using the predictors corresponding to each
KPI regression model. The likelihood distance method was used to determine the institutional
clusters. In a two-step cluster analysis, individual institutions are consecutively being combined
to form clusters subsequent to an initial pass to find the cluster centers (SPSS, 2008). KPIs and
corresponding KPI quartile means for each cluster were calculated to ascertain the
distinctiveness of each cluster. Means for the predictors that were most relevant to the cluster
formation and the average KPI quartile assignment for each cluster are shown in Figure 1.
The aspirant cluster is shaded red in Figure 1. The means for this cluster for the ratio of
conferred Bachelor’s Degree to FTE quartile categories are noticeably larger than the other two
clusters. For example, the 25th percentile Mathematics SAT score is over 100 points higher for
the aspirant cluster than the next best cluster, cluster 2 (M= 571.55; M=465.15 respectively).
Instructional expenses per FTE for the aspirant cluster are twice as large as the next largest
cluster, cluster 2 (M= $15,724.06; M= $7,628.16 respectively). Similarly, the average faculty

PEER AND ASPIRANT ANALYSIS
14
salary is highest for the aspirant cluster (aspirant cluster: M= $76,156.18; cluster 2: M=
$56,271.03; cluster 1: M= $51,876.53). The aspirant cluster contains schools that are more
selective. The predictor means among the categories are equally spaced with the aspirant cluster
at almost one standard deviation above the mean, cluster 2, at the mean, and the lowest
performing cluster, cluster 1, at a distance that is almost one standard deviation below the mean
(M= .23, M= .20, and M= .17 respectively). The KPI quartile category means accentuate the
cluster differences. As such, the cluster with the lowest performance KPI quartile category
mean, cluster 1, aligns with the smallest variable means. On the other hand, the aspirant cluster
is markedly larger than the middle cluster, cluster 2 (M= 3.61 and M= 2.25 respectively).
The results of cluster analysis for the one-year retention rate quartile categories are
identical to the Bachelor’s degree to FTE quartile categories because the same set of predictors
were used. The aspirant cluster has a mean one-year retention rate that is greater than one
standard deviation from the mean compared to cluster one that is distanced one standard
deviation below the mean (M= 88.73% and M= 73.75% respectively). The dispersion of the
predictor quartile category means among clusters is indicative of the of the clusters’ ability to
discern among the different one-year retention rate means (cluster 1: M=1.42; cluster 2:
M=2.18; aspirant cluster: M = 3.66).
There is marked difference between the two clusters’ six-year graduation rates (M=
57.68% and M= 79.33% respectively). However, only two clusters were classified mitigating
the effectiveness of the cluster analysis with a substantial 96 institutions in the smallest cluster.
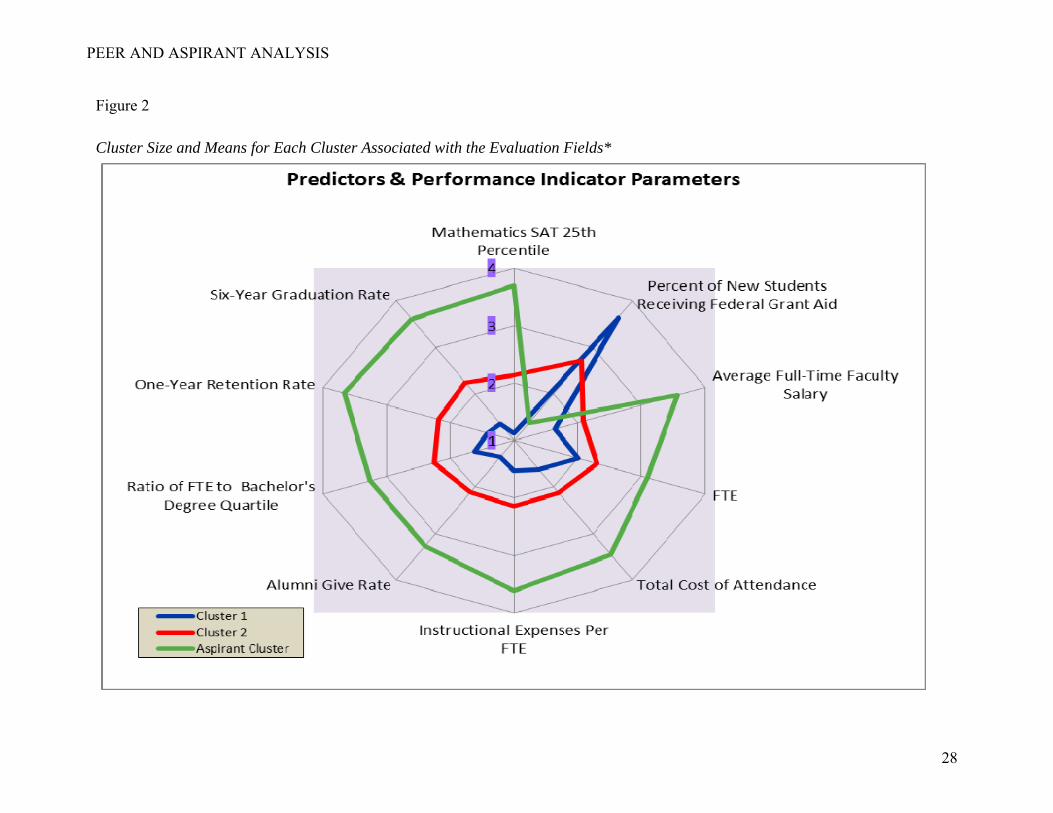
A joint investigation of the Bachelor’s degree to FTE and one-year retention rate cluster
analyses is illustrated in the radar chart in Figure 2. To improve the interpretation of the radar
chart, variables should be transformed into scales with similar magnitudes (McLaughlin,
PEER AND ASPIRANT ANALYSIS
15
Howard, &McLaughlin, 2001; Meristosis & Shedd, 2001). Accordingly, all ratio scaled
predictors used in the three cluster analyses were converted to quartile categories. The resulting
average quartile categories for each cluster is plotted. The distinction among clusters are
graphically apparent in the radar chart depicted in Figure 2. The aspirant cluster outperforms the
other two clusters on all predictor and KPIs with the exception of the percent of new students
receiving federal grant aid. Cluster 1, the cluster with the smallest average for all three KPIs,
has the largest average quartile for the percent of new students receiving federal grant aid.
Using all three aspirant clusters as the basis for the selection criteria and eliminating any
school that were marked as a peer, resulted in 51 potential aspirant institutions. Somewhat
unmanageable in size, an aspirant index was computed for these 51 schools. In concept, the
aspirant index is similar to the proximity index with the following germane differences. First,
the KPIs are the basis of the aspirant index mainly because it is institutional performance that
Siena College aspires. On the other hand, the nine KPI predictors determined potential peer
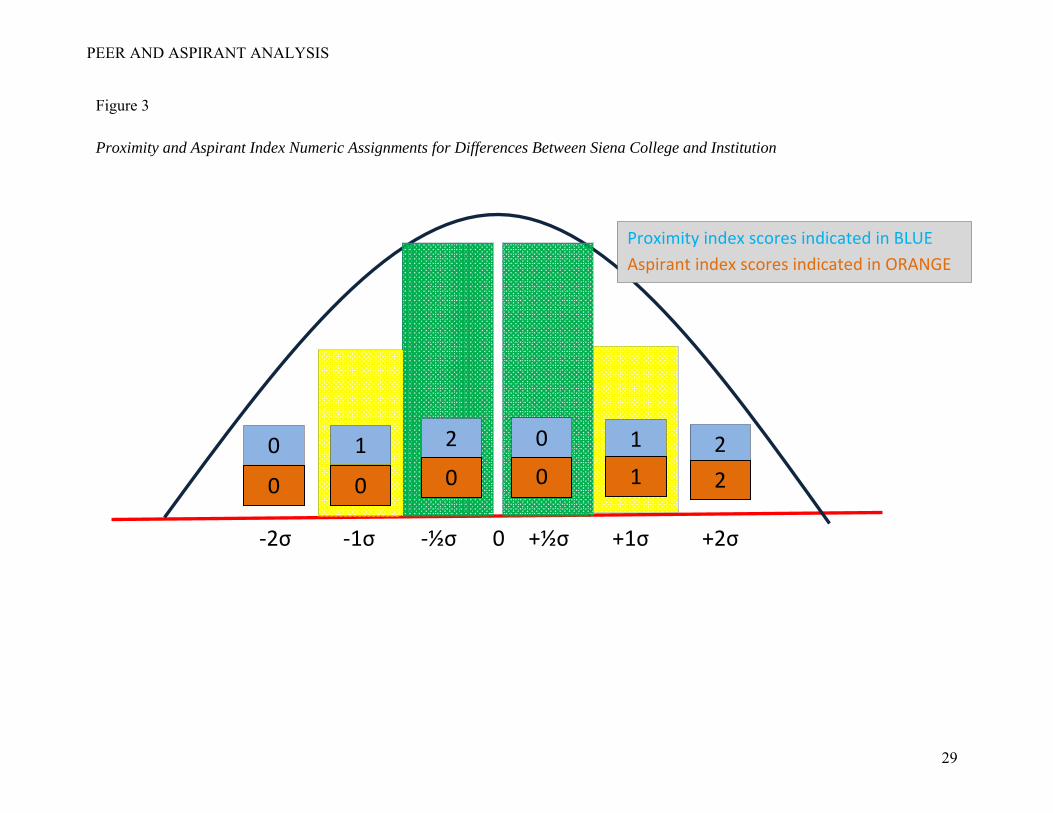
institutions. Second, the peer index gives more credence to small differences; the aspirant index
awards large positive differences. Third, as mentioned, the direction of that difference is
unimportant to the proximity index calculation, it is at the heart of the aspirant index calculation.
That is, if the aspirant metric was greater than the reference institution’s value, a positive
aspirant score was assigned. Fourth, the standard deviations used for comparisons were only
compiled for those schools that met the aspirant selection criteria. The differences between the
two indices are illustrated in Figure 3.
An aspirant score of 1 was assigned to any institution that was between one-half and one
standard deviation above Siena College’s metric, a score of 2 was given if the institution was
PEER AND ASPIRANT ANALYSIS
16
greater than one-standard deviation. If an institution’s metric was within one-half the standard
deviation or less of Siena College, the aspirant score was 0.
The aspirant index was the average of the equally weighted aspirant scores. Twelve
institutions had a negative aspirant index and were removed from the initial aspirant list.
Twenty-seven institutions posted a zero aspirational index and thirteen institutions in the
preliminary aspirant set had an aspirant index greater than zero. The latter constituted the
aspirant list or Tier I aspirant institutions. The former set of institutions is ancillary and
comprises the Tier II aspirant list.
Other Reference Group Selection Methodologies
Overview
Peer or reference group formation research and protocols are sparse but a variety of
techniques do exist. Deciding on the most appropriate method requires both the knowledge of
the statistical procedure and the purpose of the eventual comparison(s). Some of those
methodologies are listed below. The two methodologies used for this case study, nearest
neighbor and cluster analysis, are included.
Cluster Analysis
At least two cluster analysis techniques have been employed to determine peer
institutions. First, as the name implies, two-step cluster analysis entails two iterations, one to
decipher the cluster and corresponding cluster centers and another to determine cluster
assignment. Second, hierarchal cluster analysis can be deployed when a small number of initial
institutions are being considered. In this method, the distance between institutions on a set of
parameters are computed (Hom, 2008). Euclidean distance and correlations are the most

PEER AND ASPIRANT ANALYSIS
17
common. Based on these distance designations, the researcher can determine clusters by
assigning membership, often manually.
Data Envelop Analysis
This statistical procedure is best for finding aspirant institutions by determining the most
efficient institutions, often indicated by financial indicators (Eckles, 2010). A disadvantage of
this selection tool is that the identification of benchmark institutions is relative to the original list
of selected institutions regardless of their actual efficiency (Taylor & Harris, 2004).
Discriminant Analysis
This statistical technique classifies institutions into one or more mutually exclusive
groups. Multi-phased, a classification rule is first developed using institutions for which group
membership is known. Then, the rule is used to classify institutions for which group
membership is not known (SPSS, 2008). The former phase may render this technique
impractical. Regardless, discriminant analysis has also been used to ascertain the accuracy of
cluster classifications (Huxley, 2009).
Factor Analysis
Institutions are classified by factors determined by the correlations or co-variances
among the institutional parameters. As with discriminant analyses, prior knowledge of the
institutions and the associations among institutional parameters are essential.
Nearest Neighbor
The determination of the best matches or nearest neighbors varies but the crux of this
methodology is deciphering the extent an institution is a peer (McLaughlin, Howard, &
McLaughlin, 2011). This is accomplished by computing the distance between institutions on
targeted predetermined parameters.

PEER AND ASPIRANT ANALYSIS
18
Subject Matter Experts (SMES)
Engaging faculty and staff that have a vested interest in assembling a set of peers is not
only a sound method to validate a proposed set of peer institutions but subsequently may
increase adoption of the reference group.
Variable Match
Reference group formation does not necessarily require sophisticated statistical
procedures. In fact, alignment by a few institutional parameters may be sufficient (Anderes,
1999). This review should start with the mission of each institution under consideration but may
also include degree level, program mix, type of students served, urban setting, expenditures, and
selectivity.
External Peer Selection Tools
Peer selection tools available on the web have proliferated recently. Albeit, some of these
tools can be useful and certainly provide information and capabilities not availed by this case
study. Listed below is a brief description of each.
American Association of University Professors (AAUP)
http://chronicle.com/article/faculty-salaries-data-2012/131431#id=144050. One of the
most frequently requested comparisons is that of faculty compensation. The AAUP provides
aggregated information from the Faculty Salaries Survey. The provided link is a user friendly
interface developed by the Chronicle of Higher Education.
Association of Governing Boards (AGB)
http://agb.org/benchmarking-service. For a subscription fee of $850, this application
primarily provides financial metrics. Admittedly, the application was not tested by the authors.

PEER AND ASPIRANT ANALYSIS
19
CollegeBoard
https://bigfuture.collegeboard.org/compare-colleges. Both search and comparison
capabilities are available on the Compare Colleges website hosted by the CollegeBoard.
Information is limited, partly due to the fact that the primary audience is prospective students and
parents. For example, information about faculty or instructional expenses are not available.
Additionally, only a maximum of three colleges can be compared simultaneously.
College Measures
http://www.collegemeasures.org/. Several key institutional indicators are automatically
aggregated by state and nationally. Institutional information is displayed as a performance
scorecard which must be viewed separately for each school.
College Miner
http://collegeminer.com/research/outcomestool.aspx. Although incomplete, this website
is unique because it reports alumni salary information. Somewhat limited, simultaneous
comparisons can only be made of a maximum of three institutions. As with College Measures,
the target audience is prospective students and parents. Priority of the interface appears to be
ease of use and generating colorful graphics.
College Navigator
http://nces.ed.gov/collegenavigator/. Provided by NCES, this tool narrows college peers
by level of award, institutional type and geographic location. Recommended is use of this peer
analysis tool or the IPEDS Data Center website described below.
College News
http://bestcolleges.collegenews.com/. Compare Colleges, a College News service,
provides the rankings of several publications including the US News & World Report (US News

PEER AND ASPIRANT ANALYSIS
20
& World Report, 2011). Also shown is information about enrollment size, acceptance rates, and
tuition. Although visually appealing, interface is somewhat confusing and cumbersome.
College Results Online
http://www.collegeresults.org/search_group.aspx. Sponsored by the Education Trust, the
origin of the data is the same as this case study, primarily IPEDS information. Peer set creation
is limited with only type and geographic location to limit the selection.
IPEDS Data Center
http://nces.ed.gov/ipeds/datacenter/. The Data Center, also supported by NCES, provides
access to data to multiple institutions simultaneously. The list of frequently used/derived
variables makes that access easy and quick. Early released data to IPEDS key holders can be
obtained by request. Most of the data for this case study is from the IPEDS Data Center.
National Assessment of Service and Community Engagement (NASE)
http://www.siena.edu/pages/5628.asp. Undeniably, the mention of NASCE is somewhat
self-serving because it is sponsored by Siena College. However, NASCE provides comparisons
among participants regarding student service engagement.
National Association of College and University Business Officers (NACUBO)
http://www.nacubo.org/Research/NACUBO_Benchmarking_Tool.html. Comparative
information sourced from several NACUBO surveys is available to member institutions. A peer
selection tool is among the site’s capabilities.
The Institute for College Access & Success
http://ticas.org/. The Institute for College Access & Success also hosts CollegeInsight.
The Institute for College Access & Success website aggregates financial aid information for user
selected institutions. This online tool enables searches on sector, geographic location,
PEER AND ASPIRANT ANALYSIS
21
enrollment size, percent of Pell recipients, and tuition. The tool also offers some data
aggregation options. An unique feature is the ability to use historical data to select institutions.
US News & World Report
http://premium.usnews.com/best-colleges. For a fee, additional data provided to US
News & World Report can be downloaded for participating institutions. Rankings aside, some of
the information that can be acquired from US News & World Report is not readily available
elsewhere. This information includes awarded financial aid packages, class size, and high school
GPA of entering students.
Limitations
This applied research project sought to demonstrate the selection of a relevant group of
institutions for comparisons. The research was conducted at a small private non-profit four-year
liberal arts institution and therefore, may not be applicable to all institutions. Moreover, the
functionality of the resultant reference group will differ across institutions and subject to change
at Siena College depending on the purpose of the comparison (Shin, 2009).
The KPIs and predictors variables slated for this study best aligned with the institution
under investigation. In addition, the case study was conducted to facilitate campus interest by
allaying apprehension about the difficulty and complexity of data collection and analysis.
Therefore, the college parameters were unique to this applied research study. The variables
chosen were based on five categories as classified by the researchers. The investigation of other
classification schemes should be investigated (Andres, 1999; Powell, Gilleland Suitt, & Pearson,
2012; Warne, Schmidtke, Vaughn, & Leonard-Getty, 2005).
The most recent data at the time of the study was used. Nevertheless, the data was
singular in time frame and did not reflect historical or predicted trends. Multiple extractions

PEER AND ASPIRANT ANALYSIS
22
across several time frames may have warranted alternate methodologies and, hence, different
peer and aspirant groups.
Admittedly, the data elements especially the variables chosen for the peer and aspirant
selection statistical procedures were highly correlated. Although the use of these variables
provided a broad spectrum of institutional information, the potential multicollinearity among the
variables may have diminished the selection accuracy.
Nearest neighbor and cluster analysis were the primary methods for reference group
selection. This case study is unique in that it details two reference group selection
methodologies. The application of these statistical techniques is also distinctive in that campus
need and practicality were the primary priorities of the case study. Otherwise, a different
methodology and design may have been employed. Further, these techniques were adapted to fit
available data and modified to best meet the College’s objectives. Institutions should consider
alternative techniques that best fit the intended uses of peer and aspirant groups.
Data availability and data element selection aside, the cluster analyses identified over 50
aspirant institutions, an unreasonably large comparison group. The most sophisticated statistical
techniques and unfettered availability of data cannot replace a clearly stated purpose of the
comparison nor input from various stakeholder groups. The former provides irreplaceable
selection criteria; the latter helps to confirm the legitimacy of institutions as members of the peer
or aspirant groups.
Conclusion
A case study accompanied by a review of the literature was conducted to ascertain
appropriate methodologies and tools to assemble two reference groups, peer institutions and a set
of aspirants. The case study was conducted at a small private non-profit liberal arts institution.
PEER AND ASPIRANT ANALYSIS
23
Nonetheless, the case study depicted a fairly generic model of reference group formation. The
case study represented a structure of implementation that can be adapted to most reference group
compilations.
A set of peer and aspirant institutions were identified as the result of a deliberate and
comprehensive process. This included the selection of an original set of institutions and an
examination of the most pertinent variables to use in the analyses. Alternatively, confounding
and irrelevant information and analyses were eliminated reducing both the effort and data
required. The disparity in purpose of the two reference groups necessitated the use of two
different statistical procedures, nearest neighbor and cluster analysis, for their formation. That
said, the cluster analysis failed to produce a reasonable number of aspirant institutions. Instead,
an aspirant index was devised to further pinpoint appropriate aspirant institutions.
This case study demonstrated that institutional characteristics are not sufficient criteria to
select peer institutions. A multidimensional approach of determining institutional peers that are
similar on both the parameters that reflect institutional performance priorities and data elements
that are indicative of those priorities is superior to peer selection based on generic institutional
characteristics. Moreover, formative consultations of faculty and staff on the peer selection
design validated and added credibility to the final peer and aspirant lists. As a result, stakeholder
input, review of previous research, and implemented statistical techniques produced the most
suitable set of peer and aspirant institutions.
Availability of data from IPEDS and other sources continues to expand. In addition,
linked information from diverse resources is readily available (Trainer, 2008). Coupled with an
increase in the public demand for accountability, both are complicit in the increased use of peer
comparisons. However, direction on methodology is inconclusive, hindered by a paucity of

PEER AND ASPIRANT ANALYSIS
24
previous studies. Posited is that the procedures documented in this case study are potentially
generalizable to a wide array of institution types. Again, because of the dearth of previous
studies, this can insinuated but not corroborated. Peer selection models, differentiated by
institutional type and function could evolve with additional evidence.
Further, the impact of peer comparisons on institutional quality and improvement is
unknown. Little guidance exists on the assessment of peer selection and subsequent peer
comparisons (Powell, Gilleland Suitt, & Pearson, 2012). In other words, verification of the
effectiveness of peer comparisons are lacking. Further research should evaluate the effects of
peer comparisons, if any, on institutional quality.
PEER AND ASPIRANT ANALYSIS
25
References
Anderes, T. (1999). Using peer institutions in financial and budgetary analyses. New Directions
For Higher Education, 107, 117-123.
Carnegie Foundation. (2011). The Carnegie Classification of institutions of higher education.
Retrieved June 18, 2012, from www.carnegieclassification.org/
Cohen, J., & Cohen, P. (1983). Applied multiple regression/correlation analysis for the behavior
sciences (2nd ed.). Hillsdale, NJ: Erlbaum.
Cohodes, S., & Goodman, J. (2012). First degree earns: The impact of college quality on college
completion rates. Retrieved August 14, 2012, from
http://web.hks.harvard.edu/publications/getFile.aspx?Id=836
Eckles, J.E. (2009). Evaluating the efficiency of top liberal arts colleges. Research in Higher
Education, 51(3), 266-293.
Gater, D.S. (2003). Using national data in university rankings and comparisons. Paper presented
at the Association for Institutional Research International Forum, Tampa, FL.
Hom, W. (2008). Peer grouping: The refinement of performance indicators. Journal of Applied
Research in the Community College, 16(1), 45-51.
Huxley, R. G. (2009). Formation of community college clusters using the CCSSE benchmarks
for extra-large community colleges. Journal of Applied Research in Community College,
16(2), 103-108.
///Lorr, .M. (1983). Cluster Analysis for the social sciences. San Francisco, CA: Jossey-Bass.
McLaughlin, G., & Howard, R.. (2005). Comparison Groups: Data and decisions. Workshop
presented at the Association for Institutional Research International Forum, San Diego,
CA.

PEER AND ASPIRANT ANALYSIS
26
McLaughlin, G., Howard, R., & McLaughlin, J. (2011). Forming and using peer groups. Paper
presented at the Association for Institutional Research International Forum, Toronto, ON.
Merisotis, J. P., & Shedd, J. M. (2001). Using IPEDS to develop a classification system for two-
year postsecondary institutions. New Directions for Community Colleges, 122, 47-61.
Powell, B. A., Gilleland Suitt, D., & Pearson, L. C. (2012). Expenditures, efficiency, and
effectiveness in U.S. undergraduate higher Education: A national benchmark model. The
Journal of Higher Education, 83(1), 102-127.
Siena College. (2012). Key performance indicators: June 2012. Loudonville, NY: Author.
Shin, J. C. (2009). Classifying higher education institutions in Korea: A performance-based
approach. Higher Education, 57(2), 247-266.
SPSS. (2008). PASW Statistics 18 command syntax reference. Chicago, IL. Author.
Taylor, B. & Harris, G. (2004). Relative efficiency among South African universities: A data
envelopment analysis. Higher Education, 47(1), 73-89.
Trainer, J. F. (2008). The role of institutional research in conducting comparative analysis of
peers. New Directions For Higher Education, 2008(141), 21-30.
Doi: 10.1002/he.290
US News & World Report. (2011). College rankings and lists. Retrieved June 13, 2012 from
http://premium.usnews.com/best-colleges
Warne, T.R., Schmidtke, K., Vaughn, D. L., & Leonard-Getty, K. (2005). Peer group analysis:
For administrators only? Paper presented at the Association for Institutional Research
International Forum, San Diego, CA.

PEER AND ASPIRANT ANALYSIS
27
Figure 1 Cluster Size and Means for Each Cluster Associated with the Evaluation Fields*
* Red highlight indicates best or “aspirant” cluster
PEER AND ASPIRANT ANALYSIS
28
Figure 2 Cluster Size and Means for Each Cluster Associated with the Evaluation Fields*
PEER AND ASPIRANT ANALYSIS
29
Figure 3 Proximity and Aspirant Index Numeric Assignments for Differences Between Siena College and Institution
1 1 2 0 0 2
‐2σ ‐1σ ‐½σ 0 +½σ +1σ +2σ
0 0 0 0 1 2
Proximity index scores indicated in BLUE
Aspirant index scores indicated in ORANGE

PEER AND ASPIRANT ANALYSIS
30
Table 1 Counts, Means, and Standard Deviations for the Initial Set of Peers, Potential Reference Groups, and Siena College
Reference Group-All Variable Standard Siena N Mean Deviation Mean
Applicants per FTE 271 1.71 .93 2.94 Percent Admitted 271 60.40% 17.71% 48.00% Admissions Yield 271 31.27% 13.75% 17.00% Percent of First Time Federal 285 40.30% 20.10% 24.00% Grant Aid Students 25th Percentile 225 486.11 78.90 510 Critical Reading SAT 75th Percentile 225 599.57 78.59 610 Critical Reading SAT 25th Percentile Mathematics SAT 231 490.10 75.22 530 75th Percentile Mathematics SAT 231 596.09 73.82 630 Average Faculty Salary 286 $61,955 $15,133 $80,668 Percent of Full-Time Faculty 278 60.89% 19.33% 64.00% Percent of Classes with 20 247 63.56% 9.96% 42.00% or Less Students Percent of Faculty with 240 81.95% 14.51% 89.00% Terminal Degree FTE 286 1,671 627 3,310 Unduplicated Total 286 1.09 .13 1.01 Enrollment Per FTE Estimated Fall Enrollment Per FTE 286 1.09 .20 1.03 Total Price of Attendance 282 $40,328 $9,549 $43,874 Instruction Expenses Per FTE 295 $10,036 $5,976 $8,390 Endowment FASB Per FTE 283 $69,278 $128,745 $36,819 Alumni Giving Rate 240 21.89% 11.89% 17.00% Bachelor Degrees Conferred 286 .20 .04 .24 Per FTE One-Year Retention Rate 286 76.63% 12.25% 87.23% Six-Year Graduation Rate 286 60.67% 18.69% 84.82% _____________________________________________________________________________
PEER AND ASPIRANT ANALYSIS
31
Table 1 (continued) Counts, Means, and Standard Deviations for the Initial Set of Peers, Potential Reference Groups, and Siena College
Reference Group-Catholic Variable Standard Siena N Mean Deviation Mean
Applicants Per FTE 25 1.39 .72 2.94 Percent Admitted 25 67.60% 13.67% 48.00% Admissions Yield 25 30.36% 13.34% 17.00% Percent of First Time Federal 27 37.41% 14.35% 24.00% Grant Aid Students 25th Percentile 16 467.19 45.24 510 Critical Reading SAT 75th Percentile 16 589.25 50.00 610 Critical Reading SAT 25th Percentile Mathematics SAT 18 472.56 47.59 530 75th Percentile Mathematics SAT 18 575.72 51.26 630 Average Faculty Salary 27 $59,480 $11,465 $80,668 Percent of Full-Time Faculty 27 55.75% 16.25% 64.00% Percent of Classes with 20 25 60.56% 12.16% 42.00% or Less Students Percent of Faculty with 24 80.17% 12.32% 89.00% Terminal Degree FTE 27 1,670 626 3,310 Unduplicated Total 27 1.14 .14 1.01 Enrollment Per FTE Estimated Fall Enrollment Per FTE 27 1.16 .16 1.03 Total Price of Attendance 27 $40,463 $5,577 $43,874 Instruction Expenses Per FTE 27 $7,924 $3,247 $8,390 Endowment FASB Per FTE 26 $25,757 $128,745 $36,819 Alumni Giving Rate 25 20.12% 8.57% 17.00% Bachelor Degrees Conferred 286 .20 .04 .24 Per FTE One-Year Retention Rate 27 78.78% 9.62% 87.23% Six-Year Graduation Rate 27 62.33% 16.48% 84.82% _____________________________________________________________________________

PEER AND ASPIRANT ANALYSIS
32
Table 1 (continued) Counts, Means, and Standard Deviations for the Initial Set of Peers. Potential Reference Groups, and Siena College
Reference Group-Baccalaureate* Variable Standard Siena N Mean Deviation Mean
Applicants Per FTE 111 1.72 .90 2.94 Percent Admitted 108 64.54% 14.60% 48.00% Admissions Yield 108 28.14% 11.87% 17.00% Percent of First Time Federal 111 40.25% 18.96% 24.00% Grant Aid Students 25th Percentile 92 470.17 54.76 510 Critical Reading SAT 75th Percentile 92 591.05 62.97 610 Critical Reading SAT 25th Percentile Mathematics SAT 93 478.28 53.52 530 75th Percentile Mathematics SAT 93 589.54 60.00 630 Average Faculty Salary 110 $60,506 $9,164 $80,668 Percent of Full-Time Faculty 110 62.32% 15.61% 64.00% Percent of Classes with 20 106 60.30% 9.81% 42.00% or Less Students Percent of Faculty with 103 83.53% 10.78% 89.00% Terminal Degree FTE 111 1,746 630 3,310 Unduplicated Total 111 1.07 .08 1.01 Enrollment Per FTE Estimated Fall Enrollment Per FTE 111 1.06 .11 1.03 Total Price of Attendance 111 $38,920 $7,659 $43,874 Instruction Expenses Per FTE 111 $8,922 $3,038 $8,390 Endowment FASB Per FTE 111 $40,609 $60,827 $36,819 Alumni Giving Rate 101 20.20% 8.29% 17.00% Bachelor Degrees Conferred 111 .20 .04 .24 Per FTE One-Year Retention Rate 111 76.74% 10.13% 87.23% Six-Year Graduation Rate 111 60.90% 15.89% 84.82%
* Baccalaureate Carnegie Classifications with No or Some Graduate Coexistence

PEER AND ASPIRANT ANALYSIS
33
Table 1 (continued) Counts, Means, and Standard Deviations for the Initial Set of Peers, Potential Reference Groups, and Siena College
Reference Group-Highly Residential* Variable Standard Siena N Mean Deviation Mean
Applicants Per FTE 236 1.78 .89 2.94 Percent Admitted 230 59.56% 18.20% 48.00% Admissions Yield 230 29.44% 11.91% 17.00% Percent of First Time Federal 236 36.60% 18.95% 24.00% Grant Aid Students 25th Percentile 193 496.29 78.91 510 Critical Reading SAT 75th Percentile 193 609.84 78.10 610 Critical Reading SAT 25th Percentile Mathematics SAT 196 500.67 75.16 530 75th Percentile Mathematics SAT 196 607.02 72.29 630 Average Faculty Salary 235 $64,558 $14,663 $80,668 Percent of Full-Time Faculty 229 63.29% 9.34% 64.00% Percent of Classes with 20 219 60.30% 9.81% 42.00% or Less Students Percent of Faculty with 212 83.66% 13.02% 89.00% Terminal Degree FTE 236 1,788 594 3,310 Unduplicated Total 236 1.06 .09 1.01 Enrollment Per FTE Estimated Fall Enrollment Per FTE 236 1.06 .08 1.03 Total Price of Attendance 236 $41,777 $9,478 $43,874 Instruction Expenses Per FTE 235 $36,671 $10,786 $8,390 Endowment FASB Per FTE 236 $79,851 $138,209 $36,819 Alumni Giving Rate 219 22.97% 11.82% 17.00% Bachelor Degrees Conferred 236 .21 .04 .24 Per FTE One-Year Retention Rate 236 78.40% 11.79% 87.23% Six-Year Graduation Rate 236 63.42% 17.91% 84.82%
* Small or Medium Size Carnegie Classifications with Highly Residential

PEER AND ASPIRANT ANALYSIS
34
Table 1 (continued) Counts, Means, and Standard Deviations for the Initial Set of Peers, Potential Reference Groups, and Siena College
Reference Group-Low Transfer* Variable Standard Siena N Mean Deviation Mean
Applicants Per FTE 182 1.89 .88 2.94 Percent Admitted 181 58.77% 18.58% 48.00% Admissions Yield 181 28.92% 11.47% 17.00% Percent of First Time Federal 182 30.77% 14.15% 24.00% Grant Aid Students 25th Percentile 152 518.53 72.17 510 Critical Reading SAT 75th Percentile 152 634.70 65.20 610 Critical Reading SAT 25th Percentile Mathematics SAT 154 524.64 65.30 530 75th Percentile Mathematics SAT 154 630.14 60.33 630 Average Faculty Salary 182 $67,872 $14,436 $80,668 Percent of Full-Time Faculty 175 66.40% 15.72% 64.00% Percent of Classes with 20 175 62.65% 8.80% 42.00% or Less Students Percent of Faculty with 171 87.30% 11.00% 89.00% Terminal Degree FTE 182 1,814 611 3,310 Unduplicated Total 182 1.04 .08 1.01 Enrollment Per FTE Estimated Fall Enrollment Per FTE 182 1.05 .07 1.03 Total Price of Attendance 182 $44,089 $8,732 $43,874 Instruction Expenses Per FTE 181 $12,099 $5,987 $8,390 Endowment FASB Per FTE 182 $951,712 $151,678 $36,819 Alumni Giving Rate 173 26.25% 10.54% 17.00% Bachelor Degrees Conferred 182 .22 .03 .24 Per FTE One-Year Retention Rate 182 82.74% 8.99% 87.23% Six-Year Graduation Rate 192 69.88% 14.04% 84.82%
* Carnegie Classifications with Low Transfer Proportions

PEER AND ASPIRANT ANALYSIS
35
Table 1 (continued) Counts, Means, and Standard Deviations for the Initial Set of Peers, Potential Reference Groups, and Siena College
Reference Group-More Selective* Variable Standard Siena N Mean Deviation Mean
Applicants Per FTE 97 2.18 .91 2.94 Percent Admitted 97 52.27% 20.03% 48.00% Admissions Yield 97 28.33% 8.56% 17.00% Percent of First Time Federal 97 22.01% 7.35% 24.00% Grant Aid Students 25th Percentile 80 569.36 58.32 510 Critical Reading SAT 75th Percentile 80 682.85 42.48 610 Critical Reading SAT 25th Percentile Mathematics SAT 80 571.55 54.11 530 75th Percentile Mathematics SAT 80 675.10 44.73 630 Average Faculty Salary 97 $76,346 $13,620 $80,668 Percent of Full-Time Faculty 91 74.14% 12.92% 64.00% Percent of Classes with 20 96 64.04% 8.46% 42.00% or Less Students Percent of Faculty with 96 92.36% 8.46% 89.00% Terminal Degree FTE 97 1,967 602 3,310 Unduplicated Total 97 1.02 .05 1.01 Enrollment Per FTE Estimated Fall Enrollment Per FTE 97 1.02 .04 1.03 Total Price of Attendance 95 $49,402 $6,716 $43,874 Instruction Expenses Per FTE 97 $15,596 $5,980 $8,390 Endowment FASB Per FTE 97 $154,350 $831,284 $36,819 Alumni Giving Rate 96 31.11% 10.27% 17.00% Bachelor Degrees Conferred 97 .23 .02 .24 Per FTE One-Year Retention Rate 97 88.86% 5.66% 87.23% Six-Year Graduation Rate 97 79.23% 9.59% 84.82%
* More Selective Carnegie Classification

PEER AND ASPIRANT ANALYSIS
36
Table 2 Counts, Means, and Standard Deviations for Schools with Low Transfer and High Selectivity for the Baccalaureate Reference Group and Siena College
Reference Group Variable Standard Siena N Mean Deviation Mean
Applicants Per FTE 35 1.77 .94 2.94 Percent Admitted 35 65.71% 14.42% 48.00% Admissions Yield 35 26.14% 8.43% 17.00% Percent of First Time Federal 35 25.63% 7.00% 24.00% Grant Aid Students 25th Percentile 32 522.78 33.50 510 Critical Reading SAT 75th Percentile 32 648.84 21.17 610 Critical Reading SAT 25th Percentile Mathematics SAT 32 530.19 30.68 530 75th Percentile Mathematics SAT 32 645.97 29.88 630 Average Faculty Salary 35 $67,489 $7,422 $80,668 Percent of Classes with 20 35 59.14% 9.32% 42.00% or Less Students Percent of Faculty with 35 89.20% 5.89% 89.00% Terminal Degree FTE 35 2,070 731 3,310 Unduplicated Total 35 1.04 .04 1.01 Enrollment Per FTE Estimated Fall Enrollment Per FTE 35 1.02 .06 1.03 Total Price of Attendance 35 $44,227 $5,089 $43,874 Instruction Expenses Per FTE 35 $11,357 $2,745 $8,390 Endowment FASB Per FTE 34 $55,080 $57,237 $36,819 Percent of Full-Time Faculty 34 67.76% 11.73% 64.00% Alumni Giving Rate 34 24.68% 6.23% 17.00% Bachelor Degrees Conferred 35 .23 .02 .24 Per FTE One-Year Retention Rate 35 85.66% 5.28% 87.23% Six-Year Graduation Rate 35 73.54% 8.49% 84.82% ______________________________________________________________________________
PEER AND ASPIRANT ANALYSIS
37
Table 3 Correlations Among the Admissions Input Variables
Admits Percent Admission SAT SAT SAT SAT per FTE Admitted Yield CR-25 CR-75 MA-25 MA-75 _____________________________________________________________________________ Admits Per FTE -.60 .-38 .45 .36 .45 .35 Percent Admitted -.19 -.49 -.39 -.48 -.38 Admission Yield -.04 -.04 -.07 -.06 25th Percentile .95 .96 .91 Critical Reading SAT (CR) 75th Percentile .93 .94 Critical Reading SAT (CR) 25th Percentile .95 Mathematics SAT (MA) ______________________________________________________________________________ All significant at p < .001
PEER AND ASPIRANT ANALYSIS
38
Table 4
Correlations Among the Faculty Input Variables
Average Percent Full Percent of Percent of Faculty Faculty Salary Time Faculty Classes < 20 with Terminal Degree _____________________________________________________________________________ Average Faculty Salary .42* .10 .62* Percent of Full-Time Instruction -.10 .41* Percent of Classes with 20 or Less Students -.03 ______________________________________________________________________________ * Significant at p < .001
PEER AND ASPIRANT ANALYSIS
39
Table 5
Correlations Among the Enrollment Input Variables
FTE 12 Months/FTE Fall Enrollment/FTE _____________________________________________________________________________ FTE -.26 -.26 12 Months/FTE .87 ______________________________________________________________________________ All significant at p < .001
PEER AND ASPIRANT ANALYSIS
40
Table 6
Correlations Among the Carnegie Classifications Input Variables
Graduate Size/ Fall Transfer Presence Setting Selectivity Proportion _____________________________________________________________________________ Graduate Presence -.12* -.16** .13 Size/Setting .43*** -.33*** Selectivity -.38*** ______________________________________________________________________________ * Significant at p < .05 ** Significant at p < .01 *** Significant at p < .001

PEER AND ASPIRANT ANALYSIS
41
Table 7
Correlations Among the Finance Input Variables
Total Price Instructional Expense Endowment Alumni of Attendance Per FTE Per FTE Give Rate _____________________________________________________________________________ Total Price of Attendance .76 .47 .64 Instructional Expenses Per FTE .78 .72 Endowment Per FTE .60 ______________________________________________________________________________ All significant at p < .001
PEER AND ASPIRANT ANALYSIS
42
Table 8
Largest Absolute Standardized Beta Weights for the OLS Regression Models for the Three Performance Indicators: Ratio of Conferred Bachelor’s Degree to FTE, One-Year Retention Rate, and Six-Year Graduation Rate for Each Variable Category
Category Variable* Standardized Beta Weight
Ratio of Conferred Bachelor’s Degree to FTE Admissions 25th Percentile Mathematics SAT .416 Faculty Average Faculty Salary .416**** Enrollment Estimated Fall Enrollment to FTE -.296* Institutional Characteristics Selectivity .453**** Finance Instructional Expenses .468**** One-Year Retention Rate Admissions 25th Percentile Mathematics SAT .311 Faculty Average Faculty Salary .622**** Enrollment FTE .315**** Institutional Characteristics Selectivity .616**** Finance Instructional Expenses .395**** Six-Year Graduation Rate Admissions Percent of First Time Federal Grant Aid Students -2.654*** Faculty Average Faculty Salary .630**** Enrollment FTE .303**** Institutional Characteristics Selectivity .613**** Transfer Proportion -.184**** Finance Total Price of Attendance .303**** Instructional Expenses .361**** Alumni Giving Rate .338**** ______________________________________________________________________________ * Standardized beta weights are from different regression models ** p ≤ .05 *** p ≤ .01 **** p ≤ .001

PEER AND ASPIRANT ANALYSIS
43
Table 9
OLS Regression Models for the Three Performance Indicators: Ratio of Conferred Bachelor’s Degree to FTE, One-Year Retention Rate, and Six-Year Graduation Rate
Category Variable* Standardized Beta Weight
Ratio of Conferred Bachelor’s Degree to FTE Admissions 25th Percentile Mathematics SAT .348* Faculty Average Faculty Salary -.142 Enrollment Estimated Fall Enrollment to FTE -.053 Institutional Characteristics Selectivity .282** Finance Instructional Expenses .166 One-Year Retention Rate Admissions 25th Percentile Mathematics SAT .465*** Faculty Average Faculty Salary .135 Enrollment FTE .064 Institutional Characteristics Selectivity .301*** Finance Instructional Expenses .065 Six-Year Graduation Rate Admissions Percent of First Time Federal -.145** Grant Aid Students Faculty Average Faculty Salary .211** Enrollment FTE .090 Institutional Characteristics Selectivity .178*** Transfer Proportion -.104** Finance Total Price of Attendance .007 Instructional Expenses .224*** Alumni Giving Rate .186* ______________________________________________________________________________ * p ≤ .05, * p ≤ .01, ** p ≤ .001,

PEER AND ASPIRANT ANALYSIS
44
Appendix A Data Elements Used for Peer and Aspirant Selection: Time Frame, Indicator Type, and Source
Variable Time Frame Indicator TypeIndicator Source
Admit Yield 2011-12 Admissions IPEDS
Number of Applicants, Total 2011-12 Admissions IPEDS
Percent of Applicants Admitted 2011-12 Admissions IPEDS
SAT Critical Reading 25th Percentile Score 2010-11 Admissions IPEDS
SAT Critical Reading 75th Percentile Score 2010-11 Admissions IPEDS
SAT Math 25th Percentile Score 2010-11 Admissions IPEDS
SAT Math 75th
Percentile Score 2010-11 Admissions IPEDS
Percent of Full-Time Undergraduates Receiving Federal Grant Aid
2010-11Admissions (Financial
Aid)IPEDS
Average Salary Equated to 9-Month Contracts of Full-Time Instructional Staff- All Ranks
2011-12 Faculty IPEDS
Full Time Primary Instruction Head Count Fall 2011 Faculty IPEDS
Part Time Primary Instruction Head Count Fall 2011 Faculty IPEDS
Percentage of Full-Time Faculty Holding Terminal Degrees
2011-12 FacultyUS News & World Report
Estimated Fall Enrollment Fall 2010 Enrollment IPEDS
Full Time Equivalent (FTE) Fall 2010 Enrollment IPEDS
Total Enrollment, Unduplicated 2010-11 Enrollment IPEDS
Percentage of Classes Enrolling Fewer than 20 Students
2011-12 EnrollmentUS News & World Report
Carnegie Classification - Basic (Arts & Sciences or Diverse Fields)
-- Institutional Characteristic IPEDS
Carnegie Classification - Enrollment Size & Setting
-- Institutional Characteristic IPEDS
Carnegie Classification - Focus/Extent of Graduate Focus
-- Institutional Characteristic IPEDS
Carnegie Classification - Proportion of Graduate Presence
-- Institutional Characteristic IPEDS
Carnegie Classification- Undergraduate Profile (Transfer and Full-Time proportions)
-- Institutional Characteristic IPEDS
Geographic Region -- Institutional Characteristic IPEDS
Level -- Institutional Characteristic IPEDS
Religious Affiliation -- Institutional Characteristic IPEDS
Tribal College -- Institutional Characteristic IPEDS
Endowment (GASB) 2009-10 Financial IPEDS
Instructional Expenses Per FTE (GASB) 2009-10 Financial IPEDS
Total Price for In-District Students Living on Campus
2011-12 Financial IPEDS
Alumni Giving Rate 2011-12 FinancialUS News & World Report
Bachelor’s Degrees Conferred 2010-11Performance Indicator
(Completions)IPEDS
Retention Rates, Total Cohort (One Year) Fall 2010Performance Indicator
(Student Success)IPEDS
Graduation Rates, Total Cohort (Six Years) As of 8/31/10Performance Indicator
(Student Success)IPEDS

PEER AND ASPIRANT ANALYSIS
45
Appendix B Data Element Used for Peer and Aspirant Selection: Descriptions
Admissions
Admit Yield- Number of enrolled divided by the number admitted. Number of Applicants, Total - Number of first-time, degree/certificate-seeking undergraduate students who applied (full or part time). Includes early decision, early action, and students who began studies during the summer prior to that fall. Percent of Applicants Admitted- Number of admitted divided by the total applicants. 25th percentile Critical Reading SAT score- 25th percentile Critical Reading score. Includes new students admitted the summer prior to that fall.
75th percentile Critical Reading SAT score - 75th percentile Critical Reading score. Includes new students admitted the summer prior to that fall.
25th Percentile Mathematics SAT score - 25th percentile Mathematics score. Includes new students admitted the summer prior to that fall.
75th percentile Mathematics SAT score - 75th percentile Mathematics score. Includes new students admitted the summer prior to that fall. Percent of Full-Time Undergraduates Receiving Federal Grant Aid- Percent of undergraduate students receiving grant aid from the federal government. Undergraduates are students enrolled in a 4- or 5-year Bachelor's degree program, an associate's degree program, or a vocational or technical program below the baccalaureate.
Faculty Average Salary Equated to 9-Month Contracts of Full-Time Instructional Staff- All Ranks- Derived by summing the equated 9-month outlays for each rank and dividing by the total faculty on both 9/10 month and 11/12 month contracts. Full Time Primary Instruction Head Count- Instructional faculty are instruction/research staff employed full time (as defined by the institution) whose major regular assignment is instruction, including those with released time for research. Part Time Primary Instruction Head Count – Faculty reported to have a primary function of instruction that does not exceed 50%. Percentage of faculty holding terminal degrees – The percentage of full-time faculty members with a doctorate or the highest degree possible in their field or specialty during the academic year. Enrollment: Estimated Fall Enrollment- Early estimate of enrollment for all levels for full- and part-time students.

PEER AND ASPIRANT ANALYSIS
46
Full Time Equivalent (FTE)- The full-time equivalent of the institution's part-time enrollment is estimated and then added to the full-time enrollment of the institution. The full-time equivalent of part-time enrollment is estimated by multiplying the part-time enrollment by factors that vary by control and level of institution and level of student. Total Enrollment, Unduplicated- The sum of students enrolled for credit with each student counted only once during the reporting period, regardless of when the student enrolled. Percentage of Classes Enrolling Fewer than 20 students – The percentage of undergraduate classes, excluding class subsections, with fewer than 20 students enrolled during fall semester.
Institutional Characteristics
Carnegie Classification- Basic (Arts & Sciences or Diverse Fields) – (Baccalaureate Colleges). Includes institutions where baccalaureate degrees represent at least 10 percent of all undergraduate degrees and that award fewer than 50 master's degrees or fewer than 20 doctoral degrees per year. Excludes Special Focus Institutions and Tribal Colleges.
Carnegie Classification- Enrollment Size & Setting- School sizes is classified by very small, small, medium, large. Also indicates proportion of students living in campus housing.
Carnegie Classification- Proportion of graduate degrees conferred
Carnegie Classification- Undergraduate Profile - used in this case study to determine selectivity
Geographic Region –US region school where institution is located. Level- A classification of whether an institution’s programs are 4-year or higher (4 year), 2 year and less than 4-year (2 year), or less than 2-year.
Religious Affiliation- Indicates religious affiliation (denomination) for private non-profit institutions that are religiously affiliated.
Tribal College- These institutions, with few exceptions, are tribally controlled and located on reservations, and are all members of the American Indian Higher Education Consortium.
Financial
Endowment (FASB)- Endowment assets (yearend) per FTE enrollment for public and private not-for-profit institutions using FASB standards is derived as follows: Endowment assets (yearend) divided by 12-month FTE enrollment. Endowment assets are gross investments of endowment funds, term endowment funds, and funds functioning as endowment for the institution and any of its foundations and other affiliated organizations. Endowment funds are funds whose principal is nonexpendable (true endowment) and that are intended to be invested to provide earnings for institutional use. Term endowment funds are funds which the donor has stipulated that the principal may be expended after a stated period or on the occurrence of a certain event. Funds functioning as endowment (quasi-endowment funds) are established by the governing board to function like an endowment fund but which may be totally expended at any time at the discretion of the governing board. These funds represent nonmandatory transfers from the current fund rather than a direct addition to the endowment fund, as occurs for the true endowment categories.

PEER AND ASPIRANT ANALYSIS
47
Instructional Expenses Per FTE (FASB)- Includes all expenses of the colleges, schools, departments, and other instructional divisions of the institution and expenses for departmental research and public service that are not separately budgeted. Includes general academic instruction, occupational and vocational instruction, special session instruction, community education, preparatory and adult basic education, and remedial and tutorial instruction conducted by the teaching faculty. Also, includes expenses for both credit and non-credit activities. Excludes expenses for academic administration if the primary function is administration (e.g., academic deans). Total Price for In-District Students Living on Campus- Cost of attendance for full-time, first-time degree/certificate seeking in-district undergraduate students living on campus for academic year. It includes in-district tuition and fees, books and supplies, on campus room and board, and other on campus expenses. Alumni Giving Rate – The average percentage of undergraduate alumni (full or part-time students) who donated money to the college or university for either current operations or capital expenses during the specified academic year Rate is calculated by dividing the number of alumni donors during a given academic year by the number of alumni of record for that same year.
Performance Indicators
Bachelor’s Degrees Conferred- Awards/degrees conferred.
Graduation Rates, Total Cohort (Six Years)- The number of students from the adjusted Bachelor's degree-seeking cohort, who completed a Bachelor's degree within 150 percent of normal time (6-years) divided by the adjusted cohort. The adjusted cohort is the revised cohort minus exclusions as reported by the institution as of 150 percent of normal time (6-years).
Retention Rates, Total Cohort (One Year)- The full-time retention rate is the percent of the (fall full-time cohort from the prior year minus exclusions from the fall full-time cohort) that re-enrolled at the institution as either full- or part-time in the current year.

PEER AND ASPIRANT ANALYSIS
48
Appendix C
Siena College Near Peer and Almost Peer Institutions
Near Peers Institution State
Allegheny College PA
Cedarville University OH
Champlain College VT
College of Saint Benedict MN
Concordia College at Moorhead MN
Cornell College IA
Gordon College MA
Hartwick College NY
Hope College MI
Juniata College PA
Messiah College PA
Oglethorpe University GA
Saint Michael's College VT
Stonehill College CT
Susquehanna University PA
Transylvania University KY
Wentworth Institute of Technology MA
William Jewell College MO
Wofford College SC
Almost Peers Institution State
Augustana College IL
Birmingham Southern College AL
Calvin College MI
Carroll College MT
Goucher College MD
Hampshire College MA
Houghton College NY
Lake Forest College IL
Lasell College MA
Linfield College‐McMinnville Campus OR
Luther College IA
Muhlenberg College PA
Saint Anselm College NH
Saint Vincent College PA
Southwestern University TX
St Olaf College MN
Trine University IN
Washington College MD
Westmont College CA

PEER AND ASPIRANT ANALYSIS
49
Appendix D
Siena College Aspirant Institutions
Tier I Aspirants Institution State
Amherst College MA
Bowdoin College ME
Carleton College MN
Claremont McKenna College CA
Colby College ME
Gustavus Adolphus College MN
Hamilton College NY
Kenyon College OH
Pomona College CA
Saint Mary's College IN
Swarthmore College PA
Vassar College NY
Williams College MA
Tier II Aspirants Institution State
Barnard College NY
Beloit College WI
Bucknell University PA
Centre College KY
Colgate University NY
Davidson College NC
Denison University OH
DePauw University MN
Dickinson College PA
Furman University SC
Gettysburg PA
Grinnell College IA
Haverford College PA
Kalamazoo College MI
Lafayette College PA
Macalester College MN
Oberlin College OH
Occidental College CA
Pitzer College CA
Reed College OR
Rhodes College TN
Saint Johns University MN
Skidmore College NY
The College of Wooster MA
Trinity College CT
Wellesley College MA
Whitman College WA