Embed Size (px)
Citation preview
Canadian Private Equity Buyout Review
First Three Quarters 2017
Mark Blinch, Reuters

Table of Contents
Canada’s PE Buyout Market first 3Q 2017 3
$ Invested and # Companies Financed 5
Investment by Company Location 7
Investment by Transaction Type 8
Investment by Investor Location 9
PE Investment vs. all Canadian M&A 10
Top PE Buyout Deals 11
Investment by Deal Size 12
Investment by Company Sector 13
Canadian Firms’ Investment Abroad 14
Buyout Funds Raised 16
PE Buyout-Backed Exits 17
PE Buyout Returns 18
Explanatory Notes & Contacts 19

Canadian Private Equity Buyout Market Activity: First Three Quarters 2017
Canadian Buyout-PE Market Trends
Deal-making activity in Canada’s buyout and related private equity market continued at a very strong pace in the third quarter. With a total of 261
transactions collectively valued at $23.8 billion during the first three quarters of the year, deal values increased by 73% from the same period last year and
saw the strongest first three quarters in history. Despite the huge increase in dollars invested, the actual number of deals that took place in the first nine
months of 2017 only increased by 8% over the previous year to 261.
Two additional deals joined the $1 billion or greater club during the third quarter of 2017. Caisse de dépôt et placement du Québec (CDPQ) helped fund
SNC-Lavalin’s $3.6 billion acquisition of British engineering and design company WS Atkins plc, which closed in July. CDPQ was again involved in Intact
Financial’s announced plan to acquire OneBeacon Insurance Group for $2.3 billion, this time joined by Canada Pension Plan Investment Board (CPPIB) and
Ontario Teachers’ Pension Plan (OTPP).
Although the number of Canadian Buyout-PE deals increased slightly over the same period last year, the rate of overall Canadian M&A largely outpaced
them. With 1,918 Canadian M&A targets in the first three quarters of 2017 marking a 66% increased from the 1,157 a year previously, PE deals as a
percentage of M&A dropped from 21% to 14%.
Canadian Market Trends by Sector
Business Service, Consumer Related, and Financing companies were involved in 93, or 36%, of all deals in the first three quarters of 2017. However, due to
a number of mega-deals, these three sectors alone managed to receive 72% of all financing dollars during the period.
Canadian Fund Performance
The performance of Canadian buyout, mezzanine, and private equity energy funds continued to show slight underperformance to public market comparators
in the first half of 2017. Final data provided by Cambridge Associates shows Canadian buyout, private equity energy, and subordinated capital funds with
vintage years of 2000 or greater returning a since inception IRR of 5.2% as of the end of Q2. This lags far behind their US counterparts which showed
consistent outperformance of public markets and a since inception IRR of 12.7%.
Canadian Private Equity Buyout Market Activity: First Three Quarters 2017
Canadian Market Trends by Region
Companies outside of Ontario or Quebec are beginning to see a gradual increase in the number of deals they’re involved in, making up 36% of all
investments in the first three quarters of 2017, a five year high. However, it’s clear that the two most populated provinces are still receiving the bulk of
the dollars invested at 88% of disclosed deal values. In terms of the mega-deals, of the five deals that broke the $1 billion mark in 2017, four of these
companies were based in Ontario.
Canadian Investor Activity in Global Markets
Canadian buyout and related PE funds participated in 25 non-Canadian deals in the third quarter collectively valued at $15.8 billion. This brought the
total number of non-Canadian deals to 88 for the first three quarters of the year, a 7% increase from the same period in 2016.
La Caisse de dépôt et placement du Québec was involved in the $8.0 billion acquisition of Tennessee-based TeamHealth Holdings as well as the $5.9
billion investment in New York-based USI Holdings. Canada Pension Plan Investment Board invested $750 million in the $5.6 billion Calpine
Corporation acquisition led by Energy Capital Partners. CPPIB also partnered up with Baring Private Equity Asia to take Hong Kong school
organization Nord Anglia Education private for $5.8 billion.
Trends in Canadian buyout-PE fundraising
In July, Onex Corp completed the first closing of its new flagship fund, Onex Partners V, raising $6.5 billion or 80% of its target. This represented the
lion’s share of the $7.5 billion PE fundraising that occurred during Q3, bumping the total funds raised so far in 2017 up to $12.7 billion.

Historical Private Equity - Buyout Investment in Canadian Companies: Deal Values
With $9.3 billion invested in Q3, Canada saw both its strongest single quarter in two years,
and the second strongest January to September ever recorded.
De
al V
alu
es (
$ B
illio
ns)
$23.8
$33.2
$15.7
$5.6 $6.7
$12.7 $11.7
$10.4
$31.0
$24.0
$17.5
0
5
10
15
20
25
30
35
2007 2008 2009 2010 2011 2012 2013 2014 2015 2016 2017
Q1 Q2 Q3 Q4
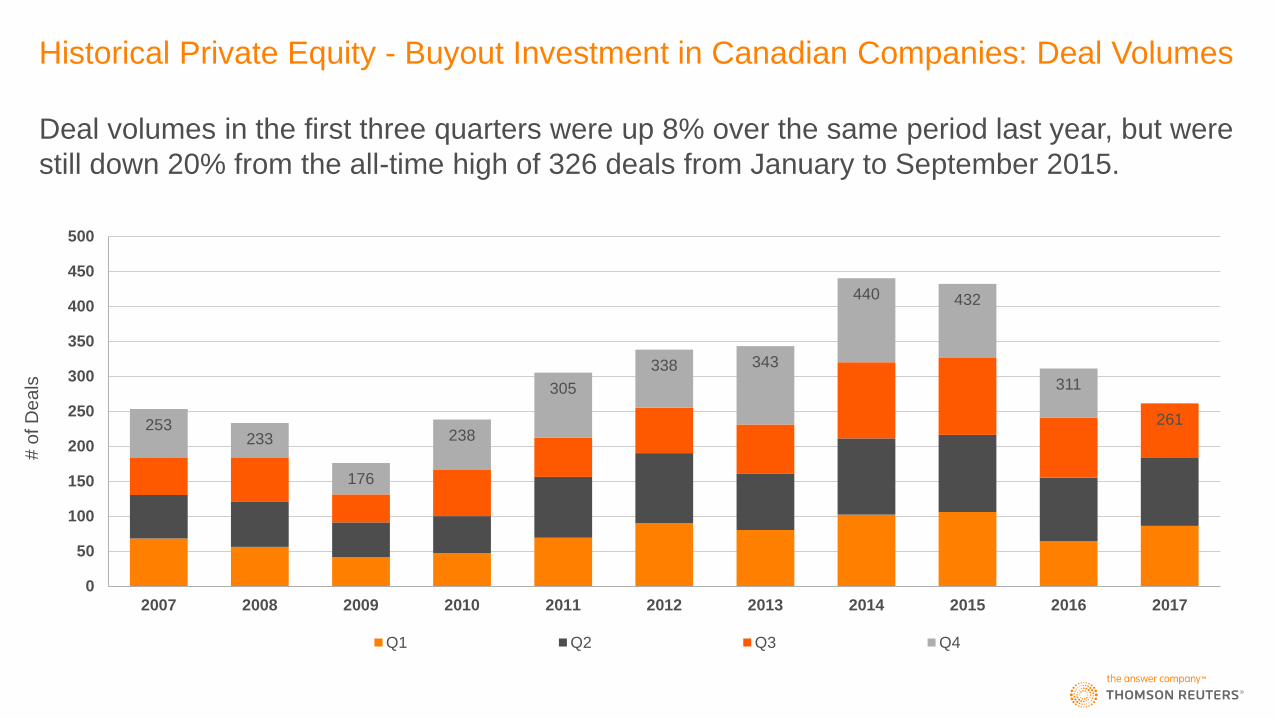
Historical Private Equity - Buyout Investment in Canadian Companies: Deal Volumes
Deal volumes in the first three quarters were up 8% over the same period last year, but were
still down 20% from the all-time high of 326 deals from January to September 2015.
261 253 233
176
238
305
338 343
440 432
311
0
50
100
150
200
250
300
350
400
450
500
2007 2008 2009 2010 2011 2012 2013 2014 2015 2016 2017
Q1 Q2 Q3 Q4
# o
f D
ea
ls

PE-Buyout Dealmaking: Deals by Company Location
Capital is being spread across Canada, with companies based outside of Ontario or Quebec
making up 36% of deals in the first three quarters of 2017, a five-year high.
0%
10%
20%
30%
40%
50%
60%
70%
80%
90%
100%
2007 2008 2009 2010 2011 2012 2013 2014 2015 2016 First 3Q 2017
Ontario Québec Alberta British Columbia Prairies Atlantic Canada Territories
% o
f D
ea
ls

PE-Buyout Dealmaking: Deal Volumes by Transaction Type
Acquisition for expansions made up 29% of all deals in the first three quarters of 2017, continuing their steady increase of every year since 2008, when they only made up a 4% share of the market.
0%
10%
20%
30%
40%
50%
60%
70%
80%
90%
100%
2007 2008 2009 2010 2011 2012 2013 2014 2015 2016 First 3Q 2017
Control Stake Minority Stake Acquisition for Expansion Mezzanine PIPE Restructuring Other
# o
f D
ea
ls

PE-Buyout Dealmaking: Deal Volumes by Nation of Lead Investor
Canadian investors led 77% of all PE deals in the third quarter, a level higher than any
annual average since 2009.
0%
10%
20%
30%
40%
50%
60%
70%
80%
90%
100%
2007 2008 2009 2010 2011 2012 2013 2014 2015 2016 First 3Q 2017
Canada United States Other Regions
# o
f D
ea
ls

PE-Buyout Dealmaking Versus All M&A of Canadian Targets
While the number of Canadian M&A deals in the first three quarters of 2017 increased 66%
from the same period last year, the PE share of these deals decreased from 21% to 14%.
0%
5%
10%
15%
20%
25%
30%
35%
0
20
40
60
80
100
120
140
Q1'14 Q2'14 Q3'14 Q4'14 Q1'15 Q2'15 Q3'15 Q4'15 Q1'16 Q2'16 Q3'16 Q4'16 Q1'17 Q2'17 Q3'17
# of PE Deals PE Deals as % of all M&A Activity
# o
f D
ea
ls

Top Canadian Private Equity Deals, First Three Quarters 2017
Portfolio Company Investors
Rank Company Name Deal Value
($ Millions) Location Sector Investing Firms (Disclosed)
1 DH Corporation $4,800.0 Toronto, ON Financial Technology Vista Equity Partners
2 SNC-Lavalin Group $3,600.0 Montreal, QC Project Management Caisse de dépôt et placement du Québec
3 Restaurant Brands
International $2,366.3 Oakville, ON Food Service 3G Capital, Berkshire Hathaway
4 Intact Financial $2,300.0 Toronto, ON Insurance Caisse de dépôt et placement du Québec, CPPIB,
Ontario Teachers’ Pension Plan
5 Milestone Apartments $1,738.6 Toronto, ON Real Estate
Management Starwood Capital Group
6 Arctic Glacier $965.1 Winnipeg, MB Food Products Carlyle Global Partners
7 Canam Group $875.0 Saint-Georges QC Construction &
Fabrication American Industrial Partners
8 Osisko Gold Royalties $675.0 Montreal, QC Precious Metals Caisse de dépôt et placement du Québec, Fonds de
solidarité FTQ
9 Loblaw’s Gas Station
Business Unit $547.6 Toronto, ON Gas Stations Brookfield Asset Management
10 Sandvine $545.4 Waterloo, ON Network Solutions Francisco Partners
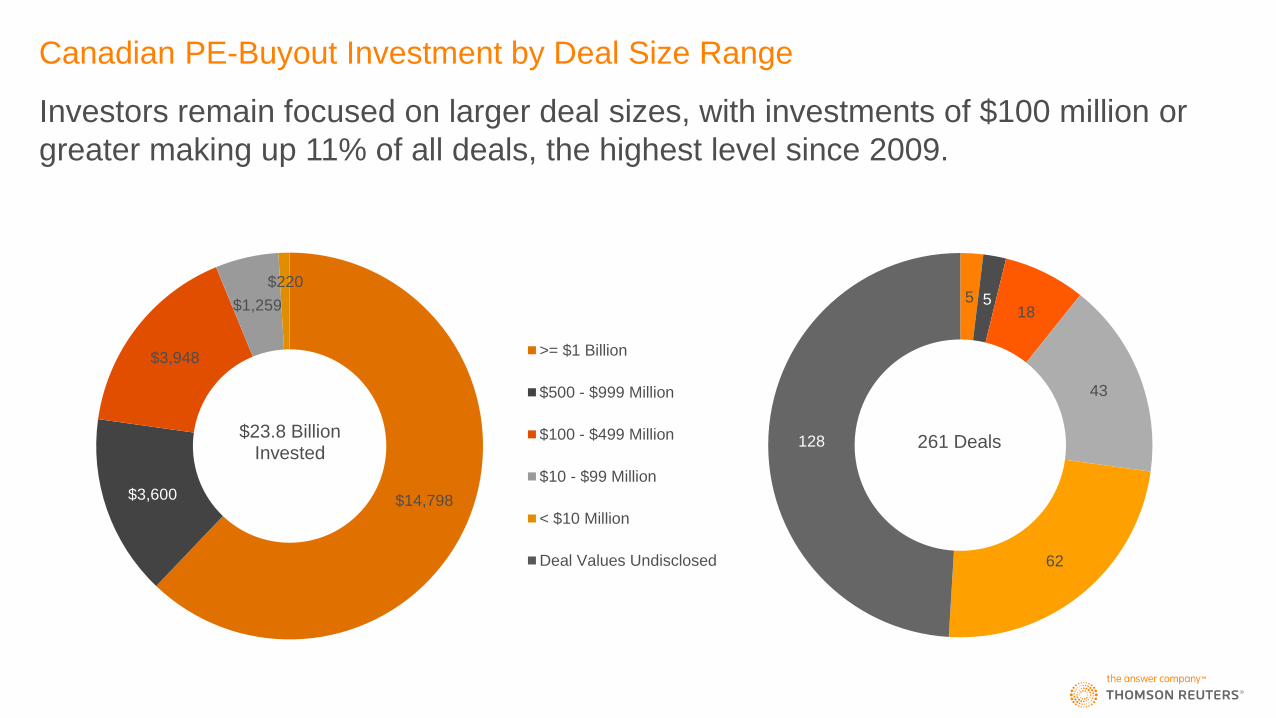
Canadian PE-Buyout Investment by Deal Size Range
Investors remain focused on larger deal sizes, with investments of $100 million or
greater making up 11% of all deals, the highest level since 2009.
$14,798 $3,600
$3,948
$1,259
$220
$23.8 Billion Invested
>= $1 Billion
$500 - $999 Million
$100 - $499 Million
$10 - $99 Million
< $10 Million
Deal Values Undisclosed
5 5 18
43
62
128 261 Deals
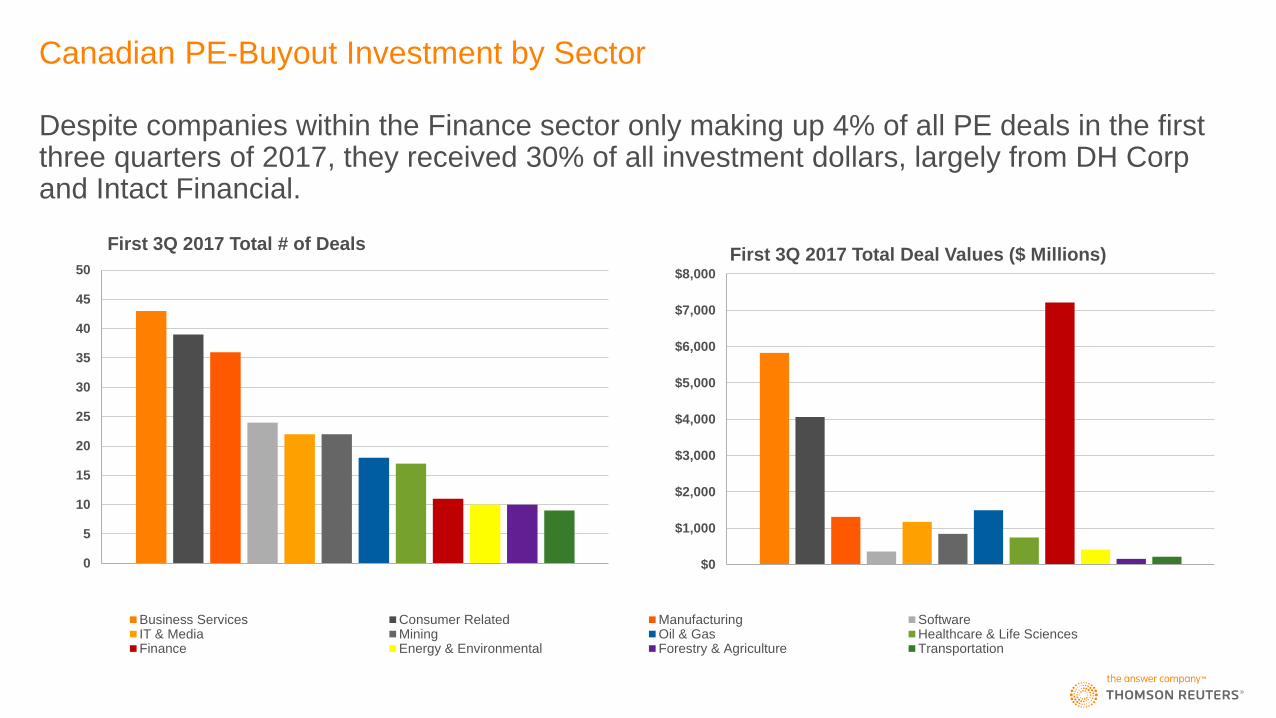
Canadian PE-Buyout Investment by Sector
Despite companies within the Finance sector only making up 4% of all PE deals in the first three quarters of 2017, they received 30% of all investment dollars, largely from DH Corp and Intact Financial.
$0
$1,000
$2,000
$3,000
$4,000
$5,000
$6,000
$7,000
$8,000
First 3Q 2017 Total Deal Values ($ Millions)
Business Services Consumer Related Manufacturing SoftwareIT & Media Mining Oil & Gas Healthcare & Life SciencesFinance Energy & Environmental Forestry & Agriculture Transportation
0
5
10
15
20
25
30
35
40
45
50
First 3Q 2017 Total # of Deals
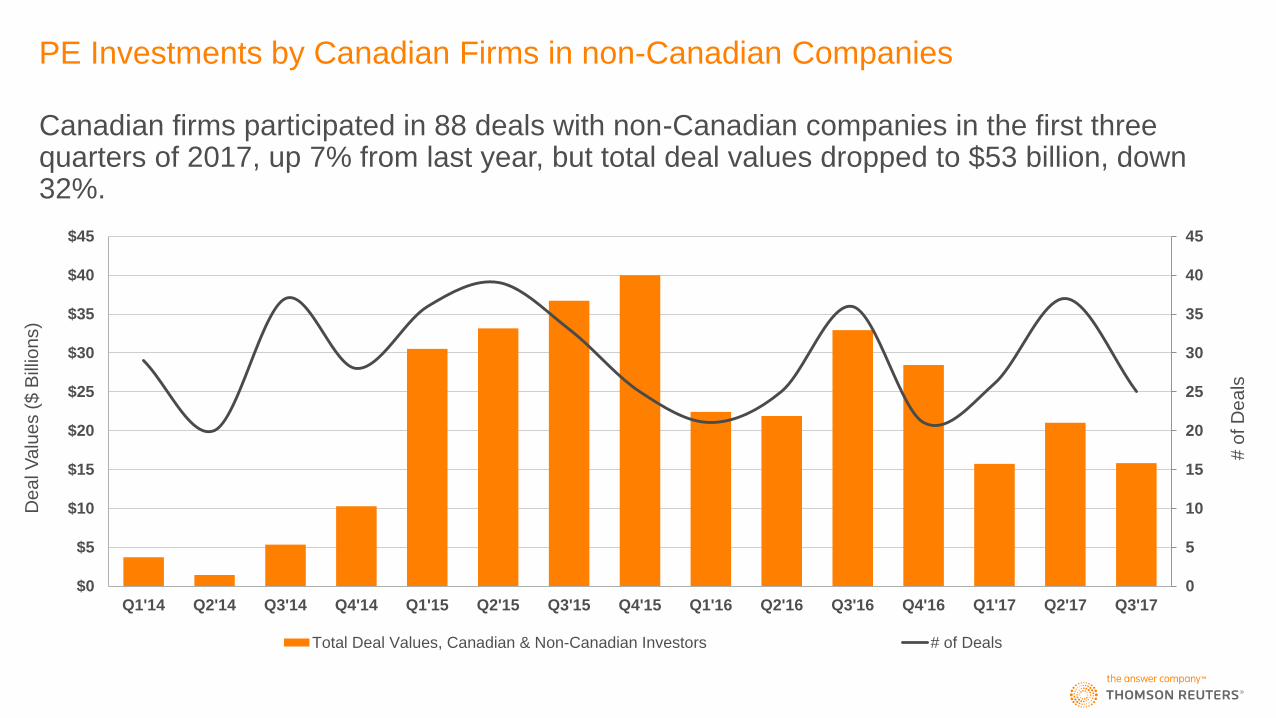
PE Investments by Canadian Firms in non-Canadian Companies
Canadian firms participated in 88 deals with non-Canadian companies in the first three quarters of 2017, up 7% from last year, but total deal values dropped to $53 billion, down 32%.
0
5
10
15
20
25
30
35
40
45
$0
$5
$10
$15
$20
$25
$30
$35
$40
$45
Q1'14 Q2'14 Q3'14 Q4'14 Q1'15 Q2'15 Q3'15 Q4'15 Q1'16 Q2'16 Q3'16 Q4'16 Q1'17 Q2'17 Q3'17
Total Deal Values, Canadian & Non-Canadian Investors # of Deals
De
al V
alu
es (
$ B
illio
ns)
# o
f D
ea
ls

Top PE Investments by Canadian Firms in Non-Canadian Companies, First 3Q 2017
Portfolio Company Investors
Rank Company Name Deal Value
($ Billions) Location Sector Investing Firms (Disclosed)
1 TeamHealth Holdings $8.0 Knoxville, TN Healthcare
Services
Caisse de dépôt et placement du Québec, Blackstone
Group, PSP Investments, National Pension Service of
Korea
2 Calpine Corp. $7.0 Houston, TX Power Generation Canada Pension Plan Investment Board, Energy Capital
Partners LLC, Access Industries
3 USI Holdings Corp. $5.9 Valhalla, NY Insurance Caisse de dépôt et placement du Québec, KKR
4 Nord Anglia Education $5.8 Hong Kong Education Canada Pension Plan Investment Board, Baring Private
Equity Asia
5 Dubai Aerospace Enterprise $2.9 Dubai, UAE Aerospace Canada Pension Plan Investment Board, Terra Firma
Capital Partners
6 Cerba Healthcare SASU $2.6 Saint-Ouen-l'Aumône, FR Clinical Labs Partners Group AG, PSP Investments
7 Gas Natural Fenosa $2.3 Barcelona, Spain Gas Distribution Canada Pension Plan Investment Board, Allianz Capital
Partners
8 Parkdean Resorts UK Ltd. $2.2 Newcastle, UK Holiday Resorts ONEX Corporation
9 FTP Power LLC $2.0 Salt Lake City, UT Solar Energy Alberta Investment Management Corp, AES Corporation
10 Virtu Financial LLC $1.9 New York, NY Financial Services PSP Investments, North Island, GIC

PE-Buyout Fundraising by Canadian Firms
Six buyout funds raised $7.5 billion in the third quarter of 2017, including the $6.5 billion
initial July closing of Onex’s new flagship fund, Onex Partners V.
$7.3
$3.8
$12.2
$16.1 $14.7
$11.1
$45.4
$12.7
$0.0
$5.0
$10.0
$15.0
$20.0
$25.0
$30.0
$35.0
$40.0
$45.0
$50.0
2010 2011 2012 2013 2014 2015 2016 First 3Q 2017

Canadian PE-Backed Exits, First 3Q 2017
Portfolio Company Investors
Rank Company Name Deal Value
($ Millions) Location Sector Investors (Disclosed)
1 Reliance Home Comfort LP $4,566 Oshawa, ON HVAC Systems Alinda Capital Partners
2 Performance Sports Group Ltd $771 Mississauga, ON Athletic Goods Kohlberg & Company LLC, Brookfield Asset Management
3 Daiya Foods Inc $409 Vancouver, BC Food Retailer Northwood Ventures, Stockton Road Capital
4 Canada Goose $391 Toronto, ON Clothing Retailer Bain Capital
5 Spur Resources Ltd $388 Calgary, AB Oil & Gas PFM Capital
58 disclosed exits were completed in the first three quarters of 2017, up 14% compared to
the same period last year.
0
10
20
30
Q1'14 Q2'14 Q3'14 Q4'14 Q1'15 Q2'15 Q3'15 Q4'15 Q1'16 Q2'16 Q3'16 Q4'16 Q1'17 Q2'17 Q3'17
M&A Public Secondary Sale
# o
f E
xits

Cambridge Associates: Private Equity Fund Performance
Canadian private independent funds holding positive returns, but fall below public market
benchmarks and US-based funds.
5.2%
0%
2%
4%
6%
8%
10%
12%
14%
Q2 2012 Q2 2013 Q2 2014 Q2 2015 Q2 2016 Q2 2017
Canada
Buyout, Private Equity Energy & Subordinated Capital Funds
mPME: S&P/TSX 60 Index
12.7%
0%
2%
4%
6%
8%
10%
12%
14%
Q2 2012 Q2 2013 Q2 2014 Q2 2015 Q2 2016 Q2 2017
United States
Buyout, Private Equity Energy & Subordinated Capital Funds
mPME S&P 500 Index
Source: Cambridge Associates, Standard & Poor's
Explanatory Notes
1. Data collected and analyzed by Thomson Reuters for this statistical report were drawn from a variety of sources including Thomson Reuters M&A databases, regulatory filings, press releases, and proprietary investor
reports from Canadian and non-resident fund managers.
2. Key statistical indicators (e.g., total disbursements, per quarter or per annum) are influenced by the fact that a substantial fraction of buyout and other PE deals are not fully disclosed. For instance, “dollars invested” in a
given period pertain only to those deals with values that have been published or confidentially disclosed to Thomson Reuters.
3. The data also highlight the deal-making of Canadian funds in non-Canadian companies. “Dollars invested” pertain to the total value of disclosed deals in which Canadian funds have participated and not the specific
Canadian financial contributions to these deals. Deals are first tracked as of announcement date, then tracked as of completion date upon closing.
4. Statistical data reflect all essential forms of buyout-PE deal-making, including control-stake acquisitions of businesses, minority equity investments, restructuring and special-situations transactions, mezzanine deals over $3
million, acquisitions for expansion and other quasi-equity investments.
5. Fund performance data and public market equivalents are produced via the Cambridge Associates Benchmark Calculator, available through Thomson Reuters Eikon. Returns are for Canadian and US buyout, private
equity energy, and subordinated capital funds with vintage years of 2000 or greater, on a first cash flow basis, in Canadian dollars, from inception to the end of the indicated quarter, under final data mode Q2 2017. Pooled
internal rates of return are net of fees, expenses and carried interest. CA Modified Public Market Equivalent (mPME) replicates private investment performance under public market conditions. The public index’s shares are
purchased and sold according to the private fund cash flow schedule, with distributions calculated in the same proportion as the private fund, and mPME NAV is a function of mPME cash flows and public index returns.
6. All current and previous years data is as of Monday, October 30th, 2017. Data is continuously updated and is therefore subject to change. All figures are in Canadian dollars unless otherwise noted.
For further information on Thomson Reuters venture capital and private equity offerings, please visit us at:
• http://thomsonreuters.com/en/products-services/financial/venture-capital-and-private-equity.html
For further reports on private equity, venture capital, and other asset classes, please visit us at:
• http://dmi.thomsonreuters.com
Contributors to this analysis are provided with additional packages of data. If you would like to participate in the submission process, receive quarterly press releases, or have questions about our venture capital criteria, please
contact us at:
Gavin Penny Greg Beaman
E-mail: [email protected] E-mail: [email protected]
Tel: 416-687-7577 Tel: 416-687-7510