Embed Size (px)
Citation preview

Canadian Private Equity Buyout Review
First Quarter 2017
Ben Nelms REUTERS

Table of Contents
Canada’s PE Buyout Market in Q1 2017 3
$ Invested and # Companies Financed 5
Investment by Company Location 7
Investment by Transaction Type 8
Investment by Investor Location 9
PE Investment vs. all Canadian M&A 10
Top PE Buyout Deals 11
Investment by Market Segment 12
Investment by Company Sector 13
Canadian Firms’ Investments Abroad 14
Buyout Funds Raised 16
Public and M&A Exits 17
Private Equity Returns 18
Explanatory Notes & Contacts 19

Canadian Private Equity Buyout Market Activity in Q1 2017
Canadian Buyout-PE Market Trends
Deal-making activity in Canada’s buyout and related private equity market showed a marked decline in the first quarter of 2017. With a total of 81
transactions valued at $3.2 billion, deal values decreased by 43% from Q4 2016. Deal volumes increased 25% from the same period last year, but still
fell 22% short of the levels seen in Q1 2015.
The Canadian top deals list was dominated by Restaurant Brands International’s PE-backed acquisition of Popeye’s Chicken for $2.4 billion. Mid-
market highlights included Acasta Enterprises’ acquisition of JemPak for $135 million, Bridge Growth Partners’ $133 million investment in Accedian
Networks, and Kineticor Resource Corp, which raised $125 million from OPTrust.
In addition to a decline in private equity deal values in Canadian companies on a year-over-year basis, investment activity also continued to decline as
compared to Canadian merger & acquisition activity overall. While the number of private equity deals reached a peak of 31% of the number of
traditional merger & acquisition deals in Q4 2014, this percentage had declined to only 19% in the first quarter of 2017, a three-year low.
Canadian Market Trends by Sector
Canadian business services companies accounted for the largest share of buyout-PE deal-making this quarter with 13 transactions, or 16% of the
national total. Consumer-related and manufacturing companies came in a close second and third place, with 12 and 9 deals respectively. As measured
by disclosed deal values, consumer-related companies continued led all other industries, with $2.6 billion or 81% of all investment.
Canadian Fund Performance
While investment activity was on the wane in 2016, the performance of Canadian buyout, mezzanine, and private equity energy funds showed steady
positive performance, closely following public market comparators. Preliminary data provided by Cambridge Associates shows Canadian buyout,
mezzanine, and private equity energy funds with vintage years of 2000 or greater returned a since inception IRR of 5.8% as of year-end 2016. This did
however lag far behind their US counterparts which showed consistent outperformance of public markets.
Canadian Private Equity Buyout Market Activity in Q1 2017
Canadian Market Trends by Region
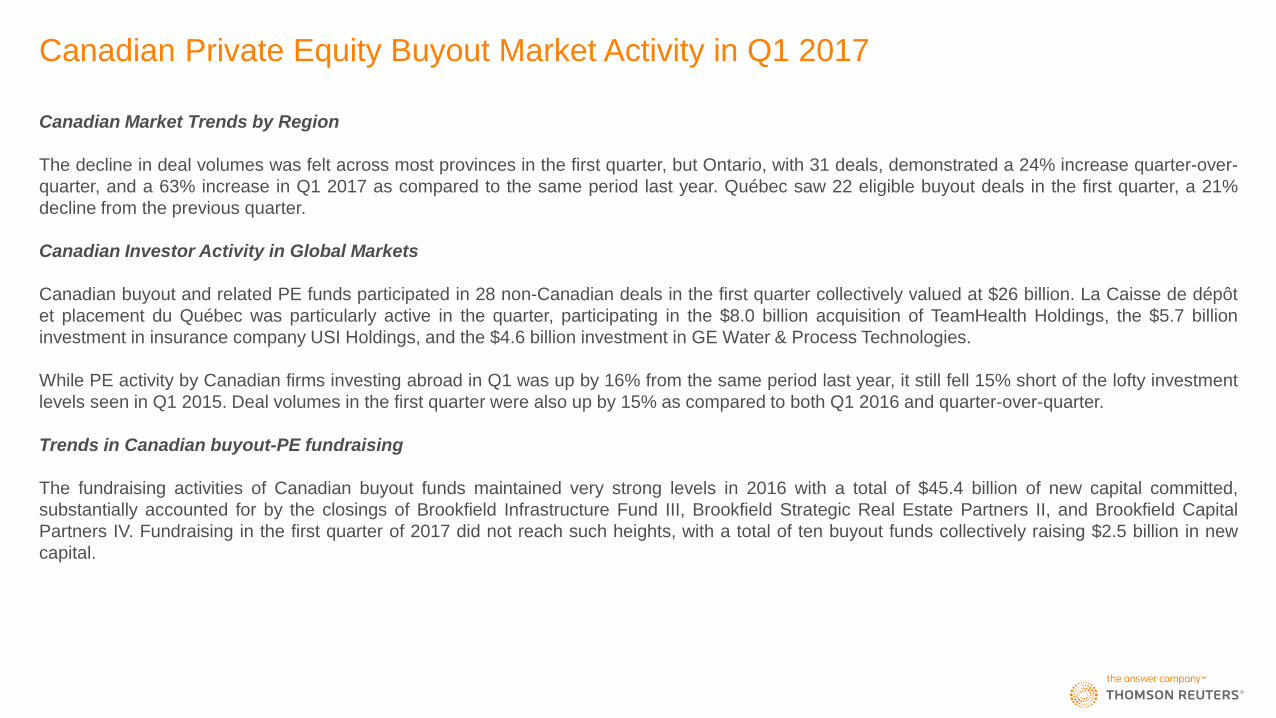
The decline in deal volumes was felt across most provinces in the first quarter, but Ontario, with 31 deals, demonstrated a 24% increase quarter-over-
quarter, and a 63% increase in Q1 2017 as compared to the same period last year. Québec saw 22 eligible buyout deals in the first quarter, a 21%
decline from the previous quarter.
Canadian Investor Activity in Global Markets
Canadian buyout and related PE funds participated in 28 non-Canadian deals in the first quarter collectively valued at $26 billion. La Caisse de dépôt
et placement du Québec was particularly active in the quarter, participating in the $8.0 billion acquisition of TeamHealth Holdings, the $5.7 billion
investment in insurance company USI Holdings, and the $4.6 billion investment in GE Water & Process Technologies.
While PE activity by Canadian firms investing abroad in Q1 was up by 16% from the same period last year, it still fell 15% short of the lofty investment
levels seen in Q1 2015. Deal volumes in the first quarter were also up by 15% as compared to both Q1 2016 and quarter-over-quarter.
Trends in Canadian buyout-PE fundraising
The fundraising activities of Canadian buyout funds maintained very strong levels in 2016 with a total of $45.4 billion of new capital committed,
substantially accounted for by the closings of Brookfield Infrastructure Fund III, Brookfield Strategic Real Estate Partners II, and Brookfield Capital
Partners IV. Fundraising in the first quarter of 2017 did not reach such heights, with a total of ten buyout funds collectively raising $2.5 billion in new
capital.

Historical PE-Buyout Investment in Canadian Companies: Deal Values
Canadian PE-buyout investment declined 43% year-over-year, recording the lowest Q1 deal
values since 2013.
$3.2
$33.2
$15.7
$5.6 $6.6
$12.7 $11.7
$10.4
$31.0
$23.9
$18.2
$0.0
$5.0
$10.0
$15.0
$20.0
$25.0
$30.0
$35.0
2007 2008 2009 2010 2011 2012 2013 2014 2015 2016 Q1 2017
Q1 Q2 Q3 Q4
De
al V
alu
es (
$ B
illio
ns)

Historical PE-Buyout Investment in Canadian Companies: Deal Volumes
First quarter deal volumes were up 25% year-over-year, but this still remained the second
slowest Q1 since 2013.
81
252 230
175
237
305
337 342
441 426
311
0
50
100
150
200
250
300
350
400
450
500
2007 2008 2009 2010 2011 2012 2013 2014 2015 2016 Q1 2017
Q1 Q2 Q3 Q4
# o
f D
ea
ls

PE-Buyout Dealmaking: Deals by Company Location
Ontario’s share of PE targets continued to rise in Q1 2017 to 38% percent, a ten year high.
Quebec’s share dropped to 27%, a ten year low.
0%
10%
20%
30%
40%
50%
60%
70%
80%
90%
100%
2007 2008 2009 2010 2011 2012 2013 2014 2015 2016 Q1 2017
Ontario Québec Alberta British Columbia Prairies Atlantic Canada Territories
% o
f D
ea
ls

PE-Buyout Dealmaking: Deal Volumes by Transaction Type
Acquisition for expansion made up 40% of all transaction types in Q1, up from 26% in 2016. Control stake investments continued to see declining popularity, dropping down to just 10% of all transactions in Q1.
0%
10%
20%
30%
40%
50%
60%
70%
80%
90%
100%
2007 2008 2009 2010 2011 2012 2013 2014 2015 2016 Q1 2017
Control Stake Minority Stake Acquisition for Expansion Mezzanine PIPE Restructuring Other
# o
f D
ea
ls

PE-Buyout Dealmaking: Deal Volumes by Nation of Lead Investor
Non-Canadian investors led 35% of Canadian target deals in Q1 2017, up 11% from 2016.
0%
10%
20%
30%
40%
50%
60%
70%
80%
90%
100%
2007 2008 2009 2010 2011 2012 2013 2014 2015 2016 Q1 2017
Canada United States Other Regions
# o
f D
ea
ls

PE-Buyout Dealmaking Versus All M&A of Canadian Targets
With overall Canadian M&A up by 6% in Q1 2017, the PE share of all Canadian M&A
continued to hold under 20%, a three-year low.
0%
5%
10%
15%
20%
25%
30%
35%
0
20
40
60
80
100
120
140
Q1'14 Q2'14 Q3'14 Q4'14 Q1'15 Q2'15 Q3'15 Q4'15 Q1'16 Q2'16 Q3'16 Q4'16 Q1'17
# of PE Deals PE Deals as % of all M&A Activity
# o
f D
ea
ls

Top Canadian Private Equity Deals, Q1 2017
Portfolio Company Investors
Rank Company Name Deal Value
($ Millions) Location Sector Investing Firms (Disclosed)
1 Restaurant Brands International $2,366 Oakville, ON Consumer Related 3G Capital, Berkshire Partners
2 JemPak $135 Oakville, ON Consumer Related Acasta Enterprises
3 Accedian Networks $133 Montreal, QC Software Bridge Growth Partners
4 Kineticor Resource Corp. $125 Calgary, AB Energy & Environmental OPTrust
5 Falco Resources $50 Montreal, QC Mining Desjardins, Investissement Québec, SIDEX
6 TimberRock Energy Corp. $39 Calgary, AB Oil & Gas Azimuth Capital Management, Tudor Pickering Holt & Co.
7 Norbec Group $39 Boucherville, QC Construction & Engineering Desjardins, Business Development Bank of Canada
8 Eddyfi $37 Quebec, QC Construction & Engineering Caisse de dépôt et placement du Québec
9 Highland Copper Company $30 Longueuil, QC Mining Orion Mine Finance, Greenstone Capital
10 Serres Demers $27 Saint-Nicolas, QC Consumer Related Desjardins, Fonds de Solidarité FTQ

Canadian PE-Buyout Investment by Deal Size Range
Canada saw only 3 mid-market deals between $100 and $500 million in the first quarter,
compared to five such deals in the same period last year, and seven in Q1 2015.
$2,366
$393
$369
$71
$3,200 Million Invested
> $500 Million
$100 - $500 Million
$10 - $100 Million
< $10 Million
Deal ValuesUndisclosed
1 3
14
18
45
81 Deals

Canadian PE-Buyout Investment by Sector
First quarter investment was led by Restaurant Brands’ PE-backed acquisition of Popeye’s
Chicken. Business Services & Consumer-Related companies drove deal volumes.
$0
$500
$1,000
$1,500
$2,000
$2,500
$3,000
Q1 2017 Total Deal Values ($ Millions)
Business Services Consumer Related Manufacturing SoftwareIT & Media Mining Oil & Gas Energy & EnvironmentalHealthcare & Life Sciences Transportation Forestry & Agriculture Finance
0
2
4
6
8
10
12
14
Q1 2017 Total # of Deals

PE Investments by Canadian Firms in non-Canadian Companies
Canadian firms’ participation in 28 deals valued at $26 billion in Q1 was up by 16% from the
same period last year, but still fell 15% short of the lofty investment levels seen in Q1 2015.
0
5
10
15
20
25
30
35
40
45
$0
$5
$10
$15
$20
$25
$30
$35
$40
$45
$50
Q1'14 Q2'14 Q3'14 Q4'14 Q1'15 Q2'15 Q3'15 Q4'15 Q1'16 Q2'16 Q3'16 Q4'16 Q1'17
Total Deal Values, Canadian & Non-Canadian Investors # of Deals
De
al V
alu
es (
$ B
illio
ns)
# o
f D
ea
ls

Top PE Investments by Canadian Firms in non-Canadian Companies, Q1 2017
Portfolio Company Investors
Rank Company Name Deal Value
($ Billions) Location Sector Investing Firms (Disclosed)
1 TeamHealth Holdings $8.0 Knoxville, TN Healthcare Services Caisse de dépôt et placement du Québec, Blackstone Group, PSP
Investments
2 USI Holdings Corp. $5.7 Valhalla, NY Insurance Caisse de dépôt et placement du Québec, KKR
3 GE Water & Process Technologies $4.6 Trevose, PA Water Treatment Caisse de dépôt et placement du Québec, Suez
4 Parkdean Resorts UK Ltd. $2.2 Newcastle, UK Holiday Resorts ONEX Corporation
5 Silver Bay Realty Trust Corp. $1.8 Plymouth, MN Property Management Tricon Capital Group
6 Bharti Infratel Ltd. $1.3 New Delhi, IN Telecommunications CPPIB, KKR
7 TerraForm Global Inc. $1.1 Bethesda, MD Clean Energy Brookfield Asset Management
8 Bangalore International Airport Ltd. $0.5 Bangalore, IN Aviation Fairfax India Holdings Corp
9 Kotak Mahindra Bank Ltd. $0.5 Mumbai, IN Banking Caisse de dépôt et placement du Québec, CPPIB
10 Trilogy International Partners LLC $0.4 Bellevue, WA Telecommunications Alignvest Capital Management
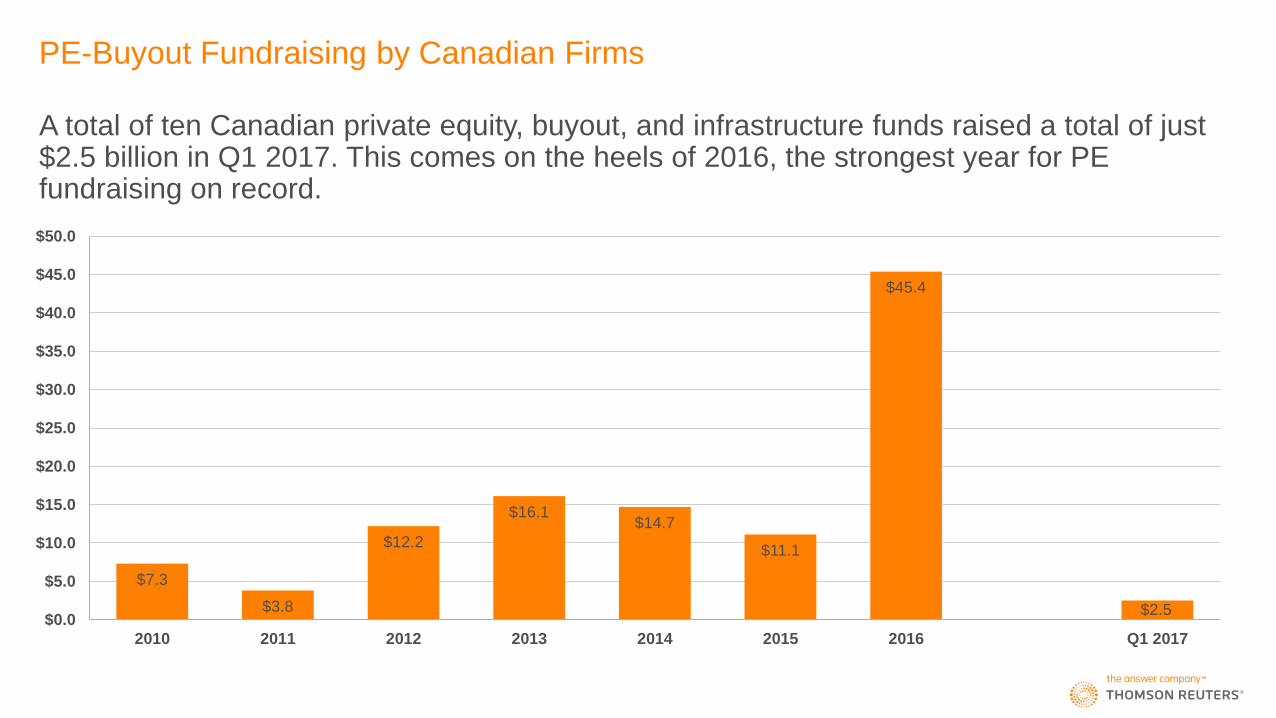
PE-Buyout Fundraising by Canadian Firms
A total of ten Canadian private equity, buyout, and infrastructure funds raised a total of just $2.5 billion in Q1 2017. This comes on the heels of 2016, the strongest year for PE fundraising on record.
$7.3
$3.8
$12.2
$16.1 $14.7
$11.1
$45.4
$2.5 $0.0
$5.0
$10.0
$15.0
$20.0
$25.0
$30.0
$35.0
$40.0
$45.0
$50.0
2010 2011 2012 2013 2014 2015 2016 Q1 2017

Canadian PE-Backed Exits
Portfolio Company Investors
Rank Company Name Deal Value
($ Millions) Location Sector Investors (Disclosed)
1 Reliance Home Comfort LP $2,802 Oshawa, ON HVAC Systems CKP Canada
2 Performance Sports Group Ltd $771 Mississauga, ON Athletic Goods Sagard Capital Partners
3 Canada Goose $391 Toronto, ON Clothing Retailer Bain Capital
4 Spur Resources Ltd $388 Calgary, AB Oil & Gas Tamarack Valley Energy
5 Discovery Air, Inc. $215 Etobicoke, ON Aviation Clairvest Group
With only 14 disclosed exits completed in Q1 2017, exit volumes fell 36% compared to the
same period last year, but were up 27% from Q1 2015.
0
10
20
30
Q1'14 Q2'14 Q3'14 Q4'14 Q1'15 Q2'15 Q3'15 Q4'15 Q1'16 Q2'16 Q3'16 Q4'16 Q1'17
M&A Public Secondary Sale
# o
f E
xits
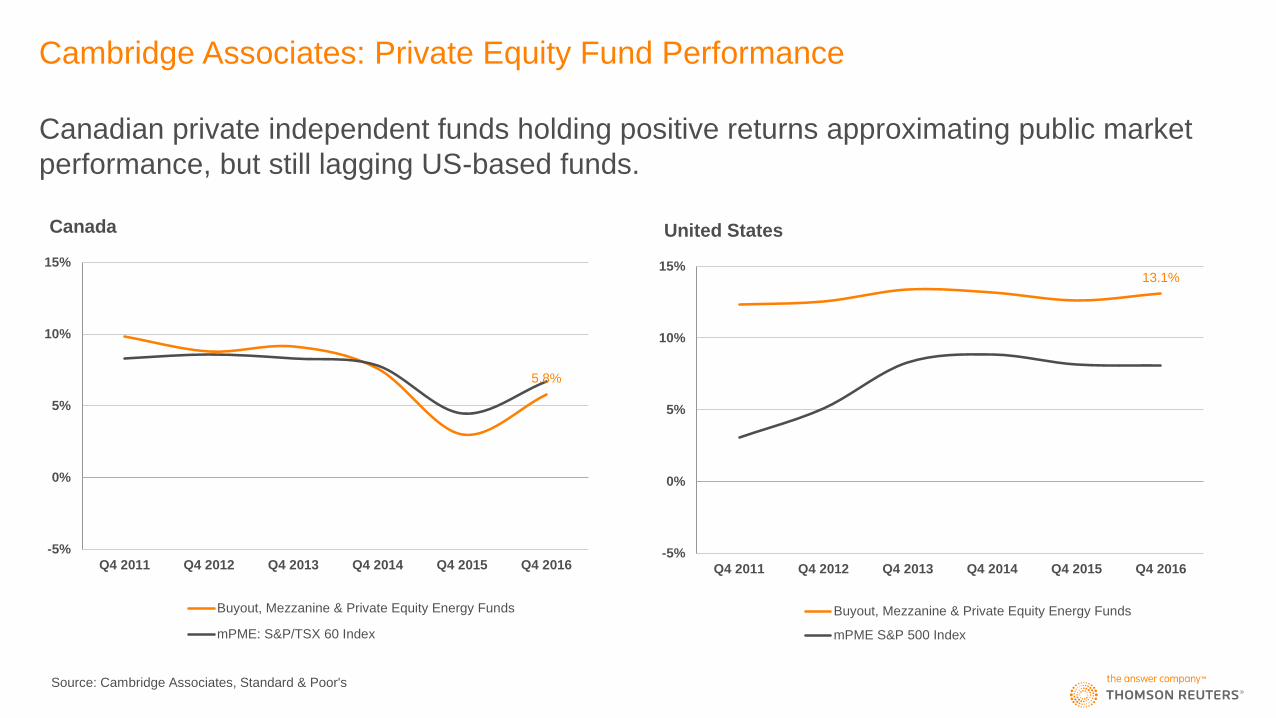
Cambridge Associates: Private Equity Fund Performance
Canadian private independent funds holding positive returns approximating public market
performance, but still lagging US-based funds.
5.8%
-5%
0%
5%
10%
15%
Q4 2011 Q4 2012 Q4 2013 Q4 2014 Q4 2015 Q4 2016
Canada
Buyout, Mezzanine & Private Equity Energy Funds
mPME: S&P/TSX 60 Index
13.1%
-5%
0%
5%
10%
15%
Q4 2011 Q4 2012 Q4 2013 Q4 2014 Q4 2015 Q4 2016
United States
Buyout, Mezzanine & Private Equity Energy Funds
mPME S&P 500 Index
Source: Cambridge Associates, Standard & Poor's

Explanatory Notes
1. Data collected and analyzed by Thomson Reuters for this statistical report were drawn from a variety of sources including Thomson Reuters M&A databases, regulatory filings, press releases, and proprietary investor
reports from Canadian and non-resident fund managers.
2. Key statistical indicators (e.g., total disbursements, per quarter or per annum) are influenced by the fact that a substantial fraction of buyout and other PE deals are not fully disclosed. For instance, “dollars invested” in a
given period pertain only to those deals with values that have been published or confidentially disclosed to Thomson Reuters.
3. The data also highlight the deal-making of Canadian funds in non-Canadian companies. “Dollars invested” pertain to the total value of disclosed deals in which Canadian funds have participated and not the specific
Canadian financial contributions to these deals. Deals are first tracked as of announcement date, then tracked as of completion date upon closing.
4. Statistical data reflect all essential forms of buyout-PE deal-making, including control-stake acquisitions of businesses, minority equity investments, restructuring and special-situations transactions, mezzanine deals over $3
million, acquisitions for expansion and other quasi-equity investments.
5. Fund performance data and public market equivalents are produced via the Cambridge Associates Benchmark Calculator, available through Thomson Reuters Eikon. Returns are for Canadian and US buyout, mezzanine,
and private equity energy funds with vintage years of 2000 or greater, on a first cash flow basis, in US dollars, from inception to the end of the indicated quarter, under preliminary data mode Q4 2016. Preliminary dataset
approximately 65% updated; results subject to change. Pooled internal rates of return are net of fees, expenses and carried interest. CA Modified Public Market Equivalent (mPME) replicates private investment performance
under public market conditions. The public index’s shares are purchased and sold according to the private fund cash flow schedule, with distributions calculated in the same proportion as the private fund, and mPME NAV is
a function of mPME cash flows and public index returns.
6. All current and previous years data is as of Wednesday, April 26th, 2017. Data is continuously updated and is therefore subject to change. All figures are in Canadian dollars unless otherwise noted.
For further information on Thomson Reuters venture capital and private equity offerings, please visit us at:
• http://thomsonreuters.com/en/products-services/financial/venture-capital-and-private-equity.html
For further reports on private equity, venture capital, and other asset classes, please visit us at:
• http://dmi.thomsonreuters.com
Contributors to this analysis are provided with additional packages of data. If you would like to participate in the submission process, receive quarterly press releases, or have questions about our venture capital criteria, please
contact us at:
Gavin Penny Greg Beaman
E-mail: [email protected] E-mail: [email protected]
Tel: 416-687-7577 Tel: 416-687-7510