Embed Size (px)
Citation preview

Executive Summary
In pursuance of the directives of Hon'able "National Green Tribunal, New Delhi, ordered dated
23 January 2017 in application no. 145/2015, it is submitted that a precise study has been carried
out by National institute of Hydrology, Roorkee along with the officials of Central Water
Commission, Agra; State Pollution Control Board, Agra; Jal Nigam, Agra; Agra Development
Authority, Agra and UP Irrigation Department, Agra. The study includes the demarcation of
flood line as on 27 September 2010 using inundation obtained from satellite images. From the
flood inundation map, the flood line has been delineated and the points are extracted at regular
interval of 100 m in general, and at few critical locations at closer interval also. Subsequently,
these points have been transferred onto the ground using a precise instrument (DGPS). The
demarcation of these points clearly displays the extent of encroachment as on today with respect
to flood line.
The report also includes the methodology, steps involved in flood mapping and demarcation of
points, photographs during field work. The extent of encroachment is also tabulated at various
buildings/ locations in tabular form. Out of 620 points marked on flood line, about 150 points
have been transferred on the ground till 17 February 2017 and balance work is under progress.
Pankaj Mani
Scientist E, NIH Patna
Vipin Kumar Singh
Executive Engineer, CWC, LYD Agra
Sharad Kumar Singh
Executive Engineer, Lower Division Agra
Canal, Agra
Rajiv Dixit
Executive Engineer, ADA, Agra
Khalid Ahmad
PM, YPCU, Jal Nigam, Agra
Dr. Ram Karan
RO, UPPCB, Agra

Flood Inundation Mapping in Yamuna River at Agra for 2010 flood.
1. Hydrological analysis of September 2010 flood at Poiyaghat
1.1. Rainfall Pattern
The rainfall observed at Poiyaghat during September 2010 is shown in Figure 1. The figure
shows that on the day of maximum flood, i.e. 27 Sept 2010, there was no rainfall occurred in
Agra. Instead, heavy spells of rainfall occurred on 19, 20 and 21 Sept 2010, continuously for
three days. Since then no rainfall occurred till date of maximum flooding in Yamuna river on 27
September 2010. Further, there is no rainfall observed after this major flood event. Thus a dry
period of almost 9 days are available during month of September 2010 around the occurrence of
peak flood event. The identification of dry period is helpful in identifying the cloud free satellite
data for flood inundation mapping. Further, it is also used in differentiating the inundation area
due to pluvial (flooding due to local site rainfall, drainage congestion etc) and fluvial (spilling of
river) flood. As locally rainfall occurred almost 6 days prior to occurrence of peak flood level in
Yamuna river, almost all the inundation may be considered due to fluvial flooding only. Hence,
the extent of inundation delineated from the satellite image during this maximum flood event
will provide the inundation map for this specific flood of 27 September 2010. The rainfall data
obtained from Central Water Comission (CWC), Agra for the month of September 2010 is
shown in Figure 1.

Figure 1: Daily rainfall at Poiyaghat during September 2010.
1.2. Flood level in Yamuna river at Poiyaghat
Daily flood level of Yamuna river observed by CWC at Poiyaghat GD site is shown in Figure 2.
The figure shows the flood level on 26 Sept 2010 was 152.4 m, and within 24 hour it raises by
0.12 m (12 cm) and became 152.52 m on 27 Sept 2010. The maximum flood level has occurred
during these days and the cloud free satellite images are explored to be available for these two
dates and have been used in inundation mapping.

Figure 2: Daily flood level at Poiyaghat during September 2010
The flood discharge corresponding to flood level of 152.52 m at Poiyaghat is computed as 6063
m3/sec (Source: CWC). Based on the flood frequency analysis (FFA) of long term annual peak
flood discharge observed at Poiyaghat, the return period of 2010 flood is estimated as 79 years
using L-moment approach. The detailed FFA is enclosed in annexure-I.
2. Flood Inundation Mapping using Satellite Data
The various steps carried out in the process of marking of inundation map corresponding to 27
September 2010 Flood are discussed as below:
2.1. Satellite data inventory
1. The availability of satellite image for the period September 26-28 September 2010 is
browsed over the National Remote Sensing Centre and USGS EarthExplorer web sites
for cloud free and fine resolution satellite image to capture the flood event of 27

September 2010. In addition the service provider of other foreign satellite data were also
contacted (email correspondence enclosed in Annexure-II).
2. The satellite data (Landsat-5 TM and Lansat-7 ETM) for 26 and 27 September 2010 are
available and downloaded from USGS EarthExplorer web sites. From NRSC Hyderabad,
high resolution satellite data for 11 June 2010 (this is the nearest available high resolution
image) was procured to map the ground condition/ status of constructions etc. along river
bank line close to the flood event. Additionally, one high resolution image is also
procured for 23 January 2017 to assess the construction activity within the flood line
since the occurrence of flood on 27 September 2010. The followings satellite images are
thus used in the study:
SN Date of image Satellite/ Sensor Spatial resolution (m)
1 27 Sept 2010 Landsat-7/ETM, multispectral (SLC OFF) 30 m, 15 m
2 26 Sept 2010 Landsat-5 /TM, multispectral (used for
rectifying SLC off image of 27 Sept 2010)
30 m
3 11 Jun 2010 IRS P5/ PAN (for assessing ground situation
just after the event, this is the earliest high
resolution available image)
2.5 m
(high resolution)
4 23 Jan 2017 IRS P5/ PAN (for assessing current ground
condition)
2.5 m
(high resolution)
5 18 Nov 2010 GoogleEarth, Service Provider: Digital Globe
(for assessing current ground condition using
very high resolution image)
< 1 m
(very high resolution)
6 21 Oct 2016 GoogleEarth, Service Provider: Digital Globe
(for assessing current ground condition using
very high resolution image)
< 1 m
(very high resolution)
2.2. Image processing for flood mapping

3. The ground control points (GCP) were selected from the Google Earth image and its
geographical locations (latitude and longitude) were collected from the field using DGPS
instruments. Image of 11 June 2010 is first geo-referenced using GCPs and subsequently
used for registration of other images.
The root mean square error for image registration is kept within 1 pixel, i.e. 2.5 m. The
location of GCP points and its ground coordinates are given in Annexure III.
4. Multispectral image is available for 27 September 2010 and is used to classify the water
pixels. Though, the multispectral image of Landsat is having spatial resolution of 15/30
m, water pixel can be easily extracted from it. To define the flood line more accurately,
the multispectal images are fused with high resolution image of P5/PAN data which has
spatial resolution of 2.5 m. The methodology of flood inundation mapping using satellite
images is discussed briefly in Annexure IV. Some of the remote sensing and GIS terms
used in this report are also defined in this section. The resulting image is then used for
improving the flood line. The figure below shows the flood map extracted from
multispectral image (Figure 3) and its improvement with the fused image (Figure 4).
Thus using the fused image the error in marking of flood line can be restricted to 1 pixel
of fused image, i.e. 2.5 m.

Figure 3: Flood map extracted from multi spectral image
Figure 4: Flood map delineation improved with fused image

5. Subsequently, the flood line is transformed into points spaced at regular interval of 100
m. However, at few locations where flood line changes sharply within short distance,
points at closer interval have also been extracted. Thus altogether, 620 points have been
marked on the flood line. Figure 5 below shows the points along the flood line in a
particular location (Mangalam Estate and Mangalam Extension). The geographical
coordinates of these points are read from GIS data base and transferred into DGPS
system. Subsequently, DGPS instruments are carried to the field to transfer these points
on ground. The field photographs showing the flood line points transferred on the ground
are shown in Annexure V. The geographical coordinates of flood line points are given in
Annexure VI.
Figure 5: Flood line is converted into points at regular interval of 100 m.
6. On earlier occasion, the computation of flood level at various locations were carried out
using the flood level of 2010 at Poiyaghat GD site and the water surface profile and the
pillars were marked over the ground by UP Irrigation Department. Through ground

survey, the geographical coordinates of these points were obtained using GPS instrument.
Using their coordinates, the pillar locations are also plotted in Geographical Information
System (GIS) environment.
It is observed that mostly, the plotted pillar locations are on the flood line. This ensures
the accuracy of marking of flood line using satellite images. However, at some of the
locations, the field survey based pillars are deviating from the flood line (and that may be
due to utilization of the land since occurrence of 2010 flood. It is to be mentioned here
that the present marking of flood line is based on satellite image of 2010 flood while the
pillar marking is based on water level computation of 2010 flood on the existing ground
(that might have filled up at several locations).
These flood line are further used for estimating the extent of encroachments along the
river in study reach.

Figure 6: The flood line estimated from satellite images coincide with field survey based
flood level marking.
7. Very high resolution satellite images (spatial resolution < 1 m) are extracted from Google
Earth and geo-reference with the earlier used high resolution image using GIS analysis.
The flood line is superimposed over these images and the encroachment in flood line is
estimated. The encroachment of flood line near Mangalam Estate Exgtension is plotted in
Figure 7.

Figure 7: Estimation of encroachments within flood line near Mangalam Estate Extension.
8. Similarly, the encroachments at all the important locations are computed. The figures
showing the encroachment at these locations are shown in Annexure VII. The extent of
encroachments at some important and critical locations/ buildings/ farm houses (in view
of present OA 145/2015) are also tabulated below. Further, during transferring of flood
line points, the ground condition was also evaluated and the observation about filing of
land mass if any is also mentioned in this table.
SN Location Extent of
encroachment (m)
Ground
raised or not
1 Aparna river Views Out of flood line
2 Mangalam Shila Out of flood line
3 Puspanjali Heights 23 m Yes
4 Manglam Estate Out of flood line
5 Manglam EstateExtension 20-26 m Yes
6 Ram Mohan Vihar Out of flood line

7 Kalyani Heights Out of flood line
8 Jawahar Bag II (renamed as Vaibhav Vatika II)
(point no. 596)
5 m Yes
9 Rajshree Garden
10 Radha Ballabh Public School Out of flood line
11 Tanishq Rajshree Estate 21 m Yes
12 Pushpanjali Seasons Out of flood line
13 Vibhav Vatika Out of flood line
14 Ganpat Wonder City 11 m Yes
15 Jagdamba PG College, Naraich Out of flood line
16 Astha City Centre Out of flood line
17 Indira Mill Compund Out of flood line
18 Hotel Tajway Inn Out of flood line
19 Taj View Appartment Out of flood line
20 DRP College, Naraich 7 m Yes
21 Godown at point no. 245 5 m Yes
22 Farm house (point no. 454) 9 m Yes
23 Farm house (point no. 455) 3 m Yes
24 Farm house (point no. 456) 8 m Yes
25 Farm house (point no. 457) 3 m Yes
26 Open plot (point no. 463) 71.5 m Yes
27 Open plot (point no. 464) 16 m Yes
28 Bharat Engine Farm House (point no. 556) 13.5 m Yes

Annexure-I
Floods of various Return Periods estimated by NIH and UP Irrigation
Department for Yamuna at Poiyaghat, Agra
S. No. Return
period
(Years)
Growth
factors
Flood (m3/s)
NIH (GLO)
Flood (m3/s)
Irrigation Dept, UP (LP3)
1 25 2.410 3944.531 4155.15
2 50 3.143 5144.258 5322.09
3 100 4.098 6707.340 6736.47
• Estimated return period of the flood of 6063 m3/s observed in 2010 is 79 years (Fig.
1).
• Flood observed/ estimated by CWC for the year 1978 flood is 9,300 m3/s.
• Estimated return period for the flood occurred in 1978 i.e. 9,300 m3/s (by CWC) is
computed as 233 years from the discharge-return period curve (Fig. 1).
• Based on the Stage-Discharge Curve, the estimated discharge for the year 1978
flood level is 8,900 m3/s (Fig. 2).
Floods of various return periods estimated using L-moments approach by NIH
S. No. Return period
(Years)
Growth factors
Mean( 1636.735 )
Flood
(m3/s)
1 2 0.800 1309.388

2 10 1.687 2761.172
3 20 2.212 3620.458
4 25 2.410 3944.531
5 50 3.143 5144.258
6 100 4.098 6707.34
7 200 5.347 8751.622
8 500 7.616 12465.37
9 1000 9.965 16310.064
10 10000 24.486 40077.09

Fig. 1 Discharge Return Priod relationship

Fig 2. Flood level (Stage) discharge relationship

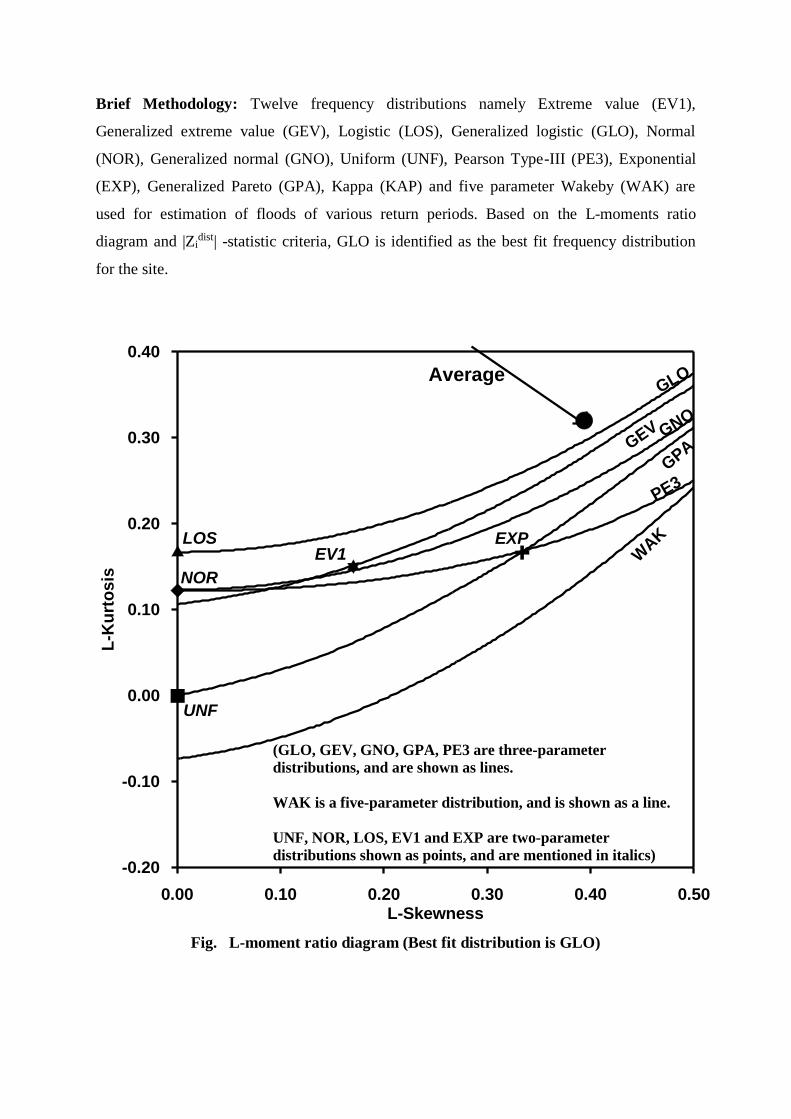
Brief Methodology: Twelve frequency distributions namely Extreme value (EV1),
Generalized extreme value (GEV), Logistic (LOS), Generalized logistic (GLO), Normal
(NOR), Generalized normal (GNO), Uniform (UNF), Pearson Type-III (PE3), Exponential
(EXP), Generalized Pareto (GPA), Kappa (KAP) and five parameter Wakeby (WAK) are
used for estimation of floods of various return periods. Based on the L-moments ratio
diagram and |Zidist| -statistic criteria, GLO is identified as the best fit frequency distribution
for the site.
Fig. L-moment ratio diagram (Best fit distribution is GLO)
0.10 0.30 0.500.00 0.20 0.40L-Skewness
-0.10
0.10
0.30
-0.20
0.00
0.20
0.40
L-K
urt
os
is
GLO
GEV GNO
GPA
PE3
WAKEXP
EV1LOS
NOR
UNF
(GLO, GEV, GNO, GPA, PE3 are three-parameter
distributions, and are shown as lines.
WAK is a five-parameter distribution, and is shown as a line.
UNF, NOR, LOS, EV1 and EXP are two-parameter
distributions shown as points, and are mentioned in italics)
Average

Zi dist –statistic for various distributions
Regional parameters for various distributions
Distribution Parameters of the Distribution
GLO =0.800 =0.254 k = -0.394
GEV =0.667 =0.321 k = -0.322
GNO =0.779 =0.439 k = -0.839
PE3 =1.000 =0.696 k = 2.374
GPA =0.378 =0.540 k = -0.131
WAK =0.270 = 1.211 Β = 2.967 = 0.241 δ = 0.433
Values of growth factors (QT/ Q )
Distribution Return period (Years)
2 10 20 25 50 100 200 500 10000
Growth factors
GLO 0.800 1.687 2.212 2.410 3.143 4.098 5.347 7.616 24.486
GEV 0.792 1.727 2.264 2.462 3.172 4.055 5.155 7.042 19.019
GNO 0.779 1.790 2.336 2.529 3.188 3.941 4.799 6.112 12.114
PE3 0.758 1.881 2.399 2.569 3.099 3.636 4.178 4.899 7.283
GPA 0.770 1.830 2.360 2.541 3.139 3.794 4.512 5.566 10.050
WAK 0.820 1.629 2.157 2.364 3.149 4.209 5.641 8.332 30.198
S. No. Distribution Zi dist –statistic
1 Generalized logistic (GLO) 0.66
2 Generalized Extreme Value (GEV) 0.78
3 Generalized Normal (GNO) 1.02
4 Generalized Pareto (GPA) 1.22
5 Pearson Type III (PE3) 1.41

Annexure-II
email correspondence with foreign satellite data service provider
1. NRSC Division dealing with foreign satellite data
Rebecca <[email protected]>
To
Pankaj Mani
1 Feb at 2:14 PM
Dear Sir,
We have checked with the data providers and we regret to inform that no
data is available covering the area of interest on the requested dates.
With Regards,
Rebecca Swarna
040 2388 4446
Hide original message
> On Tuesday, 24 January 2017 4:58 PM, Pankaj Mani
>> <[email protected]> wrote:
>> Sir,
>> This query is in relation to a work assigned to NIH as per directive
>> of National Green Tribunal (NGT) and therefore is very urgent.
>> I need high resolution data to mark the extent of flooding for a
>> specific date
>> in my area of interest. The image is required for dates 26 Sept 2010
>> or 27 Sept 2010.
>> The extent of study area is 77.94-78.08 E, 27.15-27.28 N.
>> I have browsed the web site of NRSC and could not find the coverage
>> for PAN or LISS III data for the dame and area.
>> I request you to intimate us the availability of high resolution
>> foreign satellite for the above extent and period. Kindly also send
>> us the cost estimate for the same.
>> Thanking you.
>> Pankaj Mani
>> Scientist E

>> National Institute of Hydrology
>> WALMI Complex, Phulwarisharif,
>> Patna.
>> phone - 0612-2452219, 2452227.
>> 9471006278, 9334257300 (m),
>> [email protected], [email protected]
Please do not print this email unless it is absolutely necessary.
The information contained in this electronic message and any attachments to this message are
intended for the exclusive use of the addressee(s) and may contain proprietary, confidential or
privileged information. If you are not the intended recipient, you should not disseminate, distribute or
copy this e-mail. Please notify the sender immediately and destroy all copies of this message and any
attachments.

2 European space Agency
To
Eohelp [email protected]
CC
[email protected] [email protected] Pankaj Mani
25 Jan at 4:24 PM
Dear EO-Help,
As anticipated, could you please take care of the attached inquiry submitted by the user Pankaj Mani
in copy of this email ?
He is interested in high resolution (under 20m) optical data of September 2010 over his area of
interest ( 77.94-78.08 E, 27.15-27.28 N ).
Thank you
Best Regards
Roberto
***********************************************************************************
ESA EO Research and Service Support Team
Email: [email protected]
Web: http://rssportal.esa.int | http://wiki.services.eoportal.org
Telephone: 0039-06-94180566 / 80784
Fax: 0039-06-94180296
**********************************************************************************
----- Forwarded by Roberto Cuccu/esrin/ESA on 25/01/2017 11:40 -----
From: Pankaj Mani <[email protected]> To: "[email protected]" <[email protected]> Date: 25/01/2017 02:56 Subject: Re: inquiry about high resolution satellite image for purchase
sir,
I am looking for optical images with spatial resolution (preferably) below 20 m.
Thanks
Pankaj Mani
Scientist E
National Institute of Hydrology
WALMI Complex, Phulwarisharif,
Patna.

phone - 0612-2452219, 2452227.
9471006278, 9334257300 (m),
[email protected], [email protected]
On Tuesday, 24 January 2017 11:53 PM, "[email protected]" <[email protected]> wrote:
Dear Pankaj Mani,
In order to better evaluate your request, please reply to the following questions.
• Could you please specify if you are interested in optical or radar imagery ?
• Could you please also specify the expected product ground resolution (e.g of the order of few
meters or if it would be ok also 10-30 meters, etc)?
Thank you
Best Regards
Roberto on behalf of RSS Team
***********************************************************************************
ESA EO Research and Service Support Team
Email: [email protected]
Web: http://rssportal.esa.int | http://wiki.services.eoportal.org
Telephone: 0039-06-94180566 / 80784
Fax: 0039-06-94180296
***********************************************************************************
Subject: inquiry about high resolution satellite image for purchase
Sir,
I need high resolution data to mark the extent of flooding for a specific date
in my area of interest. The image required is for 26 Sept 2010 or 27 Sept 2010.
Area of Interest is 77.94-78.08 E, 27.15-27.28 N
Kindly intimate availability and cost.
Thanks
Pankaj Mani
Scientist E
National Institute of Hydrology
WALMI Complex, Phulwarisharif,
Patna.
phone - 0612-2452219, 2452227.

9471006278, 9334257300 (m),
[email protected], [email protected]
This message and any attachments are intended for the use of the addressee or
addressees only.
The unauthorised disclosure, use, dissemination or copying (either in whole or in
part) of its
content is not permitted.
If you received this message in error, please notify the sender and delete it from your
system.
Emails can be altered and their integrity cannot be guaranteed by the sender.
Please consider the environment before printing this email.
From: "Pankaj Mani" <[email protected]>
To: "[email protected]" <[email protected]>
Date: 24/01/2017 14:09
This message and any attachments are intended for the use of
the addressee or addressees only.
The unauthorised disclosure, use, dissemination or copying
(either in whole or in part) of its
content is not permitted.
If you received this message in error, please notify the
sender and delete it from your system.
Emails can be altered and their integrity cannot be guaranteed
by the sender.
Please consider the environment before printing this email.
This message and any attachments are intended for the use of the addressee
or addressees only.
The unauthorised disclosure, use, dissemination or copying (either in whole
or in part) of its
content is not permitted.
If you received this message in error, please notify the sender and delete
it from your system.
Emails can be altered and their integrity cannot be guaranteed by the
sender.

Please consider the environment before printing this email.

3 Imaging Corporation (Dealing with very high resolution images)
William Pora <[email protected]>
To
CC
Leo J. Romeyn
24 Jan at 8:16 PM
Pankaj,
Unfortunately due to sales restrictions we cannot sell imagery to clients in India.
We suggest you try this government agency in your country.
http://www.nrsc.gov.in/
Best Regards,
William Pora
Satellite Imaging Corporation
P.O. Box 690502
Houston, TX 77269-0502
USA
Tel: (832) 237-2900 x202
Fax: (832) 442-5045
Email: [email protected]
Web: www.satimagingcorp.com
The information contained in this communication may be legally privileged and is intended solely for the
use of the addressees. Any unauthorized disclosure; copying, distribution or taking any action in reliance
on the contents of this information is strictly prohibited and may be unlawful.
Additional restrictions may apply if you or your company is under a Non-Disclosure Agreement with
Satellite Imaging Corporation.
-----Original Message-----
From: [email protected] [mailto:[email protected]]
Sent: Monday, January 23, 2017 8:29 PM
Subject: Satellite Imaging Corp - Contact Form Submission
Name: Pankaj Mani
Company or Organization: National Institute of Hydrology
Country: India
E-Mail Address: [email protected]

Phone: +91 9471006278

Annexure-III
Ground Control Points Details
Annexure-IV
Flood Inundation Mapping (Method)
Generally, two approaches are adopted for delineation of flood extent; (i) flow model based
inundation mapping (also known as flood inundation modelling) and (ii) satellite image based
flood mapping.
The advantage of flood modelling is the inclusion of catchment and floodplain dynamics in
flow model and thus able to simulate the flood inundation for futuristic development. This
method is also used for probabilistic flood inundation mapping of ungauged rivers (Sarhadi et
al., 2012). The flood inundation modelling in low relief flood plain (small variation in ground
value) requires high resolution elevation data for the river and floodplain which is a measure
constrain. The process is data and computational intensive. Moreover, the modelled
inundation requires the ground verification (calibration and validation) for which either very
accurate digital elevation model (DEM) or the satellite image derived flood inundation for the
specific historical flooding event are used (Patro et al., 2009; Kuldeep and Garg, 2015) in
geographical information system (GIS) based environment.
Mapping of the flooded areas using satellite images (optical) is based on the fact that water
absorbs or transmits most of the electromagnetic energy in the near infrared (NIR) and mid
infra red (MIR) wavelengths, which results in less reflection and in turn a dark color on (false
colour composite) FCCs. Sensors having very fine spatial resolution working in optical
wavelength region are capable of differentiating the water body from other land features.
Satellite images acquired in different spectral bands (wavelength region) during a flood event
can provide valuable information about flood inundation. Through the selection of
appropriate sensors and platforms, remote sensing can provide accurate and timely estimation
of flood inundation and flood-prone areas. A list of sensors used for flood analyses are given
in Table 1.
Table 1: List of satellite sensors with their use for flood monitoring
(Bhanumurthy et al., 2010)

Sl
No:
Satellite
Sensor/
Mode
Spatial
Resolution
(m)
Spectral
Resolution
(µm)
Swath
(km)
Used For
1.
IRS-P6
AWiFS
56
B2 : 0.52-0.59
B3 : 0.62-0.68
B4 : 0.77-0.86
B5 : 1.55-1.70
740
Regional level
flood mapping
2.
IRS-P6
LISS-III
23.5
B2 : 0.52-0.59
B3 : 0.62-0.68
B4 : 0.77-0.86
B5 : 1.55-1.70
141
District-level
flood mapping
3.
IRS-P6
LISS-IV
5.8 at nadir
B2 : 0.52-0.59
B3 : 0.62-0.68
B4:0.77-0.86
23.9
Detailed
Mapping
4.
IRS-1D
WiFS
188
B3: 0.62-0.68
B4 : 0.77-0.86
810
Regional level
flood mapping
5.
IRS-1D
LISS-III
23.5
B2: 0.52-0.59
B3 : 0.62-0.68
B4: 0.77-0.86
B5:1.55-1.70
141
Detailed
Mapping
6.
Aqua /
Terra
MODIS
250
36 in visible
NIR & thermal
2330
Regional level
Mapping
7.
IRS-P4
OCM
360
Eight narrow
bands in
visible & NIR
1420
Regional level
Mapping
8. Cartosat-1 PAN 2.5 0.5-0.85 30 Detailed
Mapping
9. Cartosat-2 PAN 1 0.45-0.85 9.6 Detailed
Mapping
10.
Radarsat-1
SAR/
ScanSAR
Wide
100
C-band
(5.3 cm; HH
Polarization)
500
Regional level
mapping

Sl
No:
Satellite
Sensor/
Mode
Spatial
Resolution
(m)
Spectral
Resolution
(µm)
Swath
(km)
Used For
11.
Radarsat-1
SAR
/ScanSAR
Narrow
50
C-band
(5.3 cm)
300
District-level
mapping
12
Radarsat-1
Standard
25
C-band
100
District-level
mapping
13
Radarsat-1
Fine
beam
8
C-band
(5.3 cm)
50
Detailed
mapping
14
Radarsat-2
SAR
3m
ultra- fine mode
and 10m multi-
llik fine mode
C –band
20 in
ultra
fine
mode
Detailed
mapping
14
ERS
SAR
25
C-band ; VV
Polarization
100
District-level
mapping
Additional sensors details for which data have been used in the study
15 Landsat-5 TM B1:B5, B7-30 m,
B6-120 m,
B1 0.45-0.52
B2 0.52-0.60
B3 0.63- 0.69
B4 0.76-0.90
B5 1.55-1.75
B610.40-12.50
B7 2.08 - 2.35
170

Sl
No:
Satellite
Sensor/
Mode
Spatial
Resolution
(m)
Spectral
Resolution
(µm)
Swath
(km)
Used For
16 Landsat-7
(SLC OFF)
ETM+ B1:B5, B7-30 m,
B6-60 m,
B8-15 m
B1 0.45-0.515
B2 0.525-0.605
B3 0.63-0.69
B4 0.775-0.9
B5 1.55-1.75
B6 10.4-12.5
B7 2.08-2.35
B8 0.52-0.9
183 Detailed
mapping
References:
Bhanumurthy, V., Manjusree, P., Srinivasa Rao, G. (2010). Chapter on “Flood Disaster
Management”. In book Remote Sensing Applications, (P. S. Roy, R. S. Dwivedi and
D. Vijayan, eds.), National Remote Sensing Center, Hyderabad, India.
Kuldeepa and Garg P. K., 2015, The role of satellite derived data for flood inundation
mapping using GIS, The International Archives of the Photogrammetry, Remote
Sensing and Spatial Information Sciences, Volume XL-3/W3.
NRSC, 2016, https://nrsc.gov.in/IRS_Data_Products
Patro, S., Chatterjee, C., Mohanty, S., Singh R. and Raghuwanshi, N. S., 2009. Flood
inundation modeling using MIKE FLOOD and remote sensing data, Journal of the
Indian Society of Remote Sensing 37(1):107-118 · March 2009.
Sarhadi, A., Soltani, S. and Modarres, R., 2012. Probabilistic flood inundation mapping of
ungauged rivers: Linking GIS techniques and frequency analysis. Journal of
Hydrology, 458, pp. 68-86.

Some Remote Sensing Terms Referred in Text
Pixel: The smallest unit in a digital image. A satellite image is made up of a matrix of many
pixels, each having its own digital value.
Spatial resolution: The amount of ground covered in one pixel of the image. For example an
image with one meter resolution means that each pixel in the image represents one square
meter on the ground. The ranges for high (5.8m and smaller), medium (5.8 m to 56 m) and
low (360 m and coarser) spatial resolution for Indian remote sensing satellites are specified
by National Remote Sensing Centre web site (NRSC, 2016).
Temporal Resolution: The temporal resolution specifies the revisiting frequency of a
satellite sensor for a specific location. Temporal images are used for change detection and
monitoring of progress of an event.
Spectral resolution: A sensor's spectral resolution specifies the number of spectral bands in
which the sensor can collect reflected radiance (energy reflected from an object on land
surface). Higher the spectral resolution, better would be image interpretability. Multispectral
sensors are capable of taking two or more images simultaneously but each in a different part
of the electromagnetic spectrum (wavelength region).
Radiometric resolution: The radiometric resolution of an imaging system describes its
ability to discriminate very slight differences in the energy level. The finer the radiometric
resolution of a sensor, the more sensitive it is to detecting small differences in reflected or
emitted energy and thus more useful in differentiating one land feature from other.
False Colour Composite (FCC): Multispectral images contain information inside and
outside the visible electromagnetic spectrum (EM). The images are an array of gray levels
and thus have limited interpretability. To enhance the image interpretability, the wavelengths
outside the visible spectrum need to be reassigned to the visible spectrum so that it is visible
to the human eye. FCC is a colour image where images acquired in various of parts of EM
spectrum (wavelength region) are filtered through one or more of the red, green, and blue
components to produce a colour composite for better interpretability. The most commonly

seen FCC display the very-near infrared as red, red as green, and green as blue. In FCC water
pixel appears in various tone of blue depending upon its depth and turbidity.
spectral band: an interval in the electromagnetic spectrum (aka wavelength) recorded by a
remote sensing instrument.
Visible wavelengths: the radiation range in which the human eye is sensitive, approximately
0.4 to 0.7 µm
Multispectral: refers to remote sensing in two or more bands or wavelengths
Panchromatic (PAN): one band covering all the visible bands displayed as a black and white
photo or image.
Image fusion: process combining two or more images to produce a single image with high
visual interpretability. On a high spatial resolution panchromatic image (PAN), detailed
geometric features can easily be recognized, while the multispectral images contain affluent
spectral information.The capabilities of the images can be enhanced if the advantages of both
high spatial and spectral resolution can be integrated into one single image that can be done
using a process known as image fusion. The outcome of image fusion is a new image which
is more worthy for human and machine perception or further image-processing tasks such as
segmentation, feature extraction and object recognition.
Image classification: Digital image classification techniques group pixels to represent land
cover features. Land cover could be forested, urban, agricultural, water body and other types
of features. There are three main image classification techniques; unsupervised classification,
supervised classification and object based image classification.
• In unsupervised classification pixels are grouped together based on the reflectance
properties of pixels. In this techniques, iso-data are first grouped together
subsequently classes are identified based on ground information.

• In supervised classification techniques, the representative samples for each land
cover class are selected, known as training set. Based on the reflectance
characteristics the training signature for all identified features are defined and used for
classifying the entire image. The common supervised classification algorithms are
maximum likelihood and minimum-distance classification.
• Object-based image analysis supports the use of multiple bands for multiresolution
segmentation and classification. After multi-resolution segmentation, the user
identifies sample sites for each land cover class. The statistics to classify image
objects are defined and used for classifying the various land features from entire
image.
Image registration: Exact pixel-to-pixel matching of two different images or matching of one
image to a map. Satellite image registration is a process to match and align different images
which is captured at at different times (multi temporal), different viewpoints (multi view),
different sensors (multi modal). The image registrations process consist of four steps; feature
extraction, feature matching, transform model estimation and image resampling and
transformation.
Landsat 7 ETM+ SLC-off data refers to all Landsat 7 images collected after May 31, 2003,
when the Scan Line Corrector (SLC) failed. These products have data gaps, but are still
useful and maintain the same radiometric and geometric corrections as data collected prior to
the SLC failure. (https://www2.usgs.gov/faq/node/3849)
NRSC National Remote Sensing Centre is a full-fledged centres of ISRO. The Centre is
responsible for remote sensing satellite data acquisition and processing, data dissemination,
aerial remote sensing and decision support for disaster management.
USGS EarthExplorer: The EarthExplorer user interface is an online search, discovery, and
ordering tool developed by the United States Geological Survey (USGS). EarthExplorer
supports the searching of satellite, aircraft, and other remote sensing inventories through
interactive and textual-based query capabilities. Through the interface, users can identify

search areas, datasets, and display metadata, browse and integrated visual services within the
interface.
GPS: The Global Positioning System (GPS) is a satellite-based navigation system made up of
at least 24 satellites. GPS satellites circle the Earth twice a day in a precise orbit. Each
satellite transmits a unique signal and orbital parameters that allow GPS devices to decode
and compute the precise location of the satellite. GPS receivers use this information and
trilateration to calculate a user's exact location. Essentially, the GPS receiver measures the
distance to each satellite by the amount of time it takes to receive a transmitted signal.

Annexure V.
Field Photographs of Pillar along Flood Lines

Annexure VII
Encroachments within Flood Line at Various Locations


![INFORMATION HAND BOOK In pursuance of Chapter 11, Section ...chittoorpolice.ap.gov.in/CHITTOORINFORMATIONRTIACT.pdf · [Type text] [Type text] INFORMATION HAND BOOK In pursuance of](https://img.dokumen.tips/doc/110x75/5eae7971e1e3fc31ac2cf97a/information-hand-book-in-pursuance-of-chapter-11-section-type-text-type.jpg)