Embed Size (px)
Citation preview

Table of Contents
Sl. No. Title
1 Interface
2 C A P I and the three combo boxes
3 Check box
4 Navigation buttons
5 Group Navigation buttons
6 Currency Converter
7 Live CM News - Interface
8 CM - Live News
9 Live Corporate Events
10 Corporate Action
11 Tree View Menu setting
12 Synopsis
13 My Notes
14 My Books
15 Annual Report Validation
16 Daily Moving Average
17 Fact Sheets
18 Second combo box - Fact Sheet - All countries
19 Peer Set - Finance - DPD
20 Peer Set - Finance - Balance Sheet – Common Size & Common Companies
21 Active Set
22 Custom Save
23 Custom Screener
24 Research and Custom Queries
25 Screener - Introduction
26 Screener - Introduction contd… / Peer set Manager
27 Screener - Filters
28 Screener – Filters – Preview More
29 Preview Some More
30 AND/OR/NOT - Part 1
31 AND/OR/NOT - Part 2
32 Screener - Formulae - Part 1
Sl. No. Title
33 Screener - Formulae - Part 2
34 Output
35 Output More
36 Screener - Output – Statistical functions
37 Screener – Domain – Aggregate
38 Study of a Saved Screener – Part 1
39 Study of a Saved Screener – Part 2
40 Screener - Useful tips – Part 1
41 Screener - Useful tips – Part 2
42 Screener - Useful tips – Part 3
43 Screener - Useful tips – Part 4
44 Screener - Useful tips – Part 5
45 Screener - Useful tips – Part 6
46 Export - Excel List Box
47 Export - Excel - Security Warning
48 Export - Update
49 Export - Update - Select Company
50 Export - Flexibility
51 Really Good Useful Tips - Other than Screener - Part 1
52 Really Good Useful Tips - Other than Screener - Part 2
53 Really Good Useful Tips - Other than Screener - Part 3
54 Really Good Useful Tips - Other than Screener - Part 4
55 Really Good Useful Tips - Other than Screener - Part 5
56 Really Good Useful Tips - Other than Screener - Part 6
57 Really Good Useful Tips - Other than Screener - Part 7
58 Really Good Useful Tips - Other than Screener - Part 8
59 Summary of Short cut Menus – Part 1
60 Summary of Short cut Menus – Part 2
61 Summary of Short cut Menus – Part 3
62 Summary of Short cut Menus – Part 4

Go
to T
ab
le of C
on
tents

C, A, P & I and the three combo boxes
Next to the buttons C, A, P and I in the Icon Menu bar 1 are the button S which opens up the Screener and Company, Enter Company Name & Select Corporate Action combo boxes. Note that the Select Corporate Action combo box is a contented one and does not change its contents, yet, it changes its physical location as & when a third combo box that is „Subsidiary Companies‟ combo box is introduced between Enter Company Name & the Select Corporate Action combo boxes in the case of a selected company in the second combo box having subsidiary companies. So, we may not discuss much on Select Corporate Action combo box and we may check out the related topic later. So, coming back to the buttons C, A, P & I and the first two combo boxes, we will discuss whether they are Individual or Group / Dependent or Independent / Relationship between them if they are dependent.
C for Company By default, the button C appears depressed. The first combo box reads Company & the Second reads Enter Company Name. There is a relationship between C and the Company in the first combo box. „C‟ corresponds to the Company in the first combo box. Rather than selecting the first combo box and selecting company from the drop down list of the first combo box, just click on C button. And also note that there is a relationship between „Company‟ in the first combo box & Enter Company Name in the second combo box. Selection of Company in the first combo box produces selection of Enter Company Name in the second combo box. So, there is a relationship between the first combo box & the second combo box. So, the Second combo box is dependent on the first combo box. So, these two combo boxes form a Group.
A for Active set Click on A button. The first combo box changes to Active Set. The Second combo box changes to Select Company. So, there is a relationship between the button „A‟ and the Active Set in the first combo box. „A‟ corresponds to the Active Set in the first combo box. Also, there is a relationship between the Active Set in the first combo box & Select Company in the second combo box. Selection of Active Set in the first combo box produces selection of Select Company in the Second combo box. So, there is a relationship between the first combo box & the second combo box. So, the Second combo box is dependent on the first combo box.
P for Peer Set & I for Industry Similarly, we will reach that P/I corresponds to the Peer Set/Industry in the first combo Box. Selection of Peer Set/Industry in the first combo box produces selection of Enter Peer Set/Industry Name in the second combo box. So, the Second combo box is dependent on the first combo box. So, these two combo boxes form a Group
More groups! Select Banker from the first combo box‟s list. Second combo box pulls up Enter Banker Name. Click on CM Peer Set in the first combo box. Second combo box pulls up Enter CM Peer Set Name. So, for each & every selection of data item in the first combo box, there emanates a corresponding selection from the second combo box. So, the second combo box is dependent of the first combo box. And these two combo boxes form a group.
Subsidiary companies Whenever the chosen company in the second combo box has subsidiary companies, a third combo box gets introduced between Enter Company Name & the Select Corporate Action combo boxes.
To Remember C, A, P & I are mapped onto Company, Active Peer Set, Peer Set & Industry respectively Mapping is back & forth. The buttons C, A, P & I are independent individual objects. Second combo box is dependent on the first combo box. And these two combo boxes form a group.
Go to Table of Contents
Check box
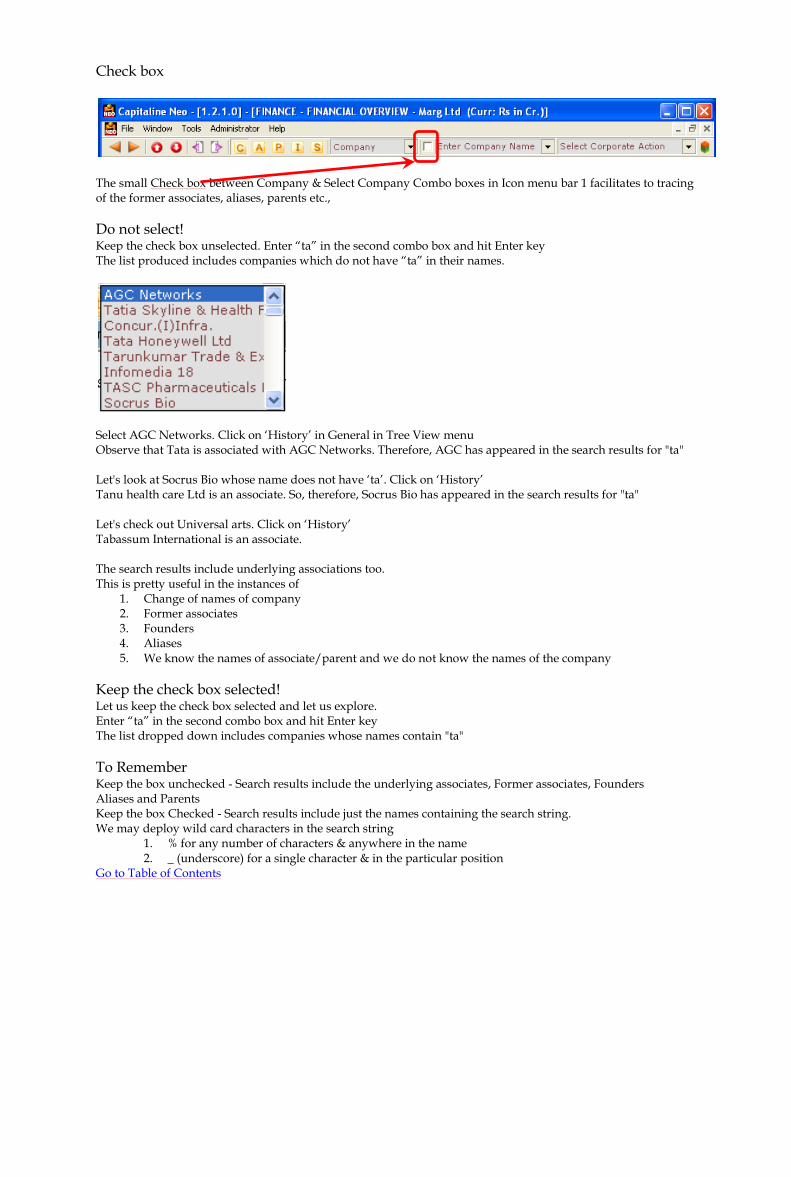
The small Check box between Company & Select Company Combo boxes in Icon menu bar 1 facilitates to tracing of the former associates, aliases, parents etc.,
Do not select! Keep the check box unselected. Enter “ta” in the second combo box and hit Enter key The list produced includes companies which do not have “ta” in their names.
Select AGC Networks. Click on „History‟ in General in Tree View menu Observe that Tata is associated with AGC Networks. Therefore, AGC has appeared in the search results for "ta" Let's look at Socrus Bio whose name does not have „ta‟. Click on „History‟ Tanu health care Ltd is an associate. So, therefore, Socrus Bio has appeared in the search results for "ta" Let's check out Universal arts. Click on „History‟ Tabassum International is an associate. The search results include underlying associations too. This is pretty useful in the instances of
1. Change of names of company 2. Former associates 3. Founders 4. Aliases 5. We know the names of associate/parent and we do not know the names of the company
Keep the check box selected! Let us keep the check box selected and let us explore. Enter “ta” in the second combo box and hit Enter key The list dropped down includes companies whose names contain "ta"
To Remember Keep the box unchecked - Search results include the underlying associates, Former associates, Founders Aliases and Parents Keep the box Checked - Search results include just the names containing the search string. We may deploy wild card characters in the search string
1. % for any number of characters & anywhere in the name 2. _ (underscore) for a single character & in the particular position
Go to Table of Contents

Navigation buttons
Group The previous & next buttons – the left & right triangle buttons navigate with respect to the current selection in the second combo box. If there is no selection in the second combo box, clicking on next button presents the data of first data item in the second combo box. These two buttons assume the role of Company, Active Set and Banker etc as chosen in the first combo box
Tree View menu These buttons previous tree menu & next tree menu - up and down arrow buttons next to the group navigation buttons are pretty useful if for a particular Company, Industry, House and Peer Set etc, different data pages are to be viewed. These buttons can open the next/previous data pages in the next/previous data groups, even if they are folded.
Screen The previous Screen & next Screen buttons next to the tree view menu buttons navigate with respect to the current, active data page/window in the order of the list in the sub menu got by a click on Window in main menu bar. The active, current data page is the one against which appears a tick mark. These buttons are pretty useful to revisit the data pages in order, again, forward or backward Please note that there are instances where Capitaline overwrites the data page. Under such circumstances, clicking on previous Screen button will navigate to the screen immediately before the last visited screen.
Next – Ctrl + F6 Click on Capitaline‟s logo button in Main Menu Bar. There is an option „Next‟ in the drop down menu. Key representation for this option is Ctrl and F6. This is same as Next Screen that is the sixth button in the icon menu bar 1.
Window Click on Window in main menu bar. The drop down sub menu has a list of all the data pages already visited. This option allows taking a faster route to the data page already visited. Choose & Click on any page in the list in the sub menu got by a click on Window in main menu bar. Only this option allows queue jumping.
Queue jumping! The three pairs of buttons – Group, Tree View menu and Screen cannot jump the queue. Also the option „Next‟ in the drop down menu got by clicking on Capitaline‟s logo in Main Menu bar cannot jump the queue. All these 7 options navigate in an order, that's they are in a queue, in a line. They can't jump the queue. Whereas the option in window drop down menu allows queue jumping!
To Remember The previous & next buttons assume the role – Company, Active Set and Banker etc as chosen in the first combo box and navigation is with respect to the current selection in the second combo box. Tree View menu navigation buttons are useful if for a particular Company, Industry, House and Peer Set etc, different data pages are to be viewed. Tree View menu navigation buttons can open the next/previous data pages in the next/previous data groups, even if they are folded. The previous Screen & next Screen navigate with respect to the current, active data page/window in the order of the list in the sub menu got by a click on Window in main menu bar. „Next‟ in the drop down menu got by clicking on Capitaline‟s logo button in Main Menu Bar is same as Next Screen that is the sixth button in the icon menu bar 1. Using Screen navigation buttons do not change the chosen level of the chosen group. Chosen group is as in the first combo box and the chosen level is as in the second combo box in icon menu bar 1. Go to Table of Contents
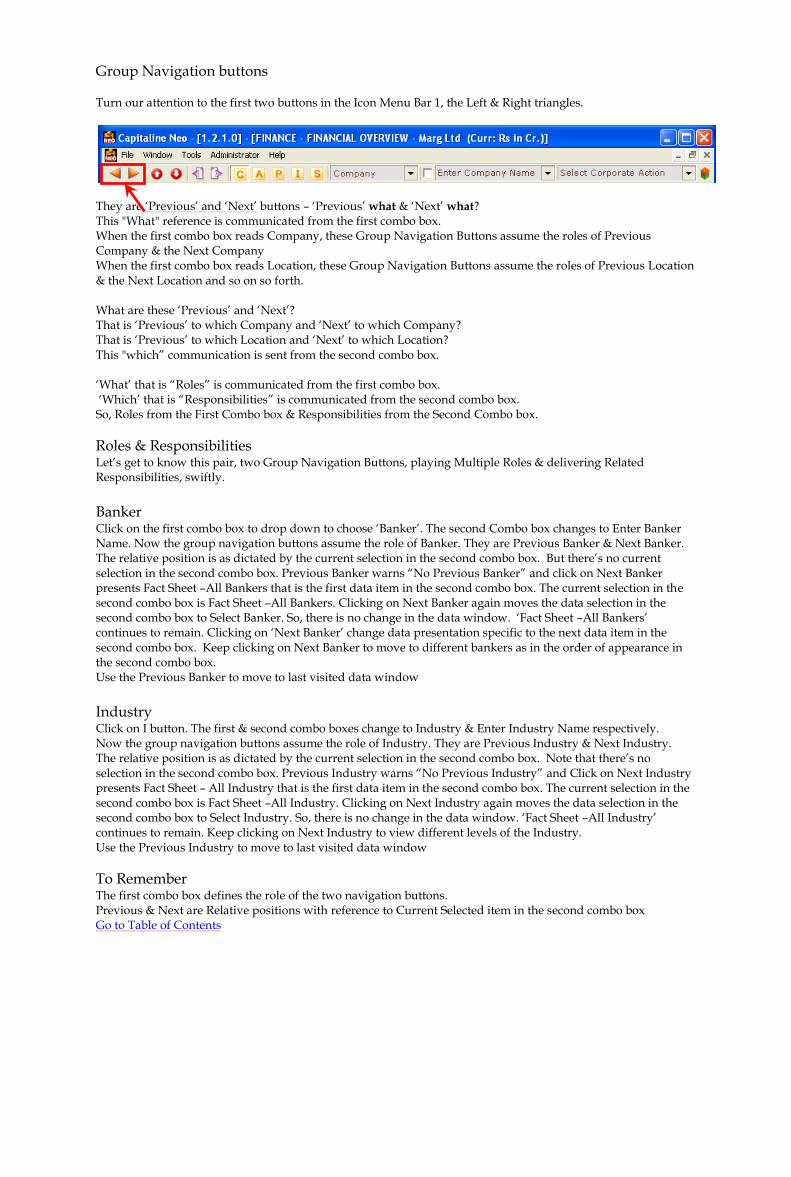
Group Navigation buttons Turn our attention to the first two buttons in the Icon Menu Bar 1, the Left & Right triangles.
They are „Previous‟ and „Next‟ buttons – „Previous‟ what & „Next‟ what? This "What" reference is communicated from the first combo box. When the first combo box reads Company, these Group Navigation Buttons assume the roles of Previous Company & the Next Company When the first combo box reads Location, these Group Navigation Buttons assume the roles of Previous Location & the Next Location and so on so forth. What are these „Previous‟ and „Next‟? That is „Previous‟ to which Company and „Next‟ to which Company? That is „Previous‟ to which Location and „Next‟ to which Location? This "which” communication is sent from the second combo box. „What‟ that is “Roles” is communicated from the first combo box. „Which‟ that is “Responsibilities” is communicated from the second combo box. So, Roles from the First Combo box & Responsibilities from the Second Combo box.
Roles & Responsibilities Let‟s get to know this pair, two Group Navigation Buttons, playing Multiple Roles & delivering Related Responsibilities, swiftly.
Banker Click on the first combo box to drop down to choose „Banker‟. The second Combo box changes to Enter Banker Name. Now the group navigation buttons assume the role of Banker. They are Previous Banker & Next Banker. The relative position is as dictated by the current selection in the second combo box. But there‟s no current selection in the second combo box. Previous Banker warns “No Previous Banker” and click on Next Banker presents Fact Sheet –All Bankers that is the first data item in the second combo box. The current selection in the second combo box is Fact Sheet –All Bankers. Clicking on Next Banker again moves the data selection in the second combo box to Select Banker. So, there is no change in the data window. „Fact Sheet –All Bankers‟ continues to remain. Clicking on „Next Banker‟ change data presentation specific to the next data item in the second combo box. Keep clicking on Next Banker to move to different bankers as in the order of appearance in the second combo box. Use the Previous Banker to move to last visited data window
Industry Click on I button. The first & second combo boxes change to Industry & Enter Industry Name respectively. Now the group navigation buttons assume the role of Industry. They are Previous Industry & Next Industry. The relative position is as dictated by the current selection in the second combo box. Note that there‟s no selection in the second combo box. Previous Industry warns “No Previous Industry” and Click on Next Industry presents Fact Sheet – All Industry that is the first data item in the second combo box. The current selection in the second combo box is Fact Sheet –All Industry. Clicking on Next Industry again moves the data selection in the second combo box to Select Industry. So, there is no change in the data window. „Fact Sheet –All Industry‟ continues to remain. Keep clicking on Next Industry to view different levels of the Industry. Use the Previous Industry to move to last visited data window
To Remember
The first combo box defines the role of the two navigation buttons. Previous & Next are Relative positions with reference to Current Selected item in the second combo box Go to Table of Contents
Currency Converter
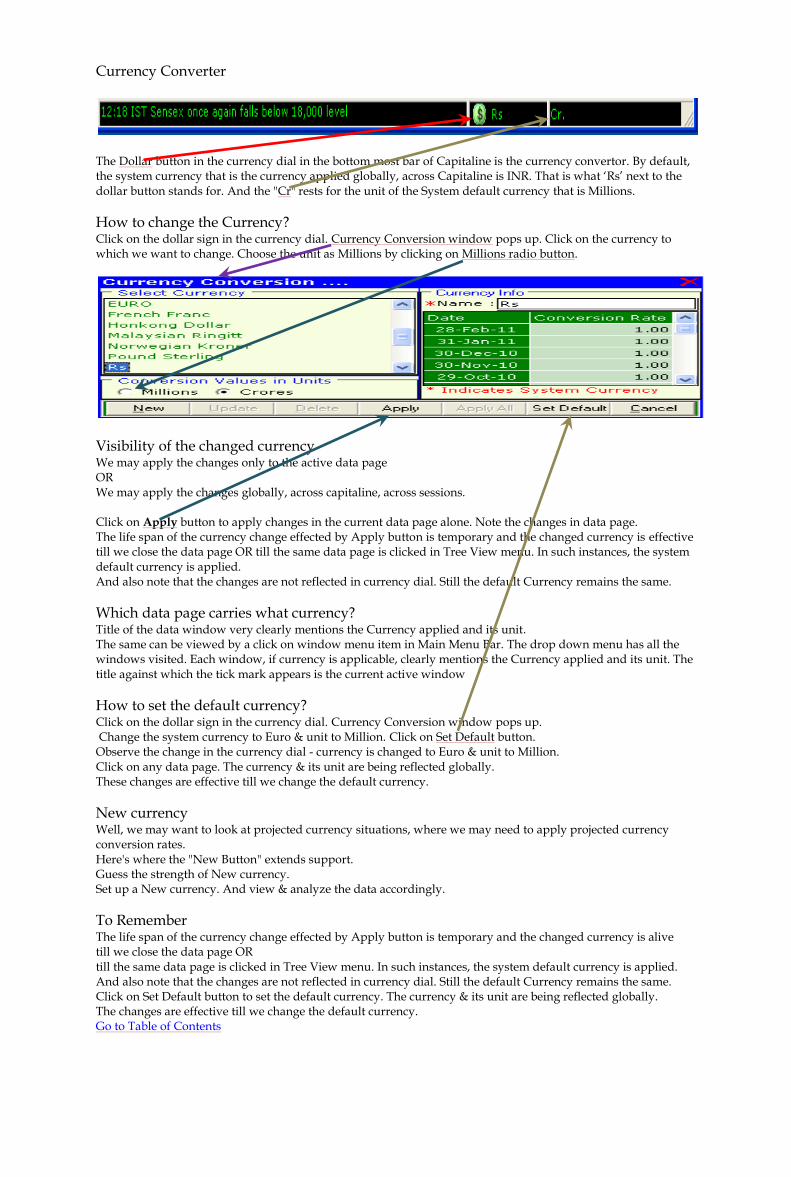
The Dollar button in the currency dial in the bottom most bar of Capitaline is the currency convertor. By default, the system currency that is the currency applied globally, across Capitaline is INR. That is what „Rs‟ next to the dollar button stands for. And the "Cr" rests for the unit of the System default currency that is Millions.
How to change the Currency? Click on the dollar sign in the currency dial. Currency Conversion window pops up. Click on the currency to which we want to change. Choose the unit as Millions by clicking on Millions radio button.
Visibility of the changed currency We may apply the changes only to the active data page OR We may apply the changes globally, across capitaline, across sessions. Click on Apply button to apply changes in the current data page alone. Note the changes in data page. The life span of the currency change effected by Apply button is temporary and the changed currency is effective till we close the data page OR till the same data page is clicked in Tree View menu. In such instances, the system default currency is applied. And also note that the changes are not reflected in currency dial. Still the default Currency remains the same.
Which data page carries what currency? Title of the data window very clearly mentions the Currency applied and its unit. The same can be viewed by a click on window menu item in Main Menu Bar. The drop down menu has all the windows visited. Each window, if currency is applicable, clearly mentions the Currency applied and its unit. The title against which the tick mark appears is the current active window
How to set the default currency? Click on the dollar sign in the currency dial. Currency Conversion window pops up. Change the system currency to Euro & unit to Million. Click on Set Default button. Observe the change in the currency dial - currency is changed to Euro & unit to Million. Click on any data page. The currency & its unit are being reflected globally. These changes are effective till we change the default currency.
New currency Well, we may want to look at projected currency situations, where we may need to apply projected currency conversion rates. Here's where the "New Button" extends support. Guess the strength of New currency. Set up a New currency. And view & analyze the data accordingly.
To Remember The life span of the currency change effected by Apply button is temporary and the changed currency is alive till we close the data page OR till the same data page is clicked in Tree View menu. In such instances, the system default currency is applied. And also note that the changes are not reflected in currency dial. Still the default Currency remains the same. Click on Set Default button to set the default currency. The currency & its unit are being reflected globally. The changes are effective till we change the default currency. Go to Table of Contents

Live CM News - Interface This News Window has two panes, one on top and one down below.
Top pane shows the live news as on Date, Time & the Caption. The horizontal line between the panes is the pane divider. We can pull this pane divider up or down to view more or less of the either of the panes. Get to the pane divider. Cursor changes the shape to double sided arrow. Catch hold of it, by clicking on it. Keep the mouse button pressed. Move up/down. Leave the mouse button on reaching the point of comfort. Pull the vertical scroll bar down. The numbers seen are page nos., and we can move to any news pages by a click on the number. By default, the bottom pane is the home for budget news. After we click on a news caption in the top pane, the bottom pane becomes the home for the news, related news & other news stories. And the budget news no longer appears in the bottom pane. Should we want to read the budget, click on „Budget News‟ in top right - in the line of "… As on" and/or the date combo box We have two options to view the content online or offline. By default, watching the Live CM News is online. We need to have connected to the internet to watch it online. If we're online, we get to catch the live news feed continuously, all through the day. Begin to watch the news story by clicking on a news caption in the top pane. Look at the bottom pane closely. This news story pane is further divided into two vertical panes - left & right. The left pane starts with news story which we clicked on in the top pane. Read the news of our interest. And below is the list of Previous News. Click on any related news of interest. The news story opens in the same left pane. Date changes to Date of the story. Read the story. Check for other previous news, by pulling down the vertical scroll bar in the bottom pane. Clicking on "Back" in the left bottom of the left pane will move to the last news story read. Right pane has all the Other Stories. This is a miniature replica of the top pane & this is pretty useful if we have maximized the bottom pane and we want to view any of these stories. Without having to resize the pane, we can get to see the other stories. Click on any caption to read Other Story. We get to see the story in the left story pane. Click on the radio button „view offline‟ to view the news till the moment Capitaline was online. Click on „refresh‟ button to get the just in news feed. Capitaline is pretty fast in feeding the news and this is the window that gives us hot news. Let's remember to take it as early as possible in the start of the day.
To Remember Live CM News Window has two panes, one on top and one down below. We have two options to view the content - online or offline. Date combo box is available in all except IPO section. This is in the bar of “… As on” and is just before „Budget News‟ button The horizontal line between the panes is the pane divider. We can pull this pane divider up or down to view more or less of the either of the panes. Check for other related news, by pulling down the vertical scroll bar in this bottom pane. Clicking on "Back" in the left bottom of the left pane will move to the last news story read. Other Stories are available in the right vertical portion of the bottom pane Go to Table of Contents
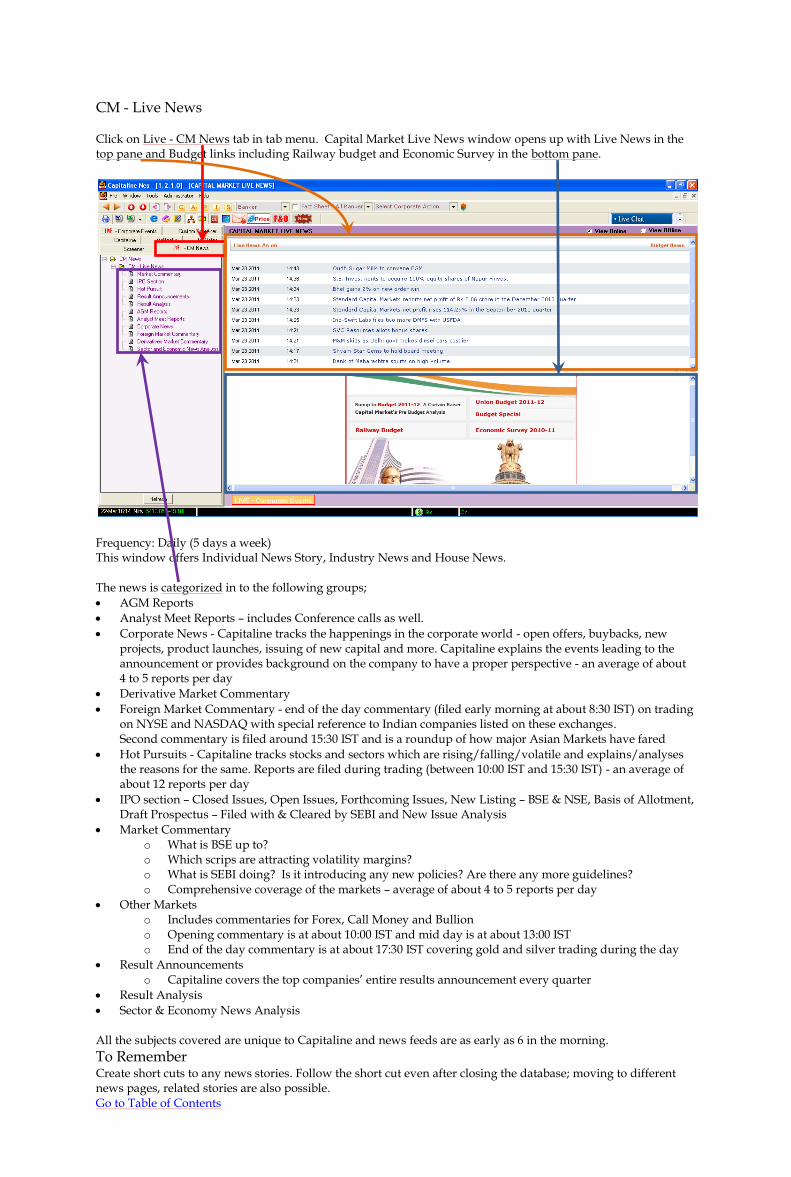
CM - Live News Click on Live - CM News tab in tab menu. Capital Market Live News window opens up with Live News in the top pane and Budget links including Railway budget and Economic Survey in the bottom pane.
Frequency: Daily (5 days a week) This window offers Individual News Story, Industry News and House News. The news is categorized in to the following groups;
AGM Reports
Analyst Meet Reports – includes Conference calls as well.
Corporate News - Capitaline tracks the happenings in the corporate world - open offers, buybacks, new projects, product launches, issuing of new capital and more. Capitaline explains the events leading to the announcement or provides background on the company to have a proper perspective - an average of about 4 to 5 reports per day
Derivative Market Commentary
Foreign Market Commentary - end of the day commentary (filed early morning at about 8:30 IST) on trading on NYSE and NASDAQ with special reference to Indian companies listed on these exchanges. Second commentary is filed around 15:30 IST and is a roundup of how major Asian Markets have fared
Hot Pursuits - Capitaline tracks stocks and sectors which are rising/falling/volatile and explains/analyses the reasons for the same. Reports are filed during trading (between 10:00 IST and 15:30 IST) - an average of about 12 reports per day
IPO section – Closed Issues, Open Issues, Forthcoming Issues, New Listing – BSE & NSE, Basis of Allotment, Draft Prospectus – Filed with & Cleared by SEBI and New Issue Analysis
Market Commentary o What is BSE up to? o Which scrips are attracting volatility margins? o What is SEBI doing? Is it introducing any new policies? Are there any more guidelines? o Comprehensive coverage of the markets – average of about 4 to 5 reports per day
Other Markets o Includes commentaries for Forex, Call Money and Bullion o Opening commentary is at about 10:00 IST and mid day is at about 13:00 IST o End of the day commentary is at about 17:30 IST covering gold and silver trading during the day
Result Announcements o Capitaline covers the top companies‟ entire results announcement every quarter
Result Analysis
Sector & Economy News Analysis All the subjects covered are unique to Capitaline and news feeds are as early as 6 in the morning.
To Remember Create short cuts to any news stories. Follow the short cut even after closing the database; moving to different news pages, related stories are also possible. Go to Table of Contents

Live Corporate Events There are two doors to get in to Live Corporate Events. One - Click on Live Corporate Events button if we're in Live CM news. Two - Click on Live Corporate Events tab of tab menu. So, what is Live Corporate Events & how are they different from Corporate Actions in Select Corporate Action Combo Box? We may more broadly define corporate actions as the Investor related notices sent by the company to the stock exchange. They are such as Book Closure, Record Date, Board Meeting, AGM and EGM and so on and so forth We will see all by scrolling down in the Select Corporate Action combo box in the Icon Menu bar 1 Live Corporate Events are announcements, major accomplishments, corporate filings such as Company Results, Latest Announcements etc filed by the company to the stock exchange. Click on Live Corporate Events button if we're in Live CM news.
The layout is as same as Live CM News. We have two options to view online/offline. We can change the viewable area of top or bottom pane by pulling the horizontal pane divider The presentation is Live, latest Corporate announcements as clearly mentioned in the title of top captions pane. Live News button is to get back to Live News if we are in corporate announcements of a company. Shift our attention to Left hand side Tree View menu to see a list of companies. Click on the company of our interest. Look at the title. The title is Corporate Events >> Announcements >> Company Name Click on Prev, Next buttons to navigate around. Click on the headline to get to know more about the announcement. In order to check up the older announcements, use the "From Date" & “To Date” text boxes. They are Calendar controls. Move inside the text box and click to bring up the calendar control. There is a status bar text as & when the mouse is hovered over different parts of the calendar control. Click on question mark to view the help We may set Monday as starting day by a click on the day. We may drag and drop the calendar control to the other location so as to view the headlines. In order to reach quickly to a month or a year, click and hold on <, >, <<, and >> button. Move the cursor down to reach to the desired month or year, release mouse button. Month or Year is selected. Click on Go. Headlines for the selected period are listed. Choose and click to view the headline We may choose another company in the Tree View menu. In offline mode, we get to view the data till the moment capitaline was online The Corporate Action combo box in Icon Menu bar 1 is specific to the action chosen in it and present ALL the corresponding Companies when the First combo box reads Company Similarly we can view Corporate Action for CM Peer set, Company – listed & Country by changing the first & second combo boxes. Corporate Action for Industry, House Location, Peer Set and Stock Exchange is viewable from Tree view menu We can Apply Screener on Corporate Events
To Remember Corporate Action at a glance for all companies with a specific time range is possible Ex-Bonus, cum-Bonus, Forthcoming Bonus/Dividend/Stock split are available Mergers, acquisitions, Promoters‟ shares pledged/revoked are available Query on buy back, reduction of capital, delisting, demerger and rights renunciation etc is possible Go to Table of Contents

Corporate Action
We may more broadly define corporate actions as the Investor related notices sent by the company to the stock exchange. They are such as Book Closure, Record Date, Board Meeting, AGM, and EGM and so on and so forth. We see all corporate action items by scrolling down in the Select Corporate Action combo box in Icon menu bar 1
Book Closure Click on Select Corporate Action combo box. Click on „Book Closure‟. Book Closure window opens up with two date combo boxes and a Go button. The two Date combo boxes allow date setting. These are calendar controls.
Set the Date Click on the inverted arrow button of „From‟ combo box. Calendar Control opens up. Click on left arrow button to go back by a month. Click on right arrow button to go forward by a month. Else, click on the Month text. Move the cursor to the month of interest. Click on the month. Month is selected. Click on the Year number. Two buttons appear next to the Year number. Click once on these buttons to go back or forth by a year. Year is selected. Click on a day to set the day. From date is set and the calendar control exits. Click on the inverted arrow button of „To‟ combo box. Calendar Control opens up. Click on Today to set the system current date and the calendar control exits. Click on Go. We get to see Company, Dates – Source, From & To, Security Type & Purpose.
Dividend Click on Select Corporate Action combo box. Click on Dividend. Set the From & To dates & Go. We get to view the Dividend History.
Other Corporate Actions
ADR/ADS Amalgamation Buyback Change in Director/Year Conversion Cum-bonus dates Delisting Demerger ESOP Ex-bonus Ex-bonus dates Ex-dividend
Ex-rights FCCB Forthcoming bonus issues Forthcoming dividend providers Forthcoming stock split GDR/GDS General notice issued Limited review New Listings Open offer Postal ballot
Preferential Issues Promoters‟ shares pledged Promoters‟ shares redeemed Redemption Reduction of Capital Rights renunciation Rights/Bonus Shares sold/acquired Stock split Trading suspended/resumed
To Remember
Click on the inverted arrow button of „From‟ combo box. Calendar Control opens up. Click on left/right arrow button to go back/forward by a month. Else, click on the Month text. Move the cursor to the month of interest. Click on the month. Month is selected. Click on the Year number. Two buttons appear next to the Year number. Click once on these buttons to go back or forth by a year. Year is selected. Click on a day to set the day. From date is set and the calendar control exits. Click on the inverted arrow button of „To‟ combo box. Calendar Control opens up Click on Today to set the system current date and to exit the control. Go to Table of Contents
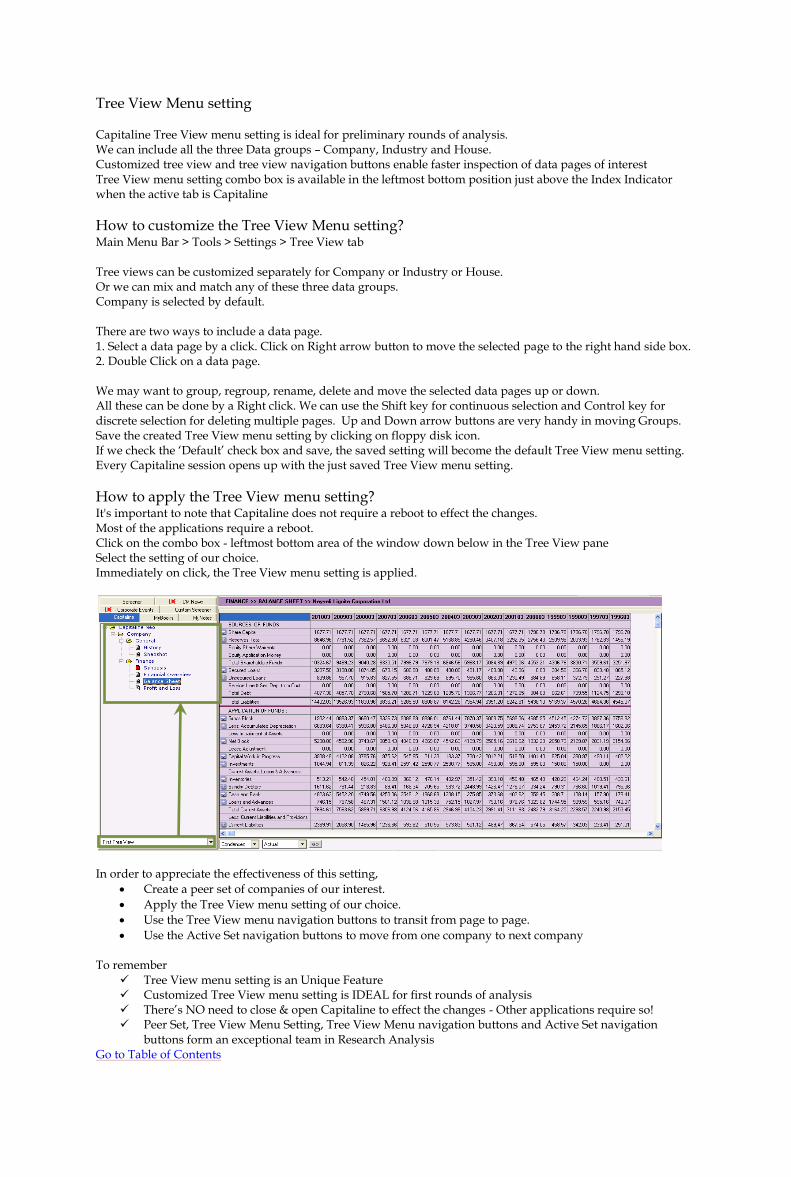
Tree View Menu setting Capitaline Tree View menu setting is ideal for preliminary rounds of analysis. We can include all the three Data groups – Company, Industry and House. Customized tree view and tree view navigation buttons enable faster inspection of data pages of interest Tree View menu setting combo box is available in the leftmost bottom position just above the Index Indicator when the active tab is Capitaline
How to customize the Tree View Menu setting? Main Menu Bar > Tools > Settings > Tree View tab Tree views can be customized separately for Company or Industry or House. Or we can mix and match any of these three data groups. Company is selected by default. There are two ways to include a data page. 1. Select a data page by a click. Click on Right arrow button to move the selected page to the right hand side box. 2. Double Click on a data page. We may want to group, regroup, rename, delete and move the selected data pages up or down. All these can be done by a Right click. We can use the Shift key for continuous selection and Control key for discrete selection for deleting multiple pages. Up and Down arrow buttons are very handy in moving Groups. Save the created Tree View menu setting by clicking on floppy disk icon. If we check the „Default‟ check box and save, the saved setting will become the default Tree View menu setting. Every Capitaline session opens up with the just saved Tree View menu setting.
How to apply the Tree View menu setting? It's important to note that Capitaline does not require a reboot to effect the changes. Most of the applications require a reboot. Click on the combo box - leftmost bottom area of the window down below in the Tree View pane Select the setting of our choice. Immediately on click, the Tree View menu setting is applied.
In order to appreciate the effectiveness of this setting,
Create a peer set of companies of our interest.
Apply the Tree View menu setting of our choice.
Use the Tree View menu navigation buttons to transit from page to page.
Use the Active Set navigation buttons to move from one company to next company To remember
Tree View menu setting is an Unique Feature Customized Tree View menu setting is IDEAL for first rounds of analysis There‟s NO need to close & open Capitaline to effect the changes - Other applications require so! Peer Set, Tree View Menu Setting, Tree View Menu navigation buttons and Active Set navigation
buttons form an exceptional team in Research Analysis Go to Table of Contents

Synopsis Synopsis is an excellent, effective efficient data presentation, all in one single data page Click on C button. Select a Company from the second combo box. Financial overview of the chosen company presents itself. Click on Synopsis of Finance folder of the Company group in the left hand side Tree View menu
Observe the Date of Report & the unit of the currency in right top of this data window A click on “View All Values in …” change to other unit - Crores/Million for the entire data window
Price movements Move to the Left Hand side of this data window to look at SENSEX, NIFTY Movements for the day Look at the chart below to find whether the chosen company has moved up or down vis-a-vis SENSEX/NIFTY Click on Volume check box to check on Volume, click on EPS check box to check on EPS Move below to meet Price Movements Date of the stock price reflects the date of updation done last from the user end Look at the day‟s High/low, Previous day‟s Close/open, Volume, Total traded value, High /Low for Weekly, Monthly & Quarterly and Market Cap. Full / Float Look at the quarterly Share Holding Patterns to reason out any transient differences in the price movements Make use of the check boxes to view the Graphical presentation in Pie or bar
Codes Company's codes for BSE, NSE, Reuters and Bloomberg are available in the row of the Name of the Company. Industry & NIC - National Industrial Classification Activity descriptions are available in the next row.
Quarterly performances Consecutive Quarterly performances for the last three quarters include Revenues, Net Profit, EPS, Cash EPS, OPM % & NPM %.
Unit Changer A click on the button “View in …” - Currency unit changer button will change the unit of the currency just for this table. A click on Currency unit changer button changes from the existing unit appearing below the button to the unit appearing in Currency unit changer button. Another Click on Currency unit changer button will get back to the earlier unit.
Quarterly Peer group comparison – Top 7 on Sales This Peer Group is Capitaline's Peer Group and not our peer set. Capitaline manages this Peer group The first section starts with price data such as LTP – Last traded price, % change and 52 Weeks High/Low for the latest quarter. The second section is separated by the period and includes Sales, PAT, Equity, OPM %, NPM %, EPS, CEPS and PE. Make use of Unit changer button “View in …” to view the unit of the currency of comfort Click on the Peer Group Comparison button to include/exclude any company from the Peer group comparison
Annual Peer group comparison - Top 7 on sales This section includes P/BV, P/CEPS and BV also
To Remember A click on Currency unit changer button will change the unit of the currency just for the particular table Quarterly & Annual Peer group comparison – Top 7 on Sales are Capitaline's Peer Groups and not user Peer sets The Synopsis page along with the graphs can be exported to a spread sheet by a click on Excel button Go to Table of Contents

My Notes Let‟s look at a familiar situation. When we are investigating a data page in Capitaline, something of significance appeals to us and we want to record them. We need the data page to stay there to serve as base for further analysis and research. Whenever we revisit the said data pages, such observations must remind us of their existence and possibly ignite us to further plans and these thoughts again and again must be stored. Yet again, we want to Control the Access rights of such records of thoughts. And we would like to search for similar situation of relevance, in future. Aren‟t they familiar? Of course, yes and here's where Capitaline MyNotes contributes significantly.
How do we create a My Note?
Click on the Add to MyNotes icon in the icon menu bar 2, that is third row from the top main menu bar OR Click on MyNotes tab of tab menu in the left hand side Tree View tab menu & click on New icon. Notes window pops up. Move the mouse inside the Subject text box & click once to start the entry of the Subject line. This subject line is pretty neat in managing the searches in future. So, therefore, capitaline recommends that we make it a habit of keeping short subject lines. The section between the two lines forms the body of My Notes. We may enter the text directly or copy & paste We may resize MyNotes Window by pulling it along the borders; the borders will also scroll, if the note is long. Mark this note „Important' by checking the Important Check box. By default this Note is specific to this screen, and its existence will be denoted by „View My Notes‟ icon in the icon menu bar 2. But if we are recording some random thoughts, we would rather check the „Random Note' radio button in which case, the note will NOT be linked to the underlying data page.
How do we Access the MyNotes created First method Click on MyNotes tab of tab menu in the left hand side Tree View menu & click on Load All notes. All MyNotes we have written so far, both specific to data pages and random are loaded. Use the sizer to view more or less of Notes columns. Click on the note, we want. The Note, if saved as „specific „, is loaded with the underlying data page. Second method Open the data page for which we had created a note. Locate the „View MyNotes' icon in the icon
menu bar 2. Click on the icon to get to see the notes. If we have multiple notes, specific to this data page, the list is displayed in My Notes. By default, the last entered My Note is open. Click on the previous Notes to read. Third method That is the Search method. Click on the Search icon that is the „Magnifier‟ in My Notes pane. We can search MyNotes by date, Subject, Content, and Module. Enter search criteria. Hit Search button.
MyNotes pane All Important notes are marked by Diamond images. Click on the date column. The row changes its color indicating the selection of the note. Click on Delete button and confirm. That Note will be deleted. Module is module from which the data page is accessed to which we have clipped a note. Caption is the subject. If we have opened many MyNotes, we can close them all by clicking on the Close All Notes button.
To Remember We can write multiple Notes specific to a data page. Use 'Random Notes' radio button to record stray pieces of thoughts. Make it a habit to include a caption/subject line to manage the search and organize notes. My Notes is user specific - Access rights are controlled. My Notes is a Great Research Tool! Go to Table of Contents

My Books We can organize all data pages, My Notes observed on the data pages, Screener Output and research findings
How do we add pages? Click on C button in Icon Bar Menu 1 that is second row from the top main menu bar. Choose a company from the second combo box in Icon Bar Menu 1. We get to view Financial Overview of the chosen company. Let‟s add this page to My Book. In order to watch the process of My Books, let‟s click on My Books tab of tab menu. Click on My Books in the Tree View Menu to select and stay at the top level. Let‟s add the pages one by one. Click on „Add to My Books‟ button in Icon Bar Menu 2 or „New Page‟ in My Books pane Add to My Books window pops up. Enter any note/remark/comment in the Note memo section. Supply the name of the data page. Default is the name of the data page itself Click on Save. Observe that the page just got added in the My Books tab pane.
Let‟s add Research Reports to My Books Click on Capitaline tab of tab menu. Click on minus button to fold „Finance‟ group Click on plus button to the left of Research Data group to unfold. Click on QrQ - Quick Review Quarterly Data page. Click on „Add to My Books‟ button in Icon Bar Menu 2. Add to My Books window pops up. Click on Save. Observe that the page just got added in the My Books tab pane. Let‟s collect some news, now. Click on plus button to the left of News Data Group to unfold. Click on News data Page Add the Data Page by a Click on Add to My Books button in Icon Bar Menu 2 and a click on „Save‟ Similarly we can add the Screener Output page also!
How do we organize the added pages? Click on „MyBooks‟ tab of the tab menu Click on „New Shelf Icon‟ button in My Books pane. Supply a name in the Shelf name text box in Add Shelf/Book window pop up. The shelf is created Click on New Book icon. Select the Shelf Name from Shelf Name Combo box. Supply name for the Book in Book Name text box. The Book is created. Click & drag the data pages to the book created Click & drag pages from a book to a different book Click & drag a book to a shelf A page cannot be dragged onto another page
A book cannot be dragged onto another book A shelf cannot be dragged onto another shelf The tail & color of the cursor are indicative of the drop zones
How do we Access the MyBooks created? Click on „MyBooks‟ tab of the tab menu. Click on plus button to unfold the Shelves & Books if required. Click on the page of our interest.
MyBooks pane Right click on a page, a book or a shelf to view the multiple tasks we may perform. Click on Delete & Search buttons to explore.
To Remember The Output pages in Screener can also be added to My Books My Notes is also included in the added pages in My Books. Multiple Books and Shelves can be created Added pages are frozen. All the data pages stored in MyBooks do not change even after data updation My Books are specific to the user. The administrator and the user who created My Books can only edit My Books My Books is a great option to organize our findings, research, analysis, intelligence so gathered. Go to Table of Contents

Annual Report Validation
Capitaline maps the normalized data presented in Balance Sheet and Profit & Loss to Annual Reports released.
By default, Annual report validation feature is enabled in General tab Setting window invoked by Settings submenu of Tools available in Main menu bar.
Click on C button. First combo box changes to Company. Second combo box changes to “Enter Company Name”. Choose a Company, say, Tata Motors. Financial Overview or the last selected page in the current session opens up
Click on Finance Folder to unfold if folded. Click on Balance Sheet if the active data page is not so. Balance Sheet for the chosen company opens up.
Appears a call out to the title of the data window displaying “Annual Report Data available for Tata Motors. Click on the data values of Latest Year End”. In the right top the data window, appears a Green button against which is the text “Annual Report Validation” If the color of the button is red, click on the button to change the color to green in order to enable Annual Report Validation. Note the green color of the Year End header cell(s). The green color of the Year End header cell(s) confirms the Annual Report Validation for the particular Year End(s).
Click on + sign against the condensed “Share Capital” data block to view the details. Click on “Equity Paid Up” data value of the latest Year End column. Annual Report Validation window pos up. Pop up window details the calculation of Unquoted Equity. All green colored data values are to be added and red colored data values are to be subtracted.
Click on “Copy” button to copy the entire contents of the Annual Report Validation window. The copied details can be pasted using “Control + V” in any other Research Reports created in any other applications such as Notepad, Word etc.
Click on “Excel” button to export the entire contents of the Annual Report Validation window to Excel.
Capitaline presents the most important tools to validate the data in the bottom most bar of the pop up window. They are Calculator and View the Annual Report.
Click on the Calculator button to check the sum arrived.
Click on the View the Annual Report button to read the complete Annual Report. Keep clicking on the data values. SUM reflects the total by adding or subtracting depending on the color of the selected data values
To Remember
All green colored data values are to be added and red colored data values are to be subtracted. Go to Table of Contents

Daily Moving Average Capitaline provides very important analytical tools such as (1) Simple Moving Average – SMA, (2) Exponential Moving Average – EMA for either BSE or NSE or both, (3) Support & Resistance levels and (4) Forward PE. They are available in CM Analytical Tools Folder of the Company Group. Daily Moving Average presents the calculated data values and chart for the selected periods in Excel Click on C button in Icon Menu bar 1. First combo box changes to Company. Choose a company from the second combo box drop down list after entering the starting characters of the company. In left hand side Tree View menu, click on CM Analytical Tools Folder to unfold if folded. Click on Daily Moving Average. Settings Dialogue window for the chosen company opens up in right hand side
Select Moving Average combo box provides 3 options – SMA, EMA and both. Click on the combo box to drop down the list to choose any of the three. Default is SMA. Select Exchange combo box provides 3 options – BSE, NSE and both. Click on the combo box to drop down the list to choose any of the three. Default is BSE. Select Columns define the columns for which the data are to be calculated in Moving Average worksheet of Excel Default column chosen is Close in Select Columns check boxes. Open, High & Low data can also be selected Select Date range allows setting of From and To dates. They are Calendar controls. Click on the down arrow button of the combo box to open up the calendar control. Click on left arrow button in calendar control to go back by a month. Click on right arrow button to go forward by a month. Else, click on the Month text. Move the cursor to the month of interest. Click on the month. Month is selected. Click on the Year number. Up & down buttons appear. Click once on these buttons to go back or forth by a year. Year is selected. Click on a day to set the day, set the date & exit the calendar control. Click on Today to set the system current date. Period in days for Moving Averages can be added by using the text box above the Add button. Move the mouse inside the text box. Cursor changes its‟ shape to vertical blinking bar. Click once to get to edit mode. Enter the period in days. Maximum of three digits is allowed. Click on Add button. Entered period in the text box above the Add button gets added in the Select periods List box. We can add any number of days as period for the Moving Average. Check the box against the period of choice to select individual periods or check Select All box. Depending on the choice in Select Moving Average combo box the List box/es of SMA or EMA or both in the Chart Options group display the selected periods. Make choice(s) for the CHART(S) to be viewed by checking against the period boxes. Click on Show button. The grayed box below the Select All check box displays the progress in the calculation of Moving Averages and preparation of the chart. Excel opens up with the two/four worksheets depending on the choice of an exchange or both the exchanges First two sheets present the data values as defined in Select Columns options group and the Chart of the Moving Average periods as defined in Chart Options group for the selected exchange(s) Chart can also be viewed by clicking on View chart link available in Moving Average worksheet(s)
To Remember There are two options group – one for selecting data columns that is Select columns options group and the next one for selecting chart options that is the Chart Options group Select Date range combo boxes are Calendar controls. Click on the down arrow of the combo box to open up the calendar control. Go to Table of Contents

Fact Sheets - Enrich the Research Process! ™ Capitaline demonstrates exceptional functionalities for quick examination at varied levels of data concentration by the concept of Fact Sheets. Fact Sheets present a concise manner of viewing aggregated data. A Fact sheet is a comprehensive presentation of some key parameters for the full Year, Latest Price, latest quarterly and Trailing Twelve Months. All these facts are aggregated to present an overall, bird's eye view in one wide screen for different groups. Primitive, plain raw data in Capitaline is specific, distinctive & precise to a company. That is, the primitive data is all alone & attached to the company & only to the company. In order to have a look at that company with respect to a different background setting, Capitaline has created groups of similar characteristics and treated each such group as an individual identity by attaching the sum total of all the constituent companies to the created group. Therefore, it‟s easy to look at a company viz-a-viz the created group. The created groups are Banker, Companies Listed, CM Peer Set, Common Peer Set, Country, F& O Companies, House, Index, Industry, Location, Peer Set and Stock exchange. Each such group includes various levels, typical of the group. Industry has 6 levels; Ownership House has 4, Location 3. Banker, Country, Index and Peer Set excluding Active Peer Set & Stock Exchange has only one level. For instance, the top level in 'Location' is the region - Northern, Western etc. The second level in 'Location' is the State, like Maharashtra, Gujarat etc. The third level is the district and the fourth level is the Company. Presentation of each Fact Sheet in a level unites the data in that level. From a Fact Sheet, we may pitch down to levels below & below to have views from varied intense levels. In all of these groups, company stays in the bottom most level. Finally, we reach the company‟s data at the last level. Such journey enables us to appreciate the company's standing viz-a-viz created groups.
Access : Click on Banker in the first combo box drop down list & Click on Fact Sheet - All bankers in the second
combo box drop down list. Fact Sheet – All Bankers opens up in wide screen. Click on a banker to move to view the customers of the banker that is the next level of companies. Click on a company to view the company‟s data. Now the first combo box reads Company & the second combo box reads the chosen company. Capitaline identifies such situation as Company level. From Company level, viewing Corresponding House & Industry‟s fact sheets are accomplished by clicking on House/Industry > General > Fact Sheet
What's this All Bankers Fact sheet all about?
As the title may suggest, it‟s not at all about all bankers but about the companies with whom the Bankers bank. This fact sheet gives several columns of information of the clients of each bank, including aggregate ratios. The column figures like Equity, Gross Block etc do not pertain to the bank per se, but are the aggregated figures of the corporate clients of the banks. ABN Amro Bank NV is a group containing all the companies ABN banks with. American Express Bank is a group containing all the companies Amex banks with. If there are multiple bankers for a company, the figures like Sales, Gross Block etc are added to each bank. What happens if the bankers‟ data are not available? Click on „NO Bankers Details in AR‟ in the Fact sheet itself. Columns can be sorted for Maximum & Minimum by double clicking on the empty cell of Sort row. Ensure that the vertical scroll bar is in the topmost position when reading the First/Last member after sorting. Certain very vital conclusions can be drawn from the fact sheet by a sort. Compare the Quarter with TTM in itself. Compare it with other bank's clients too! Check the aggregated Market share by a click on Market share in Data presentation Decider (DPD) combo box found in the leftmost bottom portion of the display just above the Index Indicator Apply Statistical functions by a click on the button between Training and Service Feedback & Transcripts buttons
To Remember Industry has 6 levels; Ownership Houses has 4, Location 3, Banker, Country, Index and Peer Set excluding Active Peer Set & Stock Exchange has only one. Presentation of each Fact Sheet in a level unites the data in that level. From Company level, viewing Corresponding House & Industry‟s fact sheets are done by a click on House/Industry > General > Fact Sheet Go to Table of Contents

Second combo box Click on the first combo box to select Country by a click on Country. Second combo box changes to Enter Country Name. Click on the second combo box to drop down the list of items. They are “Fact Sheet - All Countries” and “List - All Countries”. Select “Fact Sheet - All Countries”. A Fact Sheet for All Countries opens up
What is a Fact Sheet for All Countries?
This is a very comprehensive representation of aggregated, united data of important parameters like Equity, Gross Block, Net Profit & Sales etc of all the companies of all collaborating countries, be it technical and or equity participation. So, the Country fact sheet is not at all about all countries but about the companies having an equity and or technical collaboration with each country What is the case of a company having multiple collaborators from multiple countries? If a company has collaborators from different countries, the figures like Sales and Gross Block etc are added to each country Certain very valuable conclusions can be arrived at from these aggregate figures Double click on the empty cell of NOC - Number of Companies, to sort in ascending order Double click again on the empty cell of NOC to sort in descending order to find which country is having more collaboration This number can be correlated with the other determining parameters such as Sales and NP Double click on the empty cell of Sales to sort in descending order Check the Country by moving along the same row to the left Double click on the empty cell of NP to sort in descending order. Check the Country by moving along the same row to the left. Which country accounts for the maximum Sales and NP? Double click on Empty cell of Equity, Gross Block and Market capitalization to sort down to find the topper
List - All Countries Click on “List - All Countries” in the second combo box when the first combo box reads “Country” Second combo box changes to Select Country. Click on the second combo box to drop down the list of items List box includes “Fact Sheet - All Countries” and names of the collaborating countries Pick up a country of choice. “Country - Fact Sheet” of the choice opens up in one full wide screen Title of the data window includes the number of companies Scroll to the right to have a complete understanding of the data presented Look at the areas to watch where the options and features are dynamically loaded – Data Presentation Decider (DPD) combo boxes. Left most bottom area of the monitor has two combo boxes and one button They are Equity, Actual combo boxes and Go button Click on Actual combo box to drop down the list. The list has Actual and Market Share. By default, Country Fact sheet presentation is on Actual. Select Market Share and click on Go button. All parameters‟ data values are considers as 100 and accordingly the data of each company is arrived at Double click on the empty cell of Sales to sort in descending order. Check the topper of the list by moving along the same row to the left. Explore the Technical option available in the first DPD combo box.
To Remember Double click on the Empty cell to sort. NOT in the data cell Ensure that vertical scroll bar is in top most position of the scroll bar when deciding the first/last company Go to Table of Contents
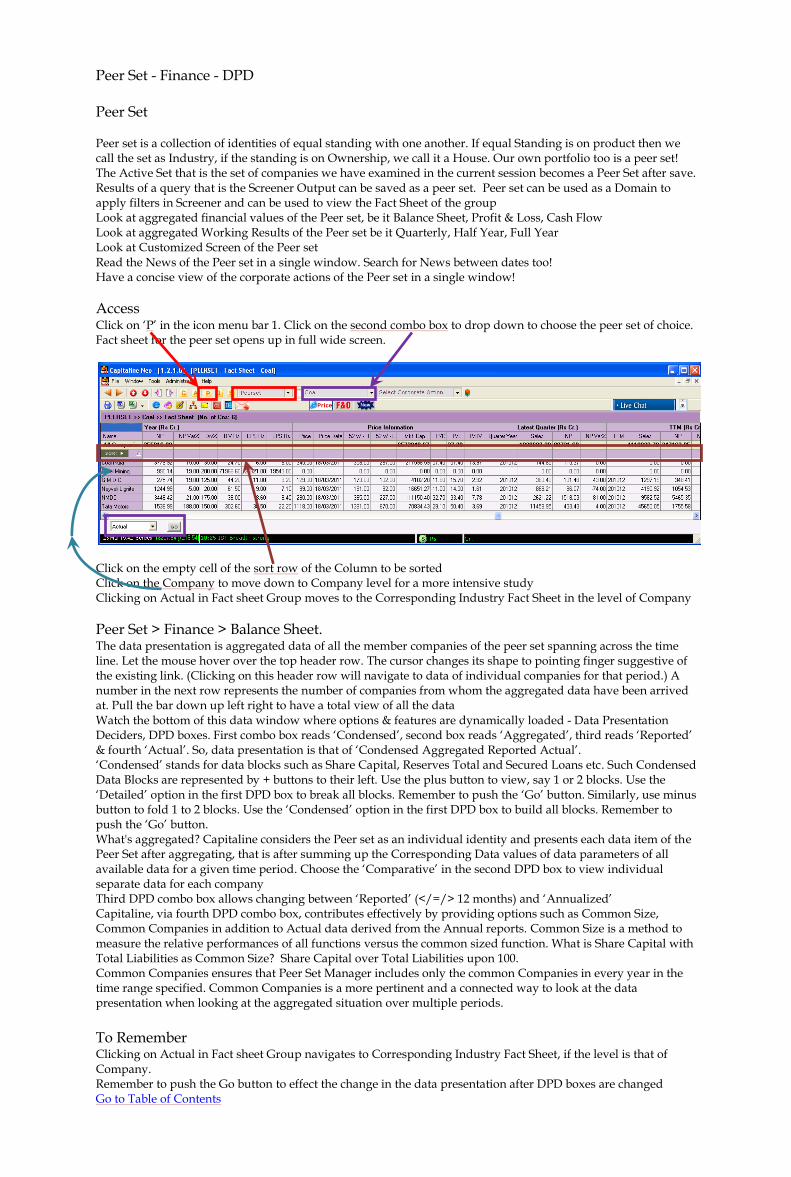
Peer Set - Finance - DPD Peer Set Peer set is a collection of identities of equal standing with one another. If equal Standing is on product then we call the set as Industry, if the standing is on Ownership, we call it a House. Our own portfolio too is a peer set! The Active Set that is the set of companies we have examined in the current session becomes a Peer Set after save. Results of a query that is the Screener Output can be saved as a peer set. Peer set can be used as a Domain to apply filters in Screener and can be used to view the Fact Sheet of the group Look at aggregated financial values of the Peer set, be it Balance Sheet, Profit & Loss, Cash Flow Look at aggregated Working Results of the Peer set be it Quarterly, Half Year, Full Year Look at Customized Screen of the Peer set Read the News of the Peer set in a single window. Search for News between dates too! Have a concise view of the corporate actions of the Peer set in a single window!
Access Click on „P‟ in the icon menu bar 1. Click on the second combo box to drop down to choose the peer set of choice. Fact sheet for the peer set opens up in full wide screen.
Click on the empty cell of the sort row of the Column to be sorted Click on the Company to move down to Company level for a more intensive study Clicking on Actual in Fact sheet Group moves to the Corresponding Industry Fact Sheet in the level of Company
Peer Set > Finance > Balance Sheet. The data presentation is aggregated data of all the member companies of the peer set spanning across the time line. Let the mouse hover over the top header row. The cursor changes its shape to pointing finger suggestive of the existing link. (Clicking on this header row will navigate to data of individual companies for that period.) A number in the next row represents the number of companies from whom the aggregated data have been arrived at. Pull the bar down up left right to have a total view of all the data Watch the bottom of this data window where options & features are dynamically loaded - Data Presentation Deciders, DPD boxes. First combo box reads „Condensed‟, second box reads „Aggregated‟, third reads „Reported‟ & fourth „Actual‟. So, data presentation is that of „Condensed Aggregated Reported Actual‟. „Condensed‟ stands for data blocks such as Share Capital, Reserves Total and Secured Loans etc. Such Condensed Data Blocks are represented by + buttons to their left. Use the plus button to view, say 1 or 2 blocks. Use the „Detailed‟ option in the first DPD box to break all blocks. Remember to push the „Go‟ button. Similarly, use minus button to fold 1 to 2 blocks. Use the „Condensed‟ option in the first DPD box to build all blocks. Remember to push the „Go‟ button. What's aggregated? Capitaline considers the Peer set as an individual identity and presents each data item of the Peer Set after aggregating, that is after summing up the Corresponding Data values of data parameters of all available data for a given time period. Choose the „Comparative‟ in the second DPD box to view individual separate data for each company Third DPD combo box allows changing between „Reported‟ (</=/> 12 months) and „Annualized‟ Capitaline, via fourth DPD combo box, contributes effectively by providing options such as Common Size, Common Companies in addition to Actual data derived from the Annual reports. Common Size is a method to measure the relative performances of all functions versus the common sized function. What is Share Capital with Total Liabilities as Common Size? Share Capital over Total Liabilities upon 100. Common Companies ensures that Peer Set Manager includes only the common Companies in every year in the time range specified. Common Companies is a more pertinent and a connected way to look at the data presentation when looking at the aggregated situation over multiple periods.
To Remember Clicking on Actual in Fact sheet Group navigates to Corresponding Industry Fact Sheet, if the level is that of Company. Remember to push the Go button to effect the change in the data presentation after DPD boxes are changed Go to Table of Contents

Peer Set - Finance - Balance Sheet – Common Size & Common Companies Peer Set > Finance > Balance Sheet We can have multiple combinations of the data presentation using Data Presentation Decider boxes Condensed Aggregated Reported Actual is the current data presentation Click on the fourth DPD to choose Common Size. Observe that Common Size Parameter options combo box is introduced. Click on this box to note that all the row headers of the balance sheet are data elements of the combo box. Click on Go. What we get to look at is the Condensed Aggregated Reported Common Sized on selected parameter's data Presentation. Choose a different Common size & Go to appreciate the Close Connectivity of all the functions of the companies of chosen peer set.
Click on Common Companies in the Common Size DPD box, i.e. the third box. Observe the introduction of two more boxes they are Year Boxes - Starting Year & End year boxes. Click on GO. What we get to look at is the Condensed Aggregated Reported Common Companies‟ Data Presentation of the chosen peer set for the given time range. Move up to the Top Header Row. Observe the No Of Companies is the same for all time period. So, this is the number of Common Companies from whom this particular data presentation is prepared. So, what are they? Let the mouse hover over the top header row, the Year Row. The cursor changes its shape to pointing finger suggestive of the existing link. Click on any year cell. Another Data Page opens up detailing the performances of the Common Companies. Look at the DPD boxes below. The first box has changed from „Aggregated‟ to „Comparative‟ as the data presentation is of individual companies, no longer aggregated! Make use of Common Size, year to have a comparative Common Size view. Switch between different levels & time periods to draw the Acer of the group.
Time Range Click on „Peer Set > Finance > Balance Sheet‟ in Tree View menu. We get to look at Condensed Aggregated Reported Actual. Change to Comparative from Aggregated in the second DPD box. Observe the introduction of three boxes after Actual box and before Go button. They are All, Year & Year Boxes. The „All‟ in the box permits existence of next two year boxes which allows defining the time range. If we want a particular specific time period, we will define it from this „All‟ combo box. Drop down the „All‟ combo box to view the list. Choose any other than „All‟, the next two year combo boxes exist no longer. Choose „ALL‟ and permit the existence of next two year boxes. Do not change any. Click on Go. What we get to look at is Condensed Comparative Reported Actual for the time range specified of chosen peer set. Pull the bar up down, left right to have a complete view of the data. Hide TV menu to have more view. The last two year combo boxes allow defining the year range. Supply a year's gap. Choose accordingly in the start year Combo box. Leave the end year combo box as such. Click on Go. Choose the least year available in Start year Range combo box & Go, in order to have a wider range. Choose a specific year or „Latest‟ in „All‟ combo box & Go to view the data of the peer set for a specific year Find the necessity for Annualizing? Pull up Annualized from the third DPD that is Reported DPD box
To Remember Both the Balance sheet and Profit & Loss presentations are mainly on levels of Aggregated or Comparative For Detailed, Capitaline does not provide the option of Common size or Common Companies For Condensed, there‟s the Option of Common size for both Aggregated & Comparative Aggregated offers Common Companies too. Comparative does not have the option of Common Companies And for each of Aggregated and Comparative, there are Reported & Annualized too. Go to Table of Contents

Active Set An Active Set is a collection of all companies that we've examined in the current session. We could have selected companies by any route - may be directly – that is by clicking on „C‟ button and entering Company name and or crossing various levels down from the fact sheet groups like Banker, CM Peer Set, Common Peer Set, House, Indices, Industry, Location, Peer Set and Stock Exchange
How to look at the Active Set?
Click on 'A' button in Icon menu bar 1. The first combo box reads 'Active Set' and the second combo box reads 'Select Company'. On clicking the second combo box, a list box of the names of the companies analyzed so far in the current session drops down. Alternately, Click on the first combo box to select Active Set.
Advantages Say, we have examined „n‟ number of companies in a particular session. We need to go back to any of them. We need to change to different data pages between the companies. Then, the Active Set comes handy. Navigation is cool & seamless with this Active Set and Navigation buttons – they are (1) Next Active Set & Previous Active Set, (2) Next & Previous Tree View menu and (3) Next & Previous Screens. And add these to our own customized Tree View menu setting, Research is simple - just a graceful click away „Previous‟ and „Next‟ in 'Previous Active Set‟ & 'Next Active Set' are relative to the current selection in the second combo box. 'Previous‟ and „Next‟ in 'Previous Tree Menu' and 'Next Tree Menu' are relative to the current selection in the Tree View menu. 'Previous‟ and „Next‟ in „Previous Screen‟ and „Next Screen‟ are relative to the current selected window in Windows in main menu bar. We may keep the data page constant and vary the company. Keep the Tree View menu item fixed and change the company by clicking on „Previous Active Set' and 'Next Active Set' buttons. We may keep the company fixed and vary the data pages. Keep the company of the Active set fixed and change by clicking on „Previous Tree Menu' and 'Next Tree Menu' buttons. We can finally save the Active Set as a Peer Set. Use this saved Peer set as a Domain to apply filters in Screener. Use this saved Peer set to View the Fact Sheet of the Peer set – to look at
aggregated values - Balance Sheet, Profit & Loss, Cash Flow
working results - Quarterly, Half Year, Full Year
customized Screens
News of the Peer set in a single window. Search for News between dates too!
Corporate actions of the Peer set in a single window.
How to save the active set as Peer Set? When we log off, we are prompted to save the active set. We may want the saved set to be available to us and or to all. So, accordingly, we may check the select boxes found against user name and or Common. Supply a name for the peer set and Save. Confirmation of save appears and the session closes. Alternately, if we are editing the already saved file, click on load button. Editing is appending the active set to the already saved set or overwriting the existing saved set with the current active set. Click on Enter Active Set Name Combo Box to pick up an item of our interest from the list. Click on Save. Overwrite/Append Confirmation pops up. Choose accordingly. We have appended or overwrote our current active Set successfully.
To Remember
Life of Active Set is specific to the current session. Save the current active set in order to save time from the build up from the scratch in future. After saving, the active set becomes a peer set. „Previous‟ and „Next‟ in 'Previous Active Set‟ & 'Next Active Set' are relative to the current selection in the second combo box. These „Previous‟ and „Next‟ navigate to different levels in any of the groups such as Industry, House and Location etc Go to Table of Contents

Custom Save Click on File in Main Menu Bar. Click on Save from the list box drop down. Custom Save window appears.
Observe that, TV menu in Custom Save window is a miniature replica of the Tree View menu of Capitaline. „Custom Save‟ is a three step process – Selection of (1) Data Pages, (2) Domain and (3) Format of the exported data.
(1) Selection of data pages There are two radio buttons „Company‟ & „Other‟. Default is Company. We find a combo box – „Company‟ in it, next to it is a small check box and next is a text box with "Enter Starting Characters" These three are much like the company combo box , small check box and Select Company combo box in Icon Menu Bar 1. When „Company‟ radio button is on, Tree View menu in the Custom Save window has „Company, „Industry‟ & House‟ data groups. If „Other‟ radio button is on, tree view menu in the Custom Save window reflects the selection of the first combo box. That is, if the first combo box reads „Industry‟ then Tree View menu in the Custom Save window has Industry. If first combo box reads „House‟ then Tree View menu has House. Keep the Company radio button on. Use the Sizer to have more viewable area of the Tree View menu in Custom Save. Click on the group of our choice to unfold the group. Click on the box „Finance‟. Check the box „company at a glance‟. Click on - sign to fold the group so that the other groups below can be viewed. Click on + to unfold other data groups and Check the box against the data pages of our interest. Choose Key Ratios from Industry and Fact Sheet from House.
(2) Selection of domain Domain selection process is same as in Screener. Company radio button allows selecting from any of these groups - Banker, CM Peer Set, Common Peer Set, Company, Company – Listed, Country, F&O Companies, House, Index, Industry, Location, Peer Set and Stock Exchange. „Other‟ radio button allows choosing from only three - Industry, House and Peer Set. Note that the search assistant, the small check box is available ONLY for Company Selection in First Combo box and not available for other options in the first combo box as well as in the second combo box. Click on „Banker‟ Click on the Second Combo box to select a banker. Left hand side receives all the companies banking with the selected banker in the second combo box. Double click on a single company of our interest in the left hand side box to send the same to right hand side box. Alternately, we can use, Right Single arrow to add selected companies, Right Double arrows to add ALL companies to the Right Hand Side box, Left Single arrow to remove selected companies and Left Double arrows to remove ALL companies from the Right Hand Side box.
(3) Selection of the Format
There are command buttons between the top big boxes and the bottom Reports box. Save button exports the chosen data pages for the selected domain to MS Excel either in one single work sheet or in Multiple Work Sheets. Click on „Single Work Sheet‟ to produce sub menu of „Domain‟ & „Module‟ - Module is the data group. Click on „Multiple Work Sheet‟ to produce sub menu of „Individual‟ - data page wise & „Company wise‟. The two sub menu options decide on the order of the appearance of the exported data. Clear clears the selection of domain in the right hand side box. Reports box displays the status of the progress of the export by listing the completed export. Pause button stops the export process temporarily. We may resume later. Cancel completely cancels the Export
To Remember When „Company‟ radio button is on, Tree View menu in the Custom Save window has „Company, „Industry‟ & House‟ data groups. „Other‟ radio button allows choosing from only three - Industry, House and Peer Set. If other radio button is on, tree view menu in the Custom Save window reflects the selection in the first combo box. That is, if the first combo box reads „Industry‟ then Tree View menu in the Custom Save window has Industry and so on and so forth. Search assistant, the small check box is available ONLY for Company Selection in First Combo box and not available for other options in the first combo box as well as the second combo box. Go to Table of Contents

Custom Screener Custom Screener is a prelude to Screener. Click on Custom Screener tab in the tab menu. Click on plus sign against Pick up your Stocks to unfold. Click on „Fundamental‟. Right Hand Side window presents Fundamental‟ Custom Screener. For Each query, we have Query Name - this is the Header and the Name of the Query, Description - this is the Header and to the right, we have the description itself. And last, the Execute button. Let us note that as & when the cursor moves closer to Execute, the cursor changes its shape to pointing finger suggestive of the link to the another action. Click on Execute to view the Large Cap stocks with turnaround. This result page has Query Name & Description. Results include Company Name, Sector, Quarter End - this is the latest Quarter, Quarter End 1 - this is the corresponding quarter of the last year, Reported Net Profit - This is Reported Net Profit for the latest Quarter and Reported Net Profit 1 - This is Reported Net Profit for the corresponding quarter of the last year.
Naming Conventions Suppose we are comparing a data parameter across different time periods - be it quarterly, half yearly, annually. For the latest time period, capitaline DOES NOT suffix any number to data parameter's name. So, in our current query result data page, Quarter End - this is the latest Quarter - is NOT suffixed with any number. Reported Net Profit - this is Reported Net Profit for the latest Quarter. So this too is NOT suffixed with any number. The last corresponding time period before the latest time period is suffixed with 1. Quarter End 1 - this is the corresponding quarter of the last year - is suffixed with 1. Similarly, Reported Net Profit 1 - This is Reported Net Profit for the corresponding quarter of the last year - is suffixed with 1. So, two time periods before, suffixed with 2 and 3 periods before suffixed with 3 & so on.
Custom Screener Results Click on Hide TV menu button to have a greater view of the results We have, after Reported Net Profit 1, Latest Price Date, Latest Market Cap, Latest EPS, Latest PE, Latest Equity, Face Value, Dividend Yield, Year End & Dividend percentage. Click once on Column Header to change the sort order of appearance Click once on Reported Net Profit to sort in the ascending order. Click on Show/Hide Columns Button. Show/Hide window pops up. Move the cursor close to the Title bar of this pop up. Cursor changes its shape to Mover. Catch hold of this mover by clicking & move the pop up to any other place of choice within this data window, by keeping the mouse button on hold. Release the mouse button after reaching to the desired location. The top right of pop up is red colored x, clicking on which closes the pop up. This pop up decides whether a column should be shown or hidden by a check against it. Click on Screener List Button. We are moved back to the landing page of Custom Screener. Let‟s note that current result page is no longer present and we need to push the execute button to get the results.
Custom Price Screener Click on Custom Screener tab in the tab menu. Click on plus sign against Pick up your Stocks to unfold. Click on „‟Price‟
To Remember For the latest time period, capitaline DOES NOT suffix any number to data parameter's name. The last corresponding time period before the latest time period is suffixed with 1. So, two time periods before, suffixed with 2 & 3 periods before suffixed with 3 & so on. Go to Table of Contents

Research Redefined™ Start the Research process from Capitaline's Exclusive research reports
AGM - not what is released from the company but complete analytics post press meet Equity Research - Have a glimpse at CM rating too! Quarterly Analysis - a candid evaluation of the performance Analyst Meet - Quick view of Conference Calls from the Top Management Face to face - Study the special interactions Hot Pursuits - Feel the heat Corporate News - Follow up with the interpretations Quick Review Quarterly - Check up the valuations All available at a Click!
Customized Screens Continue the Research with the Customized Data Presentations for continuous periods Du Pont Analysis Bank Credit Analysis I & II Company Analysis Company at a Special Glance Company at a Glance Consolidated Quarterly Excluding Other Income Delivery Details
Custom Queries Rich varieties of customized queries wait for a click to produce the list of companies/Sector with High dividend Yield but Low P/E ratio FII Holding Upward trend Key Market Indicators - Large/Middle/Small Forthcoming Quarterly Results Debt to Market Cap, Market Cap to Quoted Investments Turn around stocks - Large/Middle/Small Sector wise examination on Sales, Profit and Market Cap etc Top Companies on Sales, Profit etc Turn around Companies – Quarter on Quarter Positive/Negative Runners - Large/Middle/Small Price Returns, Daily Price Movement and 52 Week High/Low/Closing Compounded Annual Growth Rate (CAGR) queries for 3 years and 5 years for ALL companies for the following; Adjusted Net Profit, Exports, Imports, Net Sales, Operating Profit, PBIT, Reported Net Profit & Total Income etc Change to any Domain, Index Simple Growth for three years on depreciation - Year on Year Companies that achieved 25% growth on PAT for the last 5 years consistently
To Remember Research Reports are very unique to Capitaline– unbiased, candid and honest reports. Go to Table of Contents
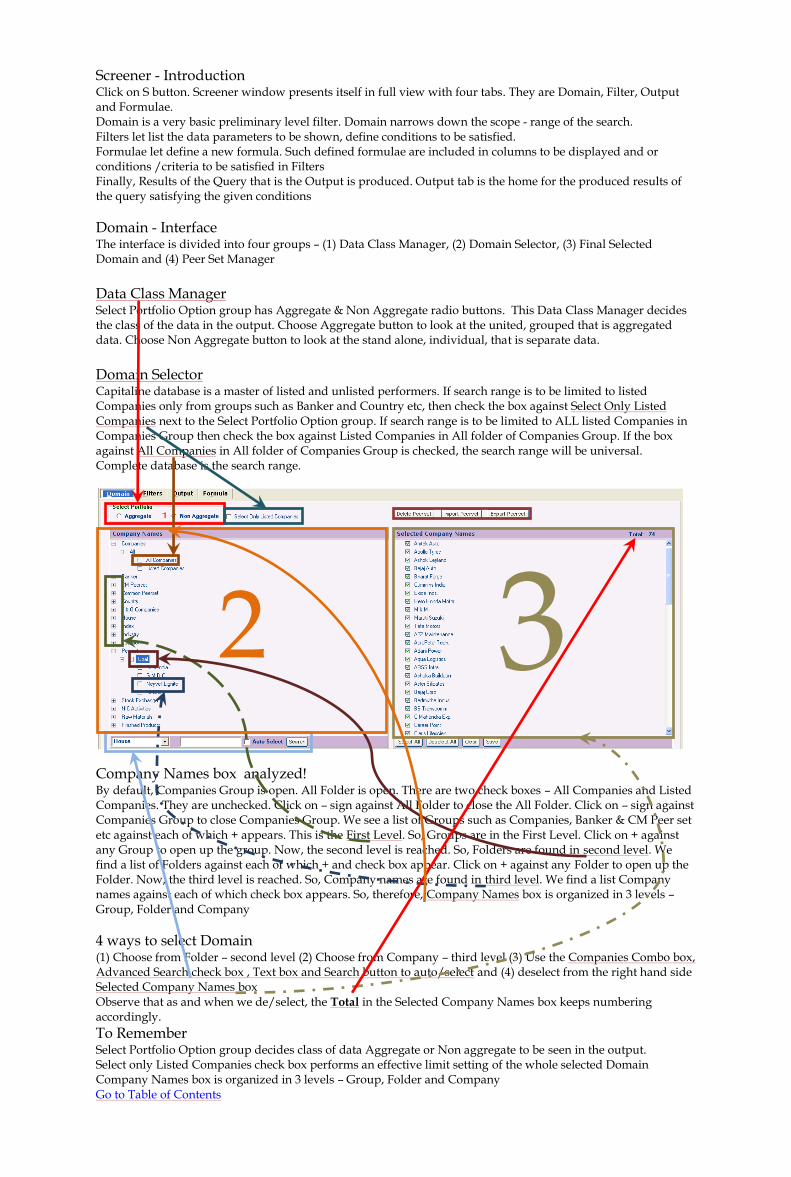
Screener - Introduction Click on S button. Screener window presents itself in full view with four tabs. They are Domain, Filter, Output and Formulae. Domain is a very basic preliminary level filter. Domain narrows down the scope - range of the search. Filters let list the data parameters to be shown, define conditions to be satisfied. Formulae let define a new formula. Such defined formulae are included in columns to be displayed and or conditions /criteria to be satisfied in Filters Finally, Results of the Query that is the Output is produced. Output tab is the home for the produced results of the query satisfying the given conditions
Domain - Interface The interface is divided into four groups – (1) Data Class Manager, (2) Domain Selector, (3) Final Selected Domain and (4) Peer Set Manager
Data Class Manager Select Portfolio Option group has Aggregate & Non Aggregate radio buttons. This Data Class Manager decides the class of the data in the output. Choose Aggregate button to look at the united, grouped that is aggregated data. Choose Non Aggregate button to look at the stand alone, individual, that is separate data.
Domain Selector Capitaline database is a master of listed and unlisted performers. If search range is to be limited to listed Companies only from groups such as Banker and Country etc, then check the box against Select Only Listed Companies next to the Select Portfolio Option group. If search range is to be limited to ALL listed Companies in Companies Group then check the box against Listed Companies in All folder of Companies Group. If the box against All Companies in All folder of Companies Group is checked, the search range will be universal. Complete database is the search range.
Company Names box analyzed! By default, Companies Group is open. All Folder is open. There are two check boxes – All Companies and Listed Companies. They are unchecked. Click on – sign against All Folder to close the All Folder. Click on – sign against Companies Group to close Companies Group. We see a list of Groups such as Companies, Banker & CM Peer set etc against each of which + appears. This is the First Level. So, Groups are in the First Level. Click on + against any Group to open up the group. Now, the second level is reached. So, Folders are found in second level. We find a list of Folders against each of which + and check box appear. Click on + against any Folder to open up the Folder. Now, the third level is reached. So, Company names are found in third level. We find a list Company names against each of which check box appears. So, therefore, Company Names box is organized in 3 levels – Group, Folder and Company
4 ways to select Domain (1) Choose from Folder – second level (2) Choose from Company – third level (3) Use the Companies Combo box, Advanced Search check box , Text box and Search button to auto/select and (4) deselect from the right hand side Selected Company Names box Observe that as and when we de/select, the Total in the Selected Company Names box keeps numbering accordingly.
To Remember Select Portfolio Option group decides class of data Aggregate or Non aggregate to be seen in the output. Select only Listed Companies check box performs an effective limit setting of the whole selected Domain Company Names box is organized in 3 levels – Group, Folder and Company Go to Table of Contents
1
3
2

Peer Set Manager
Peer set manager includes the buttons
Clear and Save found below
Delete Peer set, Import Peer set and Export Peer set found above the right hand side Selected Company Names box in Domain tab of Screener window Click on button S. Screener window opens up. Domain is the selected tab by default Select, deselect and reselect from the Folder and Company levels in the Company Names and Selected Company Names boxes. Clear button clears the selected Domain. Save button saves the selected Domain as Peer set Click on + against Peer set Group in the left hand side Company Names box in Domain tab of Screener window Saved Peer sets are available in the third level. Click on the check box against the saved Peer set The companies in the peer set get reflected in the right hand side Selected Company Names box We may add companies to this set; We may remove companies from this set; We may supply a different name to this set; Finally, save the selected Domain as a different Peer set.
How to attach the mobility to the Peer sets? Hit Export Peer set button found above the Selected Company Names box. Export Peer Set window pops up Choose any number of Peer sets to save. If more than one Peer set is selected for export, Save As window appears as many number of times for the supply of the name of the files to be exported. The exported files are saved in the chosen folder of the selected drive. The name of the extension of the saved file is cps. We may carry these file anywhere, attach it to the email, store it as draft and pull the draft wherever we are.
Import Peer set Click on Clear button to clear the Domain to include only the companies in the exported Peer set. Hit import Peer set button found above the Selected Company Names box Import Peer Set window pops up Select the file to be imported All the companies in the selected file are included in the Selected Company Names box We may add companies to this set; We may remove companies from this set; We may supply a different name to this set; Finally, save the selected Domain as a different Peer set.
To Remember Domain Selection is an Important process and limit the search range as minimum as possible to improve the efficiency of Screener Search Engine Make the BEST use of selection/deselection/reselection in the Left hand side Company name box itself. Here the selection range is smaller and it is much easier to select, deselect & reselect here than in Selected Company Names Box Save the set always and supply names suggestive of the members. Include the date of creation of the peer set at the end in dd mm yyyy. Create a back up directory for exported peer sets. Go to Table of Contents

Screener - Filters We have applied first level filters in the Domain selection process. Filters allows some specific situations. Click on Filters Tab in the screener window. Filters tab opens up. Filters is a two step process – (1) Identifying, Locating & Listing data parameters - Fields and or Formulae and (2) Applying conditions
Filters - Interface Interface is divided into five boxes – (1) Tables, (2) Fields, (3) Preview, (4) Select Screener and (5) Criteria Values Tables box is the home for all the tables. Tables box allows choosing a table one at a time. By design, it follows a similar working style of Domain. Selecting a table in the Left hand side Tables box pushes the member fields of the selected table in Fields box. Tables box is organized in three levels – Group, Folder and Table. The group without any sign to its left is of the level of the table. Double click on such a table forces all fields to the right hand side Fields box. The box named Preview – Non Aggregate is the home for list of data parameters and conditions. Preview – Non Aggregate will change to Preview – Aggregate if the choice in Select Portfolio Option group in Domain is Aggregate and vice versa
How does the Preview box receive data parameters? Preview box receives the data parameters from three channels. First Channel is from the Tables box to Fields box to Preview box if the parameters are fields. Second Channel is the Select Screener Combo boxes. This channel allows loading and editing the already saved screeners. This channel brings fields and or formulae data parameters available in the loaded screener. Third Channel is the preview box itself by introducing our own custom column specific to a particular screener. Such custom column expression may not be required in any other screener and therefore may not be saved as a formulae
Fields box Fields box has Condensed, Detailed, Add and Select As Individual/Group buttons, Search text box and Search / Next Match button. Detailed button breaks up the condensed blocks that is unfolds all the Folders. Condensed button unites the broken/detailed blocks that is folds all the Folders. Select As Individual/Group button toggles the selection mode between Group and Individual. Plus - Add button pushes the selected fields down to Preview box. Double click on the name of a selected field also adds. Supply the search string in the text box next to the Add button that is plus sign. Hit the magnifier button or Enter key. Every hit produces the match till „No Further Match Found‟ appears
Preview box
Click on Clear button to clean up the preview box. Clear button cleans up both the top Field and Bottom Preview boxes. Refresh cleans up both the Domain and the Preview box. Columns are named A, B, C starting from the second column to the right. Move the mouse closer to Header Cell, control tip flashes the name of the cell Click and hold on the Header cell of the column to be moved. The Column divider to the left of the column selected gets highlighted. Drag the column by holding the mouse button to the column of our choice. Destination column divider gets highlighted. Drop the column by releasing the mouse button. Move the Mouse closer to the divider between the columns in the top row that is the header row. The cursor changes its shape to sizer. Click, hold, drag and drop to view the entire contents of header cell. Do so in all header cells to view the contents fully
To Remember Every push of Plus button in Fields box adds the selected fields once in the Preview box Columns can be rearranged by drag and drop Header cell in Preview box describes the address of the table of the field selected. Header cell can be correlated with the Tables box Go to Table of Contents
1
2
3
4
5

Screener – Filters – Preview More Header cell describes the address of the table of the field selected. There are two/three sections separated by hyphen. Format of the header cell is “Group/-Folder – Table” Display Name holds the display name of the selected field or formula. This cell allows editing Table Name is the name of the table that Capitaline database uses to identify. This cell is not editable. Capitaline recommends and advises strongly that this cells is not disturbed Display check box allows inclusion/exclusion of the data parameter to appear in the result that is the output Order enables no/sorting Year Or Base Date Or Range plays an important role in defining time periods in the case of financial fields. In the case of non financial fields, this cell assumes the role of a quiet spectator. Proximity or Custom Column Expression enables defining Proximity or Custom Column Expression. This is a combination of the selected fields in the Preview box separated by the arithmetic operators. These expressions are specific to this screener and not elsewhere. Such expressions may be defined for data presentation and or to satisfy conditions. Or there may be a situation wherein we, ourselves, will input the data values. To introduce a Custom column, right click anywhere in the header cell of the column to open shortcut menu to choose Add Custom Column.
Criteria Criteria allows defining conditions. Click on the Criteria cell of the Column to which criteria is to be applied Observe that unnamed list box or text boxes in Criteria Values options group which is immediately below the Select Screener combo boxes in the top right portion of the window has its name as the selected Display Name as in the selected column of the Preview box. Click on Show Criteria Value. Search engine starts collecting all the data values of the Selected field for the selected domain and lists all the values in the list box or text boxes in Criteria Values options group. Domain Range determines the length of time taken to list the data values of the list box or text boxes. Longer the range of the Domain, longer the time. Moving the cursor to any other column clears the list box or text boxes. Criteria values can also be searched by using the Search text box available if the selected column‟s data type is of text. Double Click on the data value of choice in the list box to force the same to the Criteria cell. Criteria can also be entered directly. If the selected column‟s data type is of a number, use the Display Criteria Values check box to apply Criteria such as “Between … And … “ (Min. and Max. values)
Wild cards Wild cards underscore (_) and percent (%) may be used in the search string. Each _ stands for a character and its position is fixed. Each % represents any number of characters and its position is as placed in the search string Use of wild card characters _ and % demands the inclusion of operator „Like‟ before the space before the single open quote before the search string. Format of the Criteria string is [=][Like] '[search text][_][%]search text’ All that are enclosed in square brackets are optional. More conditions can be included in the same column and or different columns following the same procedure. And the multiple conditions are separated by logical operators AND, OR and NOT
Where to place the first Criteria? Screener Search Engine looks for the first Criteria in the cell in the Criteria row. If the First Criteria is not in the Criteria Row and elsewhere down, Screener Search Engine treats the situation as No Criteria. Hence no conditions are applied. And we will get the result without any Criteria applied.
To Remember Custom Column Expression can be built with the available fields in the preview box only. Any number of underscores and percent signs can be used anywhere in the search string If data values to be searched are known then supply the data values enclosed by the single Open and Close quotes. It is not required to place “Equal to” or “Like” that is No operator demands search for the exact match Like without any wild cards demands the search for the exact match. Like with wild cards demands the search for values containing the search string with other characters represented by wild cards Go to Table of Contents

Preview Some More To delete a column, move the mouse to the header Cell of the column to be deleted. Right Click, keeping the mouse in the Header Cell. Choose Delete Column.
Save for use & reuse Be sure to save the current Screener if we want to load it later Click on Save button. Save Screener pops up. Select Mode controls the access rights of the screener to be saved – available to all across or only to the user Click on Select Folder Combo box to choose an available Folder OR Create a New Folder by clicking on Create New Folder button and supplying a name for the New Folder Click on Load button to overwrite/edit the already saved screener. Keep the same name or change after loading Write or copy and paste a brief about the Screener in Screener Description box to facilitate quick and easy understanding o9f the Screener in future Supply a name for the Screener in the Enter Screener Name text Box Push the Save Button down below Screener will be saved in the selected Folder as in Select Folder Screener will be available to the selected Group as in Select Mode
How to access the saved Screener? Saved Screener can be accessed from Select Screener combo box in the top right of the Filters window Click on Select Screener combo box to choose the available group – User or Common Screener All the saved Screeners are arranged under the available Folders in the second combo box below Choose the saved Screener by a single click Confirm to Apply Screener window pop up The saved screener is loaded Saved Screener can also be accessed from the Tree View menu Unhide the Tree View menu if hidden by clicking on Show/Hide Tree View menu button Click on Screener tab in the Tab menu in left hand side Tree View pane Resize the Tree View pane to view the contents of the Screener, Templates and Formulae Click on Data Screener Group to open up the Group Click on Screener Folder to unfold Click on View All Screener Right hand side window presents a table of all saved screeners grouped under CM Screener, User Screener and Common Screener. Click on Open to open the Screener with/without Output in New/Existing tab
How to create a new folder in Tree View pane? Click on Screener tab in the Tab menu in left hand side Tree View pane Resize the Tree View pane to view the contents of the Screener, Templates and Formulae Tree View pane is Grouped under Data & News Screeners Data Screener Group has three Folders - Screener, Templates and Formulae Right click anywhere in the Tree View pane. A short cut menu appears showing Folder Options and Refresh Click on Folder options to produce the Folder Manger pop up Folder Manger pop up allows a Folder to be Added/Renamed/Removed Folders are classified under three folders - they are Screener, Templates & Formulae - same as the root folder of the Tree View pane. Again they are reclassified by User and Common. Choose the Folder, Enter Folder Name & OK. Folder is saved
To Remember Apply Screener pop up window allows some clean up of the old unused screeners by delete radio button Currency and its respective unit can be changed by a click on Currency button. Changes are applied in Output Go to Table of Contents
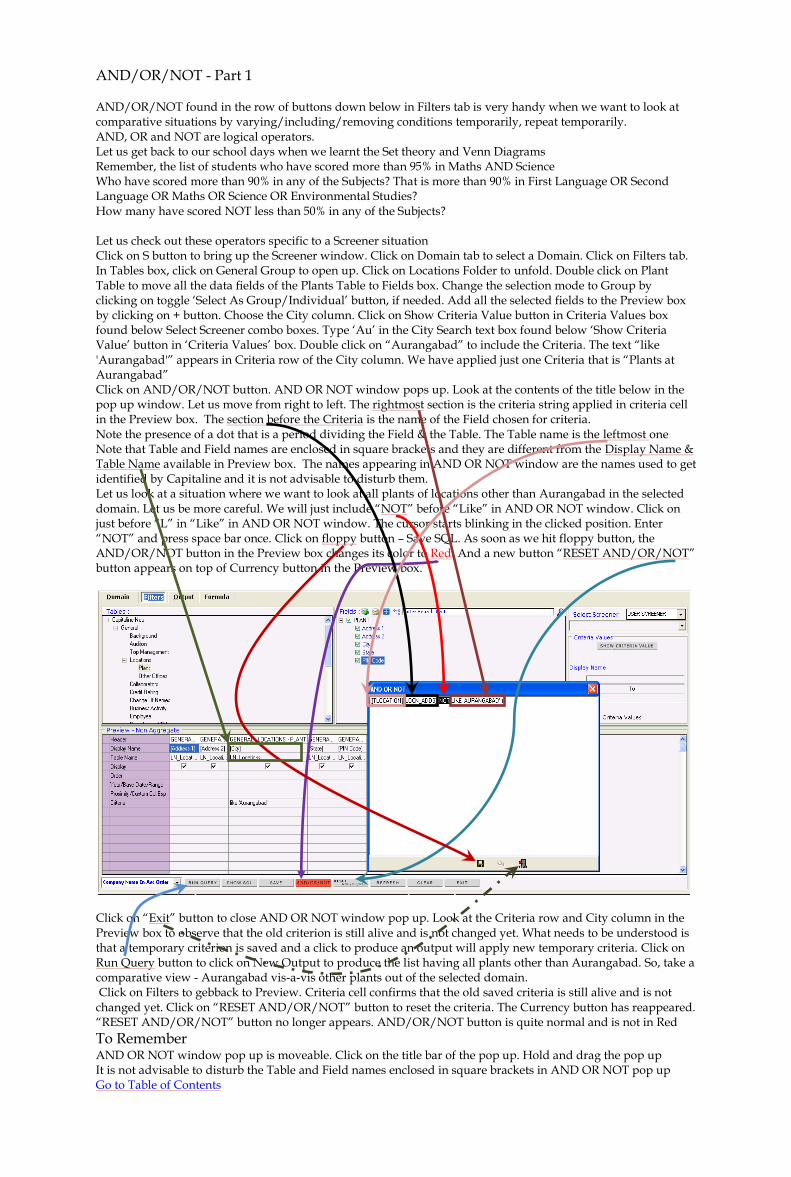
AND/OR/NOT - Part 1 AND/OR/NOT found in the row of buttons down below in Filters tab is very handy when we want to look at comparative situations by varying/including/removing conditions temporarily, repeat temporarily. AND, OR and NOT are logical operators. Let us get back to our school days when we learnt the Set theory and Venn Diagrams Remember, the list of students who have scored more than 95% in Maths AND Science Who have scored more than 90% in any of the Subjects? That is more than 90% in First Language OR Second Language OR Maths OR Science OR Environmental Studies? How many have scored NOT less than 50% in any of the Subjects? Let us check out these operators specific to a Screener situation Click on S button to bring up the Screener window. Click on Domain tab to select a Domain. Click on Filters tab. In Tables box, click on General Group to open up. Click on Locations Folder to unfold. Double click on Plant Table to move all the data fields of the Plants Table to Fields box. Change the selection mode to Group by clicking on toggle „Select As Group/Individual‟ button, if needed. Add all the selected fields to the Preview box by clicking on + button. Choose the City column. Click on Show Criteria Value button in Criteria Values box found below Select Screener combo boxes. Type „Au‟ in the City Search text box found below „Show Criteria Value‟ button in „Criteria Values‟ box. Double click on “Aurangabad” to include the Criteria. The text “like 'Aurangabad'” appears in Criteria row of the City column. We have applied just one Criteria that is “Plants at Aurangabad” Click on AND/OR/NOT button. AND OR NOT window pops up. Look at the contents of the title below in the pop up window. Let us move from right to left. The rightmost section is the criteria string applied in criteria cell in the Preview box. The section before the Criteria is the name of the Field chosen for criteria. Note the presence of a dot that is a period dividing the Field & the Table. The Table name is the leftmost one Note that Table and Field names are enclosed in square brackets and they are different from the Display Name & Table Name available in Preview box. The names appearing in AND OR NOT window are the names used to get identified by Capitaline and it is not advisable to disturb them. Let us look at a situation where we want to look at all plants of locations other than Aurangabad in the selected domain. Let us be more careful. We will just include “NOT” before “Like” in AND OR NOT window. Click on just before “L” in “Like” in AND OR NOT window. The cursor starts blinking in the clicked position. Enter “NOT” and press space bar once. Click on floppy button – Save SQL. As soon as we hit floppy button, the AND/OR/NOT button in the Preview box changes its color to Red. And a new button “RESET AND/OR/NOT” button appears on top of Currency button in the Preview box.
Click on “Exit” button to close AND OR NOT window pop up. Look at the Criteria row and City column in the Preview box to observe that the old criterion is still alive and is not changed yet. What needs to be understood is that a temporary criterion is saved and a click to produce an output will apply new temporary criteria. Click on Run Query button to click on New Output to produce the list having all plants other than Aurangabad. So, take a comparative view - Aurangabad vis-a-vis other plants out of the selected domain. Click on Filters to gebback to Preview. Criteria cell confirms that the old saved criteria is still alive and is not changed yet. Click on “RESET AND/OR/NOT” button to reset the criteria. The Currency button has reappeared. “RESET AND/OR/NOT” button no longer appears. AND/OR/NOT button is quite normal and is not in Red
To Remember AND OR NOT window pop up is moveable. Click on the title bar of the pop up. Hold and drag the pop up It is not advisable to disturb the Table and Field names enclosed in square brackets in AND OR NOT pop up Go to Table of Contents

AND/OR/NOT - Part 2 Let us check out AND/OR/NOT operators specific to a Screener situation Click on S button to bring up the Screener window. Click on Domain tab to select a Domain. Click on Filters tab. In Tables box, click on General Group to open up. Click on Locations Folder to unfold. Double click on Plant Table to move all the data fields of the Plants Table to Fields box. Change the selection mode to Group by clicking on toggle Select As Group/Individual button. Add all the selected fields to the Preview box by clicking on + button. Choose the City column. Click on Show Criteria Value button in Criteria Values box found below Select Screener combo boxes. Type “Au” in the City Search text box found below Show Criteria Value button in Criteria Values box. Double click on “Aurangabad” to include the Criteria. The text “like 'Aurangabad'” appears in Criteria row of the City column. We have applied just one Criteria that is “Plants at Aurangabad”. Let us say, we want to look at plants at Chennai also. Click AND/OR/NOT button. AND OR NOT window pops up. Select the entire criteria text
1. clicking once in the beginning of the criteria text that is clicking just before “L” in “Like” 2. hold the mouse button 3. move the mouse to the end of the criteria text that is just after the single quote ‟
The criteria text is selected. Press Control and C keys together to copy the entire text. Click on the end of the text that is just after the single quote ‟. Press the Space bar once. Type “OR”. Press the Space bar once. Press Control & V together. Now the copied text is pasted. Replace the text “Aurangabad” with “Chennai”. Be careful. Do not remove any single quote and or any brackets. Do not change the table and or field name. Click on Save Button.
Click on Exit button to close AND OR NOT pop up. Now click on Run Query button to click on New Output. Output lists the all plants at Aurangabad and Chennai. Click on Filters tab Let us check out plants at locations whose names have “ur” in it and, And, AND - here's where AND operator plays a role - the plants may be in Tamil Nadu or Rajasthan or Maharashtra For a little while, we will stay away from this AND/OR/NOT button Go to Criteria cell of City column. Clear the criteria. Enter the new Criteria – that is type “like” single quote % “ur” % single quote Click on the Criteria cell of the State column. Click on Show Criteria Value button Locate Tamil Nadu and double click on it to force the criteria to appear in Criteria cell of the State Column Locate Rajasthan and double click on it to force the criteria to appear in Criteria cell of the State Column Locate Maharashtra and double click on it to force the criteria to appear in Criteria cell of the State Column Now, click on Run Query button to click on New Output. Output lists the all plants at locations whose names have “ur” in it. Click on the header cell of the City column to sort to confirm the names containing ”ur” in their names and, And, AND all the plants are either in Tamil Nadu or Rajasthan or Maharashtra. Click on the header cell of the State column to sort to confirm Tamil Nadu, Rajasthan, and Maharashtra
To Remember Introduce temporary criteria, compare the different situations, draw intelligence and make effective investment decisions. Create as many outputs. Export to different formats such as Word, Excel & PDF Go to Table of Contents

Screener - Formulae - Part 1 Click on S button to get to the Screener Click on Formula tab of the Screener window Alternately, click on Tree View menu to show the Tree View menu, if hidden. Size the Tree View menu pane to view more if required Click on Screener tab of the tab menu. Click on Screeners, Templates And Formula Group to unfold Click on Data Screener to unfold. Click on Formulae to unfold Formulae are available in three different Folders such as CM, User and Common Capitaline is shipped with variety of formulae and are stored in different groups such as General, 9 Months, Finance, Results and TTM. These formulae are powerful and excellent indicators of an identity's movement User defined formulae are available in User and or Common Folders depending on the folders in which they were created and so access rights of the formulae are defined accordingly In the Tree View menu, click on any of the major groups or sub groups to click on the formula Screener window opens up with Formula tab open and the Formula is loaded
How to access the saved formulae? So, these are the two ways of opening up the Formula tab of the Screener window – (1) by clicking on S button and clicking on Formulae tab and (2) In the Tree View menu, click on Screener tab of the tab menu, click on Screeners, Templates And Formula Group to unfold, Click on Data Screener to unfold, Click on Formulae to unfold and Click on any of the major groups or sub groups to click on the formula. Screener window opens up with Formula tab open and the selected Formula is loaded Formula combo box is the home for all the three CM, User and Common Groups. Select CM Formula. The combo box below is now home for all CM formulae. Click on the second box to scroll down. Like in Tree View menu, CM formulae are grouped in 9 Months, Finance, Results and TTM sub groups Under each group runs a list of CM formulae Click on “Adj Net Profit Q4 on Q8 Growth” from the “Results” group in the second combo box. The selected Formula‟s name appears in text box portion of the second combo box. Description box reads “Growth for Q on Q [Q4 Upon Q8]”. This box allows editing
How to define a new Formula? Tables box is organized in three levels – Group/-Folder-Table. Level of the Table is confirmed by no sign against it. Double click on such a Table forces its members to the Fields box. Choose a field in the Fields box by a Double click. The field appears below in the Formula Definition box. First portion before the separator that is the dot, the section of the text in square bracket represents the table name. Second portion after the separator that is the dot, the section of the text in square bracket represents the field name. Say, we need to introduce an arithmetic operator. Ensure that cursor is where the arithmetic operator must appear in the Definition box. Click on the operator and the operator appears in the definition box. Should there be any mistakes, correct by Del, Backspace, Ctrl +C, Ctrl + X and Ctrl + V etc. Introduce multiple fields and operators as required. Save the defined formula by a click on Save button. Choose the appropriate mode or both the modes to allow access. Select the folder to save. Check the currency applicable box if currency is applicable in the defined formula - currency is not applicable in the case of Percentages and Rates of Movement etc and in non financial parameters such as address, production, fuel consumption and production capacity and etc. If the Formula returns a numeric value and its measure is currency, then check the currency applicable box
To Remember Ensure that cursor is next to the selected field in the Definition box - the arithmetic Operator pressed appears in the position of the cursor. Ensure a space between an operator and a field The parentheses ( ) can be used to the change the order of calculation/precedence Formula can be defined within a formula Go to Table of Contents
1 2
4
3
5
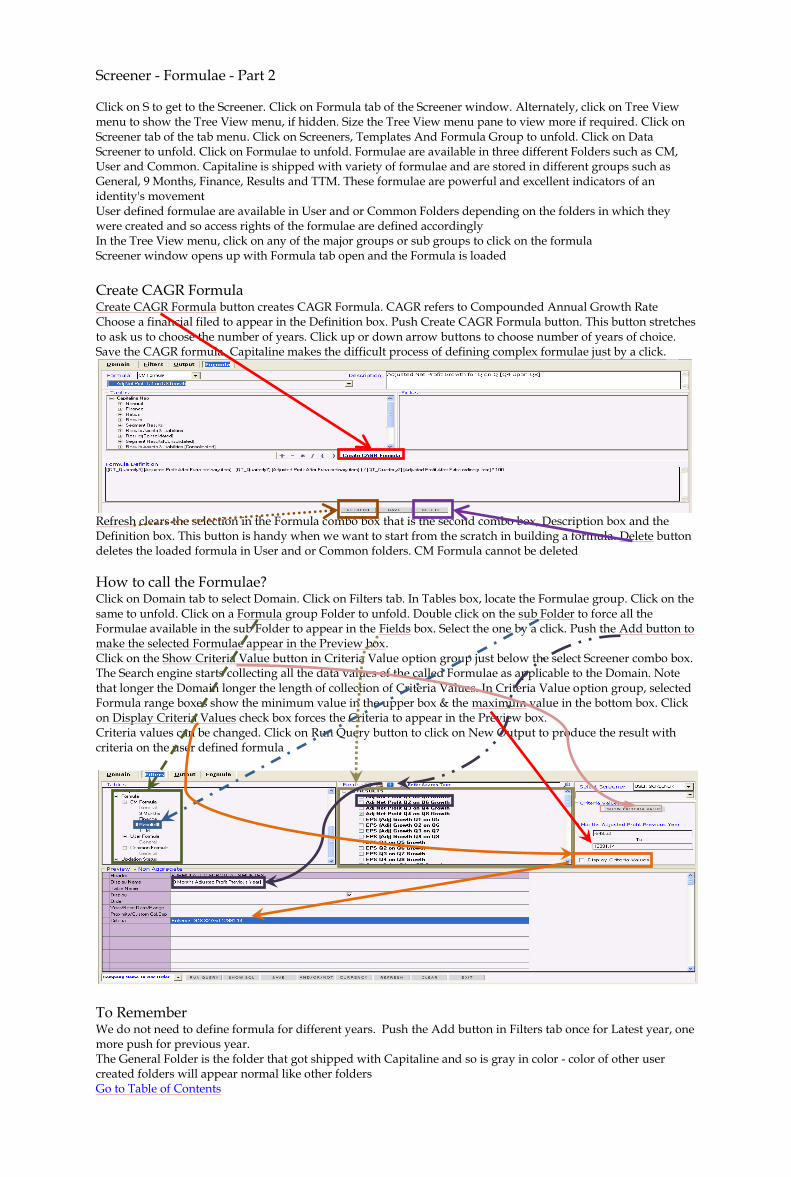
Screener - Formulae - Part 2 Click on S to get to the Screener. Click on Formula tab of the Screener window. Alternately, click on Tree View menu to show the Tree View menu, if hidden. Size the Tree View menu pane to view more if required. Click on Screener tab of the tab menu. Click on Screeners, Templates And Formula Group to unfold. Click on Data Screener to unfold. Click on Formulae to unfold. Formulae are available in three different Folders such as CM, User and Common. Capitaline is shipped with variety of formulae and are stored in different groups such as General, 9 Months, Finance, Results and TTM. These formulae are powerful and excellent indicators of an identity's movement User defined formulae are available in User and or Common Folders depending on the folders in which they were created and so access rights of the formulae are defined accordingly In the Tree View menu, click on any of the major groups or sub groups to click on the formula Screener window opens up with Formula tab open and the Formula is loaded
Create CAGR Formula Create CAGR Formula button creates CAGR Formula. CAGR refers to Compounded Annual Growth Rate Choose a financial filed to appear in the Definition box. Push Create CAGR Formula button. This button stretches to ask us to choose the number of years. Click up or down arrow buttons to choose number of years of choice. Save the CAGR formula. Capitaline makes the difficult process of defining complex formulae just by a click.
Refresh clears the selection in the Formula combo box that is the second combo box, Description box and the Definition box. This button is handy when we want to start from the scratch in building a formula. Delete button deletes the loaded formula in User and or Common folders. CM Formula cannot be deleted
How to call the Formulae? Click on Domain tab to select Domain. Click on Filters tab. In Tables box, locate the Formulae group. Click on the same to unfold. Click on a Formula group Folder to unfold. Double click on the sub Folder to force all the Formulae available in the sub Folder to appear in the Fields box. Select the one by a click. Push the Add button to make the selected Formulae appear in the Preview box. Click on the Show Criteria Value button in Criteria Value option group just below the select Screener combo box. The Search engine starts collecting all the data values of the called Formulae as applicable to the Domain. Note that longer the Domain longer the length of collection of Criteria Values. In Criteria Value option group, selected Formula range boxes show the minimum value in the upper box & the maximum value in the bottom box. Click on Display Criteria Values check box forces the Criteria to appear in the Preview box. Criteria values can be changed. Click on Run Query button to click on New Output to produce the result with criteria on the user defined formula
To Remember We do not need to define formula for different years. Push the Add button in Filters tab once for Latest year, one more push for previous year. The General Folder is the folder that got shipped with Capitaline and so is gray in color - color of other user created folders will appear normal like other folders Go to Table of Contents

Output Select Domain. Add Fields and or Formulae and or Custom Column expressions and or apply criteria in Filters Click on Run Query button to produce the sub menu of New Output, Active Output and Output in Excel New Output produces the results of the Screener in a new output tab Active Output produces the results of the Screener in the existing output tab itself, meaning existing output becomes the domain for the Screener. Active Output produces the results much faster Output in Excel produces the results of the Screener in Excel itself Click on New Output Sheet. Results are produced in the Output tab. As we have run the query only once to produce a result, the Output tab has only one tab having the only one result. Observe that this output tab is the active tab as indicated by dotted lines around the Caption of the output tab. Click on Run Query button to Click on New Output Sheet to produce more results in more tabs. Format of the Caption of the output tab is – Number Default Currency – Currency‟s Default Unit The number is a running number of the output tab. If statistical functions were applied by a click on Statistics on Output, caption of the tab would start with “Stat_” and the number would be the same as the number of the output on which Statistical functions were applied Output has included (1) Serial number (2) Company Code and (3) Company Name. These Columns were not included in the Preview box in Filters. So, by Default, Capitaline Screener Search Engine, includes them in the Output and saves us from the bother of including these two in each and every screener Session Move the mouse closer to the header cell divider, cursor's shape is changed to Sizer Click, Hold and Drag to fit the contents of the cell OR Double click on the header cell divider to auto fit the contents of the cell OR Auto Size the Grid in the Short cut menu by a right click Double click on Cell header to sort the order of appearance. Move along right to observe the introduction of Statistics button. Feel free to push the button to explore
Screener Results Summary (SRS) The bottom most bar of the output that is Screener Results Summary (SRS) bar has four sections
1. Records in output is as indicated by the running serial number in the first column of the output 2. Selected Companies = Domain population. Click on the number to have all the records in the Domain
that is the Entire result without any Criteria. Caption of the tab starts with “S_” – S for Selected and the number is same as the number of the output on which was clicked to Get the Entire Result.
3. Matched Companies = the number of Unique Companies satisfying the criteria. If a company has more than one record satisfying the conditions, the Records in output will always be more than the Matched Companies.
4. Unmatched Companies = Selected Companies minus Matched Companies. Click on the number to Get the List of Unmatched Companies that is the Companies not satisfying the Criteria. List of Unmatched Companies window pops up. Click on Run Query button to get the listed data parameters of all Unmatched Companies. Caption of the tab starts with “U_” – U for Unmatched and the number is same as the number of the output on which was clicked to Get the Unmatched Result.
To Remember Output adds (1) Serial number (2) Company Code and (3) Company Name columns by default Active Output produces the results much faster Go to Table of Contents
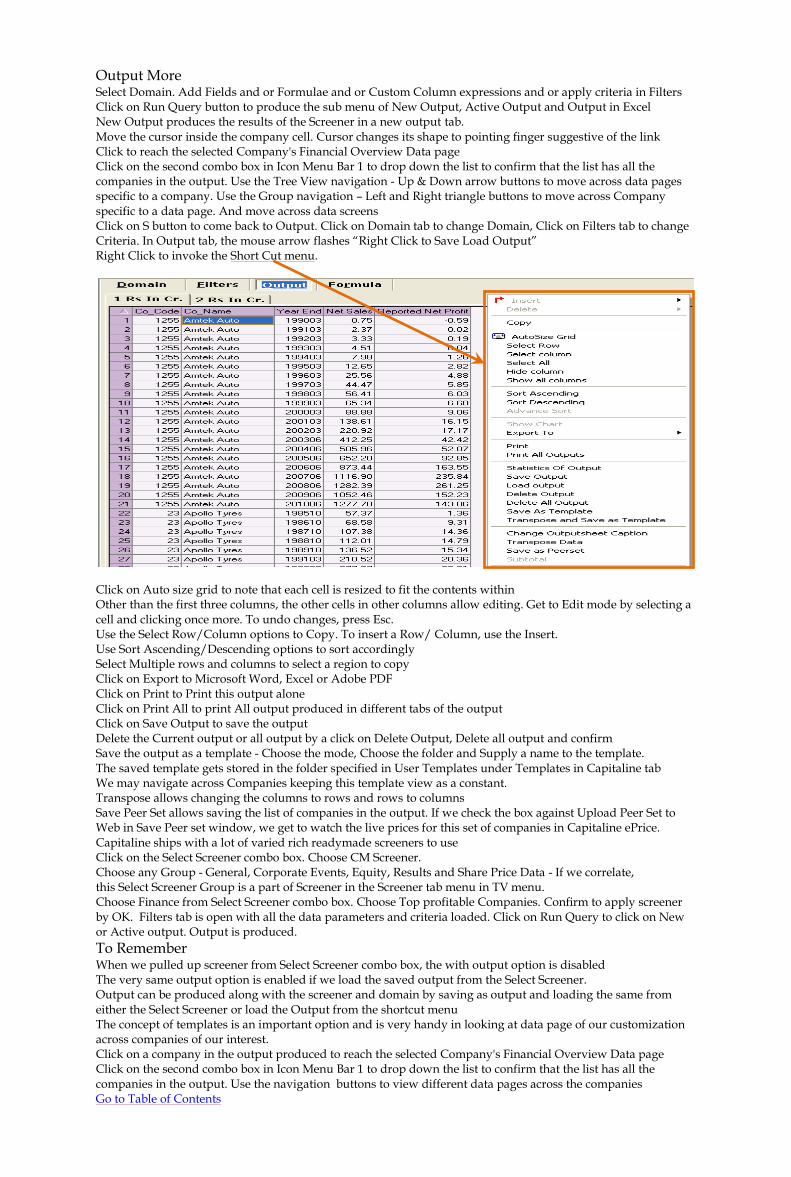
Output More Select Domain. Add Fields and or Formulae and or Custom Column expressions and or apply criteria in Filters Click on Run Query button to produce the sub menu of New Output, Active Output and Output in Excel New Output produces the results of the Screener in a new output tab. Move the cursor inside the company cell. Cursor changes its shape to pointing finger suggestive of the link Click to reach the selected Company's Financial Overview Data page Click on the second combo box in Icon Menu Bar 1 to drop down the list to confirm that the list has all the companies in the output. Use the Tree View navigation - Up & Down arrow buttons to move across data pages specific to a company. Use the Group navigation – Left and Right triangle buttons to move across Company specific to a data page. And move across data screens Click on S button to come back to Output. Click on Domain tab to change Domain, Click on Filters tab to change Criteria. In Output tab, the mouse arrow flashes “Right Click to Save Load Output” Right Click to invoke the Short Cut menu.
Click on Auto size grid to note that each cell is resized to fit the contents within Other than the first three columns, the other cells in other columns allow editing. Get to Edit mode by selecting a cell and clicking once more. To undo changes, press Esc. Use the Select Row/Column options to Copy. To insert a Row/ Column, use the Insert. Use Sort Ascending/Descending options to sort accordingly Select Multiple rows and columns to select a region to copy Click on Export to Microsoft Word, Excel or Adobe PDF Click on Print to Print this output alone Click on Print All to print All output produced in different tabs of the output Click on Save Output to save the output Delete the Current output or all output by a click on Delete Output, Delete all output and confirm Save the output as a template - Choose the mode, Choose the folder and Supply a name to the template. The saved template gets stored in the folder specified in User Templates under Templates in Capitaline tab We may navigate across Companies keeping this template view as a constant. Transpose allows changing the columns to rows and rows to columns Save Peer Set allows saving the list of companies in the output. If we check the box against Upload Peer Set to Web in Save Peer set window, we get to watch the live prices for this set of companies in Capitaline ePrice. Capitaline ships with a lot of varied rich readymade screeners to use Click on the Select Screener combo box. Choose CM Screener. Choose any Group - General, Corporate Events, Equity, Results and Share Price Data - If we correlate, this Select Screener Group is a part of Screener in the Screener tab menu in TV menu. Choose Finance from Select Screener combo box. Choose Top profitable Companies. Confirm to apply screener by OK. Filters tab is open with all the data parameters and criteria loaded. Click on Run Query to click on New or Active output. Output is produced.
To Remember When we pulled up screener from Select Screener combo box, the with output option is disabled The very same output option is enabled if we load the saved output from the Select Screener. Output can be produced along with the screener and domain by saving as output and loading the same from either the Select Screener or load the Output from the shortcut menu The concept of templates is an important option and is very handy in looking at data page of our customization across companies of our interest. Click on a company in the output produced to reach the selected Company's Financial Overview Data page Click on the second combo box in Icon Menu Bar 1 to drop down the list to confirm that the list has all the companies in the output. Use the navigation buttons to view different data pages across the companies Go to Table of Contents

Screener - Output – Statistical functions
What are the Statistical functions? They are Sum, Average, Minimum, Maximum and Count of the given range of data values. They are very useful in analyzing a Company/House/Industry‟s performance on a sustainable growth basis Statistical function button is available in (1) Output and (2) Fact Sheets Click on S button to open up the Screener window Choose Non Aggregate in Select Portfolio option group Click on + against Index in Company Names box to unfold. Click on the check box against BSE Auto. All companies included in the index appear in right hand side Selected Company Names box. The check boxes against each of them are checked. Total in the title bar of this box reads the number of companies. Click on Filters tab In Tables box, Double click on Manufacturing Table of Profit & Loss Folder of Finance Group. All the data fields and blocks appear in the Fields box. Select Year End, Net Sales and Reported Net Profit Click on ADD button to push these three to Preview box Select the Year or Base Date or Range row of Year End Column cell. Click once to select. Click once more to change to combo box. Click once more to drop down the list. Pull the bar to move up to locate “None”. Click to select “None”. Observe that across three columns, the Year or Base Date or Range row is set to “None”. By the selection of “None”, meaning NO PARTICULAR YEAR, meaning ANY & ALL, Capitaline selects all the available years‟ data. Click on Run Query button to click on New Output. Observe the output sheet more closely. Output has all the Companies selected in the Domain and includes all available years‟ data. A company has “ x” number of years‟ data, another has “y” number of years‟ data and another has just “z” no of years‟ data and so on and so forth. Let us apply statistical functions here. That is for a given company, given the span of time period that is 10, or 20 or 30 or any length of time period, we want to look at Maximum, Minimum, Average, the no of the time periods considered, that is Count and Sum. Statistical functions are applied on the active output tab only. Click on Statistics of Output button. Statistics window appears.
Choose Company in “Group By” options group. Select Net Sales and Net Profit in “Fields” options group Click on “Select All” or select the individual functions of interest in “Statistical Functions” option group Click on Statistics of Output button to apply Statistical functions on the current output tab Observe that for each data field selected in Preview window, all the Selected Statistical functions – they are Sum, Average, Minimum, Maximum and Count are applied and a new output tab with caption starting as “Stat_”. The number in the caption of the stat output tab is the same number of the output tab on which the stat functions were applied. Click on the output tab, making that tab as the active current tab. Click on Statistical Functions button. Choose House and uncheck company in “Group By” options group in Statistic s window. Leave the other option groups as such. Click on Output. Statistical functions on corresponding Houses are produced in the Output. Click on Filters. Set Year or Base Date or Range to a particular Year. Produce Output. Apply Stat for Industry
To Remember When the Year or Base Date or Range is set to “None”, Capitaline selects all the available years‟ data. Statistical functions are applied on the active output tab Go to Table of Contents
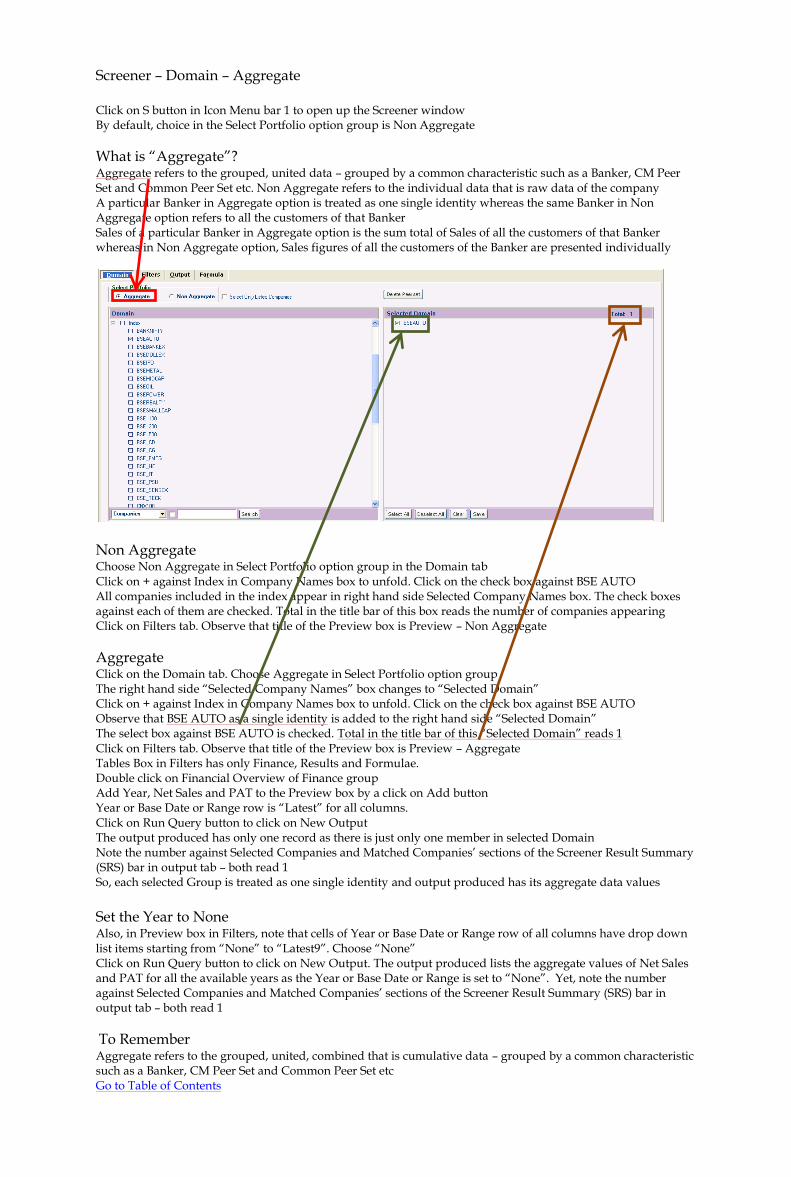
Screener – Domain – Aggregate Click on S button in Icon Menu bar 1 to open up the Screener window By default, choice in the Select Portfolio option group is Non Aggregate
What is “Aggregate”? Aggregate refers to the grouped, united data – grouped by a common characteristic such as a Banker, CM Peer Set and Common Peer Set etc. Non Aggregate refers to the individual data that is raw data of the company A particular Banker in Aggregate option is treated as one single identity whereas the same Banker in Non Aggregate option refers to all the customers of that Banker Sales of a particular Banker in Aggregate option is the sum total of Sales of all the customers of that Banker whereas in Non Aggregate option, Sales figures of all the customers of the Banker are presented individually
Non Aggregate Choose Non Aggregate in Select Portfolio option group in the Domain tab Click on + against Index in Company Names box to unfold. Click on the check box against BSE AUTO All companies included in the index appear in right hand side Selected Company Names box. The check boxes against each of them are checked. Total in the title bar of this box reads the number of companies appearing Click on Filters tab. Observe that title of the Preview box is Preview – Non Aggregate
Aggregate Click on the Domain tab. Choose Aggregate in Select Portfolio option group The right hand side “Selected Company Names” box changes to “Selected Domain” Click on + against Index in Company Names box to unfold. Click on the check box against BSE AUTO Observe that BSE AUTO as a single identity is added to the right hand side “Selected Domain” The select box against BSE AUTO is checked. Total in the title bar of this “Selected Domain” reads 1 Click on Filters tab. Observe that title of the Preview box is Preview – Aggregate Tables Box in Filters has only Finance, Results and Formulae. Double click on Financial Overview of Finance group Add Year, Net Sales and PAT to the Preview box by a click on Add button Year or Base Date or Range row is “Latest” for all columns. Click on Run Query button to click on New Output The output produced has only one record as there is just only one member in selected Domain Note the number against Selected Companies and Matched Companies‟ sections of the Screener Result Summary (SRS) bar in output tab – both read 1 So, each selected Group is treated as one single identity and output produced has its aggregate data values
Set the Year to None Also, in Preview box in Filters, note that cells of Year or Base Date or Range row of all columns have drop down list items starting from “None” to “Latest9”. Choose “None” Click on Run Query button to click on New Output. The output produced lists the aggregate values of Net Sales and PAT for all the available years as the Year or Base Date or Range is set to “None”. Yet, note the number against Selected Companies and Matched Companies‟ sections of the Screener Result Summary (SRS) bar in output tab – both read 1
To Remember Aggregate refers to the grouped, united, combined that is cumulative data – grouped by a common characteristic such as a Banker, CM Peer Set and Common Peer Set etc Go to Table of Contents
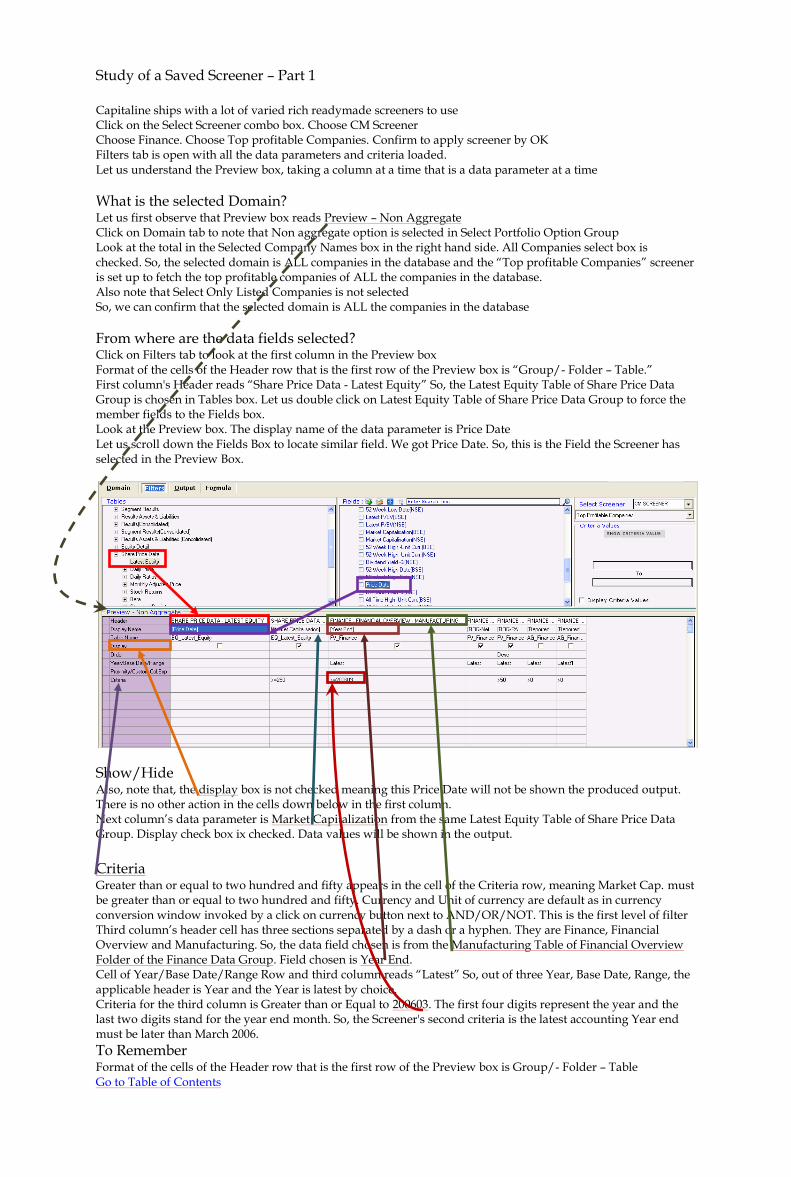
Study of a Saved Screener – Part 1 Capitaline ships with a lot of varied rich readymade screeners to use Click on the Select Screener combo box. Choose CM Screener Choose Finance. Choose Top profitable Companies. Confirm to apply screener by OK Filters tab is open with all the data parameters and criteria loaded. Let us understand the Preview box, taking a column at a time that is a data parameter at a time
What is the selected Domain? Let us first observe that Preview box reads Preview – Non Aggregate Click on Domain tab to note that Non aggregate option is selected in Select Portfolio Option Group Look at the total in the Selected Company Names box in the right hand side. All Companies select box is checked. So, the selected domain is ALL companies in the database and the “Top profitable Companies” screener is set up to fetch the top profitable companies of ALL the companies in the database. Also note that Select Only Listed Companies is not selected So, we can confirm that the selected domain is ALL the companies in the database
From where are the data fields selected? Click on Filters tab to look at the first column in the Preview box Format of the cells of the Header row that is the first row of the Preview box is “Group/- Folder – Table.” First column's Header reads “Share Price Data - Latest Equity” So, the Latest Equity Table of Share Price Data Group is chosen in Tables box. Let us double click on Latest Equity Table of Share Price Data Group to force the member fields to the Fields box. Look at the Preview box. The display name of the data parameter is Price Date Let us scroll down the Fields Box to locate similar field. We got Price Date. So, this is the Field the Screener has selected in the Preview Box.
Show/Hide Also, note that, the display box is not checked meaning this Price Date will not be shown the produced output. There is no other action in the cells down below in the first column. Next column‟s data parameter is Market Capitalization from the same Latest Equity Table of Share Price Data Group. Display check box ix checked. Data values will be shown in the output.
Criteria Greater than or equal to two hundred and fifty appears in the cell of the Criteria row, meaning Market Cap. must be greater than or equal to two hundred and fifty. Currency and Unit of currency are default as in currency conversion window invoked by a click on currency button next to AND/OR/NOT. This is the first level of filter Third column‟s header cell has three sections separated by a dash or a hyphen. They are Finance, Financial Overview and Manufacturing. So, the data field chosen is from the Manufacturing Table of Financial Overview Folder of the Finance Data Group. Field chosen is Year End. Cell of Year/Base Date/Range Row and third column reads “Latest” So, out of three Year, Base Date, Range, the applicable header is Year and the Year is latest by choice. Criteria for the third column is Greater than or Equal to 200603. The first four digits represent the year and the last two digits stand for the year end month. So, the Screener's second criteria is the latest accounting Year end must be later than March 2006.
To Remember
Format of the cells of the Header row that is the first row of the Preview box is Group/- Folder – Table Go to Table of Contents

Study of a Saved Screener – Part 2
Fourth column‟s header cell has three sections separated by a dash or a hyphen. They are Finance, Financial Overview and Manufacturing. So, the data field chosen is from the Manufacturing Table of Financial Overview Folder of the Finance Data Group. Field chosen is ROG-Net Sales (%) Cell of Year/Base Date/Range Row and fourth column reads “Latest” So, out of three Year, Base Date, Range, the applicable header is Year and the Year is latest by choice that is whatever is available in the database There is NO criteria for the fourth column
Set up, so far! “Top Profitable Companies” Screener has set up the search engine to
1. search the entire database by selecting ALL companies in the database - this includes the unlisted companies too as the Screener has not checked the Select only Listed Companies check box
2. From the above list, it is further narrowed down to a list with Market Capitalization greater than or equal to 250
3. From the above, it is further reduced to list of companies for which the data is available as on March 2006 or later
Next column‟s data field is ROG - PAT% from the Manufacturing Table of Financial Overview Folder of the Finance Data Group. Order is Descending. Year is Latest whatever is available in the database. Criteria is that ROG - PAT% must be greater than 50 Next column‟s data field is Reported Net Profit from the General Table of Profit & Loss Folder of the Finance Data Group. Year is Latest whatever is available in the database. Criteria is that Reported Net Profit must be greater than ZERO. That is loss making companies are not considered. That counts four as far as the criteria are concerned. Last column‟s data field is Reported Net Profit from the General Table of Profit & Loss Folder of the Finance Data Group - same table of the same folder of the same data group - field is same as that of previous column Table Name & Year cells have 1 as suffix. This 1 represents just 1 year from the latest. So the last column carries Reported Net Profit for the year before the Latest year Criteria is that Reported Net Profit for the year before the Latest year must be greater than ZERO. That is loss making companies are not considered. That counts five as far as the criteria are concerned.
Recap “Top Profitable Companies” Screener has set up the search engine to
1. search the entire database by selecting ALL companies in the database - this includes the unlisted companies too as the Screener has not checked the Select only Listed Companies check box
2. From the above list, it is further narrowed down to a list with Market Capitalization >= 250 3. From the above, it is further reduced to list of companies for which the data is available as on March
2006 or later 4. From the above, it is further reduced to list of companies with ROG - PAT% greater than 50 5. From the above, it is further reduced to list of companies with Reported Net Profit greater than ZERO 6. From the above, it is further reduced to list of companies with Reported Net Profit for the year before
the Latest greater than ZERO
To Remember Currency and Unit of currency applied for the criteria are default as in currency conversion window invoked by a click on currency button next to AND/OR/NOT button. Latest1 represents 1 year from the Latest. Latest2 represents 2 years from the Latest and so on. This kind of tracing is available back up till for the last 10 years, that is Latest9 Go to Table of Contents

Screener - Useful tips – Part 1
Domain Domain Selection is an important process and we must make it a habit of limiting the search range as minimum as possible to improve the efficiency of Screener Search Engine Make the BEST use of selection/deselection/reselection in the left hand side Company Names box itself. Selection range in the left hand side Company Names box is smaller and it‟s much easier to select, deselect and reselect in the left hand side Company Names box than in right hand side Selected Company Names box Save the selected set always and supply name for the set suggestive of the members of the set. Include the date of creation at the end in “dd mm yyyy” Create a back up directory for exported peer sets
Order
The order row for all the columns in preview box in Filters tab, by default, is set to “No Order”. The cell is empty. Click on Order row of any column. Cell displays “Desc” and Order of the column is set to Descending. Click once more to set the order to Ascending. Click once more to set the order to “No Order”.
Year/Base Date/Range This header allows choosing the Year or Base Date or Range. Click on the Domain tab to select a domain, say Index and BSE Auto. Click on Filters tab Double click on Manufacturing Table of Profit & Loss Folder of Finance Group in Tables box in Filters tab. Select Year and Net Sales in Fields box. Click on the Add button ONCE, repeat ONCE. The selected Year and Net Sales appear in the Preview box below. Year/Base Date/Range row of all the columns display “Latest” – meaning whatever is the latest data available. Go up to Fields box and click on the Add button once more. Preview box has two more columns added to the right Table Name row of the first two columns display “AG_Finance” and the last two columns, the just added columns display “AG_Finance1” Year/Base Date/Range row of the first two columns display “Latest” and the last two columns, the just added columns display “Latest1” By correlation, we can deduct the following;
1. Year and Sales for the Latest year and 2. Year and Sales for one year before the latest year – that is what the Latest1 refers to.
So, let us extend the logic. What should be Latest2? Let us go up to Fields box to click on Add button Once more. The preview box below has just received two more columns. Table Name row of the just added columns display “AG_Finance2”. Year/Base Date/Range row of the just added columns display “Latest2”
So, each click on ADD button produces the set of fields selected in Field box for one previous year before the last selected year. So, Screener remembers the last year selected for the fields selected and every click on ADD button directs Capitaline to produce the fields just one year before the last year selected. The described situation occurs frequently in the case of looking at data parameters across different periods.
To Remember Domain Selection is an important process and we must make it a habit of limiting the search range as minimum as possible to improve the efficiency of Screener Search Engine Make the BEST use of selection/deselection/reselection in the left hand side Company Names box itself. Screener remembers the last year selected for the fields selected and every click on ADD button directs capitaline to produce the fields just one year before the last year selected. Go to Table of Contents

Screener - Useful tips – Part 2 We have seen in Screener - Useful tips –Part 1 that
Each click on ADD button adds the set of fields selected in Fields box for one previous year before the last selected year to the Preview box.
Screener remembers the last year selected for the fields selected and every click on ADD button directs Capitaline to adds the fields just one year before the last year selected to the Preview box
Is there any other way rather than clicking on Add button many times? Click on Refresh button. Domain, Preview and memory of Screener get cleared. Click on the Domain tab to select the Domain Click on Filters tab. Click on the Add button once to push the selected fields down to Preview box. Year/Base Date/Range row of all the columns display “Latest” Had we not refreshed, they will be “Latest5” Click on Year/Base Date/Range row of Year column to select the cell. Click once more to convert to combo box. Click once to drop down the list. Say, 5 years‟ data is required. That is 5 years including the Latest. Click on Latest5 for 5 years including the Latest from the combo box Confirm to Apply Selected Year for ALL Fields Across window pops up by a click on Yes button
Eight more columns have been added;
1. Year columns - Latest1, Latest2, Latest3 and Latest4 2. Net Sales - Latest1, Latest2, Latest3 and Latest4
So, this is an easy way of Adding columns for multiple years than clicking on Add button many times. So, a click on Latest3 produces Latest, Latest1 and Latest2 That is to generalize; a click on LatestN produces latest, latest1, lates2 so on till latest N minus one. So, what will a click on Latest1 produce? Latest one minus one that is Latest zero that is Latest, which is the default. So, Latest1 is not available in the Year/Base Date/Range combo box.
How to select Latest1? Choose Latest2 to produce Latest and Latest1 After producing Latest1, the combo box in Year/Base Date/Range row of a column must not be disturbed Click on the combo box Year/Base Date/Range row of a column which displays “Latest1”. The cell changes to “None” that is the first item in the combo box before Latest and this “None” refers to All available years.
How to bring back Latest1? Any more clicks on Add button up in the Fields box will produce the years before the last selected year. So, we need to start afresh. Click on Refresh button to
1. Clear the memory of Screener. 2. Clear the contents of Preview box. 3. Clear the Domain as well.
To Remember Choose Latest2 to produce Latest and Latest1. After producing Latest1, the combo box in Year/Base Date/Range row of a column must not be disturbed LatestN produces latest, latest1, lates2 so on till latest N minus one. Latest one minus one that is Latest zero that is Latest, which is the default. So, Latest1 is not available in the Year/Base Date/Range combo box. Go to Table of Contents

Screener - Useful tips – Part 3 How to produce data for continuous periods? Hit on S button. Screener window opens up. Click on + against Index Group to open up to select BSE Auto Click on Filters tab. Double click on Manufacturing Table of Financial Overview Folder of Finance Group in Tables box in Filters tab. Select Year End and PAT in Fields box. Click on Add button ONCE. The selected Year End and PAT appear in the Preview box below. Year/Base Date/Range row of all the columns display “Latest” – meaning whatever is the latest data available. We want to look at data for continuous five years. Click on Year/Base Date/Range row of any column Choose Latest5 from the combo box. Confirm to Apply Selected Year for ALL Fields Across window pops up by a click on Yes button Preview box has
Year End for 5 years that is Latest, Latest1, Latest2, Latest3 and Latest4 in first five columns
PAT for 5 years that is Latest, Latest1, Latest2, Latest3 and Latest4 in columns six to ten. We may not want to look at the output this way. So, let us organize the columns in the order of Year End and PAT for the Latest year, Year End and PAT for Latest1 and so on. Columns can be dragged and dropped to the said order of appearance. Ensure that all columns‟ Display Names are visible and fit the cells Ensure that the width of all columns is as minimal as possible to reduce the drag path as less as possible. By doing so, origin and destination columns are clearly seen. A short cut to ensure minimal width of all columns is;
Do not apply any criteria
Click on Run Query button to click on New output to produce a new output
Click on Filters tab. Click on Run Query button to click on New output to produce a new output
Click on the previous output
Click on Filters tab.
Columns are arranged with the minimal width. Click on PAT column of Latest Year/Base Date/Range row. Left boundary of the selected column gets highlighted
Drag the Column, holding the mouse button. Move to the second column. Left boundary of the column is highlighted if the particular column is reached. Check if second column's left boundary is highlighted. Drop the column by releasing the mouse button. Similarly, move the PAT Latest1 to fourth column, PAT Latest2 to sixth column and so on. An important tip to arrange easily is as follows;
Arrange the same Year Ends in succession that is Latest and Latest, Latest1 and Latest1 and so on.
Later, order the small groups by Year End and PAT. Columns can also be arranged in any way in the produced output too. But to produce the output in a desired format for different Domain and or Filters, columns must be rearranged in Preview box itself and the screener must be saved Click on Run Query button to click on New output to produce a new output The result produced includes all the companies for which the 5 years data is available
To Remember Click on Year/Base Date/Range row of any column Choose Latest3 from the combo box for the periods – Latest, Latest1 and Latest2. Confirm to Apply Selected Year for ALL Fields Across window pops up. Click on Yes button Go to Table of Contents
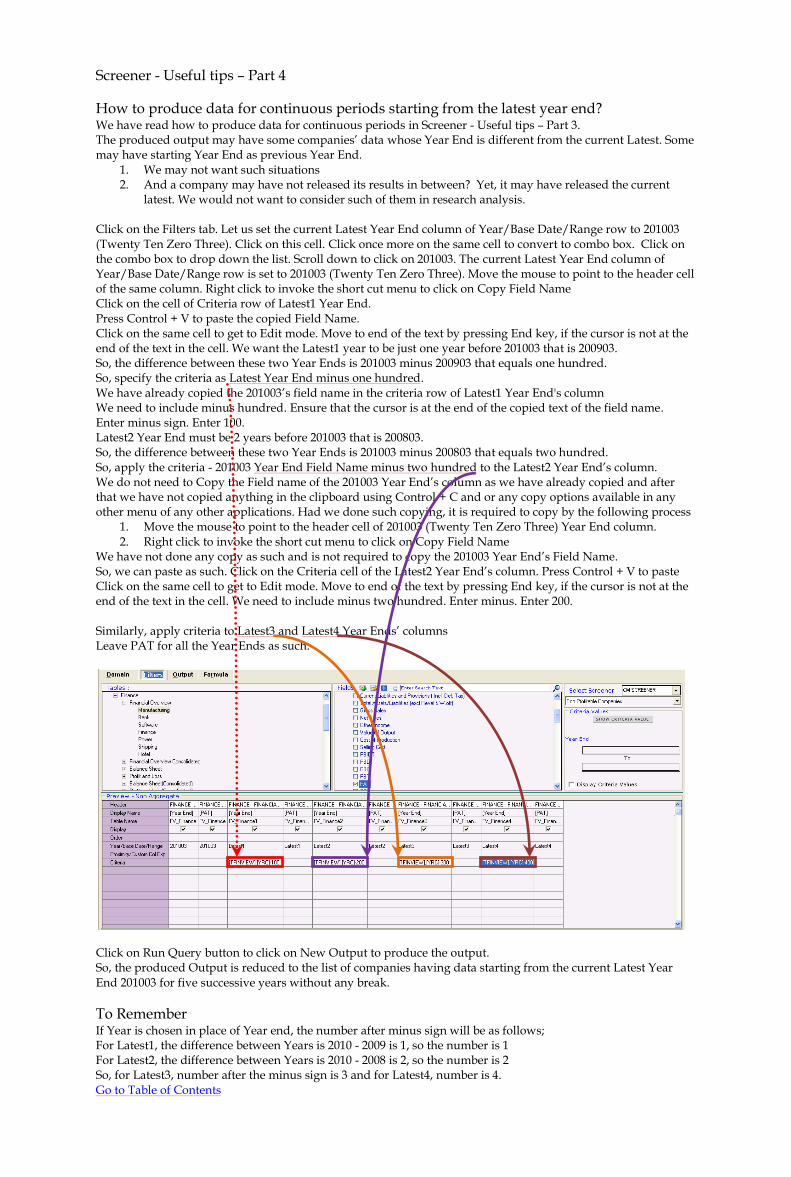
Screener - Useful tips – Part 4
How to produce data for continuous periods starting from the latest year end? We have read how to produce data for continuous periods in Screener - Useful tips – Part 3. The produced output may have some companies‟ data whose Year End is different from the current Latest. Some may have starting Year End as previous Year End.
1. We may not want such situations 2. And a company may have not released its results in between? Yet, it may have released the current
latest. We would not want to consider such of them in research analysis. Click on the Filters tab. Let us set the current Latest Year End column of Year/Base Date/Range row to 201003 (Twenty Ten Zero Three). Click on this cell. Click once more on the same cell to convert to combo box. Click on the combo box to drop down the list. Scroll down to click on 201003. The current Latest Year End column of Year/Base Date/Range row is set to 201003 (Twenty Ten Zero Three). Move the mouse to point to the header cell of the same column. Right click to invoke the short cut menu to click on Copy Field Name Click on the cell of Criteria row of Latest1 Year End. Press Control + V to paste the copied Field Name. Click on the same cell to get to Edit mode. Move to end of the text by pressing End key, if the cursor is not at the end of the text in the cell. We want the Latest1 year to be just one year before 201003 that is 200903. So, the difference between these two Year Ends is 201003 minus 200903 that equals one hundred. So, specify the criteria as Latest Year End minus one hundred. We have already copied the 201003‟s field name in the criteria row of Latest1 Year End's column We need to include minus hundred. Ensure that the cursor is at the end of the copied text of the field name. Enter minus sign. Enter 100. Latest2 Year End must be 2 years before 201003 that is 200803. So, the difference between these two Year Ends is 201003 minus 200803 that equals two hundred. So, apply the criteria - 201003 Year End Field Name minus two hundred to the Latest2 Year End‟s column. We do not need to Copy the Field name of the 201003 Year End‟s column as we have already copied and after that we have not copied anything in the clipboard using Control + C and or any copy options available in any other menu of any other applications. Had we done such copying, it is required to copy by the following process
1. Move the mouse to point to the header cell of 201003 (Twenty Ten Zero Three) Year End column. 2. Right click to invoke the short cut menu to click on Copy Field Name
We have not done any copy as such and is not required to copy the 201003 Year End‟s Field Name. So, we can paste as such. Click on the Criteria cell of the Latest2 Year End‟s column. Press Control + V to paste Click on the same cell to get to Edit mode. Move to end of the text by pressing End key, if the cursor is not at the end of the text in the cell. We need to include minus two hundred. Enter minus. Enter 200. Similarly, apply criteria to Latest3 and Latest4 Year Ends‟ columns Leave PAT for all the Year Ends as such.
Click on Run Query button to click on New Output to produce the output. So, the produced Output is reduced to the list of companies having data starting from the current Latest Year End 201003 for five successive years without any break.
To Remember If Year is chosen in place of Year end, the number after minus sign will be as follows; For Latest1, the difference between Years is 2010 - 2009 is 1, so the number is 1 For Latest2, the difference between Years is 2010 - 2008 is 2, so the number is 2 So, for Latest3, number after the minus sign is 3 and for Latest4, number is 4. Go to Table of Contents
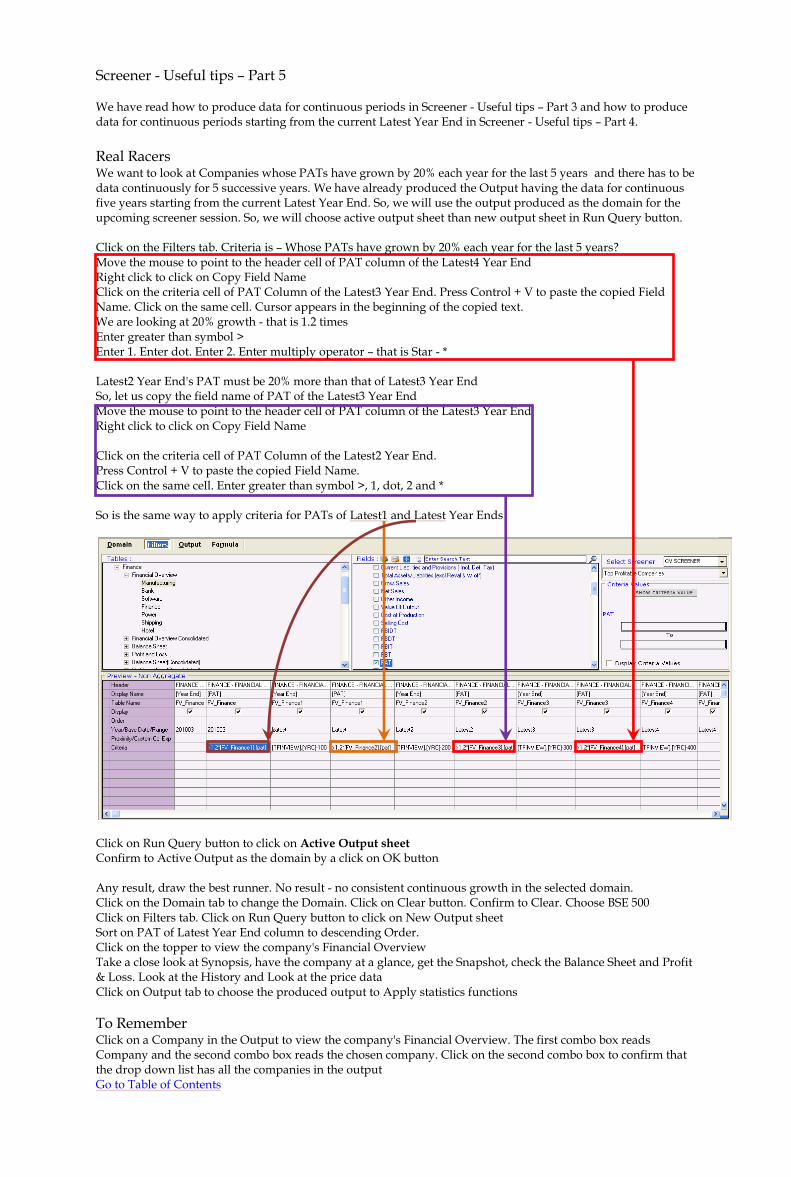
Screener - Useful tips – Part 5 We have read how to produce data for continuous periods in Screener - Useful tips – Part 3 and how to produce data for continuous periods starting from the current Latest Year End in Screener - Useful tips – Part 4.
Real Racers We want to look at Companies whose PATs have grown by 20% each year for the last 5 years and there has to be data continuously for 5 successive years. We have already produced the Output having the data for continuous five years starting from the current Latest Year End. So, we will use the output produced as the domain for the upcoming screener session. So, we will choose active output sheet than new output sheet in Run Query button. Click on the Filters tab. Criteria is – Whose PATs have grown by 20% each year for the last 5 years? Move the mouse to point to the header cell of PAT column of the Latest4 Year End Right click to click on Copy Field Name Click on the criteria cell of PAT Column of the Latest3 Year End. Press Control + V to paste the copied Field Name. Click on the same cell. Cursor appears in the beginning of the copied text. We are looking at 20% growth - that is 1.2 times Enter greater than symbol > Enter 1. Enter dot. Enter 2. Enter multiply operator – that is Star - * Latest2 Year End's PAT must be 20% more than that of Latest3 Year End So, let us copy the field name of PAT of the Latest3 Year End Move the mouse to point to the header cell of PAT column of the Latest3 Year End Right click to click on Copy Field Name Click on the criteria cell of PAT Column of the Latest2 Year End. Press Control + V to paste the copied Field Name. Click on the same cell. Enter greater than symbol >, 1, dot, 2 and * So is the same way to apply criteria for PATs of Latest1 and Latest Year Ends
Click on Run Query button to click on Active Output sheet Confirm to Active Output as the domain by a click on OK button Any result, draw the best runner. No result - no consistent continuous growth in the selected domain. Click on the Domain tab to change the Domain. Click on Clear button. Confirm to Clear. Choose BSE 500 Click on Filters tab. Click on Run Query button to click on New Output sheet Sort on PAT of Latest Year End column to descending Order. Click on the topper to view the company's Financial Overview Take a close look at Synopsis, have the company at a glance, get the Snapshot, check the Balance Sheet and Profit & Loss. Look at the History and Look at the price data Click on Output tab to choose the produced output to Apply statistics functions
To Remember Click on a Company in the Output to view the company's Financial Overview. The first combo box reads Company and the second combo box reads the chosen company. Click on the second combo box to confirm that the drop down list has all the companies in the output Go to Table of Contents

Screener - Useful tips – Part 6 Run Query button in Filters tab has options. They are New Output Sheet, Active Output Sheet, Output in Excel and O/P on consolidated priority. O/P on consolidated priority is available only when financial fields are chosen in Preview box in Filters tab. New Output Sheet produces a new output page and the domain for the produced output is the selected Domain Active Output Sheet produces a new output page in the current output page itself. Domain becomes the Active Output Sheet. This is handy wherein we may want to apply criteria successively on the successive produced outputs, thereby saving a great deal of time Output in Excel directly produces the output in Excel Output on Consolidated Priority is available only if the preview box has financial data parameters
Aggregate and Consolidated priority Aggregate is to unite all the data values of different entities having similar characteristic(s) such as House, Industry, Index and Peer Set etc Consolidation is all about the summing up of all appropriate pro-rata data values of identities having the financial stake in one another. Say, A is having stakes in B. Yet, they are two separate identities. Given that the data values of A and B are available, it's more relevant to look at A after combining all the appropriate pro-rata data values of B, that is consolidating the data values of A and B. So, B's movement affects the movement of A whereas A's movement may not affect the movement of B. Yet, we may be watchful of A's behavior with respect to B in order to have a relevant perspective of B, even though it‟s rare, practically This option produces in Output tab only yet the priority is on available consolidated data Given the option of availability of both individual and consolidated data, this option of output on consolidated priority commands the Screener search engine to prioritize the consolidated data to appear in the produced result. Orange colored data values in the Output refer to the consolidated data
Screener Results Summary (SRS) The bottom most bar in Output has four sections. They are Records in Output, Selected, Matched and unmatched companies. If the number in Unmatched Companies section is not Zero, click on the number in Selected Companies text box. A serial no cell is selected in the produced output. Selected cell is the starting position for all unmatched companies from the selected cell‟s row to the last row. Caption of the output tab reads “S underscore a number Currency In Unit”. S refers to Selected Companies. No Screener, no Criteria is applied.
To Remember
Difference between successive Year Ends is 100; difference between successive Years is 1 Use Tab key to navigate to cells across row; Use up, right, down, left arrow keys to move to next cells In Year or Year End cell, press F2 to bring up the combo box Enter 2/1 to list the Year or Year Ends starting with 2/1 Latest1 is just 1 year before the current Latest When the current latest year was 2009, Latest1 was 2008 When the current latest year is 2010, Latest1 is 2009 When 2011 becomes the current latest year, 2010 will be Latest1 Latest1, Latest2 to Latest9 are relative to the current Latest Year/End When the current latest year changes coming April, Latest1, Latest2 to Latest9 will also change In Criteria cell, press Control + X to delete, Control + C to Copy and Control + V to Paste Apply Criteria across is handy when we choose years other than Latest “n” from the combo box of Year/Base Date/Range row of any column. Had we chosen Latest “n”, dialogue window appears to confirm for application of Criteria across, whereas here, it is not so. So, option Apply Criteria across is available in the short cut menu. Click ON and DOWN the Criteria cell to get shortcut menu of four options that are Enter Formula, Custom Column, Change output and Apply Criteria across. Click on Enter Formula. Formula Names and Description box window appears. This window lists the formulae available. Choose a formula of interest and click on OK to add the formula to view the data value of the formula and or apply criteria to the added formula. In search boxes in Domain or Fields box, supply the search string, hit Enter or Search button Go to Table of Contents

Export – Excel List Box Many times, we get to meet situations wherein we need to provide support material to our research findings -the data and all data pages of capitaline can be exported All research pages can be exported to Word by clicking on the Word button in Icon menu bar 2 If we find lot of tables in the data page, export to Spreadsheet is recommended There are two different ways to export to Excel. One is using the short cut menu. Click on the data pane or window - (Live CM News tab – Result Analysis) to let capitaline know the selected pane. Only what is visible in the selected data pane is exported. There may be situations wherein we may hide certain columns or rows - Financial Overview. In such cases, what is visible is exported. If we want to export the complete data page, unhide the hidden rows & columns and export by a click on Export to Excel menu item in short cut menu. The other method is by a click on the Excel button in Icon Menu Bar 2
Excel List Box
Excel list box offers different destinations for the exported content. „New Excel File‟ does the same job that of the Excel button. „Open Existing File‟ requires the position of the spreadsheet after the export. Also, ensure that workbook we want to export is closed. Exit Excel too.„New sheet‟ inserts the spreadsheet just before the active sheet at the time of last save. „First sheet‟ inserts the spreadsheet in the beginning of the work book. „First sheet‟ overwrites the earlier first sheet. If we want the existing first sheet to remain, there are three methods to do that First method: We may choose „New Sheet‟ and after the export, move the exported sheet to the beginning of the workbook by drag & drop - Click on the sheet to be moved and keep the mouse button pressed. The cursor attaches a corner folded Paper image indicating that the selected sheet is ready for the move. Move the cursor to the beginning, keeping the mouse button pressed. We get to watch a small inverted triangle which is like a pointer pointing the current position of the movement. After we reach to the beginning of the workbook, release the mouse button to drop the selected sheet of exported contents. Second method: Open the workbook by a double click. Click on the first sheet. Save, Close & Exit.
Choose „New Sheet‟ in the sub menu of „Open Existing File‟ option of Excel List box. Third method: Insert a new empty sheet in the beginning of our work book by opening the workbook by a double click. Click on the first sheet by clicking on the sheet tab of the workbook. Right click on the first sheet. Shortcut menu opens up. Choose Insert. Select Worksheet by a single click and OK. A new empty sheet is inserted in the beginning of the work book. Cursor is in first cell of first Row. Keep the cursor as such. Save by a click on Save button. Close the workbook & exit Excel. Choose „First Sheet‟ in the sub menu of „Open Existing File‟ option of Excel List box
„Custom Sheet‟ in the sub menu of „Open Existing File‟ option of Excel List box requests to enter the sheet no. Supply the number. Data is exported to the sheet and it is in the position of the number we have supplied. The earlier sheet is overwritten. „Overwrite File‟ overwrites the existing file. Capitaline recommends that we use this Overwrite File option wisely Also suggested is that we keep a back up of the file to be overwritten should we roll back
To Remember Close any Existing Excel instances by opening System‟s Task manager Only the visible data in the selected data pane or window is exported In case of export to existing work books, close the book before the export A negative number as the Custom sheet number exports as a new sheet and its‟ location is in the first place Zero as the Custom sheet number exports as a new sheet and its‟ location is in the first place A number within the total number of worksheets in the work book as Custom number replaces the existing sheet A number greater than the total number of worksheets in the work book as the Custom number exports as a new sheet and its‟ location is in the first place Go to Table of Contents

Save the work book as Macro Enabled book [Office 2007] After the export to MS Excel work book, the workbook needs to be saved as Macro Enabled workbook in order to enable Active Update options Click on Office Button in MS Excel. Hover the mouse over „Save as Type‟. Click on „Other Formats‟ to open the „Save as‟ dialogue box. Supply a name for the work book. Click on „Save as Type‟ Combo box to choose „Excel Macro Enabled work book‟. The saved work book will have the extension name as xlsm that is the text appearing after the dot in the name of the file will be „xlsm‟
Security Warning Another important point to note is, when the work book is opened, depending on the „Macro settings‟ of the „Trust Centre Settings‟ of the „Trust Centre‟ available in the „Excel options‟ of the „Office Button‟, „Security Warning - Macros have been disabled‟ appears between the tab bar up and the address bar down So, if we get to see this „Security Warning - Macros have been disabled‟ between the tab bar up and the address bar down and if we need to update the data in the work book, Click on „Options‟ button next to the warning message. Click on „Enable this content‟ radio button in „Security options‟ pop up window and OK
Or if we want to change the „Macro settings‟ of the „Trust Centre Settings‟ of the „Trust Centre‟ available in the „Excel options‟ of the „Office Button‟, click on the hyperlink „Open the Trust Centre‟ in the „Security options‟ pop up window and click on any radio button to change to our security level of comfort. Security warning no longer appears and we get to see the introduction of „Add Ins‟ tab in the tab bar Note that this Add-Ins is an added option by Capitaline in Excel Click on „Add Ins tab‟ Click on „Update‟ to view different options for update
To Remember Save the work book as Macro Enabled work book to update the data in the work book. The file will have the extension as „xlsm‟ Choose „Enable this Content‟ in „Security options‟ window introduced by Click on „Options‟ button next to the „Security Warning - Macros have been disabled‟ in order to update the data in the work book Go to Table of Contents

Export – Update Let us look at a familiar situation. We have exported sometime in the month of say March. We are in say, April, May. Results have been announced; Capitaline‟s quickly entered, validated & included the latest data in its database. Do we need to do the export again or just update the exported book? The second option said is faster & simpler! Let us choose a data page, say „Consolidated Deferred Tax‟ in „Finance‟. Click on Excel button to export to a new file. [Office 2007] Let us remove the latest year's data and save the workbook as “Macro Enabled workbook” in order to enable Update. In MS „Save As‟ window, supply a name for the work book and click on „Save as Type‟ combo box to select „Excel Macro Enabled‟ work book that is saved book will have the extension name as‟ xlsm‟ that is the text appearing after the dot in the name of the file will be‟ xlsm‟. Close the workbook. Now, let us check update power of Capitaline. Open the work book. If „Security Warning - Macros have been disabled‟ appears, Click on „Options‟ button next to the warning message and Click on „Enable this content‟ radio button in „Security options‟ pop up window and OK Observe that a new tab „Add-ins‟ is introduced in the last position of the Excel main tab bar - the topmost tab bar Click on „Add-Ins‟ tab. Update Option group appears in the second tab bar Click on the micro sized inverted triangle button to open up the list box There are options. They are „Sheet‟, „Work book‟, „All open files‟, „Select Company & „About Capitaline‟ „About Capitaline‟ is the Product, Support & Copyright popup
„Sheet‟ updates the current, active sheet of our exported workbook This is swifter than (1) pulling the Company/Industry/House and (2) locating the data page of our interest and exporting the complete contents of the data page. So, just the update of the latest data should do which is what „Sheet‟ in „Update‟ of „Add-Ins‟ does swiftly & seamlessly „Work book‟ checks for possible updation of all the sheets in the work book and updates all the sheets that can be updated. This option is handy where we have already made our work book of researched pages and we just need to update all the sheets with the latest results declared which is what this „Work book‟ option does cleverly „All open files‟ - A single click updates all our researched pages of all open work books. Imagine the hassles of locating & updating data pages by pages
Appreciate Capitaline's structured disciplined approach towards Data Update Sheet - micro level update - possibly a single or double pages updates Work book - Mini update - multiple pages of a single work book All open books - Mega or giga scale - multiple pages of multiple work books - Say, Multiple pages of a Controlling House, Industry, Peer set etc We will also observe that as when there is no data to update capitaline communicates accordingly which is very important in the research process
To Remember Save the work book as „Macro Enabled‟ work book. On opening the work book, if „Security Warning - Macros have been disabled‟ appears, Click on „Options‟ button next to the warning message and Click on „Enable this content‟ radio button in „Security options‟ pop up window and OK Go to Table of Contents

Update an unselected company‟s data
Excel: Add-Ins > Update > Select Company Let us say we are not happy with a company and we have eliminated that company from our portfolio We would like to look at the same data page of a different company Let us watch the performance of Capitaline via „Select Company‟ option in „Update‟ group of „Add-Ins‟ tab Open the work book. If „Security Warning - Macros have been disabled‟ appears, Click on „Options‟ button next to the warning message and Click on „Enable this content‟ radio button in „Security options‟ pop up window and OK Observe that a new tab „Add-ins‟ is introduced in the last position of the Excel main tab bar - the topmost tab bar Click on „Add-Ins‟ tab. Update Option group appears in the second tab bar Click on the micro sized inverted triangle button to open up the list box There are options. They are „Sheet‟, „Work book‟, „All open files‟, „Select Company & „About Capitaline‟
OVERWRITE Click on the sheet of our choice - the company which is to be eliminated from our set Click on „Add Ins‟ tab. Click on „Update‟ group. Click on „Select Company‟ Observe the introduction of a little combo box reading the company of our choice to be eliminated Click on the „Select Company‟ combo box. Type the starting characters of the company of our choice. Hit „Enter‟
The list box portion of the „Select Company‟ combo box opens up with the list of companies whose names start with the entered characters. Click on a Company of our choice. Watch the update process. Underperformer is removed and we get to look at the same data page for a different company of our choice
NEW Well, what if we want to look at a different company's data page without removing the under performer, say for comparison purposes? In MS Excel, right click on the tab that is the sheet of data page of our interest. Shortcut menu opens up. Click on „Move or Copy‟ Check the „Create a Copy‟ check box and OK. Copy of the selected sheet is introduced Click on „Add Ins‟ tab. Click on „Update‟ group. Click on „Select Company‟ Observe the introduction of a little combo box reading the company of our choice to be eliminated Click on the „Select Company‟ combo box. Type the starting characters of the company of our choice. Hit „Enter‟ The list box portion of the „Select Company‟ combo box opens up with the list of companies whose names start with the entered characters. Click on a Company of our choice. Watch the update process. Underperformer continues to remain for comparison purposes and we get to look at the same data page for a different company of our choice. Let us remember to change the name of the sheet by right click to choose „Rename‟ and rename the sheet & save Couple this Capitaline's Updation abilities to System‟s „Scheduled Tasks‟ to enable all these actions to happen without our presence
To Remember Save the work book as „Macro Enabled‟ work book. On opening the work book, if „Security Warning - Macros have been disabled‟ appears, Click on „Options‟ button next to the warning message and Click on „Enable this content‟ radio button in „Security options‟ pop up window and OK Only the particular data page is updated. If „Financial Overview‟ sheet is chosen then „Financial Overview‟ is overwritten / introduced – not any other page such as Bonus History, Share Price Data etc Go to Table of Contents

Export – Flexibility By default, Capitaline exports to MS Word processing documents and MS Excel spread sheets by a click on Word & Excel buttons in Icon Menu Bar 2 that is the third menu bar from the top Main Menu Bar. Do we want to export to different word processing documents & spread sheets such as Star Office and Open Office by default?
Export to Star Office or Open Office Ensure that our preferred applications are installed properly & working fine Click on „Tools‟ in main menu bar Click on „Settings‟ in the sub menu drop down list Settings window pops up Default tab is the General tab Select favorite application by clicking on radio buttons against Star Office or Open Office in „Export‟ options group We can set the default export to either MS Excel or Star Office or Open Office spread sheets We can set the default export to either MS Word or Star Office document or Open Office writer documents Click on „Apply‟ button. The settings window closes and the settings are in effect now
Click on Word and Excel buttons to confirm the export to the applied preferences
To Remember If there‟s any error in export, ensure that chosen applications are installed properly and working fine Capitaline‟s output in screener may have more records. If all are not exported, check on the limitations of the Spread sheet applications such as MS Excel or Star Office or Open Office Go to Table of Contents
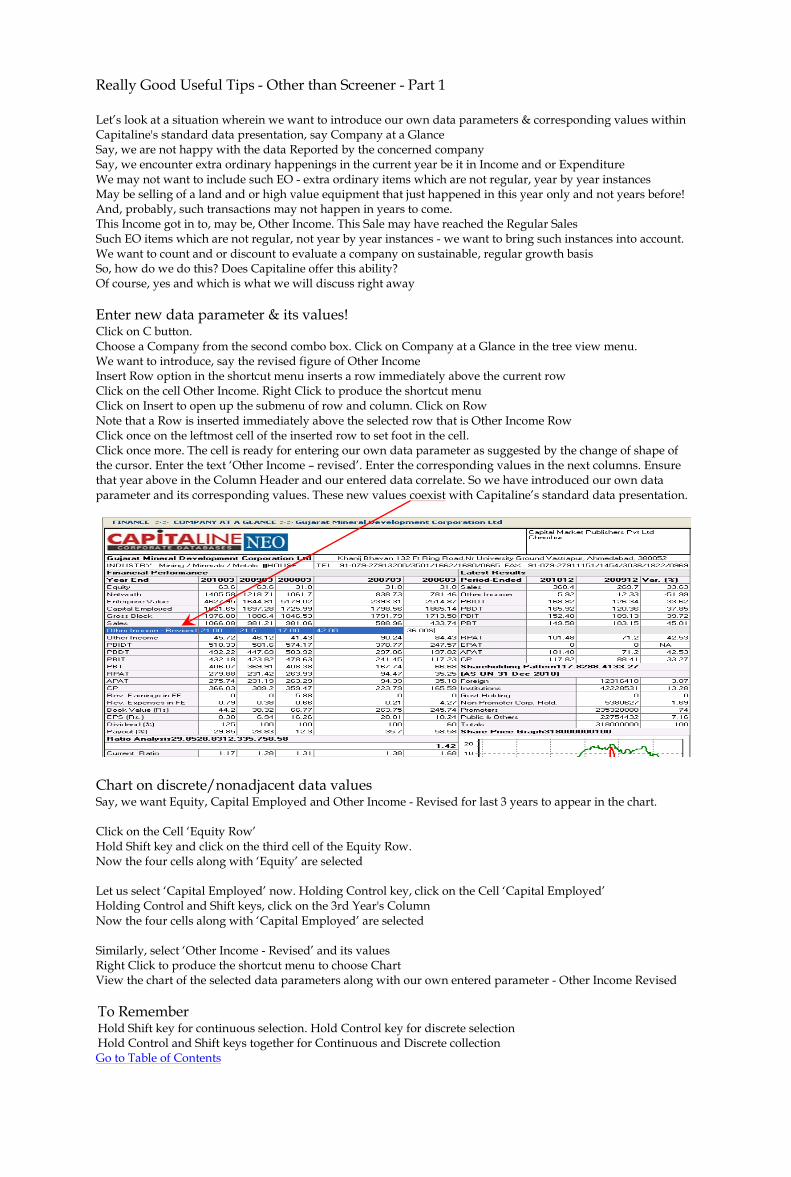
Really Good Useful Tips - Other than Screener - Part 1 Let‟s look at a situation wherein we want to introduce our own data parameters & corresponding values within Capitaline's standard data presentation, say Company at a Glance Say, we are not happy with the data Reported by the concerned company Say, we encounter extra ordinary happenings in the current year be it in Income and or Expenditure We may not want to include such EO - extra ordinary items which are not regular, year by year instances May be selling of a land and or high value equipment that just happened in this year only and not years before! And, probably, such transactions may not happen in years to come. This Income got in to, may be, Other Income. This Sale may have reached the Regular Sales Such EO items which are not regular, not year by year instances - we want to bring such instances into account. We want to count and or discount to evaluate a company on sustainable, regular growth basis So, how do we do this? Does Capitaline offer this ability? Of course, yes and which is what we will discuss right away
Enter new data parameter & its values! Click on C button. Choose a Company from the second combo box. Click on Company at a Glance in the tree view menu. We want to introduce, say the revised figure of Other Income Insert Row option in the shortcut menu inserts a row immediately above the current row Click on the cell Other Income. Right Click to produce the shortcut menu Click on Insert to open up the submenu of row and column. Click on Row Note that a Row is inserted immediately above the selected row that is Other Income Row Click once on the leftmost cell of the inserted row to set foot in the cell. Click once more. The cell is ready for entering our own data parameter as suggested by the change of shape of the cursor. Enter the text „Other Income – revised‟. Enter the corresponding values in the next columns. Ensure that year above in the Column Header and our entered data correlate. So we have introduced our own data parameter and its corresponding values. These new values coexist with Capitaline‟s standard data presentation.
Chart on discrete/nonadjacent data values Say, we want Equity, Capital Employed and Other Income - Revised for last 3 years to appear in the chart. Click on the Cell „Equity Row‟ Hold Shift key and click on the third cell of the Equity Row. Now the four cells along with „Equity‟ are selected Let us select „Capital Employed‟ now. Holding Control key, click on the Cell „Capital Employed‟ Holding Control and Shift keys, click on the 3rd Year's Column Now the four cells along with „Capital Employed‟ are selected Similarly, select „Other Income - Revised‟ and its values Right Click to produce the shortcut menu to choose Chart View the chart of the selected data parameters along with our own entered parameter - Other Income Revised
To Remember Hold Shift key for continuous selection. Hold Control key for discrete selection Hold Control and Shift keys together for Continuous and Discrete collection Go to Table of Contents

Really Good Useful Tips - Other than Screener - Part 2
Click on C button. Choose a Company from the second combo box. Click on Finance Folder to unfold if folded. Click on Company at a Glance in the tree view menu.
Hide oldest year‟s data Click on a cell of the column to be hidden. Right click to produce the shortcut menu. Click on Hide Column The column of the selected cell has disappeared from the data window Note that in order to hide a column, selection of a COLUMN is NOT required
Mail the data page Look at the areas to watch for where options and features are dynamically loaded Look at a small envelope button sitting in the right top corner just above the right top corner of the data window The control tip of this button flashes „Mail to‟. Do we want to send this page to our colleague, client for a possible consideration? Ensure that the system's mail client is installed, configured and working properly. Click on this „Mail To‟ button to send a mail with the Capitaline‟s data page as an attachment.
Fact Sheets How different and or same are the Fact sheet in Actual and Fact sheets in General groups of Industry, House & Peer Set? Fact sheet in Actual Group corresponds to the Fact Sheet of Group & Level as in first & second combo boxes respectively. Group is as in the first combo box and Level is as in the second combo box So, Actual is suggestive of Actual Group and Level selected in first and second combo boxes respectively, except that Company produces fact sheet of Industry Group and level is just above the company. Also note that this fact sheet in Actual group is Not Applicable to the Active Set We have House, Industry and Peer Set groups in the Capitaline tab in the Tree View pane So for Groups of House, Industry & Peer set, in addition to the Fact Sheets available in the General groups, Fact Sheet - Actual corresponds to General – Fact sheet of the Corresponding Group. So for Groups of House, Industry and Peer set, we have double links to the fact sheets of the groups When the First combo box reads Industry and the second combo box reads „Fact Sheet - All Industries‟, Fact Sheet in Actual Group and Fact Sheet in General Group of the Industry are one and the same When the second combo box reads „Fact Sheet - a classification of Industry‟, that is some level below the topmost level, that is „All Industries‟, Fact Sheet in Actual Group corresponds to the level in the second combo box Fact Sheet in Actual Group and Fact Sheet in General Group of the Industry are one and the Same Similarly, Fact Sheet in Actual Group and Fact Sheet in General Group of House & Peer Set are one and the same
How about other groups such as Banker, CM Peer Set, Common Peer Set, Location and Stock Exchange etc? Fact Sheet in Actual Group is the only link in the Tree View pane to get back to last visited level Navigation is quicker using this Actual than choosing DIFFERENT levels in second combo box
To Remember In order to hide a column, selection of a COLUMN is NOT required Ensure that the system's mail client is installed, configured & working properly in order to use „Mail To‟ button available in Company at a Glance of Finance Folder of Company Group Fact sheet in Actual Group corresponds to the Fact Sheet of Group & Level as appearing in first & second Combo boxes respectively. Group is as in the first combo box & Level is as in the second combo box except that Company produces fact sheet of Industry Group & level is just above the company. Fact sheet in Actual group is Not Applicable to the Active Set Go to Table of Contents
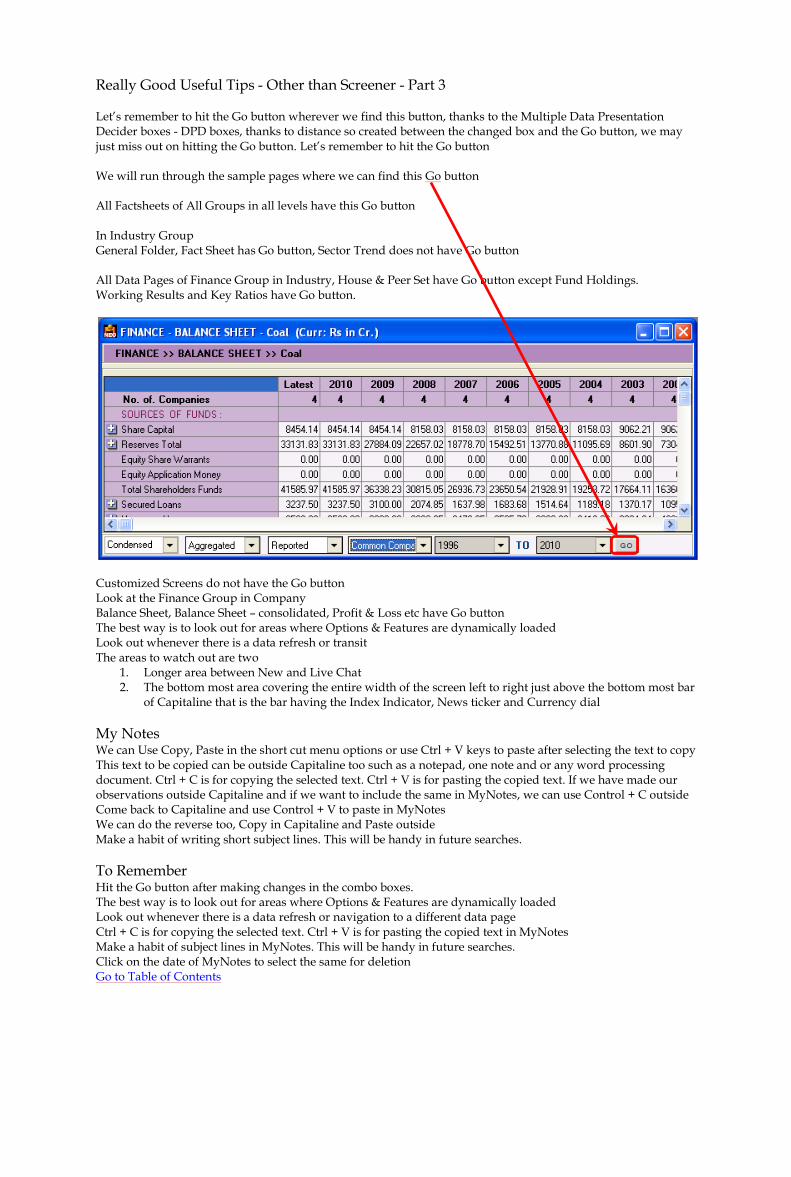
Really Good Useful Tips - Other than Screener - Part 3
Let‟s remember to hit the Go button wherever we find this button, thanks to the Multiple Data Presentation Decider boxes - DPD boxes, thanks to distance so created between the changed box and the Go button, we may just miss out on hitting the Go button. Let‟s remember to hit the Go button We will run through the sample pages where we can find this Go button All Factsheets of All Groups in all levels have this Go button In Industry Group General Folder, Fact Sheet has Go button, Sector Trend does not have Go button All Data Pages of Finance Group in Industry, House & Peer Set have Go button except Fund Holdings. Working Results and Key Ratios have Go button.
Customized Screens do not have the Go button Look at the Finance Group in Company Balance Sheet, Balance Sheet – consolidated, Profit & Loss etc have Go button The best way is to look out for areas where Options & Features are dynamically loaded Look out whenever there is a data refresh or transit The areas to watch out are two
1. Longer area between New and Live Chat 2. The bottom most area covering the entire width of the screen left to right just above the bottom most bar
of Capitaline that is the bar having the Index Indicator, News ticker and Currency dial
My Notes We can Use Copy, Paste in the short cut menu options or use Ctrl + V keys to paste after selecting the text to copy This text to be copied can be outside Capitaline too such as a notepad, one note and or any word processing document. Ctrl + C is for copying the selected text. Ctrl + V is for pasting the copied text. If we have made our observations outside Capitaline and if we want to include the same in MyNotes, we can use Control + C outside Come back to Capitaline and use Control + V to paste in MyNotes We can do the reverse too, Copy in Capitaline and Paste outside Make a habit of writing short subject lines. This will be handy in future searches.
To Remember Hit the Go button after making changes in the combo boxes. The best way is to look out for areas where Options & Features are dynamically loaded Look out whenever there is a data refresh or navigation to a different data page Ctrl + C is for copying the selected text. Ctrl + V is for pasting the copied text in MyNotes Make a habit of subject lines in MyNotes. This will be handy in future searches. Click on the date of MyNotes to select the same for deletion Go to Table of Contents

Really Good Useful Tips - Other than Screener - Part 4
File – Save Click on File in main menu bar. Click on Save. Custom Save window opens up. Company is the default selection in the left hand side Group combo box Click at the end of the text box where „Enter Starting Characters‟ text appears. Select the entire text by holding the mouse button and dragging to the left. Enter “A” and hit Enter key. Left hand side box that is the Origin box is populated with list of Companies whose names have A in it and whose associates, aliases and parents have names containing „A‟ as we have not checked the check box between company combo box & „Enter Starting Characters‟ text box
Continuous Selection Say, we want to select from the fourth company from the top to the say eighth company. Click on fourth company, locate the eighth company, hold Shift key and click on the eighth company Observe that Companies starting from four to eight are selected. What if we want to extend the selection to the end? Pull the bar down, locate the last company, and hold Shift key and click on the last company Pull the bar up and down to confirm the continuous selection from fourth to the last What if we want to extend the selection to the beginning, which is ALL companies? Pull the bar up if required, locate the first company and hold Shift key and click on the first company Pull the bar up & down to confirm the continuous selection from start to the last, did we get it? No! Well, let‟s use Double Right Arrows button to transfer ALL. No need to select!
Discrete selection Say, we want to select second, fourth, sixth and eighth from the top. Click on the second company Locate the fourth company and hold Control key and click on the fourth company Similarly, locate the sixth company, hold Control key and click on the sixth company Similarly, locate the eighth company, hold Control key and click on the eighth company So, we have made the discrete selection! From this point, can we select companies from say 10 to 15 continuously? Yes, Capitaline offers this route! Locate the tenth company, hold Control key & click on the tenth company. Hold Control key and Shift Key and click on the 15th company So, we have made discrete & continuous selection
Invert Selection Suppose we want to select all but 2. Click on the first company, hold Ctrl + Shift + End keys. All are selected. We need to select all but 2, say we do not want 3 and 5. So, let‟s deselect 3 and 5 Hold Control key and click on 3rd company, hold Control key and click on 5th company So, we have made the selection all but 2
To Remember Hold Control key for Discrete Selection alone, hold Shift key for continuous Selection alone And for both Discrete and Continuous selection together, hold both Control and Shift keys Use Shift to select ALL from the currently selected company Ctrl + Shift + Home selects all from the currently selected company to the beginning Ctrl + Shift + End selects all from the currently selected company to the end After selection, use Ctrl key to deselect Go to Table of Contents
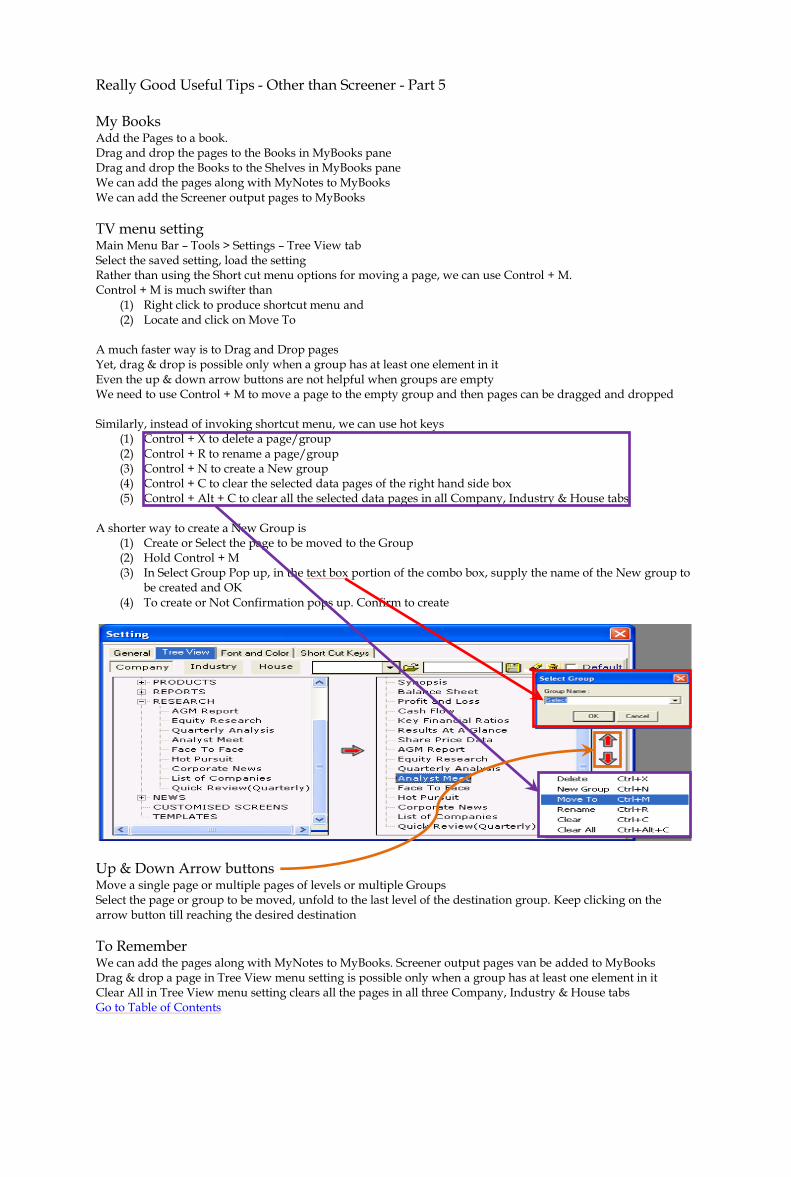
Really Good Useful Tips - Other than Screener - Part 5
My Books
Add the Pages to a book. Drag and drop the pages to the Books in MyBooks pane Drag and drop the Books to the Shelves in MyBooks pane We can add the pages along with MyNotes to MyBooks We can add the Screener output pages to MyBooks
TV menu setting Main Menu Bar – Tools > Settings – Tree View tab Select the saved setting, load the setting Rather than using the Short cut menu options for moving a page, we can use Control + M. Control + M is much swifter than
(1) Right click to produce shortcut menu and (2) Locate and click on Move To
A much faster way is to Drag and Drop pages Yet, drag & drop is possible only when a group has at least one element in it Even the up & down arrow buttons are not helpful when groups are empty We need to use Control + M to move a page to the empty group and then pages can be dragged and dropped Similarly, instead of invoking shortcut menu, we can use hot keys
(1) Control + X to delete a page/group (2) Control + R to rename a page/group (3) Control + N to create a New group (4) Control + C to clear the selected data pages of the right hand side box (5) Control + Alt + C to clear all the selected data pages in all Company, Industry & House tabs
A shorter way to create a New Group is
(1) Create or Select the page to be moved to the Group (2) Hold Control + M (3) In Select Group Pop up, in the text box portion of the combo box, supply the name of the New group to
be created and OK (4) To create or Not Confirmation pops up. Confirm to create
Up & Down Arrow buttons Move a single page or multiple pages of levels or multiple Groups Select the page or group to be moved, unfold to the last level of the destination group. Keep clicking on the arrow button till reaching the desired destination
To Remember We can add the pages along with MyNotes to MyBooks. Screener output pages van be added to MyBooks Drag & drop a page in Tree View menu setting is possible only when a group has at least one element in it Clear All in Tree View menu setting clears all the pages in all three Company, Industry & House tabs Go to Table of Contents
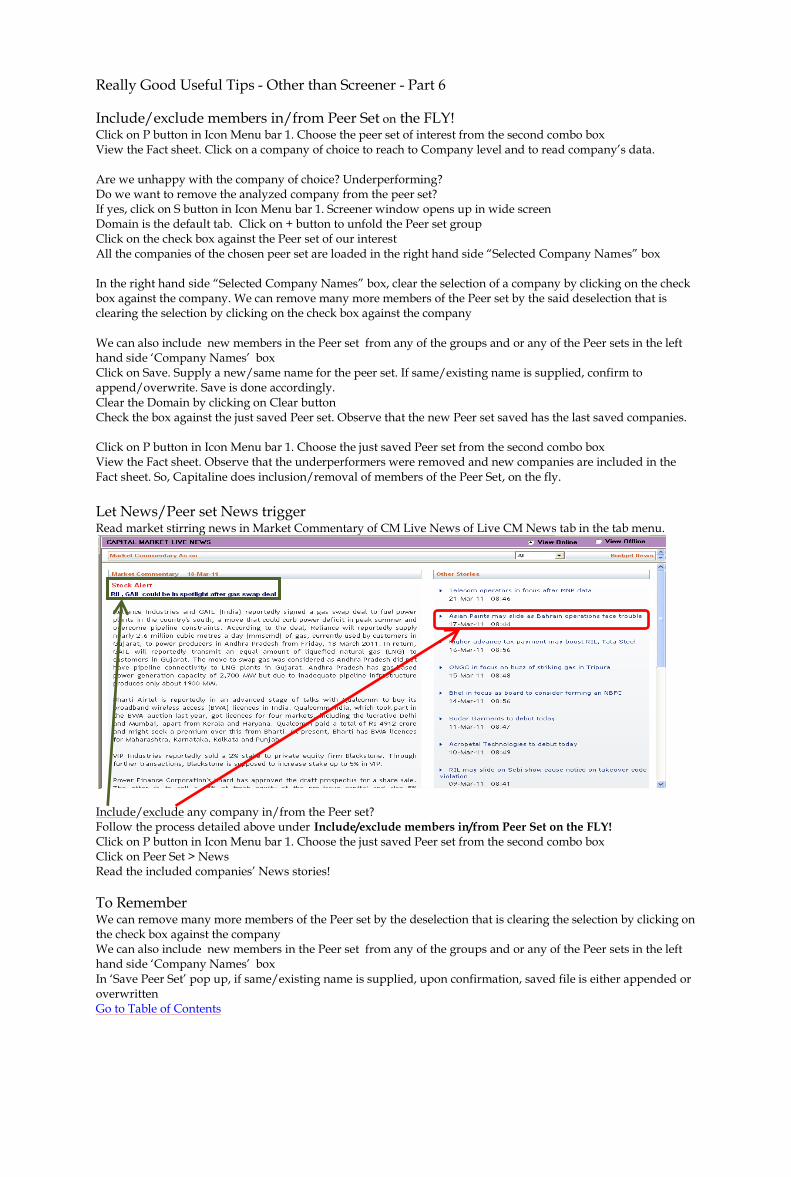
Really Good Useful Tips - Other than Screener - Part 6
Include/exclude members in/from Peer Set on the FLY! Click on P button in Icon Menu bar 1. Choose the peer set of interest from the second combo box View the Fact sheet. Click on a company of choice to reach to Company level and to read company‟s data. Are we unhappy with the company of choice? Underperforming? Do we want to remove the analyzed company from the peer set? If yes, click on S button in Icon Menu bar 1. Screener window opens up in wide screen Domain is the default tab. Click on + button to unfold the Peer set group Click on the check box against the Peer set of our interest All the companies of the chosen peer set are loaded in the right hand side “Selected Company Names” box In the right hand side “Selected Company Names” box, clear the selection of a company by clicking on the check box against the company. We can remove many more members of the Peer set by the said deselection that is clearing the selection by clicking on the check box against the company We can also include new members in the Peer set from any of the groups and or any of the Peer sets in the left hand side „Company Names‟ box Click on Save. Supply a new/same name for the peer set. If same/existing name is supplied, confirm to append/overwrite. Save is done accordingly. Clear the Domain by clicking on Clear button Check the box against the just saved Peer set. Observe that the new Peer set saved has the last saved companies. Click on P button in Icon Menu bar 1. Choose the just saved Peer set from the second combo box View the Fact sheet. Observe that the underperformers were removed and new companies are included in the Fact sheet. So, Capitaline does inclusion/removal of members of the Peer Set, on the fly.
Let News/Peer set News trigger Read market stirring news in Market Commentary of CM Live News of Live CM News tab in the tab menu.
Include/exclude any company in/from the Peer set? Follow the process detailed above under Include/exclude members in/from Peer Set on the FLY!
Click on P button in Icon Menu bar 1. Choose the just saved Peer set from the second combo box Click on Peer Set > News Read the included companies‟ News stories!
To Remember We can remove many more members of the Peer set by the deselection that is clearing the selection by clicking on the check box against the company We can also include new members in the Peer set from any of the groups and or any of the Peer sets in the left hand side „Company Names‟ box In „Save Peer Set‟ pop up, if same/existing name is supplied, upon confirmation, saved file is either appended or overwritten Go to Table of Contents
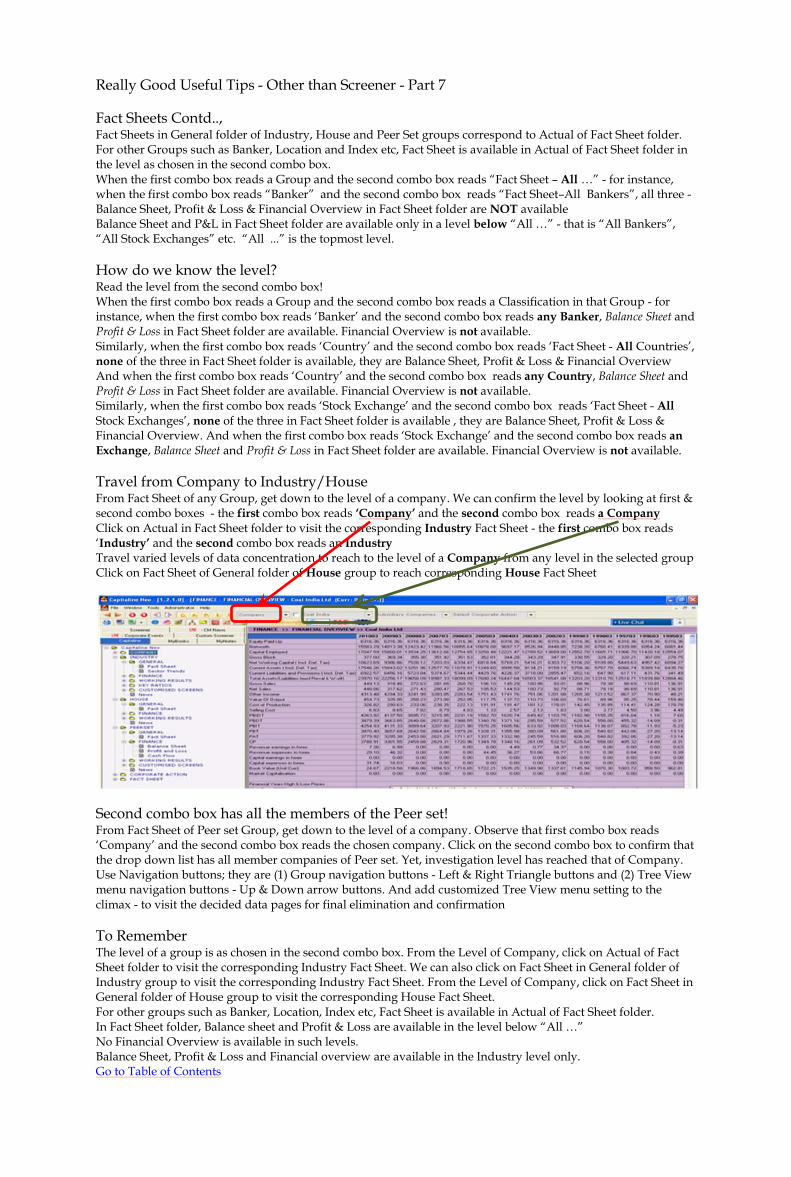
Really Good Useful Tips - Other than Screener - Part 7
Fact Sheets Contd.., Fact Sheets in General folder of Industry, House and Peer Set groups correspond to Actual of Fact Sheet folder. For other Groups such as Banker, Location and Index etc, Fact Sheet is available in Actual of Fact Sheet folder in the level as chosen in the second combo box. When the first combo box reads a Group and the second combo box reads “Fact Sheet – All …” - for instance, when the first combo box reads “Banker” and the second combo box reads “Fact Sheet–All Bankers”, all three - Balance Sheet, Profit & Loss & Financial Overview in Fact Sheet folder are NOT available Balance Sheet and P&L in Fact Sheet folder are available only in a level below “All …” - that is “All Bankers”, “All Stock Exchanges” etc. “All ...” is the topmost level.
How do we know the level? Read the level from the second combo box! When the first combo box reads a Group and the second combo box reads a Classification in that Group - for instance, when the first combo box reads „Banker‟ and the second combo box reads any Banker, Balance Sheet and Profit & Loss in Fact Sheet folder are available. Financial Overview is not available. Similarly, when the first combo box reads „Country‟ and the second combo box reads „Fact Sheet - All Countries‟, none of the three in Fact Sheet folder is available, they are Balance Sheet, Profit & Loss & Financial Overview And when the first combo box reads „Country‟ and the second combo box reads any Country, Balance Sheet and Profit & Loss in Fact Sheet folder are available. Financial Overview is not available. Similarly, when the first combo box reads „Stock Exchange‟ and the second combo box reads „Fact Sheet - All Stock Exchanges‟, none of the three in Fact Sheet folder is available , they are Balance Sheet, Profit & Loss & Financial Overview. And when the first combo box reads „Stock Exchange‟ and the second combo box reads an
Exchange, Balance Sheet and Profit & Loss in Fact Sheet folder are available. Financial Overview is not available.
Travel from Company to Industry/House From Fact Sheet of any Group, get down to the level of a company. We can confirm the level by looking at first & second combo boxes - the first combo box reads ‘Company’ and the second combo box reads a Company
Click on Actual in Fact Sheet folder to visit the corresponding Industry Fact Sheet - the first combo box reads „Industry’ and the second combo box reads an Industry Travel varied levels of data concentration to reach to the level of a Company from any level in the selected group Click on Fact Sheet of General folder of House group to reach corresponding House Fact Sheet
Second combo box has all the members of the Peer set! From Fact Sheet of Peer set Group, get down to the level of a company. Observe that first combo box reads „Company‟ and the second combo box reads the chosen company. Click on the second combo box to confirm that the drop down list has all member companies of Peer set. Yet, investigation level has reached that of Company. Use Navigation buttons; they are (1) Group navigation buttons - Left & Right Triangle buttons and (2) Tree View menu navigation buttons - Up & Down arrow buttons. And add customized Tree View menu setting to the climax - to visit the decided data pages for final elimination and confirmation
To Remember The level of a group is as chosen in the second combo box. From the Level of Company, click on Actual of Fact Sheet folder to visit the corresponding Industry Fact Sheet. We can also click on Fact Sheet in General folder of Industry group to visit the corresponding Industry Fact Sheet. From the Level of Company, click on Fact Sheet in General folder of House group to visit the corresponding House Fact Sheet. For other groups such as Banker, Location, Index etc, Fact Sheet is available in Actual of Fact Sheet folder. In Fact Sheet folder, Balance sheet and Profit & Loss are available in the level below “All …” No Financial Overview is available in such levels. Balance Sheet, Profit & Loss and Financial overview are available in the Industry level only. Go to Table of Contents

Really Good Useful Tips - Other than Screener - Part 8
How to change the Landing page to other than Live CM News? Tools > Settings > General Tab Select Default Combo box to drop down to choose the page of choice. Click on Apply button Close the session. Open Capitaline to confirm that Capitaline lands on the default page selected and applied
How to set lesser or More financial Years? Tools > Settings > General Tab Supply the number directly in No. of financial Years list box in display options group or use the up and down arrow buttons of the list box. Click on Apply button. Click on the same/other data page in Finance folder of Company group to observe the change in the number of years for which the data is presented.
How to export to other processing documents and spread sheets, by default? Ensure that preferred applications are installed properly and working fine Tools > Settings > General Tab. Click on the choices of preferences – Star Office or Open Office. Click on Apply button. Click on Word and Excel buttons to confirm the export to the applied preferences
How to create Short cut to Live CM News? Click on Live-CM News tab. Click on a section of CM-Live News of CM News in Tree View menu Click on a caption of interest in the top pane of the right hand side news window Maximize the bottom news story pane by pulling the pane divider to the topmost position Right click to produce shortcut menu to click on “Create Short cut”. Confirm to create. Exit Capitaline. Double click on the created short cut to follow the news story. Move to different pages and stories too!
How NOT to overwrite the spread sheet? First sheet in the sub menu of Open Existing File option of Excel List box in Icon Menu bar 2 overwrites the existing first sheet. If the existing First sheet is to remain, follow any of the following three;
1. Choose New Sheet in the sub menu of Open Existing File option of Excel List box and after the export, move the exported sheet to the beginning of the workbook by drag & drop.
2. Open the workbook by a double click. Click on the First sheet. Save, Close & Exit Excel. Choose New Sheet in the sub menu of Open Existing File option of Excel List box.
3. Insert a new empty sheet in the beginning of the work book. Cursor is in first cell of first row. Do not move anywhere else. Save and Close the work book and Exit Excel. Choose First Sheet in the sub menu of Open Existing File option of Excel List box
How to include a different Company‟s data page in Excel?
Create a copy of the spread sheet. Add Ins tab > Update > Select Company Click on the Select Company combo box, type the starting characters of the company of choice and hit enter The list box portion of the Select Company combo box opens up with the list of companies whose names start with the entered characters. Click on a Company of choice to watch the update process
To Remember
No need to exit and open Capitaline in order to effect the applied changes in number of Financial years Remember to change the name of the sheet by right click to choose Rename and rename the sheet Go to Table of Contents

Summary of Short cut Menus – Part 1
Short cut menu is the menu produced by right or left clicks of the mouse button depending on the set up of the mouse. The name “short cut” originated from the shortest route to access the menu items that is by a single click than a normal menu, then sub menu and then submenu that are different levels of menus and submenus to access the menu item. Presently, the short cut menus offer new menu options too - the menu options that are not available in the regular menus. Other than the availability of access to new and existing menu options, these short cut menus offer the minimized movement of the mouse meaning the mouse does not need to be moved from the current position in the screen to the top portion of the screen where the menu bars appear. Short cut menus are screen sensitive and again within a particular screen these short cut menus offer different options depending on in which pane or window short cut menus are invoked. Again, within the data pane, depending on the particular positions, different options of menu are produced. Click on Live CM News tab. Right click on Tree View pane to produce short cut menu of options View Offline and Online. Right click on top or bottom pane, not on the captions. Right click on the empty space of either top or bottom pane to invoke short cut menus to find the appearance of same short cut menus Some options are not available and are indicated so by the gray color Right click on a caption to find the appearance of same short cut menus Observe that Back menu option is brighter and so is an available option now. Click on Back to view the last visited page. Right click on top and bottom panes to click on Forward.
Create Short cut Create Short cut creates a short cut to the active page by a desktop icon. This is a very important and useful route to avail the data page for a later intensive study for future references. These short cuts are placed on the system‟s desktop and are invoked by a double click on them. Such short cuts offer data presentation even when Capitaline's session is over. Yet, internet connectivity needs to be available. Double click on such created short cuts to open up. Click on the hyperlinks – captions to watch the detailed story. Click on the page numbers to transit to different pages to click on the caption of interest to read the detailed stories. If a data page is of regular interest, the same page may be added to Favorites folder in the browser by choosing the Add to Favorites option available in the short cut menu. Click on Google Side wiki to publish and share Capitaline's important gatherings with colleagues and clients.
To Remember Short cut menus offer different options depending on the levels - First level is Screen or window, Second level is data pane within the screen or window and Third level is particular location within the data pane within the screen or window Go to Table of Contents

Summary of Short cut Menus – Part 2
Click on My Notes tab Click on New. Move the mouse to the Notes pop up. Right click to invoke short cut menu. Use all the editing options such as Copy to copy the text from other sources such as internet pages and documents etc and Paste the copied text in the Notes Click on My Books tab Right click to invoke short cut menu - Delete, Rename, Save and Show Remark Show Remark is the memo entered in the Note Section of the Add to My Books pop up No short cut menus are available in Custom Screener tab Click on Screener tab Right click on left hand side Tree View pane to invoke short cut menu of options Folder Options and Refresh. Folder Options provides Add Folder, Rename a Folder and Delete Folder. Folder Options also supports in moving the folder within or out of other folders. After the changes, right click on left hand side Tree View pane to refresh to view the effected changes In Domain tab, Advanced Search text box offers the standard short cut menu options such as Undo, Cut, Copy, Paste, Delete and Select All The Fields Search text box in Filters tab offers the standard short cut menu options such as Undo, Cut, Copy, Paste, Delete and Select All Select As Individual and Select As Group are two different toggle short cut menus available inside the Fields Box In Filters tab, Show Criteria Value text box in Criteria Values option group offers the standard short cut menu options such as Undo, Cut, Copy, Paste, Delete and Select All
Preview Preview - Aggregate or Non Aggregate offers the same short cut menus Right click anywhere other than in the Column Headers to invoke the short cut menu of Add Custom Column, Change Output Format and Apply Criteria across Right click anywhere in the Column Headers to invoke the short cut menu of Delete Column, Delete All Columns, Copy Field Name in addition to Add Custom Column, Change Output Format and Apply Criteria across Right click in the Criteria row of any column to invoke a short cut menu of Enter Formula, Add Custom Column, Change Output Format and Apply Criteria across Click once to select a cell in Criteria row. Click once more to change to Edit mode. Short cut menu invoked in Edit mode offers the standard short cut menu options such as Undo, Cut, Copy, Paste, Delete and Select All
To Remember Preview offers four short cut menus depending on where the short cut menu was invoked Go to Table of Contents

Summary of Short cut Menus – Part 3
Click on the Formulae tab Combo boxes - Formula folder and individual Formula combo boxes and Text boxes - Description and Formula definition text boxes offer the standard short cut menu options such as Undo, Cut, Copy, Paste, Delete and Select All Click on C button and select a Company from the second combo box Financial overview of the chosen company presents itself Right click to produce the short cut menu. The short cut menu is same as in Output of Screener
Chart Identify and locate the data parameter for which we want to prepare the Chart Say, Equity paid up. Click on the cell Right click to click on Select Row. The row is selected with all the years‟ data Suppose we do not want certain year's data for the chart. Click on the cell of the particular year, holding the control key Right Click to click on Chart. Chart appears By default, the bar chart appears.
Change the type and form of the chart Right click on the chart to produce the short cut menu Choose 2d or 3d and click on one of the two to produce line or area chart Click on the data page to clear and exit chart pop up
How to produce chart for multiple continuous data? Say, chart for Equity, Net worth, Capital Employed and Gross Block Click on the cell Equity. Right click to choose Select Row. The row is selected with all the years‟ data. For the continuous selection, hold Shift and Control keys together and click on the first cell of the last row of the intended selection that is Gross Block. So, there's a continuous selection from Equity to Gross Block. Say, we do not want some years‟ data. Hold Control key and click on the corresponding cells. Right click to click on Chart to produce the chart for selected data parameters.
To Remember Select, using Shift and or Control keys, the data parameter for which chart is to be prepared Right click on the chart to produce the short cut menu to change the chart‟s type and form Go to Table of Contents

Summary of Short cut Menus – Part 4
Click on C button and select a Company from the second combo box Financial overview of the chosen company presents itself Right click to produce the short cut menu. The short cut menu is same as in Output of Screener
How to produce chart for multiple discrete data? Discrete means they are not continuous in data presentation - say, Equity, Gross Block and PAT. Click on the cell Equity. Right click to Choose Select Row. The row is selected with all the years‟ data. To include Gross Block, hold Control and click on Gross Block Hold Control and Shift keys and click on last cell of the Gross Block Similarly, do the selection for PAT Right click to click on Chart to produce the chart for selected data parameters Right click on the chart to produce the short cut menu Choose 2D or 3D and click on one of the two to produce line or area chart Click on the data page to clear and exit chart pop up
Tree View menu setting Click on Tools in Main Menu Bar Click on Settings in the sub menu Click on Tree View Setting tab Right click on the right hand side box to produce short cut menu of options – Delete, Rename, Move To, New Group, Clear and Clear ALL
To Remember In Tree View menu Setting, Use the Up and Down Arrows to the right of the right hand side box than short cut menu Move To. These arrows are much swifter. Try moving a Data page or a Data group to a group in a group Go to Table of Contents

SCREENER
MODULE

.
CAPITALINE SCREENER
SCREENER, is a powerful query module that helps user to filter the companies based on certain criteria. Tab Details : 1. Domain : To select the companies ( Based on Industry, Indices, Business Group) 2. Filter : To select the fields ( Balance Sheet, P&L, Working Results) 3. Output : Gives the data after running queries 4. Formula : User can build their own formula using capitaline database fields. 5. Delete Peer Set: To delete peer set defined by the user. 6. Export Peer Set: To export the defined set to another user. 7. Import Peer Set: To import peer set defined by another user
Click On ‘S’ to get Screener Section

After selecting the required companies from the Domain tab user can move to Filter tab, which will help user to define various financial & non-financial parameters for single or multiple years.
Select Index
Individual Company Name Search
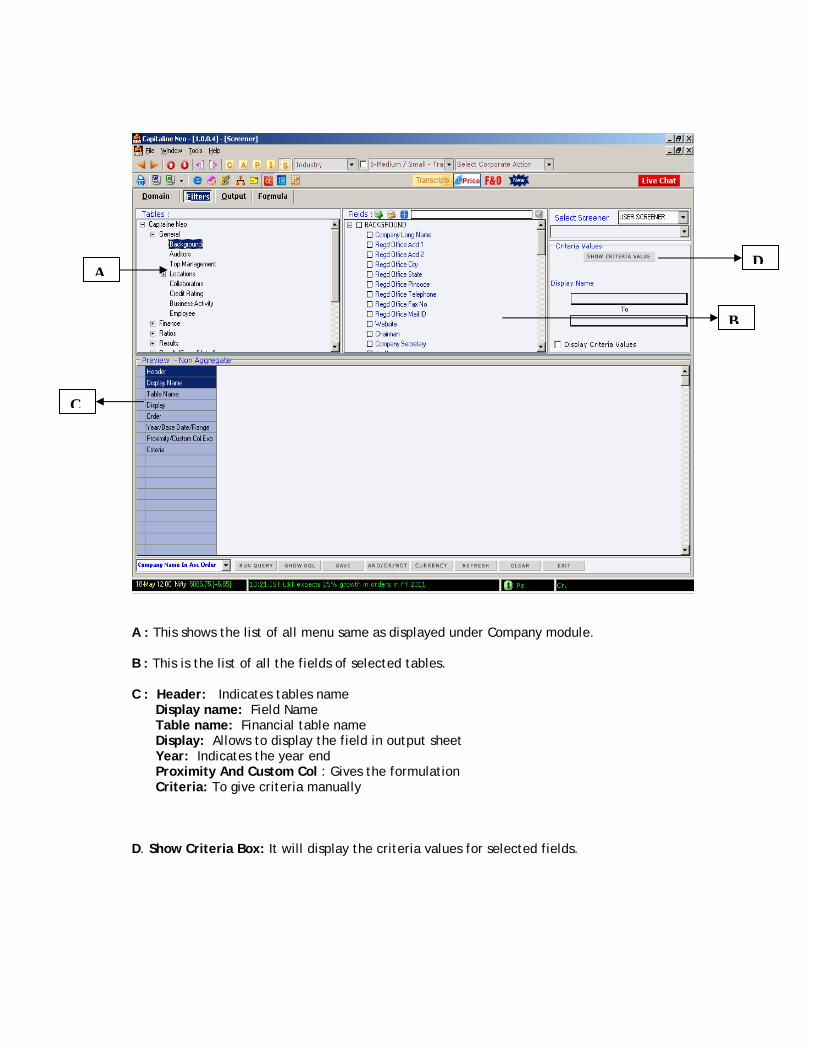
A : This shows the list of all menu same as displayed under Company module. B : This is the list of all the fields of selected tables. C : Header: Indicates tables name Display name: Field Name Table name: Financial table name Display: Allows to display the field in output sheet Year: Indicates the year end Proximity And Custom Col : Gives the formulation Criteria: To give criteria manually D. Show Criteria Box: It will display the criteria values for selected fields.
A
B
C
D

A : To select the field tick mark on the required Financial fileds. B : Here User can select multiple fields from the fields box. C : Run Query: To run a query to generate output Show Sql: Sql statement of defined query
Save: to save the defined query with description.
And/Or/Not: To change the conditions From And to Or
Currency: To apply the currency conversion
Refresh: To refresh the filter and domain
Clear: To clear the filter only. Domain will remain the same.
Exit: To exit from the screener module.
A
BC
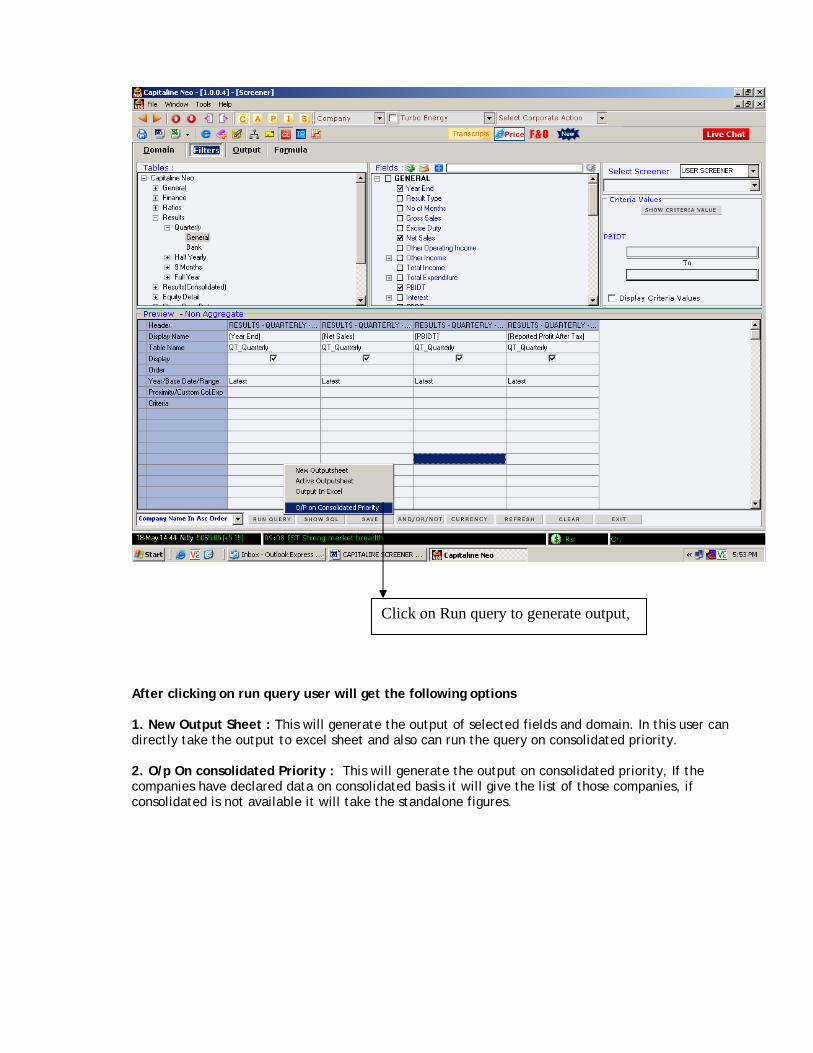
After clicking on run query user will get the following options 1. New Output Sheet : This will generate the output of selected fields and domain. In this user can directly take the output to excel sheet and also can run the query on consolidated priority. 2. O/p On consolidated Priority : This will generate the output on consolidated priority, If the companies have declared data on consolidated basis it will give the list of those companies, if consolidated is not available it will take the standalone figures.
Click on Run query to generate output,
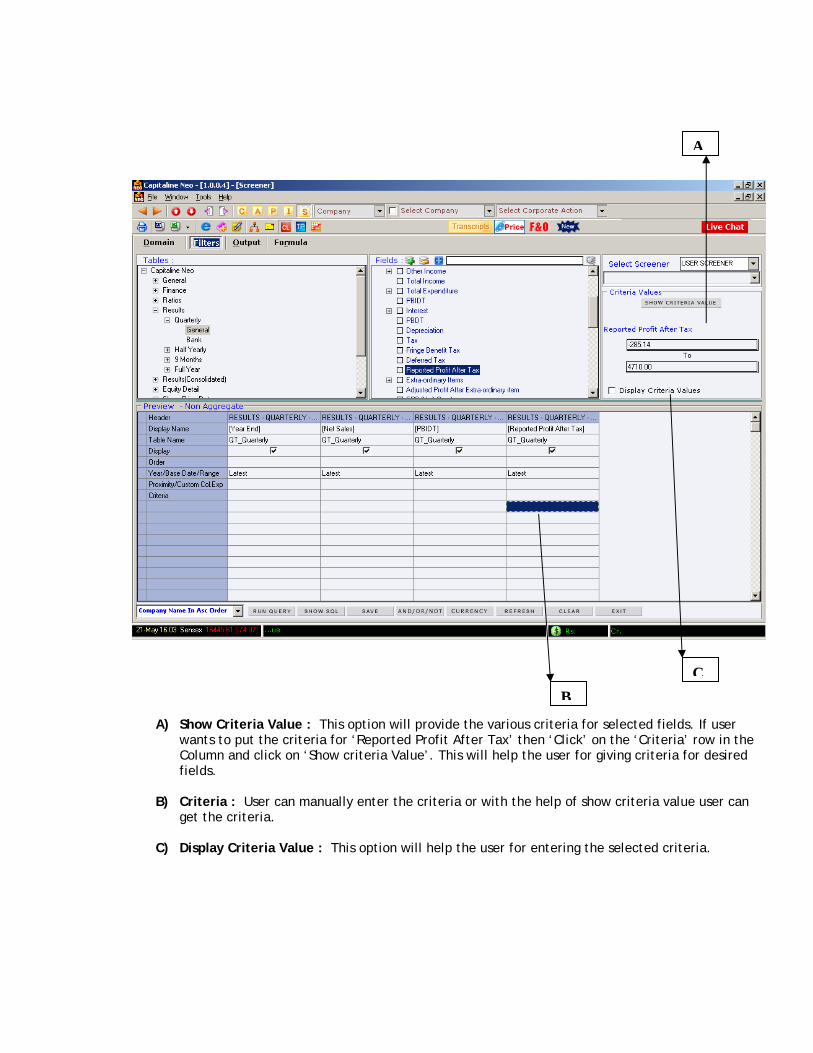
A) Show Criteria Value : This option will provide the various criteria for selected fields. If user wants to put the criteria for ‘Reported Profit After Tax’ then ‘Click’ on the ‘Criteria’ row in the Column and click on ‘Show criteria Value’. This will help the user for giving criteria for desired fields.
B) Criteria : User can manually enter the criteria or with the help of show criteria value user can get the criteria.
C) Display Criteria Value : This option will help the user for entering the selected criteria.
A
BC

OUT PUT, Which shows the name of the companies along with fields selected in the filter. After clicking on Run Query user will get the above output sheet. In this output sheet BLACK color indicates the Consolidated data, while the ORANGE color indicate the Standalone Data.
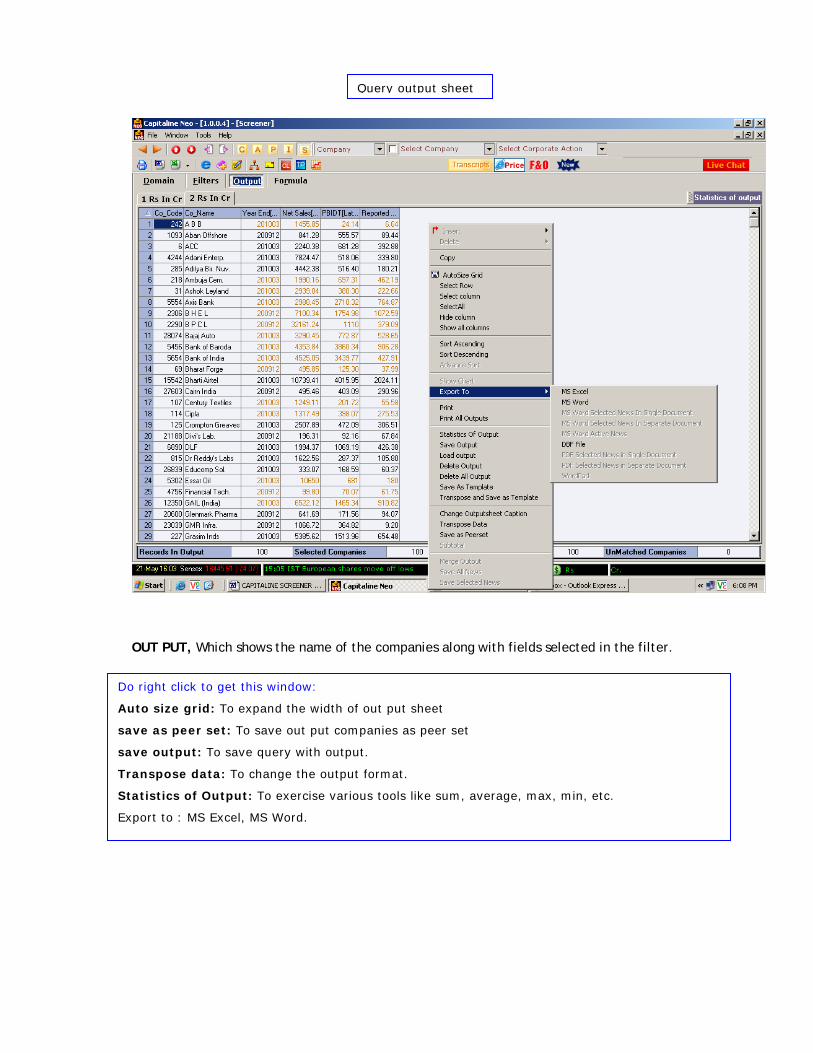
OUT PUT, Which shows the name of the companies along with fields selected in the filter.
Query output sheet
Do right click to get this window:
Auto size grid: To expand the width of out put sheet
save as peer set: To save out put companies as peer set
save output: To save query with output.
Transpose data: To change the output format.
Statistics of Output: To exercise various tools like sum, average, max, min, etc.
Export to : MS Excel, MS Word.
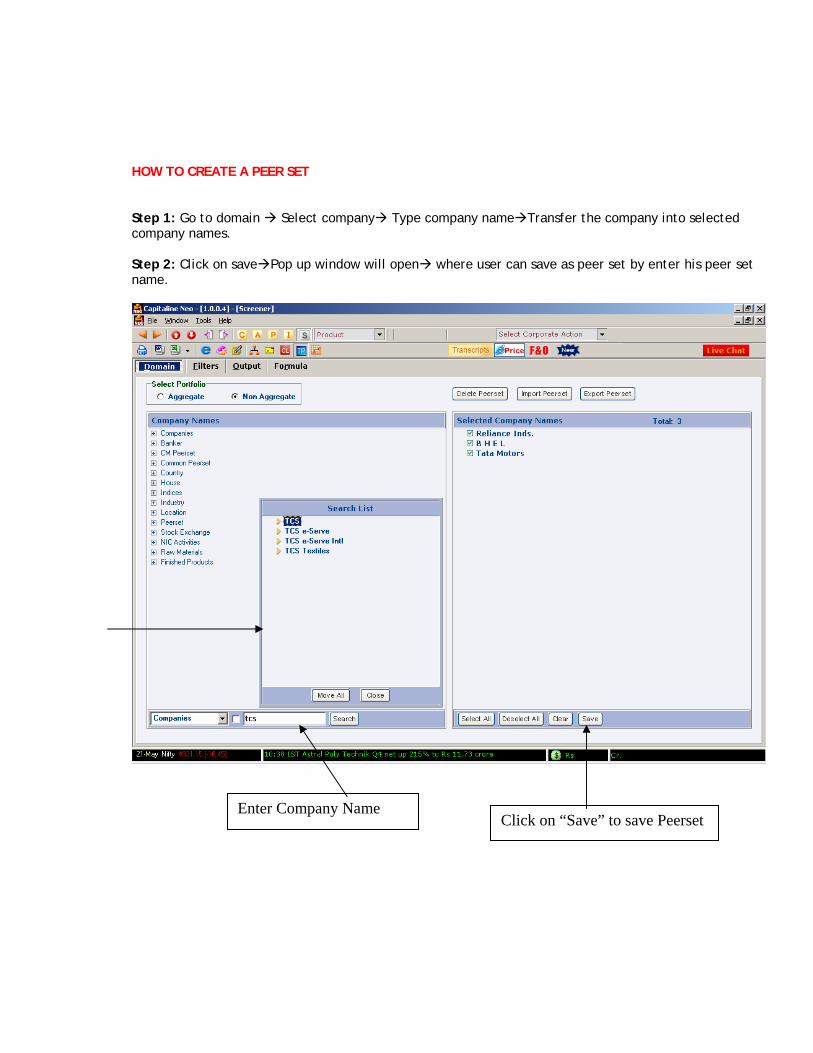
HOW TO CREATE A PEER SET Step 1: Go to domain Select company Type company name Transfer the company into selected company names. Step 2: Click on save Pop up window will open where user can save as peer set by enter his peer set name.
Enter Company Name Click on “Save” to save Peerset

If you click on save (A) this window will open
where
1. give name in the enter peer set name (B)
and click on save the Companies will be saved
as peer set.
2. User can overwrite the existing peer set by
selecting load (C).
3. When you save a peer set, if you activate
“Upload Peer set to Web” the companies which
you selected for peer set can be seen Live Prices
in our E- Price terminal [If it is subscribed]
A
BC

FORMULA
FORMULA, which helps to define formulas by user in his own way
Click here to enter into formula
1. Tables: to be selected appropriate tables 2. Fields: It displays the fields of selected tables. 3. Operators that can be used to define the formulas 4. Selected fields will appear here to save it as formula 5. Refresh: To refresh the formula selection save: Click on Save “save Formula” window will open To save defined formula Delete: To delete the defined formula

HOW TO DEFINE A FORMULA?
Pat growth Step1: Go to formula Step2: Click Capitaline finance Profit and loss general [Do the followings, which will appear in formula definition box.] Click 1. ((Open bracket 2.select reported profit after tax 3.click on division symbol 4 select again reported profit after tax 5.close the bracket) click minus symbol and type 1 close the bracket) click * symbol and type 100 Following Formula will appear in formula definition box. (([AG_Finance]. [Reported Net Profit] / [AG_Finance1].[Reported Net Profit] ) - 1 ) * 100 Click save option to save the formula. Step3: Go to filter user formula select the formula name, which user saved 1 2 3 4 5 6
1. Tables: Consist of relevant tables to be selected. 2. Fields: Consist of financials fields of selected tables. 3. Operators to be used for defining the formula. 4. Formula definition box where use has to select the fields and define the formula 5.Refersh: clear the window. save: To save the defined formula. Delete: To delete the defined formula. 6. Once click on Save this window will open where user can name the defined formula.

SAMPLE QUERIES Query 1: Mumbai based companies along with industry name, BSE code, NSE Symbol and Business Group Name. Step1: Go to Domain Select All Companies [See Picture1: 1]
Step2: Go to Filter Select Capitaline (from table) general background select following fields. [See
Picture 1:2]
Regd, office address,
City and State,
Industry name, BSE code and NSE symbol
and Business Group name (from fields)
Step3: Run query new output sheet. [See Picture 1:3]
Picture 1:1
Click on “S” to enter into screener.
Click here to select all companies
Transfer here all companies to get selected

S Picture 1:2
Tables 1.Open Tables
General background 2.Select (double click) fields from here, which will appear in preview table. 3.Place “mouse” in criteria cell of ‘Regd. Office City field’ then click Show Criteria Value where type city name and double click on city name “Mumbai” which will appear in criteria cell.
Click here to enter into filter
Run Query New out put sheet
1.
2.
3.
Show Criteria Value

Picture 1:3
Output shows Mumbai based companies along with address and industry name etc.
Click here to export to excel

Query 2: Query on Sales, Pat, Operating Profit and EPS for BSE 500 companies for last two years. Step: 1 Go to domain select index BSE 500[See Picture 2:1] Step: 2 Go to Filter open Capitaline finance Profit and Loss General Select Following fields. [See
Picture 2:2]
Year End
Sales Turnover
Operating Profit
Reported Net Profit and EPS
Step: 3 Run Query New Output Sheet [See Picture 2:3]
Picture 2:1
Click here to select index (BSE 500) then transfer into selected company names box

A)Open Tables Finance profit and loss general (In Table) B) Select (Double click) on Year end Sales Operating profit reported net Profit EPS (From Field box)
A
B
Double click on Latest to get more number of years

Picture 2:2
Run Query New Output Sheet User will get out put for last 2 years sales pat etc for Selected BSE 500 companies.
Double Click Here to select 2 and then click “Yes” from command box ( To get last 2 years data )

Picture 2:3
Do Double click here on any field head to arrange ascending/descending order