Embed Size (px)
Citation preview

1
OPPORTUNITIES AND CHALLENGES IN INDONESIA’S AUTOMOTIVE INDUSTRY
February 2016

2
Executive Summary
• Over the next five years the passenger vehicle segment will remain very attractive, while growth of the commercial vehicle segment will be slower
– Passenger vehicle (PV) growth is estimated at CAGR 6.8% to 2020
– Motorcycle (MC) growth is estimated at CAGR 4.8% to 2020
– Truck growth is estimated at CAGR 3.5% to 2020
– Bus growth is estimated at CAGR 1.9% to 2020
• Greater Jakarta will remain the key region driving PV and CV growth, while demand from medium and smaller-sized cities is expected to increase over the next decade
• In the PV segment, the lo- cost green car segment (LCGC) is expected to experience the fastest growth at CAGR 8.1% to 2020
• In the truck segment, the gasoline light-duty truck segment (GLDT) is expected to experience the fastest growth at CAGR 4.6% to 2020
• In the bus segment, the medium-duty bus segment (MDB) is expected to experience the fastest growth at CAGR 3.2% to 2020
3
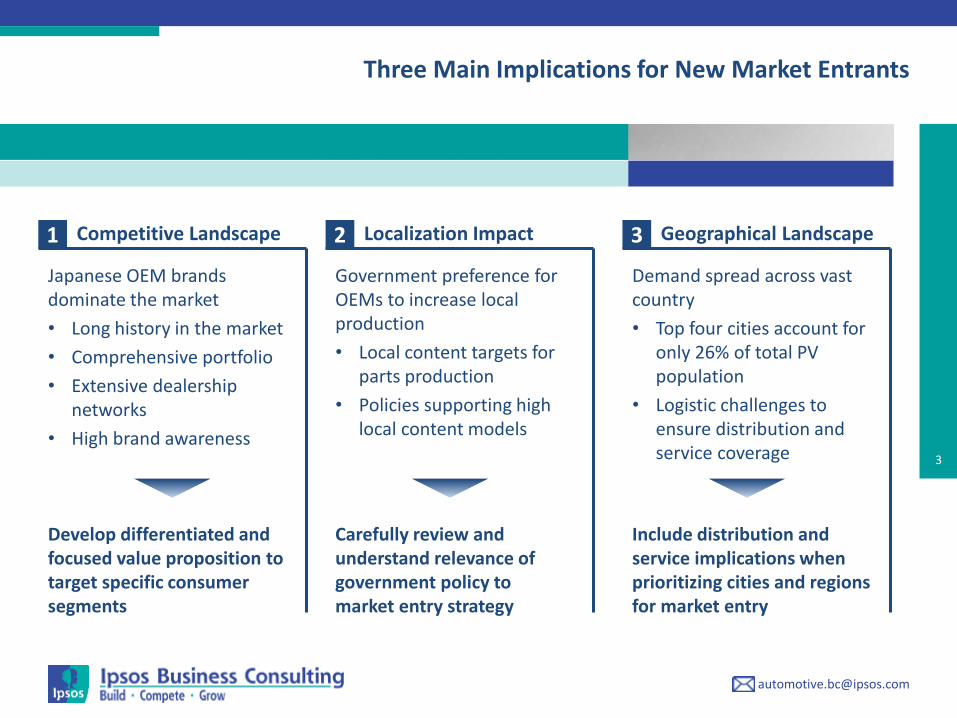
Three Main Implications for New Market Entrants
1 2 3 Competitive Landscape Localization Impact
Japanese OEM brands dominate the market
• Long history in the market
• Comprehensive portfolio
• Extensive dealership networks
• High brand awareness
Develop differentiated and focused value proposition to target specific consumer segments
Include distribution and service implications when prioritizing cities and regions for market entry
Carefully review and understand relevance of government policy to market entry strategy
Geographical Landscape
Government preference for OEMs to increase local production
• Local content targets for parts production
• Policies supporting high local content models
Demand spread across vast country
• Top four cities account for only 26% of total PV population
• Logistic challenges to ensure distribution and service coverage
4
1. PASSENGER VEHICLE AND MOTORCYCLE MARKET TRENDS 2. COMMERCIAL VEHICLE MARKET TRENDS
3. ABOUT IPSOS BUSINESS CONSULTING
5
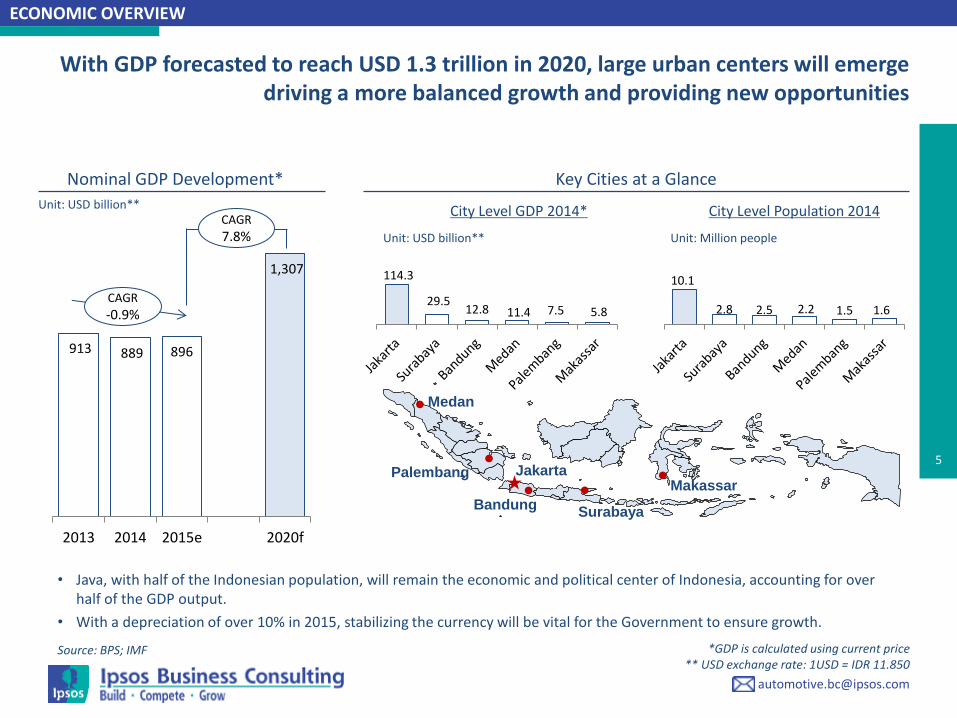
Unit: USD billion**
114.3
29.5 12.8 11.4 7.5 5.8
10.1
2.8 2.5 2.2 1.5 1.6
City Level GDP 2014* City Level Population 2014
• Java, with half of the Indonesian population, will remain the economic and political center of Indonesia, accounting for over half of the GDP output.
• With a depreciation of over 10% in 2015, stabilizing the currency will be vital for the Government to ensure growth.
Nominal GDP Development* Key Cities at a Glance
ECONOMIC OVERVIEW
Makassar
Bandung Surabaya
Medan
Jakarta Palembang
Unit: USD billion** Unit: Million people
913 889 896
1,307
2013 2014 2015e 2020f
CAGR
7.8%
CAGR
-0.9%
*GDP is calculated using current price ** USD exchange rate: 1USD = IDR 11.850
With GDP forecasted to reach USD 1.3 trillion in 2020, large urban centers will emerge driving a more balanced growth and providing new opportunities
Source: BPS; IMF
6
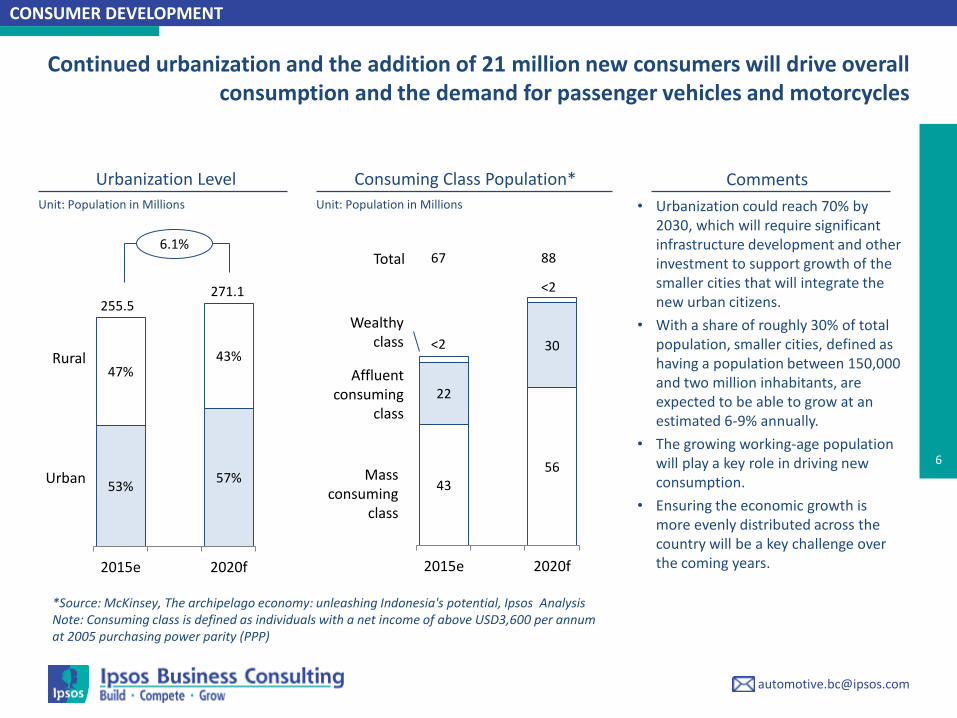
43 56
22
30
2015e 2020f
Unit: Population in Millions
Urbanization Level Consuming Class Population*
*Source: McKinsey, The archipelago economy: unleashing Indonesia's potential, Ipsos Analysis Note: Consuming class is defined as individuals with a net income of above USD3,600 per annum at 2005 purchasing power parity (PPP)
Affluent consuming
class
Mass consuming
class
Wealthy class
67 88
<2
<2
53% 57%
47% 43%
2015e 2020f
Unit: Population in Millions
Urban
Rural
CONSUMER DEVELOPMENT
255.5 271.1
Continued urbanization and the addition of 21 million new consumers will drive overall consumption and the demand for passenger vehicles and motorcycles
6.1% Total
Comments
• Urbanization could reach 70% by 2030, which will require significant infrastructure development and other investment to support growth of the smaller cities that will integrate the new urban citizens.
• With a share of roughly 30% of total population, smaller cities, defined as having a population between 150,000 and two million inhabitants, are expected to be able to grow at an estimated 6-9% annually.
• The growing working-age population will play a key role in driving new consumption.
• Ensuring the economic growth is more evenly distributed across the country will be a key challenge over the coming years.
7
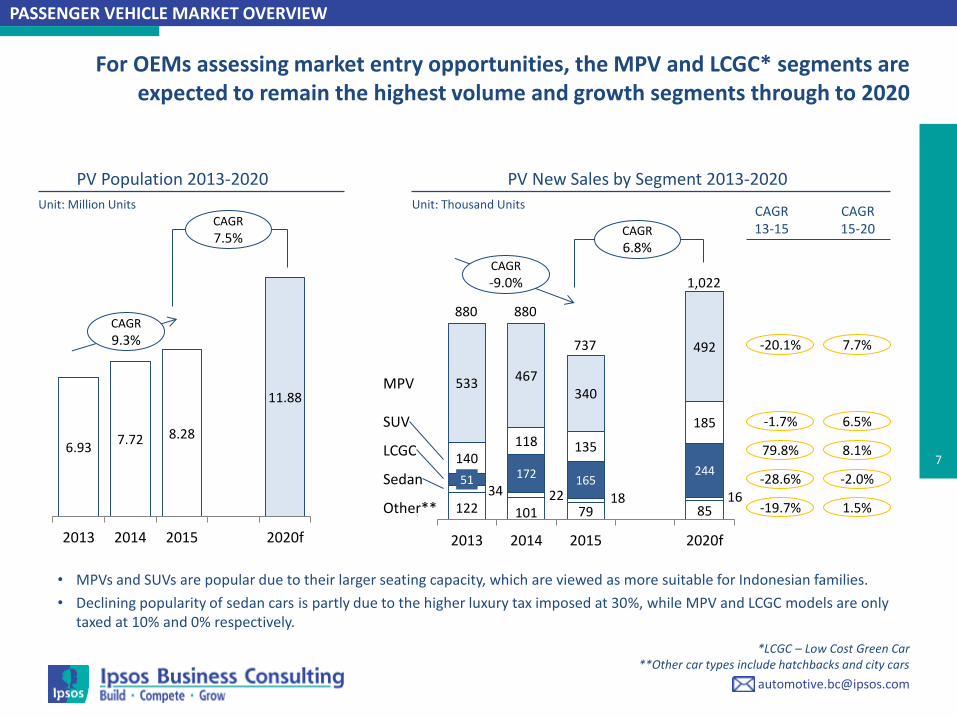
For OEMs assessing market entry opportunities, the MPV and LCGC* segments are expected to remain the highest volume and growth segments through to 2020
6.93 7.72 8.28
11.88
2013 2014 2015 2020f
CAGR
7.5%
CAGR
9.3%
Unit: Million Units
PV Population 2013-2020
122 101 79 85
34 22 18 16 51 172 165
244 140
118 135
185
533 467 340
492
2013 2014 2015 2020f
Unit: Thousand Units
CAGR
-9.0%
CAGR
6.8%
CAGR 13-15
-20.1%
-1.7%
79.8%
-28.6%
-19.7%
PV New Sales by Segment 2013-2020
PASSENGER VEHICLE MARKET OVERVIEW
CAGR 15-20
7.7%
6.5%
8.1%
-2.0%
1.5%
*LCGC – Low Cost Green Car **Other car types include hatchbacks and city cars
880 880
737
1,022
MPV
SUV
LCGC
Sedan
Other**
• MPVs and SUVs are popular due to their larger seating capacity, which are viewed as more suitable for Indonesian families.
• Declining popularity of sedan cars is partly due to the higher luxury tax imposed at 30%, while MPV and LCGC models are only taxed at 10% and 0% respectively.
8
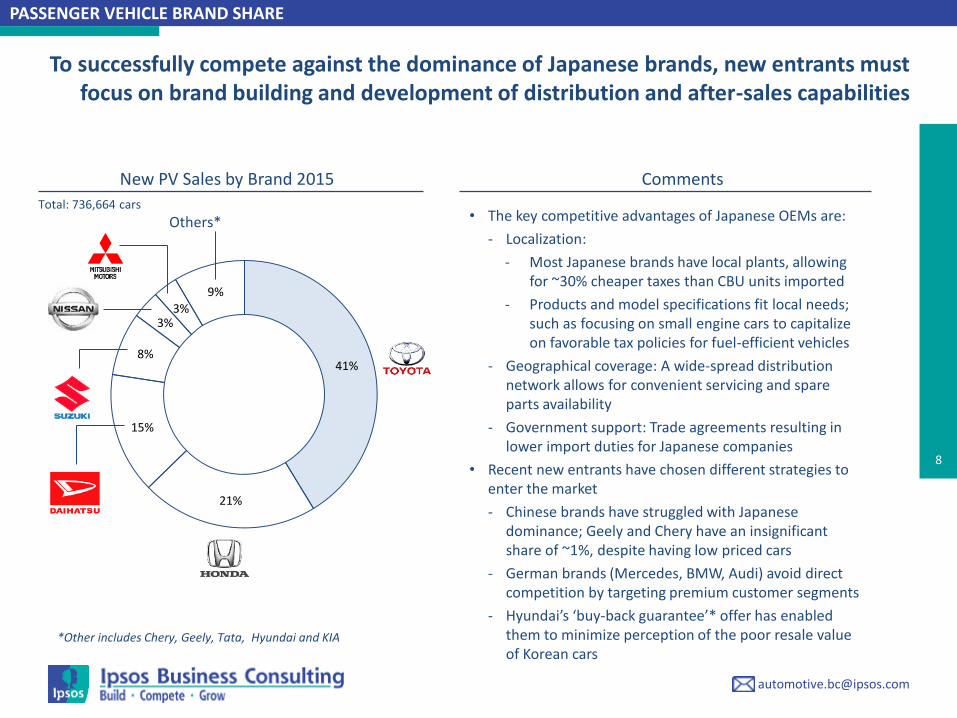
41%
21%
15%
8%
3% 3%
9%
Total: 736,664 cars • The key competitive advantages of Japanese OEMs are:
- Localization:
- Most Japanese brands have local plants, allowing for ~30% cheaper taxes than CBU units imported
- Products and model specifications fit local needs; such as focusing on small engine cars to capitalize on favorable tax policies for fuel-efficient vehicles
- Geographical coverage: A wide-spread distribution network allows for convenient servicing and spare parts availability
- Government support: Trade agreements resulting in lower import duties for Japanese companies
• Recent new entrants have chosen different strategies to enter the market
- Chinese brands have struggled with Japanese dominance; Geely and Chery have an insignificant share of ~1%, despite having low priced cars
- German brands (Mercedes, BMW, Audi) avoid direct competition by targeting premium customer segments
- Hyundai’s ‘buy-back guarantee’* offer has enabled them to minimize perception of the poor resale value of Korean cars
Others*
New PV Sales by Brand 2015 Comments
PASSENGER VEHICLE BRAND SHARE
To successfully compete against the dominance of Japanese brands, new entrants must focus on brand building and development of distribution and after-sales capabilities
*Other includes Chery, Geely, Tata, Hyundai and KIA

9
Number of PV Car Models 2010-2015
1 2 2 3 1 1
6 3 1
1
1
1
1 1
3
2
1 1
2 2
6
3
3 3 5
3
Toyota Honda Daihatsu Suzuki Nissan Mitsubishi
Number of PV Models by Segment 2015
189
209
2010 2015
As the PV market becomes more mature, providing consumers with a well rounded portfolio will be necessary for OEMs targeting the low- to mid-end segment
17 11 8 8 9 6 10.6%
MPV
SUV
LCGC
Sedan
Other**
Total
PASSENGER VEHICLE MODELS
• Total increase in PV models is attributed to the introduction of LCGC and an increase in the number of SUV and sedan models, which have increased by ~30% and ~10% since 2010 respectively.
• The number of models available to consumers is expected to increase as competition increases in the LCGC segment and more OEMs enter the market.
*LCGC – Low-Cost Green Car
**Other car types include hatchbacks and city cars

10
Estimated Number of Dealerships in 2015
69
27 35
20 24 23
12
5
11
5 6 6
17
5
12
4 3 7
12
3
6
5 3 2
Toyota Honda Daihatsu Suzuki Nissan Mitsubishi
Comments
With the highest dealership density, the strong competitive position of the incumbent brands must be diligently assessed to achieve successful market entry into Jakarta
190
130
230
145
110
240
Medan
Bandung
Surabaya
Jakarta
DEALERSHIP DISTRIBUTION
90
166
111 74
202
300
Other cities
• Astra International, Indonesia’s incumbent automotive distributor, holds exclusive dealership rights for Toyota and Daihatsu, accounting for over 50% of new car sales
• To manage Toyota’s network of 300 dealerships and 840 spare part shops, Astra cooperates with seven main dealer companies including Auto 2000, Nasmoco, and PT Hadji Kalla
• Typical challenges faced by distributors when expanding dealership networks include:
- Long lead time: lengthy bureaucratic and land clearing process
- High investment: land purchase from USD 230,000 to 2,500,000, construction from USD 110,000 to 1,200,000
- Concerns over the scale of demand and return-on-investment, especially for setting up networks in smaller cities

11
The introduction of the LCGC segment in 2013 has been very successful and is expected to remain a key driver of new PV sales through to 2020
51.2 172.1 165.4
232.0
2013 2014 2015 2020f
CAGR
8.1%
CAGR
79.8%
Unit: Thousand Units
LCGC New Sales by Volume 2013-2020
34%
22% 19%
18%
7%
LCGC New Sales by Brand Share 2015
DEEP DIVE – LOW-COST GREEN CAR SEGMENT
Comments
• The LCGC segment was launched at the end of 2013 and has experienced significant growth, today accounting for ~20% of total PV new sales.
• LCGC is an attractive vehicle due to:
– Low entry level price. Roughly 17% cheaper than an entry level MPV, LCGC is an affordable alternative as an additional vehicle for first time car buyers and motorcycle owners trading up
– Easier and cheaper credit financing options are available
– Exemption from the luxury tax scheme allowing LCGC to be sold at a cheaper price
– Fuel efficiency, due to its small engine (1,000-1,200cc), the LCGC officially travels at least 20km/L
• LCGC future trend:
– 40% local content requirement to be increased to 80% in five years time
– Increased export activity with first exports to the Philippines in 2014 by PT Astra Daihatsu Motor
– JV between GM, Wuling, and SAIC expected to begin production of its MPV LCGC in Indonesia in 2017
– Other expected investments in LCGC production
12
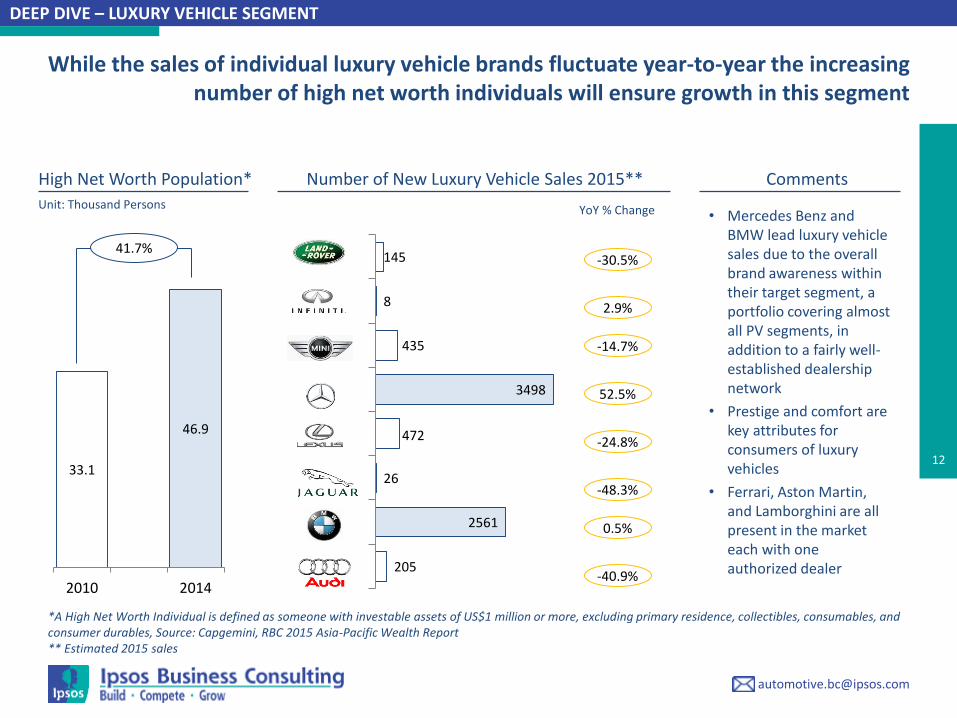
High Net Worth Population* Number of New Luxury Vehicle Sales 2015**
33.1
46.9
2010 2014
While the sales of individual luxury vehicle brands fluctuate year-to-year the increasing number of high net worth individuals will ensure growth in this segment
41.7%
Unit: Thousand Persons
205
2561
26
472
3498
435
8
145
YoY % Change
-30.5%
52.5%
-24.8%
-48.3%
0.5%
-40.9%
2.9%
-14.7%
*A High Net Worth Individual is defined as someone with investable assets of US$1 million or more, excluding primary residence, collectibles, consumables, and consumer durables, Source: Capgemini, RBC 2015 Asia-Pacific Wealth Report ** Estimated 2015 sales
DEEP DIVE – LUXURY VEHICLE SEGMENT
Comments
• Mercedes Benz and BMW lead luxury vehicle sales due to the overall brand awareness within their target segment, a portfolio covering almost all PV segments, in addition to a fairly well-established dealership network
• Prestige and comfort are key attributes for consumers of luxury vehicles
• Ferrari, Aston Martin, and Lamborghini are all present in the market each with one authorized dealer
13
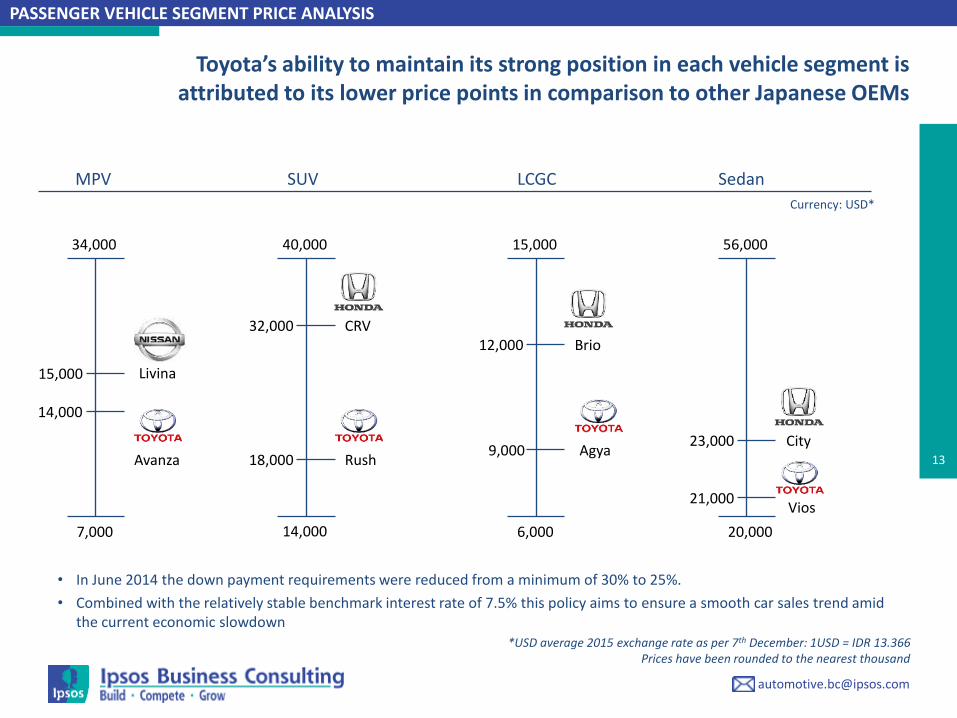
MPV SUV LCGC
34,000 40,000 15,000
7,000 14,000 6,000
Currency: USD*
Sedan
56,000
20,000
Vios
City Agya
Brio
Livina
Avanza Rush
CRV
Toyota’s ability to maintain its strong position in each vehicle segment is attributed to its lower price points in comparison to other Japanese OEMs
*USD average 2015 exchange rate as per 7th December: 1USD = IDR 13.366 Prices have been rounded to the nearest thousand
14,000
15,000
32,000
18,000
12,000
9,000
21,000
23,000
• In June 2014 the down payment requirements were reduced from a minimum of 30% to 25%.
• Combined with the relatively stable benchmark interest rate of 7.5% this policy aims to ensure a smooth car sales trend amid the current economic slowdown
PASSENGER VEHICLE SEGMENT PRICE ANALYSIS
14
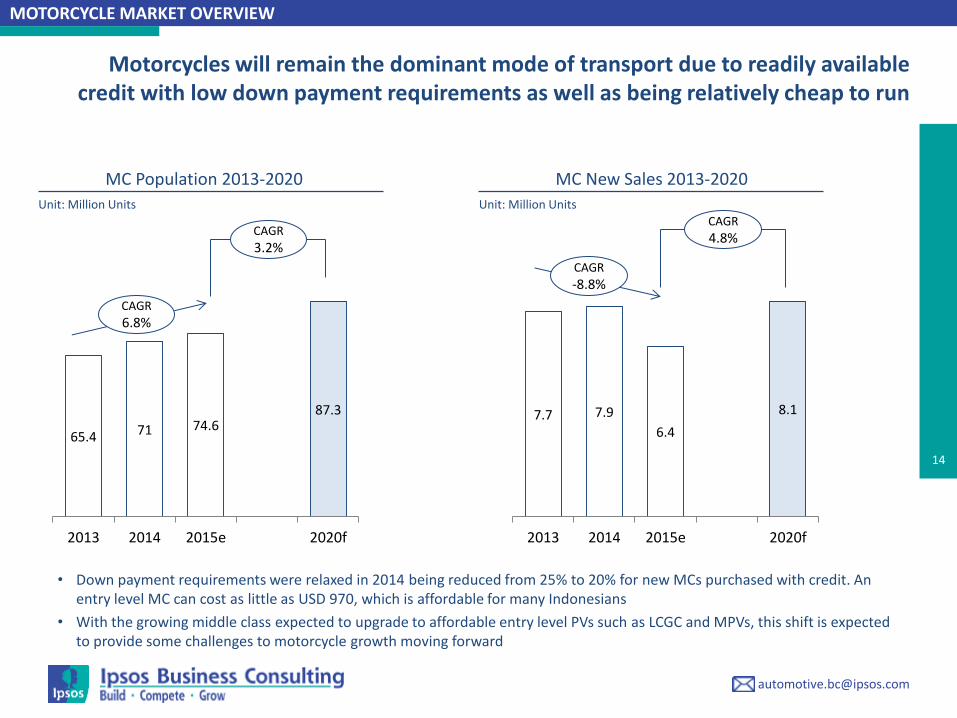
Motorcycles will remain the dominant mode of transport due to readily available credit with low down payment requirements as well as being relatively cheap to run
65.4 71 74.6 87.3
2013 2014 2015e 2020f
CAGR
3.2%
CAGR
6.8%
Unit: Million Units
MC Population 2013-2020
7.7 7.9
6.4
8.1
2013 2014 2015e 2020f
Unit: Million Units
CAGR
-8.8%
CAGR
4.8%
MC New Sales 2013-2020
MOTORCYCLE MARKET OVERVIEW
• Down payment requirements were relaxed in 2014 being reduced from 25% to 20% for new MCs purchased with credit. An entry level MC can cost as little as USD 970, which is affordable for many Indonesians
• With the growing middle class expected to upgrade to affordable entry level PVs such as LCGC and MPVs, this shift is expected to provide some challenges to motorcycle growth moving forward

15
68%
29%
2% 2%
Total: 6,430,543 units
2015 New MC Sales by Brand
Yamaha and Honda maintain their dominant position by focusing on functionality and offer a low purchasing price and maintenance cost to attract price sensitive consumers
Comments
• Japanese MC brands are able to dominate the market by offering Indonesian consumers a very relevant value proposition
- Reasonable prices: MCs are priced to target the lower income customer segment
- Wide distribution network: Authorized workshops cover almost all regions of Indonesia ensuring parts availability and servicing convenience
- Strong Japanese brand image: Functionality and reliability are the key attributes relevant for MCs
- Local manufacturing: Lower production ensures cost competitiveness and design localization catering to domestic consumers
• While the opportunity remains large, other brands have struggled to capture significant market share over the past few years
- Kawasaki’s product range of sport and off-road MCs targets the small premium segment
- TVS’ lack of distribution coverage and limited portfolio has not enabled them to gain a significant share even though they are much cheaper (~25% cheaper than Honda and Yamaha)
MOTORCYCLE BRAND SHARE
Others*
*Other brands include TVS, Kanzen Kawasaki
16
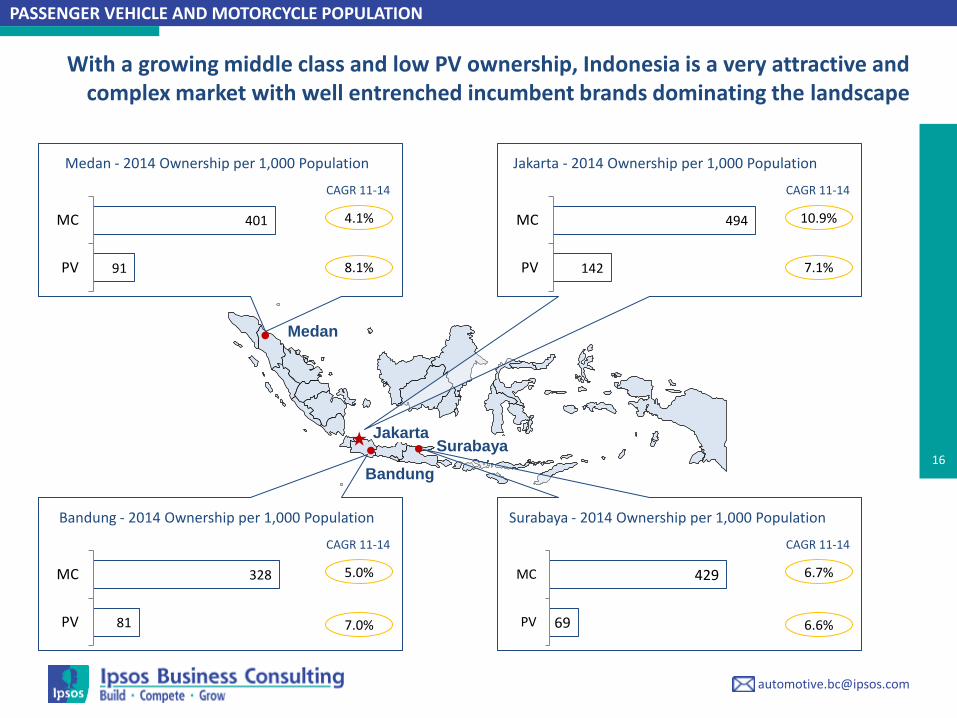
Jakarta
Bandung
Surabaya
Medan
91
401
PV
MC
Medan - 2014 Ownership per 1,000 Population
CAGR 11-14
142
494
PV
MC
Jakarta - 2014 Ownership per 1,000 Population
81
328
PV
MC
Bandung - 2014 Ownership per 1,000 Population Surabaya - 2014 Ownership per 1,000 Population
69
429
PV
MC
CAGR 11-14
CAGR 11-14 CAGR 11-14
7.1%
6.6% 7.0%
8.1%
10.9%
6.7% 5.0%
4.1%
PASSENGER VEHICLE AND MOTORCYCLE POPULATION
With a growing middle class and low PV ownership, Indonesia is a very attractive and complex market with well entrenched incumbent brands dominating the landscape

17
1. PASSENGER VEHICLE AND MOTORCYCLE MARKET TRENDS
2. COMMERCIAL VEHICLE MARKET TRENDS 3. ABOUT IPSOS BUSINESS CONSULTING
18
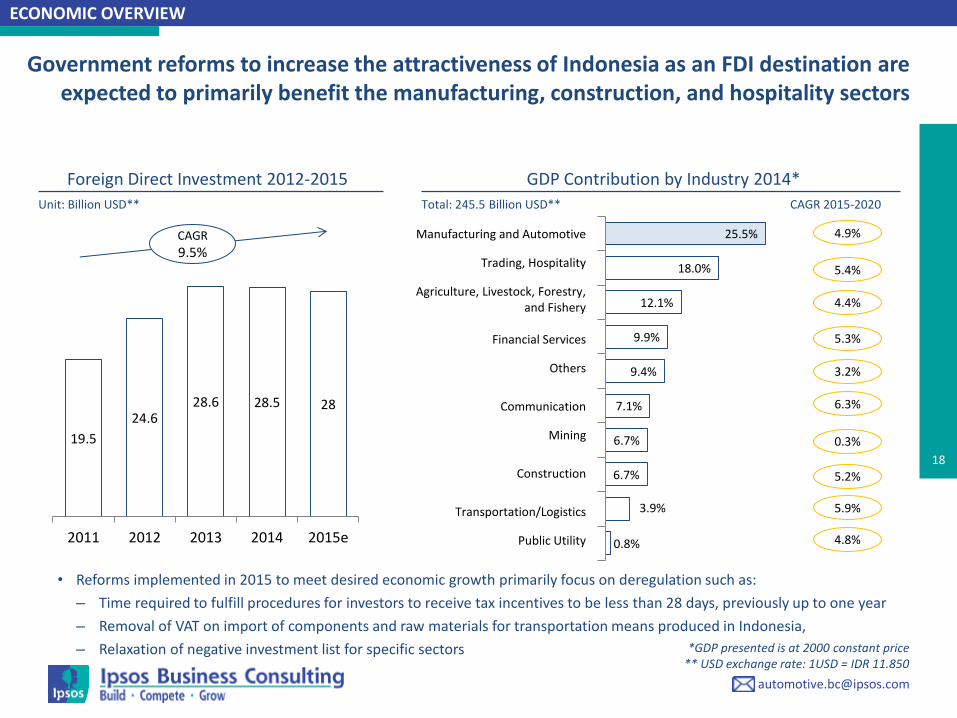
0.8%
3.9%
6.7%
6.7%
7.1%
9.4%
9.9%
12.1%
18.0%
25.5%
Government reforms to increase the attractiveness of Indonesia as an FDI destination are expected to primarily benefit the manufacturing, construction, and hospitality sectors
19.5
24.6 28.6 28.5 28
2011 2012 2013 2014 2015e
CAGR
9.5%
Unit: Billion USD**
Foreign Direct Investment 2012-2015
Total: 245.5 Billion USD**
GDP Contribution by Industry 2014*
ECONOMIC OVERVIEW
Manufacturing and Automotive
Trading, Hospitality
Agriculture, Livestock, Forestry, and Fishery
Financial Services
Others
Communication
Mining
Construction
Public Utility
CAGR 2015-2020
4.9%
5.3%
3.2%
6.3%
0.3%
5.9%
5.2%
5.4%
4.4%
Transportation/Logistics
4.8%
*GDP presented is at 2000 constant price ** USD exchange rate: 1USD = IDR 11.850
• Reforms implemented in 2015 to meet desired economic growth primarily focus on deregulation such as:
– Time required to fulfill procedures for investors to receive tax incentives to be less than 28 days, previously up to one year
– Removal of VAT on import of components and raw materials for transportation means produced in Indonesia,
– Relaxation of negative investment list for specific sectors
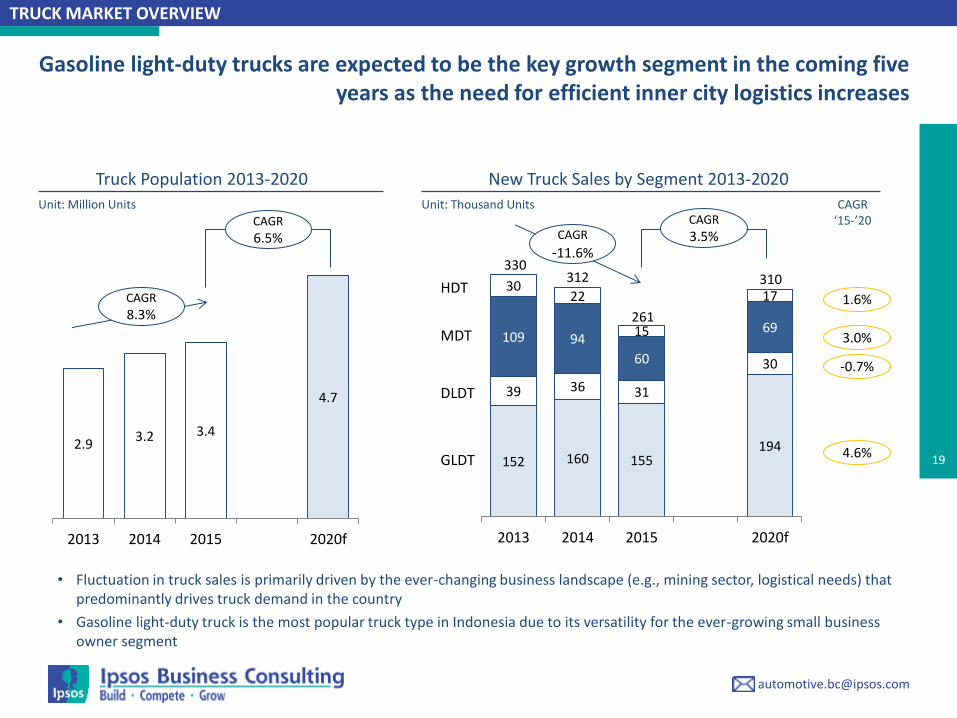
19 2.9
3.2 3.4
4.7
2013 2014 2015 2020f
CAGR
6.5%
CAGR
8.3%
Unit: Million Units
Truck Population 2013-2020
152 160 155 194
39 36 31
30
109 94
60
69
30 22
15
17
2013 2014 2015 2020f
Unit: Thousand Units
CAGR
-11.6%
CAGR
3.5%
CAGR ‘15-’20
1.6%
3.0%
-0.7%
4.6%
New Truck Sales by Segment 2013-2020
TRUCK MARKET OVERVIEW
Gasoline light-duty trucks are expected to be the key growth segment in the coming five years as the need for efficient inner city logistics increases
330 312
261
310 HDT
MDT
DLDT
GLDT
• Fluctuation in truck sales is primarily driven by the ever-changing business landscape (e.g., mining sector, logistical needs) that predominantly drives truck demand in the country
• Gasoline light-duty truck is the most popular truck type in Indonesia due to its versatility for the ever-growing small business owner segment
20
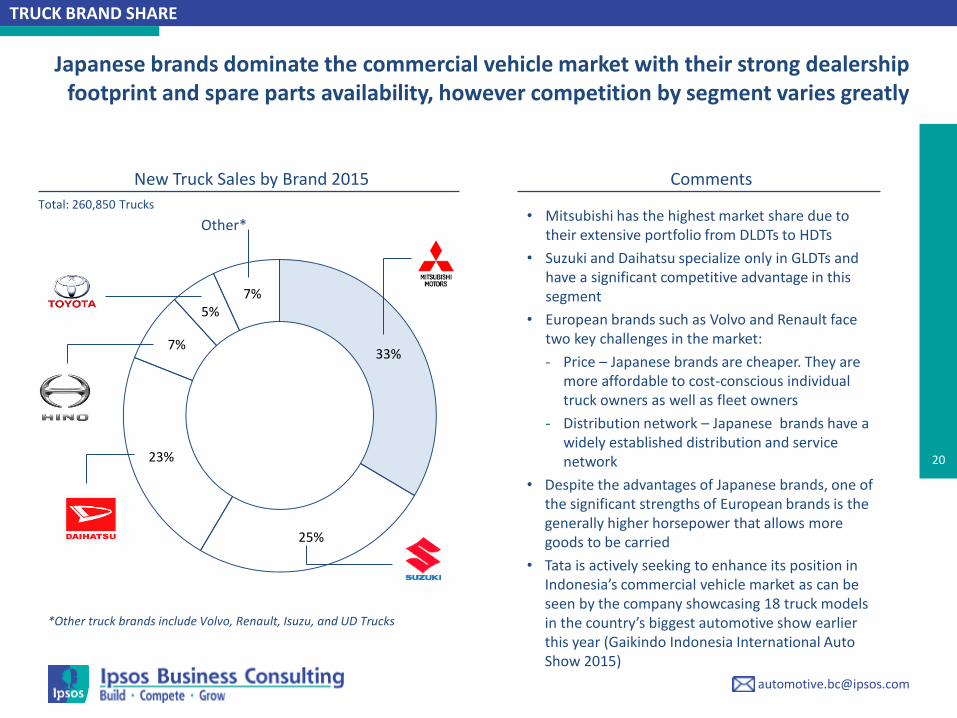
33%
25%
23%
7%
5% 7%
Total: 260,850 Trucks • Mitsubishi has the highest market share due to
their extensive portfolio from DLDTs to HDTs
• Suzuki and Daihatsu specialize only in GLDTs and have a significant competitive advantage in this segment
• European brands such as Volvo and Renault face two key challenges in the market:
- Price – Japanese brands are cheaper. They are more affordable to cost-conscious individual truck owners as well as fleet owners
- Distribution network – Japanese brands have a widely established distribution and service network
• Despite the advantages of Japanese brands, one of the significant strengths of European brands is the generally higher horsepower that allows more goods to be carried
• Tata is actively seeking to enhance its position in Indonesia’s commercial vehicle market as can be seen by the company showcasing 18 truck models in the country’s biggest automotive show earlier this year (Gaikindo Indonesia International Auto Show 2015)
Other*
New Truck Sales by Brand 2015 Comments
TRUCK BRAND SHARE
Japanese brands dominate the commercial vehicle market with their strong dealership footprint and spare parts availability, however competition by segment varies greatly
*Other truck brands include Volvo, Renault, Isuzu, and UD Trucks
21
Comments
LIGHT DUTY TRUCK PRICE ASSESSMENT
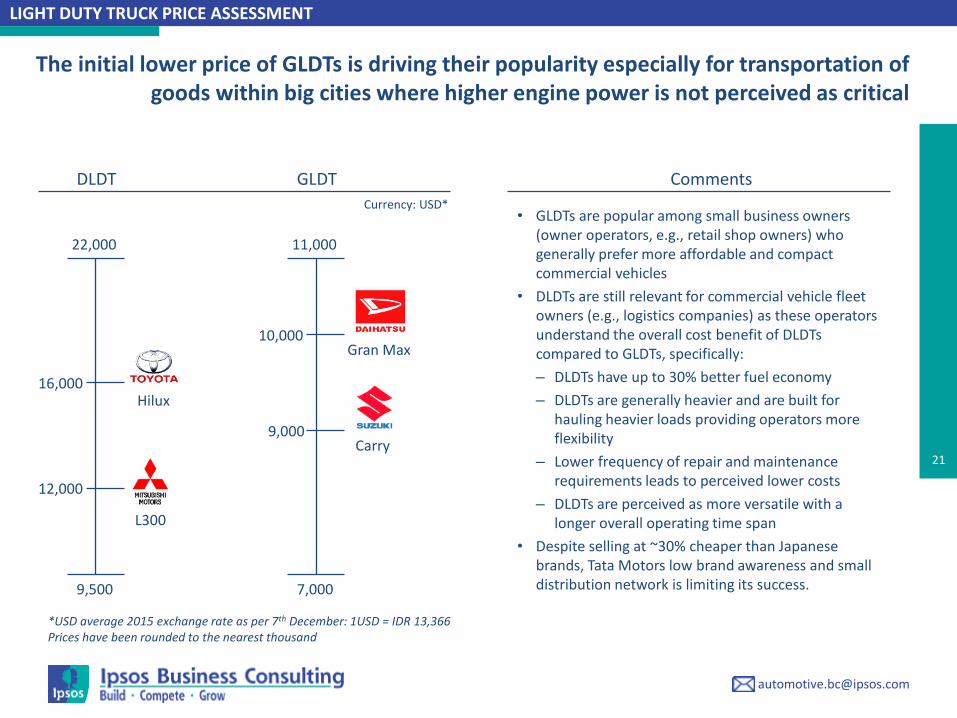
The initial lower price of GLDTs is driving their popularity especially for transportation of goods within big cities where higher engine power is not perceived as critical
• GLDTs are popular among small business owners (owner operators, e.g., retail shop owners) who generally prefer more affordable and compact commercial vehicles
• DLDTs are still relevant for commercial vehicle fleet owners (e.g., logistics companies) as these operators understand the overall cost benefit of DLDTs compared to GLDTs, specifically:
– DLDTs have up to 30% better fuel economy
– DLDTs are generally heavier and are built for hauling heavier loads providing operators more flexibility
– Lower frequency of repair and maintenance requirements leads to perceived lower costs
– DLDTs are perceived as more versatile with a longer overall operating time span
• Despite selling at ~30% cheaper than Japanese brands, Tata Motors low brand awareness and small distribution network is limiting its success.
DLDT GLDT
22,000 11,000
9,500 7,000
Currency: USD*
Carry
Gran Max
L300
Hilux
*USD average 2015 exchange rate as per 7th December: 1USD = IDR 13,366 Prices have been rounded to the nearest thousand
12,000
16,000
9,000
10,000
22
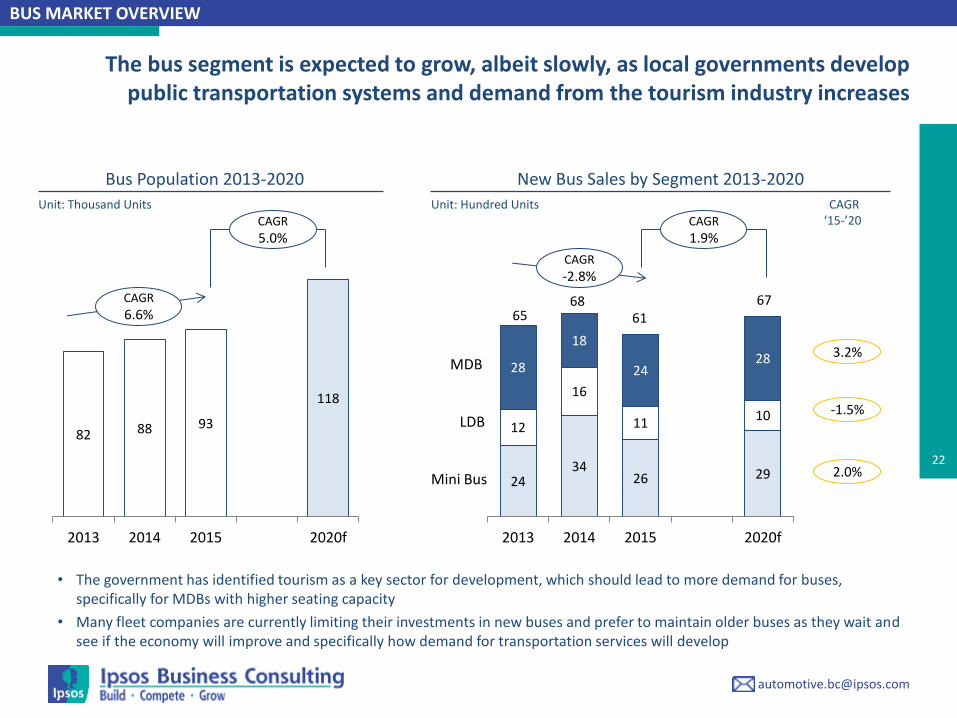
The bus segment is expected to grow, albeit slowly, as local governments develop public transportation systems and demand from the tourism industry increases
82 88 93
118
2013 2014 2015 2020f
CAGR
5.0%
CAGR
6.6%
Unit: Thousand Units
Bus Population 2013-2020
24 34
26 29
12
16
11 10
28
18
24 28
2013 2014 2015 2020f
Unit: Hundred Units
CAGR
-2.8%
CAGR
1.9%
CAGR ‘15-’20
3.2%
-1.5%
2.0%
New Bus Sales by Segment 2013-2020
BUS MARKET OVERVIEW
65 68
61 67
MDB
LDB
Mini Bus
• The government has identified tourism as a key sector for development, which should lead to more demand for buses, specifically for MDBs with higher seating capacity
• Many fleet companies are currently limiting their investments in new buses and prefer to maintain older buses as they wait and see if the economy will improve and specifically how demand for transportation services will develop

23
37%
23%
21%
4%
13%
Total: 6,144 Buses • Hino leads the bus segment through numerous means:
– One of the first bus players in Indonesia, entering the market in 1983 and today with an extensive dealership and service network across Indonesia
– Offers a wide range of durable LDB and MDBs to meet different customer needs at more affordable prices than its European counterparts
– Good fuel and lubricant consumption (acceptable operating costs)
• Isuzu’s specialization and leading position in the mini-bus segment is largely due to its higher fuel efficiency, cheaper prices and better brand awareness
• With Japanese brands dominating the market, recent market entrants have focused on specific segments:
– Scania offering high-end luxury buses primarily used in the tourism industry
– Zhongtong has entered with a low price strategy targeting fleets requiring affordable buses (e.g., public transport and tourism)
Other*
2015 New Bus Sales by Brand Comments
BUS BRAND SHARE
*Other bus brands include Scania, Zhongtong, and Daewoo
The bus segment is currently still very concentrated, however in the past years successful market entrants have been able to start gaining a foothold in the market
24
COMMERCIAL VEHICLE SEGMENT GROWTH DRIVERS
Go
vern
men
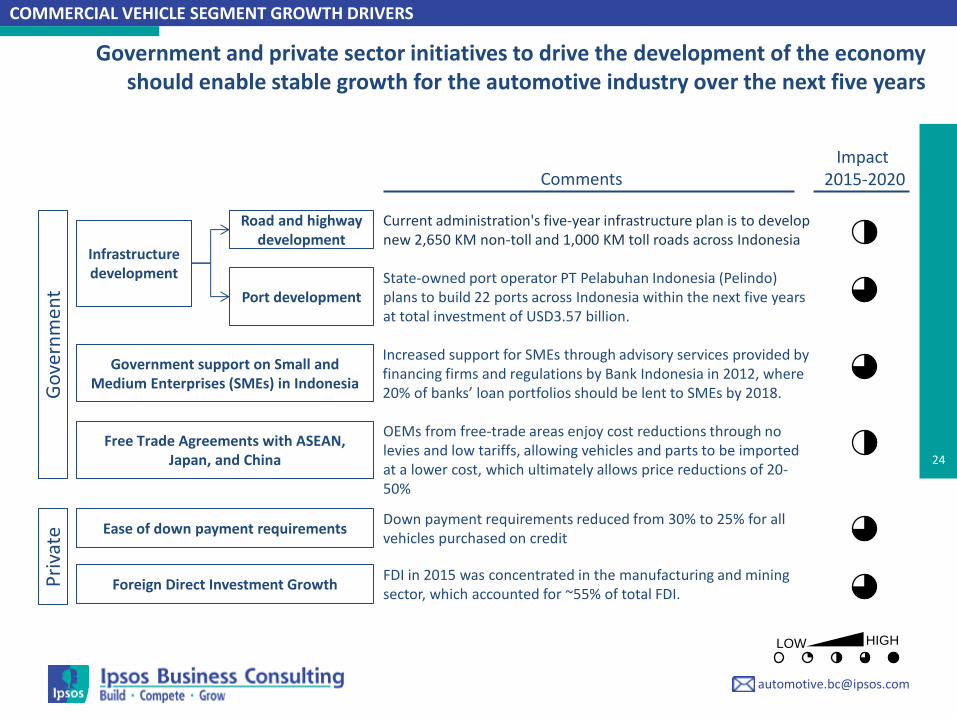
t Government and private sector initiatives to drive the development of the economy
should enable stable growth for the automotive industry over the next five years
Infrastructure development
Government support on Small and Medium Enterprises (SMEs) in Indonesia
Road and highway development
Port development
Comments Impact
2015-2020
Pri
vate
Ease of down payment requirements
Current administration's five-year infrastructure plan is to develop new 2,650 KM non-toll and 1,000 KM toll roads across Indonesia
Free Trade Agreements with ASEAN, Japan, and China
Foreign Direct Investment Growth
State-owned port operator PT Pelabuhan Indonesia (Pelindo) plans to build 22 ports across Indonesia within the next five years at total investment of USD3.57 billion.
Increased support for SMEs through advisory services provided by financing firms and regulations by Bank Indonesia in 2012, where 20% of banks’ loan portfolios should be lent to SMEs by 2018.
OEMs from free-trade areas enjoy cost reductions through no levies and low tariffs, allowing vehicles and parts to be imported at a lower cost, which ultimately allows price reductions of 20-50%
Down payment requirements reduced from 30% to 25% for all vehicles purchased on credit
FDI in 2015 was concentrated in the manufacturing and mining sector, which accounted for ~55% of total FDI.
LOW HIGH
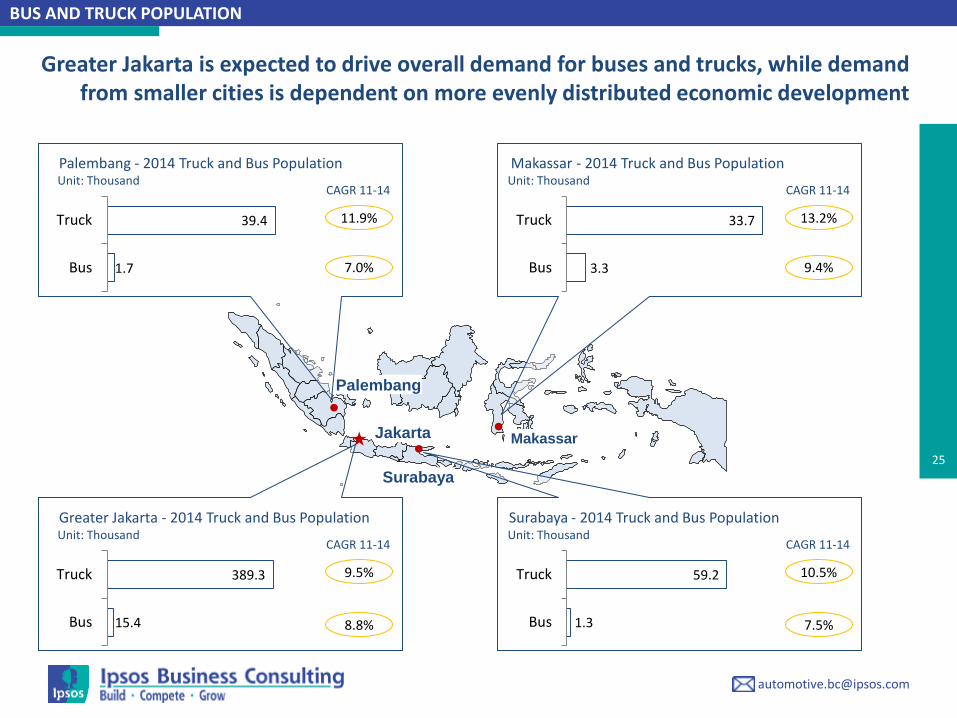
25
Jakarta
Surabaya
Palembang
1.7
39.4
Bus
Truck
Palembang - 2014 Truck and Bus Population
CAGR 11-14
3.3
33.7
Bus
Truck
Makassar - 2014 Truck and Bus Population
15.4
389.3
Bus
Truck
Greater Jakarta - 2014 Truck and Bus Population Surabaya - 2014 Truck and Bus Population
1.3
59.2
Bus
Truck
CAGR 11-14
CAGR 11-14 CAGR 11-14
9.4%
7.5% 8.8%
7.0%
13.2%
10.5% 9.5%
11.9%
BUS AND TRUCK POPULATION
Unit: Thousand
Unit: Thousand Unit: Thousand
Unit: Thousand
Greater Jakarta is expected to drive overall demand for buses and trucks, while demand from smaller cities is dependent on more evenly distributed economic development
Makassar

26
1. PASSENGER VEHICLE AND MOTORCYCLE MARKET TRENDS
2. COMMERCIAL VEHICLE MARKET TRENDS
3. ABOUT IPSOS BUSINESS CONSULTING
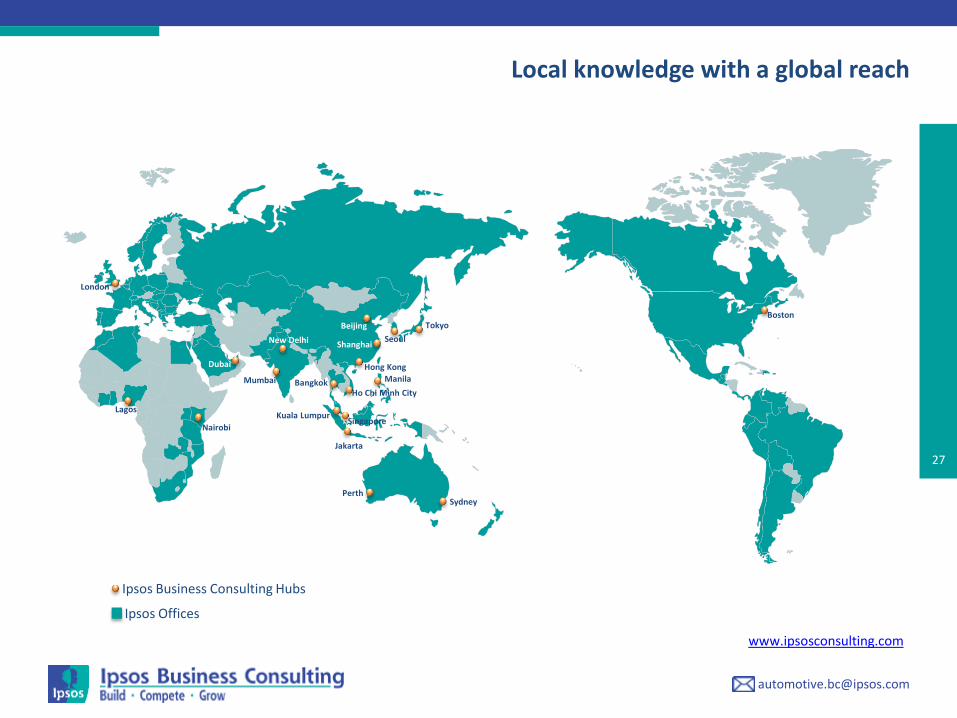
27
Local knowledge with a global reach
Ipsos Business Consulting Hubs
Ipsos Offices
Tokyo
Seoul
Singapore
Jakarta
Kuala Lumpur
Perth Sydney
Nairobi
Bangkok Manila
Ho Chi Minh City
Beijing
Shanghai
Hong Kong
Mumbai
New Delhi
Dubai
Lagos
London
Boston
www.ipsosconsulting.com
28 Au
tom
oti
ve
Re
late
d
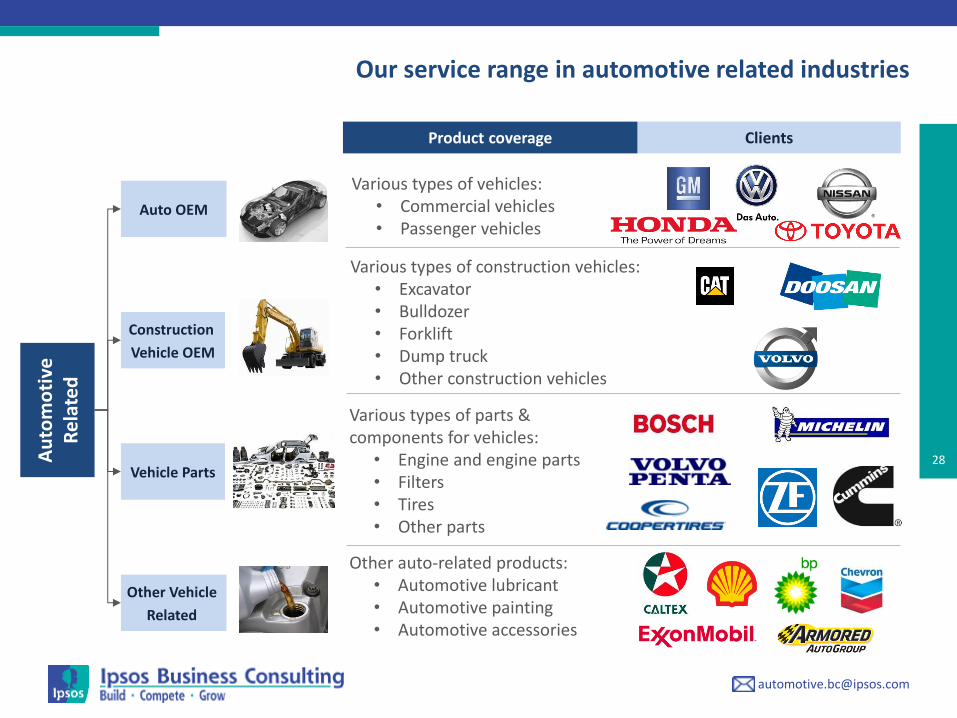
Auto OEM
Vehicle Parts
Other Vehicle
Related
Various types of vehicles: • Commercial vehicles • Passenger vehicles
Various types of parts & components for vehicles:
• Engine and engine parts • Filters • Tires • Other parts
Other auto-related products: • Automotive lubricant • Automotive painting • Automotive accessories
Construction
Vehicle OEM
Various types of construction vehicles: • Excavator • Bulldozer • Forklift • Dump truck • Other construction vehicles
Our service range in automotive related industries
Clients Product coverage

29
AB
OU
T IPSO
S BU
SINESS C
ON
SULTIN
G
Authors of this Paper
Markus Scherer Global Automotive Sector Leader
Industry focus: Automotive OEM Construction vehicles Vehicle Parts Automotive Lubricants
Ph: +852 2839 0647 E: [email protected]
Tirto Utomo Consultant Indonesia
Industry focus: Automotive Construction Finance
Ph: +6221 527 7701 E: [email protected]
Douglas Cassidy Head of Consulting Indonesia
Industry focus: Automotive Banking Asset Management
Ph: +6221 527 7701 E: [email protected]
Brenda Karnadi Associate Consultant Indonesia
Industry focus: Automotive Finance
Ph: +6221 527 7701 E: [email protected]
www.ipsosconsulting.com
30
About Ipsos Business Consulting
Ipsos Business Consulting is the specialist consulting division of Ipsos,
which is ranked third in the global research industry. With a strong
presence in 87 countries, Ipsos employs more than 16,000 people.
We have the ability to conduct consulting engagements in more than
100 countries. Our team of consultants has been serving clients
worldwide, through our 21 consulting "hubs" since 1994. Our suite of
solutions has been developed using over 20 years experience of
working on winning sales and marketing strategies for developed,
and emerging markets. There is no substitute for first-hand
knowledge when it comes to understanding an industry. We draw on
the detailed industry expertise of our consultants which has been
accumulated through practical project execution.
Founded in France in 1975, Ipsos is controlled and managed by
research and consulting professionals.
They have built a solid Group around a multi-specialist positioning.
Ipsos is listed on Eurolist - NYSE-Euronext. The company is part of the
SBF 120 and the Mid-60 index and is eligible for the Deferred
Settlement Service (SRD).
ISIN code FR0000073298, Reuters ISOS.PA, Bloomberg IPS:FP
Build · Compete · Grow At Ipsos Business Consulting we focus on maintaining our position as a leading provider of high quality consulting solutions for sales and marketing professionals. We deliver information, analysis and recommendations that allow our clients to make smarter decisions and to develop and implement winning market strategies. We believe that our work is important. Security, simplicity, speed and substance applies to everything we do. Through specialisation, we offer our clients a unique depth of knowledge and expertise. Learning from different experiences gives us perspective and inspires us to boldly call things into question, to be creative. By nurturing a culture of collaboration and curiosity, we attract the highest calibre of people who have the ability and desire to influence and shape the future.
Our Solutions:
Go-to-Market Market Sizing Business Unit Strategy Pricing Competitive Insights Forecasting Partner Evaluation Brand Strategy & Value Innovation Scouting B2B Customer Segmentation Optimal Channel Strategy Sales Detector
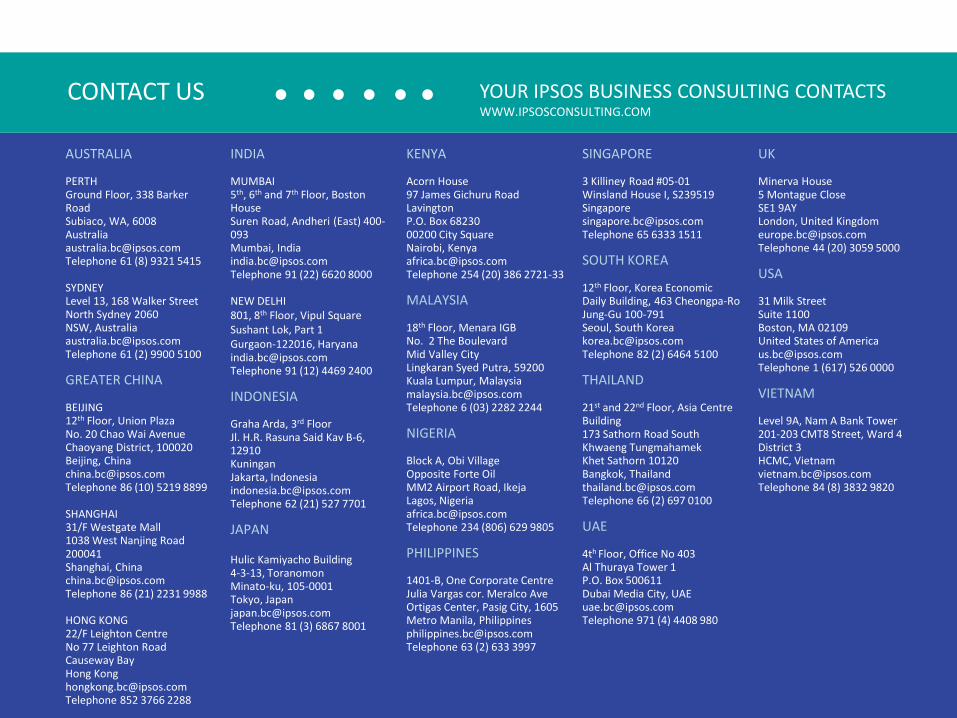
CONTACT US YOUR IPSOS BUSINESS CONSULTING CONTACTS WWW.IPSOSCONSULTING.COM
AUSTRALIA PERTH Ground Floor, 338 Barker Road Subiaco, WA, 6008 Australia [email protected] Telephone 61 (8) 9321 5415 SYDNEY Level 13, 168 Walker Street North Sydney 2060 NSW, Australia [email protected] Telephone 61 (2) 9900 5100 GREATER CHINA BEIJING 12th Floor, Union Plaza No. 20 Chao Wai Avenue Chaoyang District, 100020 Beijing, China [email protected] Telephone 86 (10) 5219 8899 SHANGHAI 31/F Westgate Mall 1038 West Nanjing Road 200041 Shanghai, China [email protected] Telephone 86 (21) 2231 9988 HONG KONG 22/F Leighton Centre No 77 Leighton Road Causeway Bay Hong Kong [email protected] Telephone 852 3766 2288
INDIA MUMBAI 5th, 6th and 7th Floor, Boston House Suren Road, Andheri (East) 400-093 Mumbai, India [email protected] Telephone 91 (22) 6620 8000 NEW DELHI 801, 8th Floor, Vipul Square Sushant Lok, Part 1 Gurgaon-122016, Haryana [email protected] Telephone 91 (12) 4469 2400 INDONESIA Graha Arda, 3rd Floor Jl. H.R. Rasuna Said Kav B-6, 12910 Kuningan Jakarta, Indonesia [email protected] Telephone 62 (21) 527 7701 JAPAN Hulic Kamiyacho Building 4-3-13, Toranomon Minato-ku, 105-0001 Tokyo, Japan [email protected] Telephone 81 (3) 6867 8001
KENYA Acorn House 97 James Gichuru Road Lavington P.O. Box 68230 00200 City Square Nairobi, Kenya [email protected] Telephone 254 (20) 386 2721-33 MALAYSIA 18th Floor, Menara IGB No. 2 The Boulevard Mid Valley City Lingkaran Syed Putra, 59200 Kuala Lumpur, Malaysia [email protected] Telephone 6 (03) 2282 2244 NIGERIA Block A, Obi Village Opposite Forte Oil MM2 Airport Road, Ikeja Lagos, Nigeria [email protected] Telephone 234 (806) 629 9805 PHILIPPINES 1401-B, One Corporate Centre Julia Vargas cor. Meralco Ave Ortigas Center, Pasig City, 1605 Metro Manila, Philippines [email protected] Telephone 63 (2) 633 3997
SINGAPORE 3 Killiney Road #05-01 Winsland House I, S239519 Singapore [email protected] Telephone 65 6333 1511 SOUTH KOREA 12th Floor, Korea Economic Daily Building, 463 Cheongpa-Ro Jung-Gu 100-791 Seoul, South Korea [email protected] Telephone 82 (2) 6464 5100 THAILAND 21st and 22nd Floor, Asia Centre Building 173 Sathorn Road South Khwaeng Tungmahamek Khet Sathorn 10120 Bangkok, Thailand [email protected] Telephone 66 (2) 697 0100 UAE 4th Floor, Office No 403 Al Thuraya Tower 1 P.O. Box 500611 Dubai Media City, UAE [email protected] Telephone 971 (4) 4408 980
UK Minerva House 5 Montague Close SE1 9AY London, United Kingdom [email protected] Telephone 44 (20) 3059 5000 USA 31 Milk Street Suite 1100 Boston, MA 02109 United States of America [email protected] Telephone 1 (617) 526 0000 VIETNAM Level 9A, Nam A Bank Tower 201-203 CMT8 Street, Ward 4 District 3 HCMC, Vietnam [email protected] Telephone 84 (8) 3832 9820


![Download [1.80 MB]](https://img.dokumen.tips/doc/110x75/587ca08a1a28ab18048b7e2b/download-180-mb.jpg)