Embed Size (px)
Citation preview
A R C H I V E S O F M E T A L L U R G Y A N D M A T E R I A L S
Volume 59 2014 Issue 1
DOI: 10.2478/amm-2014-0048
T. SOFILIĆ∗, J. JENDRICKO∗
PCDDs/Fs POLLUTION FROM METALLURGICAL PROCESSES IN THE TOWN OF SISAK, CROATIA
ZANIECZYSZCZENIA PCDD/PCDF Z TECHNOLOGII METALURGICZNYCH W MIEŚCIE SISAK W CHORWACJI
In order to calculate the emission of polychlorinated dibenzo-p-dioxins and polychlorinated dibenzofurans from met-allurgical processes located in the town of Sisak, Croatia, this research has built on experiences from developed countries,where the emission factor values from individual metallurgical processes have been taken from the reference data and usedfor the estimate of the emission of these pollutions in the European countries. The calculation of the emission polychlorinateddibenzo-p-dioxins and polychlorinated dibenzofurans from metallurgical processes located in the town of Sisak took intoaccount annual outputs of sinter, pig iron, steel blooms and steel billets, as well as steel casts.
The metallurgical processes installed in the town of Sisak between 1950 and 2010 emitted from QI−TEQ =17 mg a−1
PCDDs/Fs in 2001 to QI−TEQ =5823 mg a−1 in 1989, depending on the activity of these processes. Within the observedperiod, the largest source of PCDDs/Fs emission was the iron ore sintering plant. Within the observed timeframe, the town ofSisak did not experience any excessive air, soil or water pollution by polychlorinated dibenzo-p-dioxins and polychlorinateddibenzofurans from the local metallurgical processes.
Keywords: dioxin, furan, emission, metallurgical processes
W celu obliczenia emisji wielochlorowych dibenzo-[1,4]-dioksyn (PCDD) i wielochlorowych dibenzofuranów (PCDF) ztechnologii metalurgicznych w miejscowości Sisak, Chorwacja, badaniaprzedstawione w tej pracy oparte zostały nadoświad-czeniach z krajów rozwiniętych, gdzie wartości wskaźnika emisji z poszczególnych technologii metalurgicznych, zostały wziętez danych referencyjnych i użyte w celu oszacowania emisji tych zanieczyszczeń w krajach europejskich. W obliczeniach emisjiwielochlorowych dibenzo-[1,4]-dioksyn i wielochlorowych dibenzofuranów z technologii metalurgicznych w miejscowościSisak wzięto pod uwagę roczną produkcję spieku, surówki i odlewów.
Technologie metalurgiczne zainstalowane w mieście Sisak pomiędzy 1950 a 2010 rokiem emitowały od QI-TEQ =17 mg a-1 PCDD/PCDF w 2001 r. do QI-TEQ = 5823 mg a-1 w 1989 roku, w zależności od aktywności tych procesów.W obserwowanym okresie, największym źródłem emisji PCDD/PCDF było spiekanie rudy żelaza. W obserwowanym czasie,miasto Sisak nie odczuwało nadmierne zanieczyszczenia powietrza, gleby lub wody przez polichlorowane dibenzo-p-dioksynyi polichlorowanych dibenzofuranów z lokalnych technologii metalurgicznych.
1. Introduction
Polychlorinated dibenzo-p-dioxins (PCDDs) and poly-chlorinated dibenzofurans (PCDFs), often commonly deno-tated as PCDDs/Fs, belong to a group of persistent organicpollutants (POPs) and represent a major hazard for the liv-ing environment. Although these compounds are not produceddirectly, apart from very small amounts for research purpos-es or as chemically pure substances, they represent a hazardto the environment precisely because they are generated invarious chemical processes in chlorine compounds industry,pulp and paper industry or industrial processes taking placeunder high temperatures. Polychlorinated dibenzo-p-dioxinsand polychlorinated dibenzofurans are emitted in the air asundesired by-products from metallurgical processes and oftenadsorbed by dust particles. Due to the natural motion of air
masses they can thus be transported to relatively large dis-tances from the primary source of pollution. On their way,they can be easily washed out by precipitations and end up insoil, ground water, and sediments.
The most significant source of PCDDs/Fs among metal-lurgical processes located in the town of Sisak was the processof iron ore sintering for the production of pig iron in blast fur-naces. Their concentration in off gases from sintering processusually ranges from γI−TEQ = 0.5 to 5 ng Nm−3[1-3]. As theamount of off gases developed within the sintering process is∼2100 Nm3t−1 sinter, it allows calculation of the PCDDs/Fsamount developing per tonne of produced sinter and it rangesfrom m = 1 to 10 µg I-TEQ, where it can sometimes take upthe value exceeding γI−TEQ =20 ng Nm−3 [4]. According tothe reference data [1], off gases coming out from blast fur-naces in the environment were accompanied by PCDDs/Fs,
∗ CMC SISAK D.O.O., BRAĆE KAVURIĆ 12, 44 010 SISAK, CROATIA∗ HANIBALA LUCIĆA 5, 44 000 SISAK, CROATIA
294
the amounts of which ranged from mI−TEQ from <1.1 to 4.3ng t−1 pig iron.
As opposed to the procedure of steel production by oxy-gen converter, in terms of PCDDs/Fs emission, steel produc-tion in electric arc furnaces is much more relevant becauseit uses steel scrap as charge, and steel scrap is almost alwayspolluted with various inorganic and organic substances [5].
Kakareka and Kukharchyk [6] offer different data onemission factors for PCDDs/Fs from EAF process, dependingon the steel scrap purity, i.e. organic pollution contained in it,as well as on the additional equipment installed in some EAFsystems. The literature offers variable data between m = 0.07and 20 µg I-TEQ t−1 of steel on the emission factor values forPCDDs/Fs from the electric arc furnace process [7-12].
For the purpose of estimating PCDDs/Fs emission frommetallurgical processes, in this study we have consulted theexperience from industrialized countries. For the emission fac-tor in individual processes, we used reference values suggestedby a group of experts on emission estimate for this kind ofpollution in European countries according to [6] i.e. we usedemission factor m = 15 µg I-TEQ t−1 of sinter for sintering,m = 0.03 µg I-TEQ t−1 of pig iron for blast furnace, m = 2µg I-TEQ t−1 of steel cast for casting and m = 2 µg I-TEQ t−1
of crude steel for EAF.The calculation of PCDDs/Fs emission estimate from
metallurgical processes (iron and steel making) took into con-sideration the output of OHF steel and EAF steel produced atSisak melt shop, whereas the foundries were represented bythe available data on the production in steel castings.
Since the available literature does not provide informa-tion on PCDDs/Fs emission factor from open-hearth furnacesteel production, the calculation of PCDDs/Fs emission fromthis metallurgical process in this study was based on the in-formation on the share of steel scrap from 30% to 45% inthe open-hearth furnace charge. Based on this, the activity ofopen-hearth process was corrected and the emission factor of2 µg I-TEQ t−1 was applied in the calculation.
2. Results and discussion
2.1. Environment pollution around the town of Sisak byPCDDs/Fs from local metallurgical industry
Environment pollution around the town of Sisak beginswith the development of iron and steel making industries in thetown of Sisak that represents the center of the Croatian met-allurgical industry, started with the construction of the blastfurnace in the 1938. The pig iron output in 1939 was 3,736 t[13] and only one year later it already amounted to 19,561 t.After World War II, the output increased to around 100,000 t(1951) and reached 200,000 t in the early 1970s. The pig ironproduction was shut down in 1991.
For the purpose of pig iron production, the Sisak ironworks built their own iron ore agglomeration and sinteringplant, which was being developed and improved along with theblast furnace operation and was working continuously with anannual output of as much as 300,000 t until it was shut downin 1990.
According to Cepo [14], the production of steel billetsand steel casts in Sisak started in 1954, when approximately
7,000 t of open-hearth furnace (OHF) steel and 2400 steelcasts were produced. Ten years later, the output of steel pro-duced by OHF process was 164,000 t, and in the mid-1970s itwas 285,000 t. The production of steel casts at Sisak foundrywas between 12,300 t in 1974 and only 615 t in 2010. Theelectric arc furnace was introduced in Sisak in 1966 with theannual output of EAF steel between 103,000 t in 2010 and6,711 t in 2001.
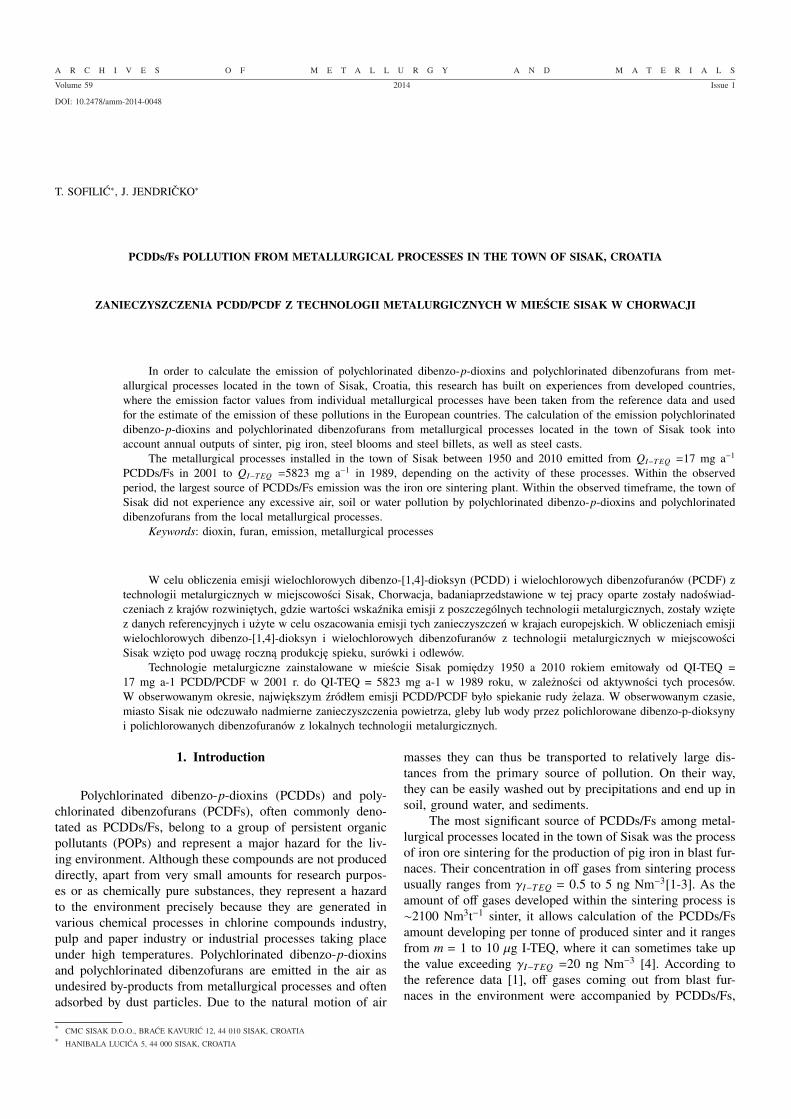
In order to obtain better insight into the pollution statusof the environment around the town of Sisak, and to calculatethe emission of PCDDs/Fs from metallurgical processes inthe town of Sisak, this research has built on experiences fromdeveloped countries, whereas the emission factor values fromindividual processes have been taken from the reference data[6] proposed by a group of experts for the estimate of theemission of these pollutions in the European countries. Thecalculation of the emission of PCDDs/Fs from metallurgicalprocesses located in the town of Sisak took into account annualoutput of sinter, pig iron, crude steel and steel casts, Figure 1.
Fig. 1. Tendencies of PCDDs/Fs emission out of the metallurgicalprocesses in the town of Sisak between 1950-2010
The metallurgical processes installed in the town of Sisakbetween 1950 and 2010 emitted from QI−TEQ =17 mg a−1
PCDDs/Fs in 2001 to QI−TEQ =5823 mg a−1 in 1989, depend-ing on the activity of these processes. Within the observedperiod, the largest source of PCDD/Fs emission was the ironore sintering plant. It is estimated that this plant accountedfor 93% of the total emissions from the Sisak metallurgicalprocesses, whereas the blast furnace and foundry emitted in-significant values (<1%) and were therefore ignored for thepurpose of this paper.
The EU directive 2000/479/EC proscribes keeping theEuropean Pollutant Emission Register (EPER) in the EU.Sources with annual PCDDs/Fs emission above QI−TEQ =1g a−1 are considered significant sources of emissions [15].The iron ore sintering plant, which has been shut down in themeantime, was the only metallurgical process in the town ofSisak that belonged to this category.
2.2. Distribution of PCDDs/Fs from metallurgicalprocesses
Metallurgical processes in Sisak’s metallurgical processesemitted PCDDs/Fs from six stationary point sources: stack ofthe sintering plant, two stacks of the open-hearth furnaces,
295
EAF’s stack, the blast furnace stack, and the foundry EAFstack. The blast furnace stack and the foundry EAF stack werenot even considered in this paper due their irrelevant amountsas sources PCDDs/Fs.
After the polychlorinated dibenzo-p-dioxins and poly-chlorinated dibenzofurans have been emitted to the at-mosphere, they disperse in the environment and their concen-tration always dilutes in the ground level of the atmosphere(imission), accompanied by both dry and wet sedimentationand absorption in plants and ground. Their distribution de-pends on the emitting conditions, climatologic features, ge-ographical characteristics of the source location, as well asground configuration.
The emission conditions relevant for the distribution ofpollution include the type of construction of the stack (heightand cross-section), flow rate and volume, and the temperatureof the stack gases. Climatologic elements that the distribu-tion depends on include atmospheric stability, air temperature,vertical temperature gradient, wind rate and direction, mixinglayer height, and vertical wind profile.
Dispersion of PCDDs/Fs emitted in the air from industrialzone i.e. metallurgical processes, calculated with the disper-sion model of the US Environmental Protection Agency, wasfor the purposes of this paper called SCREEN3 [16]. The mod-el estimates pollution concentrations from air pollution sourcesunder a wide range of meteorological conditions. SCREEN3 isa Gaussian plume dispersion model which takes into accountthe physical factors of each particular air pollution source,including emission rate, stack height and diameter, and gasexit velocity and temperature [17].
The imission concentrations of PCDDs/Fs were calculat-ed within the 20 km radius around the sintering plant at thecentre as the most significant point source of emissions, forworst-case weather conditions implying atmospheric stabilityclass F and wind rate 1 m s −1.
Basic input values for calculation by SCREEN3 modelwithin the 20 km radius around the PCDDs/Fs sources ofemissions are displayed in Table 1.
TABLE 1Basic input values for SCREEN3 model
Emissionsource
Emission(g s−1)
Stackheight(m)
Stackinside
diameter(m)
Stack gastemperature
(K)
Stack gasflow rate(m3h−1)
Sintering 2.08E-7 70 5,1 543 480000
OHF 2.48E-8 68 2 743 60000
EAF 5.60E-9 26 1 323 38000
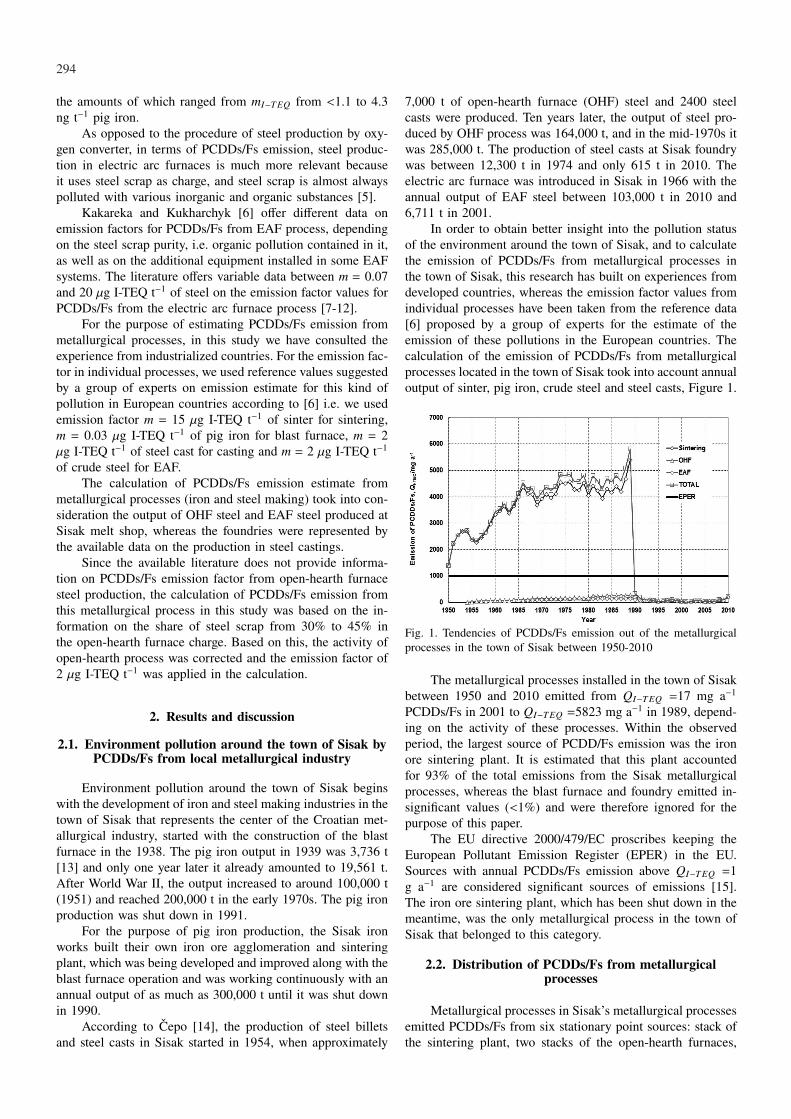
The imission calculation used continuous annual emis-sions of PCDDs/Fs from individual metallurgical processesfor every year between 1950 and 2010. The worst case of an-nual imission was in the year with the highest total PCDDs/Fsemission (1989), as Figure 2 below shows.
The result of the calculation using the SCREEN3 modelare hourly PCDDs/Fs imission concentration values (CI ) andtheir dependence on the distance from the source, as well asthe distance of maximal hourly values. They are presented as
contingency imission values to the maximum distance of 20km in steps of 100 m.
Fig. 2. Annual imission concentrations between 1950 and 2010
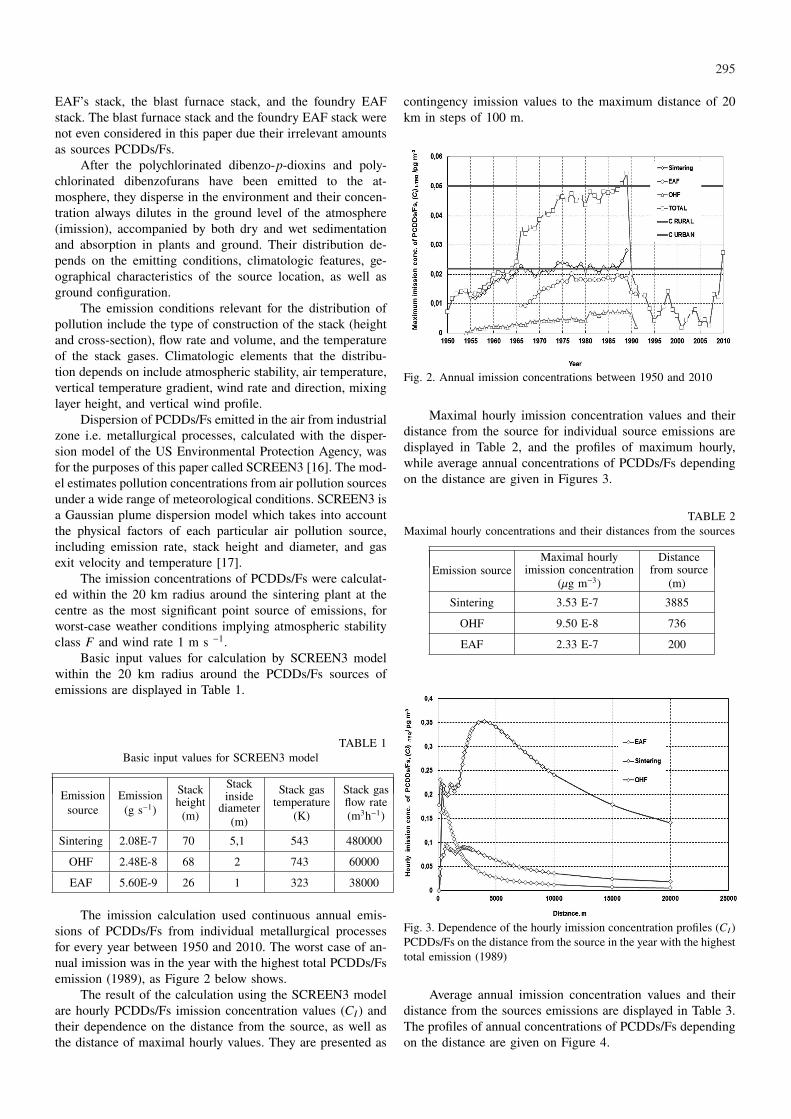
Maximal hourly imission concentration values and theirdistance from the source for individual source emissions aredisplayed in Table 2, and the profiles of maximum hourly,while average annual concentrations of PCDDs/Fs dependingon the distance are given in Figures 3.
TABLE 2Maximal hourly concentrations and their distances from the sources
Emission sourceMaximal hourly
imission concentration(µg m−3)
Distancefrom source
(m)
Sintering 3.53 E-7 3885
OHF 9.50 E-8 736
EAF 2.33 E-7 200
Fig. 3. Dependence of the hourly imission concentration profiles (CI )PCDDs/Fs on the distance from the source in the year with the highesttotal emission (1989)
Average annual imission concentration values and theirdistance from the sources emissions are displayed in Table 3.The profiles of annual concentrations of PCDDs/Fs dependingon the distance are given on Figure 4.
296
TABLE 3Average annual imision concentrations and their distances from the
sources
Emission sourceAverage annual
imission concentration(µg m−3)
Distancefrom source
(m)
Sintering 2.824 E-8 3885
OHF 7.60 E-9 736
EAF 1.864 E-8 200
Fig. 4. Dependence of the annual imission concentration profiles (CI )PCDDs/Fs on the distance from the source in the year with the highesttotal emission (1989)
Since neither the limit hourly value for PCDDs/Fs northe limit annual air quality values have been adopted yet, theaveraging of the obtained hourly values to the time intervalof one year allows us only to compare the averaged valuesto the usual measured average annual values. Reference dataon imission concentrations of PCDDs/Fs in Croatia are ratherdeficient and unreliable and therefore the comparisons in thiswork were based on the measured values of imission concen-trations of PCDDs/Fs in the USA [18] and Germany [18], inrural regions of which (CI )I−TEQ = 0.022 pg m−3 and in urbanareas (CI )I−TEQ = 0.05 pg m−3.
Figure 4 shows that the estimated value of the annualconcentration of PCDDs/Fs never exceeded the amount of(CI )I−TEQ = 0.05 pg m−3 even in the year with the highestemissions of these compounds from metallurgical processes.
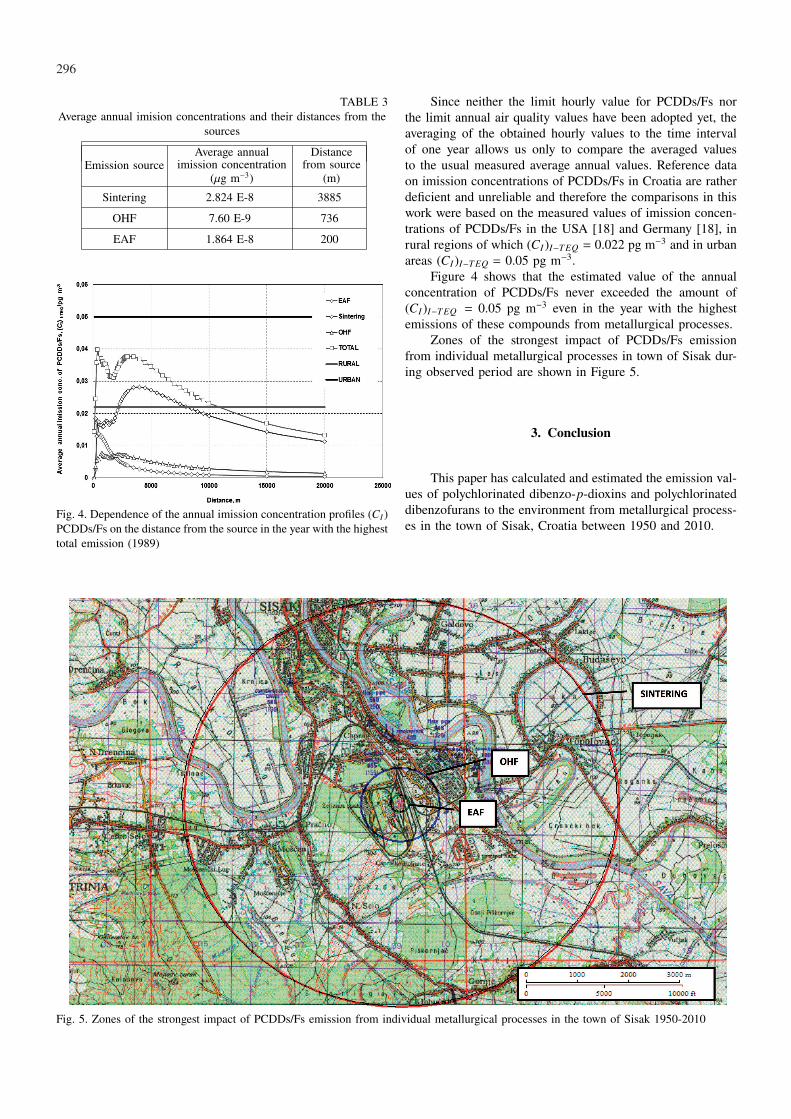
Zones of the strongest impact of PCDDs/Fs emissionfrom individual metallurgical processes in town of Sisak dur-ing observed period are shown in Figure 5.
3. Conclusion
This paper has calculated and estimated the emission val-ues of polychlorinated dibenzo-p-dioxins and polychlorinateddibenzofurans to the environment from metallurgical process-es in the town of Sisak, Croatia between 1950 and 2010.
Fig. 5. Zones of the strongest impact of PCDDs/Fs emission from individual metallurgical processes in the town of Sisak 1950-2010

297
Calculated emission values of these compounds from allmetallurgical processes installed in the town of Sisak rangedfrom QI−TEQ = 5823 mg a−1 in 1989 to QI−TEQ = 17 mga−1 in 2001 as a result of sinter production, which representedthe largest source of emissions of these compounds among allmetallurgical processes active at the time.
The imission concentrations of PCDDs/Fs were calculat-ed within the 20 km radius around the sintering plant at thecentre as the most significant point source of emissions, forworst-case weather conditions. The imission calculation wasbased on the continuous annual PCDDs/Fs emissions between1950 and 2010, and the worst-case example for 1989, the yearwith the highest total PCDDs/Fs emissions from the Sisak’smetallurgical processes was displayed.
The obtained values of maximal hourly imission concen-tration of PCDDs/Fs and their distance from the source were(CI )I−TEQ = 2.33 E-7µg m−3 and 200 m (EAF); (CI )I−TEQ =
9.5 E-8 µg m−3 and 736 m (OHF), and (CI )I−TEQ =3.53 E-7µgm−3 and 3885 m (sintering).
The obtained values of average annual imission concen-tration of PCDDs/Fs and their distance from the source were(CI )I−TEQ = 1.864 E-8 µg m−3 and 200 m (EAF); (CI )I−TEQ =
7.60 E-9 µg m−3 and 736 m (OHF), and (CI )I−TEQ = 2.824E-8 µg m−3 and 3885 m (sintering).
Within the observed period (1950-2010) there was noexcessive air pollution in the town of Sisak due to PCDDs/Fsemissions from metallurgical processes. It should be duly not-ed that the metallurgical processes (especially sintering) wereprobably the most significant, but not the only sources ofPCDDs/Fs emissions in and around the town of Sisak. In or-der to obtain a complete picture of the total load upon theSisak environment with the said pollutions, one also needsto estimate pollution from other industrial and non-industrialsources of PCDDs/Fs in the town of Sisak that were active inthe observed period such as traffic, domestic fireplaces, fires,oil refinery, thermal power plants, etc.
These results will contribute to the fulfilment of the ac-tion plan to reduce and annihilate the release of PCDDs/Fs asby-products to the environment, which is in line with the goalsdefined by the National Implementation Plan of the StockholmConvention.
REFERENCES
[1] EUROPEAN COMMISSION, Integrated Pollution Preventionand Control (IPPC), Best Available Techniques Reference Doc-ument on the Production of Iron and Steel, December, 12-40,230-281 (2001).
[2] T. W a n g, D.R. A n d e r s o n, D. T h o m p s o n, M.C l e n c h, R. F i s h e r, Studies into formation of dioxins inthe iron and steel industry. 1. Characterisation of isomer pro-files in particulate and gaseous emissions, Chemosphere 51, 7,585-594 (2003).
[3] A. B u e k e n e s, L. S t i e g l i t z, K. H e l l, H. H u a n g, P.S e g r e s, Dioxins from thermal and metallurgical processes:recent studies for the iron and steel industry, Chemosphere 42,5-7, 729-735 (2001), DOI:10.1016/S0045-6535(00)00247-2.
[4] U. Q u a s s, M. F e r m a n n, G. B r o e k e r, Assesment ofdioxin emission until 2005, The European Dioxin EmissionInventory – Stage II, Volume 3, North Rhine Westphalia StateEnvironment Agency end EC, Directorate General for Environ-ment, Essen, Germany, December, 25 (2000).
[5] J.-P. B i r a t, A. A r i o n, M. F a r a l, F. B a r o n n e t, P.-M.M a r q u a i r e, P. R a m b a u d, Abatement of organic emis-sions in eaf exhaust flue gas, La Revue de Metallurgie 98, 10839-854 (2001), DOI:http://dx.doi.org/10.1051/metal:2001132.
[6] S. K a k a r e k a, T. K u k h a r c h y k, Expert Estimates ofPCDD/F and PCB Emissions for some European Countries,Institute for Problems of Natural Resources Use and Ecology,Minsk, Belarus, MSC-E Technical Note 2/2002, 13, June 2002.
[7] Inventory of Sources of Dioxin in some Nations, htpp://www.kcn.ne.jp/∼azuma/English/news/Nov1999/991116.html
[8] W. L e m m o n, Standards pancanadiens relatifs aux dioxineset uax furannes, Reunion sur les standards d’emission, Toronto,52 (1999).
[9] T.C. H e n r i k s e n, J.B. I l l e r u p, O.-K. N i e l s e n,Dioxin Air Emission Inventory 1990-2004, National Envi-ronmental Research Institute, Ministry of the Environment– Denmark, 90 pp. – NERI Technical report no 602.http://www.dmu.dk/Pub/FR602.pdf
[10] UN ENVIRONMENT PROGRAMME, Standardized Toolkitfor Identifiication and Qantification of Dioxin and Furan Re-leases, Prepared by UNEP Chemicals, Geneva, Switzerland,January 2001.
[11] S.J. B u c k l a n d, H.K. E l l i s, P. D y k e, Nerw Zealandinventory of dioxin emission to air, land and water, and reser-voir sources, Pbs. Ministry for the Environment, Wellington,March 2000.
[12] M. C o u t i n h o, R. R o d r i g u e s, C. B o r r e g o, Car-acterizacao das Emissoes Atmosfericas de Dioxina e Furanosem Portugal: 1999-2000, 1◦ Encontro Nacional de Dioxinas eCompostos Similares na Saude e no Ambiente: uma abordagemintersectorial. Lisboa, 245 (2003).
[13] B. K r a u t h a c k e r, V. D r e v e n k a r, Z. V a s i l i c,S. H e r c e g R o m a n i c, Izvjestaj o izvorima, raspod-jeli i ucincima POPs spojeva na okolis i zdravlje lju-di, IMI HCCP-1, Institut za medicinska istrazivanja imedicinu rada, Zagreb, 2003, p.7. (in Croatian). http://www.jelena-suran.com/joomla/images/stories/izvjetaj IMI.pdf
[14] Z. C e p o, Zeljezara Sisak 1938-1978, Izdavac: SOURMK-ZS, Sisak 1978, p.286 (in Croatian).
[15] Commission Decision of 17 July 2000 on the implementationof a European pollutant emission register (EPER) according toArticle 15 of Council Directive 96/61/EC concerning integrat-ed pollution prevention and control (IPPC), Official Journal,2000; Vol. L 192, pp 0036, 28/07/2000.
[16] US Environmental Protection Agency, SCREEN3 DispersionModel, Version Dated 95250, Sept. 1995.
[17] T. S o f i l i ć, J. J e n d r i c k o, Z. K o v a c e v i ć, M.Ć o s i ć, Measurement of Polychlorinated Dibenzo-p-dioxinand Dibenzofuran Emission from EAF Steel Making Process(accepted for publication).
[18] U.S. EPA. Dioxins Reassessment. Exposure and HumanHealth Reassessment of 2,3,7,8 Tetrachlorodibenzo-p-Dioxin(TCDD) and Related Compounds. Levels of CDD, CDF andPCB congeners in environmental media and food. http://www.epa.gov/ncea/pdfs/dioxin/nas-review/pdfs/part1 vol2/dioxin pt1 vol2 ch03 dec2003.pdf
[19] Compilation of EU Dioxin Exposure and Health Data, Task6 – Trends, European Commission DG Environment, October1999. http://ec.europa.eu/environment/dioxin/pdf/task6.pdf
Received: 10 May 2013.


![Synthesis of 11-(Piperazin-1-yl)-5H-dibenzo[b,e] [1,4]diazepine on …downloads.hindawi.com/journals/jchem/2011/212014.pdf · Synthesis of 11-(Piperazin-1-yl)-5H-dibenzo[b,e] [1,4]diazepine](https://img.dokumen.tips/doc/110x75/5fa49e70a9838961895bea87/synthesis-of-11-piperazin-1-yl-5h-dibenzobe-14diazepine-on-synthesis-of.jpg)


![Syntheses, X-ray crystal structures and reactivity of ... · Attempted synthesis of 1-trimethylsilyl-2-dibenzo[a,d]cycloheptylidene-ethene (21b) As for Method A above, 1-bromo-1-trimethylsilyl-2-dibenzo[](https://img.dokumen.tips/doc/110x75/5f890aa86bf1eb0265155785/syntheses-x-ray-crystal-structures-and-reactivity-of-attempted-synthesis-of.jpg)


![Synthesis and Characterization of Dibenzo[hi st]ovalene as](https://img.dokumen.tips/doc/110x75/61fb28c8860c56585f40bb36/synthesis-and-characterization-of-dibenzohi-stovalene-as-.jpg)

![Anti-cancer activity of novel dibenzo[b,f]azepine - BioMed Central](https://img.dokumen.tips/doc/110x75/62405d870b18b81403190bf3/anti-cancer-activity-of-novel-dibenzobfazepine-biomed-central.jpg)

![The Effect of Dibenzo[a,l]pyrene on the Thymus of Fetal Mice](https://img.dokumen.tips/doc/110x75/56812c68550346895d910088/the-effect-of-dibenzoalpyrene-on-the-thymus-of-fetal-mice.jpg)


