Embed Size (px)
Citation preview

PCB AND ORGANOCHLORINE PESTICIDES IN NORTHERN FULMARS(FULMARUS GLACIALIS) FROM A HIGH ARCTIC COLONY:
CHEMICAL EXPOSURE, FATE, AND TRANSFER TO PREDATORS
KAREN L. FOSTER,*y MARK L. MALLORY,z LAURA HILL,y and JULES M. BLAISyyOttawa-Carleton Collaborative Program in Chemical and Environmental Toxicology, University of Ottawa, Ontario, Canada
zCanadian Wildlife Service, Environment Canada, Iqaluit, Nunavut, Canada
(Submitted 2 March 2011; Returned for Revision 8 April 2011; Accepted 10 May 2011)
Abstract—Organochlorine contaminant concentrations, associated fugacities, and stable isotopes of nitrogen (d15N) are reported forliver, whole body homogenate, and opportunistically collected samples of prey (amphipods), stomach oils, digestive tract contents, andguano for northern fulmars (Fulmarus glacialis) collected at Cape Vera, Devon Island in the Canadian High Arctic. Liver concentrationsof polychlorinated biphenyls (SPCB) and SDDT were on average 49.9� 35.4 ng g�1 and 29.9� 25.2 ng g�1 wet weight, respectively.Whole body homogenate concentrations of SPCB and SDDT were 637� 293 ng g�1 and 365� 212 ng g�1 wet weight, respectively. Amass and energy balance showed that whole body contaminant concentrations, which are seldom reported for Arctic seabirds, are criticalin determining contaminant exposure and associated risk to predators such as the Arctic fox (Alopex lagopus). Biomagnification in thefulmars is evident, because concentrations and fugacities of contaminants were generally one to three orders of magnitude higher thanthose of likely prey items. The fate of diet-derived contaminants along the digestive tract is discussed, in particular with respect tostomach oils, which are used to feed chicks and for defensive purposes. The benefits of considering both concentrations and fugacitiesare demonstrated and provide information on the absorption and distribution of chemicals within the fulmars and contaminant transfer tooffspring and predators. Environ. Toxicol. Chem. 2011;30:2055–2064. # 2011 SETAC
Keywords—Fulmar Arctic PCBs Pesticides Organochlorine contaminants
INTRODUCTION
Invaluable information about changing environmentalconditions can be obtained from wild birds, and new scientificapplications of avian-derived information continue to arise. Thedecline of the peregrine falcon (Falco peregrinus), osprey(Pandion haliaetus), and other raptor populations in NorthAmerica, Britain, and elsewhere, were associated with highp,p0-dichloro-diphenyl-dichloroethylene (p,p0-DDE) concen-trations [1]. In the North American Great Lakes, a varietyof reproductive abnormalities in double-crested cormorants(Phalacrocorax auritus) were associated with elevated contam-inant exposure [2]. Contaminant concentrations in ivory gulls(Pagophila eburnea) in the High Arctic have been investigatedas a possible contributing factor to a population decline inCanada of 80% since the 1980s [3,4].
Avian stomach oils produced by seabird species includingthe northern fulmar (Fulmarus glacialis) of the order Procellar-iiformes, commonly called petrels or tubenoses, contain con-centrations of hydrophobic organochlorine contaminants manytimes higher than those of possible prey items from which theywere produced: up to 60-fold higher than those reported forcrustaceans, and up to 29-fold higher than those reported for fish[5]. Indeed, as stomach oils can be sampled noninvasively andnondestructively from petrels, they are an ideal samplingmedium for the temporal and spatial biomonitoring of marinecontaminants [5,6]. Stomach oils can also be a contaminant-costly form of energy and petrel chicks, such as fulmars,
obtaining a proportion of their energy from stomach oils arelikely predisposed to elevated contaminant exposure comparedto chicks fed a diet of whole prey [5]. Fulmars produce readilytransportable, high-energy stomach oils from prey items inorder to feed young and for defensive purposes [7]. Stomachoils are formed in the proventriculus of the digestive tract fromthe lipids of prey; the lipid fraction is retained and concentrateddue to slower rates of gastric emptying than the aqueous fraction[8]. The production of stomach oil concentrates fatty acids, andthe unique fatty acid signature of stomach oils, paired with thesignatures of possible prey items, have been used to determinethe diet of wild northern fulmars off the coast of Alaska [9]. Ithas been proposed that contaminant signatures in avian stomachoils can be similarly used in diet determination studies, whenpaired with the signatures of prey items [5].
In the Canadian Arctic, concentrations of legacy persistentorganic pollutants, Hg, and emerging fluorinated and bromi-nated chemicals are frequently monitored in the liver and eggsof various seabird species, including the northern fulmar [4,10].An objective of such studies is frequently to monitor contam-inant concentrations accumulated in seabirds and any possibleassociated impacts on the health and fitness of the colony itself.However, to our knowledge, the relevance of contaminantlevels in seabirds to the dietary exposure of predators thatconsume them has not been assessed for Arctic seabirds.In the case of northern fulmars, predators include Larus gulls,common ravens (Corvus corax), bald eagles (Haliaeetusleucocephalus), Stellar’s sea eagles (Haliaeetus pelagicus),white-tailed sea eagles (Haliaeetus albicilla), gyrfalcons (Falcorusticolus), peregrine falcons (Falco peregrinus), red foxes(Vulpes vulpes), and Arctic foxes (Alopex lagopus) [11].
Biomagnifying contaminants are passed from prey to pred-ator in food webs, with top predators such as fish-eating birds
Environmental Toxicology and Chemistry, Vol. 30, No. 9, pp. 2055–2064, 2011# 2011 SETAC
Printed in the USADOI: 10.1002/etc.592
All Supplemental Data may be found in the online version of this article.* To whom correspondence may be addressed
([email protected]).Published online 3 June 2011 in Wiley Online Library
(wileyonlinelibrary.com).
2055

receiving the highest exposure, and deleterious consequences.Biomagnification is a series of solvent-switching and solvent-reduction events as contaminants are exchanged through thefood web from prey to predator (solvent switching) and lipidsare metabolized (solvent reduction) [12]. Fugacity ( f Pa) [13] isthe escaping tendency or partial pressure of a chemical in aparticular medium or tissue and is calculated from concentra-tion (Concn.mol m�3) as
f ¼ Concn:=Z (1)
where Z (molm�3 Pa�1) is the fugacity capacity (the capacity ofthe medium for the chemical) and is calculated using lipidcontent and the octanol-water partition coefficient (KOW) of thechemical. Fugacities provide complementary information toconcentrations as a chemical at equilibrium between media ortissues will have equal fugacities in each, i.e., a fugacity ratio ofone. Thus, two different tissue types may have very differentconcentrations of a given chemical and yet still be at equilibriumbecause of differing Z values. Fugacities and concentrations canalso be used to determine if a chemical has undergone solventswitching, solvent reduction, or a combination of the two [12]. Ifa chemical switches solvents as a result of a higher Z in the newsolvent (or media), its concentration in the new solvent will behigher (provided the volumeof the newsolvent is less than that ofthe original solvent), but the fugacity will remain approximatelythe same. If the volume of solvent the chemical is in is reduced,both the fugacity and the concentration will increase [12].
Here we report the concentrations and associated fugacitiesof polychlorinated biphenyls (PCBs) and organochlorine pes-ticides (OCPs) in the liver, whole body homogenate (WBH),digestive tract (stomach oils, guano, and the content of twodigestive tract sections), and in amphipods (a prey item)measured in northern fulmars. Segmenting the digestive tractis a unique approach, enabling a snapshot of the progression ofprey and associated contaminants through the multistage diges-
tive processes. To our knowledge, the whole body concentra-tions of organochlorine contaminants have not been studied forfulmars and are only rarely reported for Arctic seabirds. Meas-ured concentrations and their corresponding fugacities of con-taminants in these tissues are used to assess the possibletoxicity, exposure, and fate of contaminants in northern fulmars.Whole body homogenate data also enabled an assessment ofcontaminant transfer to fulmar predators such as the Arctic fox.
MATERIALS AND METHODS
Field collection
Thirteen northern fulmars were collected from Cape Vera,Devon Island, Nunavut, Canada (Fig. 1, 768130N, 898140W)during the breeding season in June and July of 2006 and 2007.Eleven fulmars were collected in 2006 and two were harvestedin 2007. The birds were harvested, kept on ice in the field, andlater frozen until they could be sexed and dissected (the 2007birds were dissected in the field). The birds were sexed usingmorphological measurements such as beak width and tarsuslength [14]. Amphipods were collected offshore using nets andstored in disposable polypropylene tubes.
Sample preparation
To capture snapshots of contaminant concentrations andfugacities at different stages of prey digestion, the contentsof the gut lumen of the birds collected in 2007 were analyzed insections along the digestive tract. These sections are designatedprey (P), stomach oil (S), chyme (C), intestine (I), and guano(G). Liver and whole body homogenate are designated (L) and(B), respectively. The organochlorine content of these stomachoils was reported previously [5].
The two birds collected in 2007 had been feedingoffshore, and thus contained sufficient digestive materialfor organochlorine analyses. Stomach oils and guano were
Fig. 1. Location of the northern fulmar colony at Cape Vera on Devon Island, in the Canadian High Arctic.
2056 Environ. Toxicol. Chem. 30, 2011 K.L. Foster et al.

collected directly from the mouth and vent, respectively, intodisposable polypropylene tubes immediately after harvesting.In the field, entire digestive tracts were carefully removedintact, sealed on either end using string, and kept in aluminumfoil and frozen. In the laboratory, additional guano from thecloaca and large intestine was emptied into the field sample.Only one guano sample was possible, because this portion of thedigestive tract was intact for only one of the birds collected. Theremaining digestive tract contents were extruded in two sectionsinto disposable polypropylene tubes. The first of these was thechyme from the esophagus, crop, and proventriculus. Stomachoils are produced and stored in the proventriculus [7,8], thuschyme is expected to also contain some stomach oils. Thesecond section was the content of the small intestine. Theamphipods were ground using a mortar and pestle with Hydro-matrix1 (Varian) before organochlorine analysis.
The liver and WBH were analyzed individually. In thelaboratory the livers were removed from thawed carcassesand stored in glass amber jars. Scissors were used to homog-enize the liver tissue in the jars prior to organochlorine analysis.The legs, head, and wings were assumed to contribute onlyminimally to organochlorine concentrations and were removedfrom the carcasses and not included in the WBH. The entiredigestive tract was also removed and not included in the WBH.The remainder of the carcass was then plucked, cut into smallpieces using wire cutters and scissors, and flash-frozen in liquidnitrogen before grinding in a ball mill. The resultant paste wasfurther homogenized using a mixer before subsampling fororganochlorine analysis. Thus, theWBH includes the remaininginternal organs (heart, gall bladder, lungs, kidneys), bones,muscle and connective tissue, and subcutaneous fat.
Organochlorine analyses and lipid content
All samples were processed, lipid content determined, andanalyzed for organochlorine contaminants using the method-ology for Cape Vera stomach oils described elsewhere [5].Briefly, samples were extracted using an Accelerated SolventExtractor (ASE 200, Dionex). Lipid content was determinedgravimetrically by evaporating the solvent from a knownpercentage of the total extract, measuring the mass of thenonvolatile lipids, and calculating the percent lipid (by mass).For WBH and liver samples, the extract from 1 g of tissue wasused for lipid content determination. Extracts were then passedthrough a calibrated column packed with Bio-Beads1 (Bio-Rad) with 1:1 hexane:dichloromethane to remove lipids. Theremoval of water, further cleanup of the samples, and fractio-nation of the analytes were achieved by passing the extractthrough activated silica/sodium sulfate columns. All sampleswere then analyzed on a Hewlett-Packard 6890 series II gaschromatograph with a 63Ni electron capture detector and a60m� 0.25mm (0.25mm film) column (J&W Scientific DB-5MS). Polychlorinated biphenyls measured were InternationalUnion of Pure and Applied Chemistry (IUPAC) congeners: 5/8,18, 29, 31/28, 52, 49, 44, 66, 101, 99, 87, 110, 149, 118, 146,153, 132, 105, 163, 138, 187, 183, 128, 156, 201, 157, 180, 170,195, 194, 206, 209, collectively referred to as SPCBs. Organo-chlorine pesticides (SOCPs) measured were: 1,2,3-trichloro-benzene (1,2,3-TCB), 1,2,3,4-tetrachlorobenzene (1,2,3,4-TTCB), pentachlorobenzene (PECB), a-hexachlorocyclohex-ane (a-HCH), hexachlorobenzene (HCB), g-hexachlorocyclo-hexane, heptachlor, aldrin, heptachlor epoxide (HE),g-chlordane, a-endosulfan/a-chlordane, p,p0-DDE, dieldrin,endrin, b-endosulfan, p,p0-dichloro-diphenyl-dichloroethane
(p,p0-DDD), o,p0-dichloro-diphenyl-trichloroethane (o,p0-DDT),p,p0-DDT, methoxychlor, and mirex.
Recoveries of spiked standards for all samples (n¼ 53)including method blanks and reference materials were onaverage 80%� 18 for PCB 30, 105%� 37 for PCB 204 or205, 63%� 12 for 1,3,5-tribromobenzene, 71%� 15 for1,2,4,5-tetrabromobenzene, 79%� 20 for d-hexachlorocyclo-hexane, and 68%� 24 for endrin ketone. Concentrations werenot recovery corrected. Standard reference material (n¼ 7,mussel tissue, National Institute of Standards and Technology2978) was analyzed with each batch of samples. On average, theconcentration of 20 PCB congeners was 87%� 17 of thecertified concentration and the concentration of 7 OCPs was76%� 20. Method detection limits (MDLs), calculated as theStudent’s t value appropriate for a 95% confidence level(tn�1,0.05¼ 1.895) times the standard deviation of the averagedblank concentrations (n¼ 8), were 1.4 ng g�1 for SPCBs and2.2 ng g�1 for SOCPs based on a typical 1 g wet weight sample.Triplicates of WBH were analyzed for one bird; the coefficientof variation was 18% for SPCBs and 16% for SOCPs. Alldisposable polypropylene tubes, aluminum foil, tools, andglassware used in the sample collection, preparation, andorganochlorine analyses were solvent washed, and wherepossible baked, and all solvents used were high-purity grade.
d15N analysis
Freeze-dried samples of liver and WBH were weighed intotin capsules and submitted to the G.G. Hatch Stable IsotopeLaboratory at the University of Ottawa, Canada, for isotopicanalysis. Samples were analyzed on a CE Instruments EA 1110elemental analyzer at 18008C using helium carrier gas and anisotope ratio mass spectrometer detector calibrated with theinternational standards IAEA-CH-6, IAEA-NBS22, IAEA-N1,IAEA-N2, USGS-40, and USGS-41. The analytical precisionwas� 0.2%.
Fugacities
Measured concentrations were converted to fugacities usingEquation 1. Concentrations first had to be converted from unitsof ng g�1 wet weight to units of mol m�3 using the molar massand assuming a tissue density of 1000 kgm�3, i.e., the density ofwater. The density of stomach oils was assumed to be800 kgm�3 [15]. Fugacity capacities (ZX) were calculated asLX�ZO [13], where LX is the lipid fraction of the seabird mediaor tissue X and ZO is the fugacity capacity of pure octanol and iscalculated as ZO¼KOW/H, where H is the Henry’s Law con-stant in Pa m3 mol�1, and KOW is the octanol-water partitioncoefficient. The physicochemical properties used for eachcontaminant and group of contaminants were compiled fromLi et al. [16], Mackay et al. [17], and Estimation ProgramsInterface SuiteTM predictive software ([18]; http://www.epa.-gov/oppt/exposure/pubs/episuite.htm) and are given in the Sup-plemental Data, Table S1.
RESULTS AND DISCUSSION
Concentrations of SPCB and SDDT in the WBH werethe highest of all the contaminants and samples measuredin the present study, 637� 293 ng g�1 and 365� 212 ng g�1
wet weight, respectively, followed by the liver with49.9� 35.4 ngg�1 and 29.9� 25.2 ngg�1 wet weight (Table 1).On average, PCBs 118, 138, 153, and 180 (together comprisingS4PCB) accounted for 74% of SPCBs in WBH and 69% inthe liver. In the WBH and liver, 92 and 95% of SDDTs,
Organochlorine contaminants in fulmars Environ. Toxicol. Chem. 30, 2011 2057
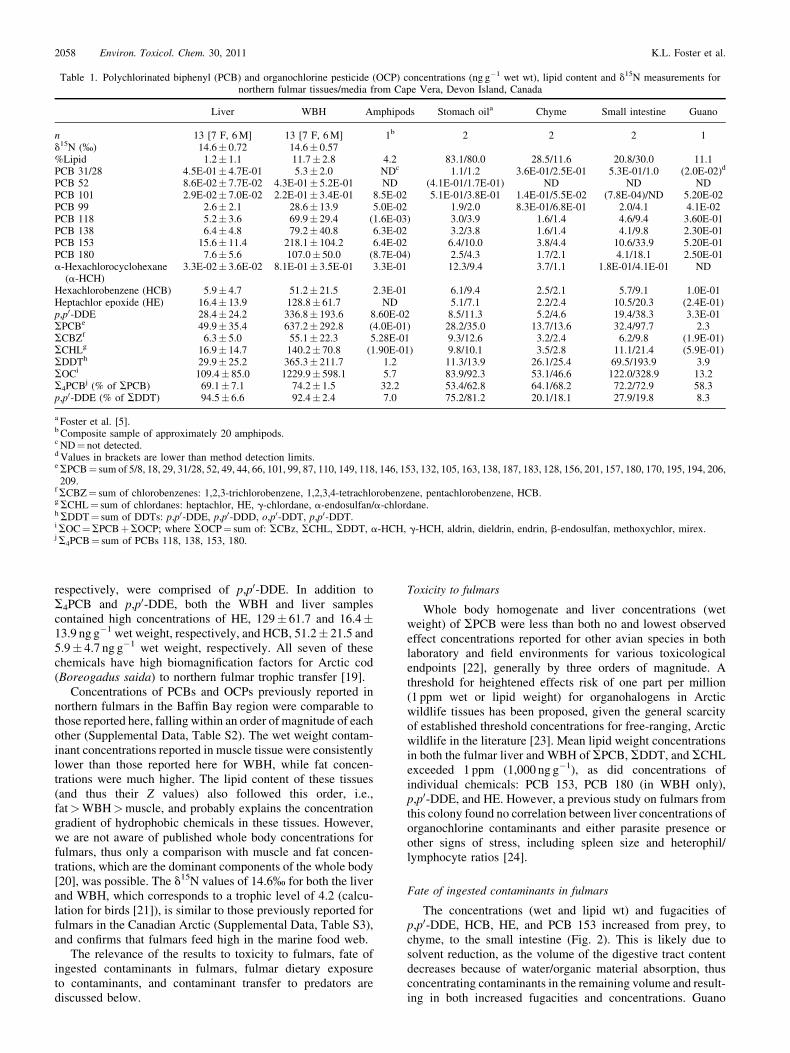
respectively, were comprised of p,p0-DDE. In addition toS4PCB and p,p0-DDE, both the WBH and liver samplescontained high concentrations of HE, 129� 61.7 and 16.4�13.9 ng g�1 wet weight, respectively, and HCB, 51.2� 21.5 and5.9� 4.7 ng g�1 wet weight, respectively. All seven of thesechemicals have high biomagnification factors for Arctic cod(Boreogadus saida) to northern fulmar trophic transfer [19].
Concentrations of PCBs and OCPs previously reported innorthern fulmars in the Baffin Bay region were comparable tothose reported here, falling within an order of magnitude of eachother (Supplemental Data, Table S2). The wet weight contam-inant concentrations reported in muscle tissue were consistentlylower than those reported here for WBH, while fat concen-trations were much higher. The lipid content of these tissues(and thus their Z values) also followed this order, i.e.,fat>WBH>muscle, and probably explains the concentrationgradient of hydrophobic chemicals in these tissues. However,we are not aware of published whole body concentrations forfulmars, thus only a comparison with muscle and fat concen-trations, which are the dominant components of the whole body[20], was possible. The d15N values of 14.6% for both the liverand WBH, which corresponds to a trophic level of 4.2 (calcu-lation for birds [21]), is similar to those previously reported forfulmars in the Canadian Arctic (Supplemental Data, Table S3),and confirms that fulmars feed high in the marine food web.
The relevance of the results to toxicity to fulmars, fate ofingested contaminants in fulmars, fulmar dietary exposureto contaminants, and contaminant transfer to predators arediscussed below.
Toxicity to fulmars
Whole body homogenate and liver concentrations (wetweight) of SPCB were less than both no and lowest observedeffect concentrations reported for other avian species in bothlaboratory and field environments for various toxicologicalendpoints [22], generally by three orders of magnitude. Athreshold for heightened effects risk of one part per million(1 ppm wet or lipid weight) for organohalogens in Arcticwildlife tissues has been proposed, given the general scarcityof established threshold concentrations for free-ranging, Arcticwildlife in the literature [23]. Mean lipid weight concentrationsin both the fulmar liver and WBH of SPCB, SDDT, and SCHLexceeded 1 ppm (1,000 ng g�1), as did concentrations ofindividual chemicals: PCB 153, PCB 180 (in WBH only),p,p0-DDE, and HE. However, a previous study on fulmars fromthis colony found no correlation between liver concentrations oforganochlorine contaminants and either parasite presence orother signs of stress, including spleen size and heterophil/lymphocyte ratios [24].
Fate of ingested contaminants in fulmars
The concentrations (wet and lipid wt) and fugacities ofp,p0-DDE, HCB, HE, and PCB 153 increased from prey, tochyme, to the small intestine (Fig. 2). This is likely due tosolvent reduction, as the volume of the digestive tract contentdecreases because of water/organic material absorption, thusconcentrating contaminants in the remaining volume and result-ing in both increased fugacities and concentrations. Guano
Table 1. Polychlorinated biphenyl (PCB) and organochlorine pesticide (OCP) concentrations (ng g�1 wet wt), lipid content and d15N measurements fornorthern fulmar tissues/media from Cape Vera, Devon Island, Canada
Liver WBH Amphipods Stomach oila Chyme Small intestine Guano
n 13 [7 F, 6M] 13 [7 F, 6M] 1b 2 2 2 1d15N (%) 14.6� 0.72 14.6� 0.57%Lipid 1.2� 1.1 11.7� 2.8 4.2 83.1/80.0 28.5/11.6 20.8/30.0 11.1PCB 31/28 4.5E-01� 4.7E-01 5.3� 2.0 NDc 1.1/1.2 3.6E-01/2.5E-01 5.3E-01/1.0 (2.0E-02)d
PCB 52 8.6E-02� 7.7E-02 4.3E-01� 5.2E-01 ND (4.1E-01/1.7E-01) ND ND NDPCB 101 2.9E-02� 7.0E-02 2.2E-01� 3.4E-01 8.5E-02 5.1E-01/3.8E-01 1.4E-01/5.5E-02 (7.8E-04)/ND 5.20E-02PCB 99 2.6� 2.1 28.6� 13.9 5.0E-02 1.9/2.0 8.3E-01/6.8E-01 2.0/4.1 4.1E-02PCB 118 5.2� 3.6 69.9� 29.4 (1.6E-03) 3.0/3.9 1.6/1.4 4.6/9.4 3.60E-01PCB 138 6.4� 4.8 79.2� 40.8 6.3E-02 3.2/3.8 1.6/1.4 4.1/9.8 2.30E-01PCB 153 15.6� 11.4 218.1� 104.2 6.4E-02 6.4/10.0 3.8/4.4 10.6/33.9 5.20E-01PCB 180 7.6� 5.6 107.0� 50.0 (8.7E-04) 2.5/4.3 1.7/2.1 4.1/18.1 2.50E-01a-Hexachlorocyclohexane
(a-HCH)3.3E-02� 3.6E-02 8.1E-01� 3.5E-01 3.3E-01 12.3/9.4 3.7/1.1 1.8E-01/4.1E-01 ND
Hexachlorobenzene (HCB) 5.9� 4.7 51.2� 21.5 2.3E-01 6.1/9.4 2.5/2.1 5.7/9.1 1.0E-01Heptachlor epoxide (HE) 16.4� 13.9 128.8� 61.7 ND 5.1/7.1 2.2/2.4 10.5/20.3 (2.4E-01)p,p0-DDE 28.4� 24.2 336.8� 193.6 8.60E-02 8.5/11.3 5.2/4.6 19.4/38.3 3.3E-01SPCBe 49.9� 35.4 637.2� 292.8 (4.0E-01) 28.2/35.0 13.7/13.6 32.4/97.7 2.3SCBZf 6.3� 5.0 55.1� 22.3 5.28E-01 9.3/12.6 3.2/2.4 6.2/9.8 (1.9E-01)SCHLg 16.9� 14.7 140.2� 70.8 (1.90E-01) 9.8/10.1 3.5/2.8 11.1/21.4 (5.9E-01)SDDTh 29.9� 25.2 365.3� 211.7 1.2 11.3/13.9 26.1/25.4 69.5/193.9 3.9SOCi 109.4� 85.0 1229.9� 598.1 5.7 83.9/92.3 53.1/46.6 122.0/328.9 13.2S4PCB
j (% of SPCB) 69.1� 7.1 74.2� 1.5 32.2 53.4/62.8 64.1/68.2 72.2/72.9 58.3p,p0-DDE (% of SDDT) 94.5� 6.6 92.4� 2.4 7.0 75.2/81.2 20.1/18.1 27.9/19.8 8.3
a Foster et al. [5].b Composite sample of approximately 20 amphipods.c ND¼ not detected.d Values in brackets are lower than method detection limits.eSPCB¼ sum of 5/8, 18, 29, 31/28, 52, 49, 44, 66, 101, 99, 87, 110, 149, 118, 146, 153, 132, 105, 163, 138, 187, 183, 128, 156, 201, 157, 180, 170, 195, 194, 206,209.
fSCBZ¼ sum of chlorobenzenes: 1,2,3-trichlorobenzene, 1,2,3,4-tetrachlorobenzene, pentachlorobenzene, HCB.gSCHL¼ sum of chlordanes: heptachlor, HE, g-chlordane, a-endosulfan/a-chlordane.hSDDT¼ sum of DDTs: p,p0-DDE, p,p0-DDD, o,p0-DDT, p,p0-DDT.iSOC¼SPCBþSOCP; where SOCP¼ sum of: SCBz, SCHL, SDDT, a-HCH, g-HCH, aldrin, dieldrin, endrin, b-endosulfan, methoxychlor, mirex.jS4PCB¼ sum of PCBs 118, 138, 153, 180.
2058 Environ. Toxicol. Chem. 30, 2011 K.L. Foster et al.

concentrations and fugacities of chemicals declined below thoseof the preceding section (small intestine) (Fig. 2). This decreasecould be a result of a dilution effect caused by the excretion ofuric acid into the cloaca, where it mixes with indigesta and isegested as guano [25]. Also, the majority of lipid and associatedcontaminants are absorbed in the jejunum in the small intestine[26], which may explain the decreased contaminant levels in the
guano (the subsequent digestive tract section). Trends observedalong the digestive tract must be viewed as preliminary giventhe unavoidably low sample sizes, but they do suggest that inthis case water/organic material were more efficiently absorbedthan contaminants.
Gobas et al. [27] found that the fugacities of PCBs in captiveand wild fish were several times higher in the gastrointestinal
Fig. 2. Concentrations, fugacities, and fugacity capacities (Z) for selected chemicals in prey (amphipods), along the digestive tract and in the liver and wholebody homogenate of northern fulmars. The pathway is segregated as follows: prey (P, n¼ 1), stomach oils (S, n¼ 2), chyme (C, n¼ 2), small intestine (I, n¼ 2),guano (G, n¼ 1), liver (L, n¼ 13), whole body (B, n¼ 13). Error bars indicateþSD; ND¼ not detected.
Organochlorine contaminants in fulmars Environ. Toxicol. Chem. 30, 2011 2059

tract content than in food. However, a decreasing trend in thedry weight concentrations of PCB 155 was also observed alongthe digestive tract of captive fish. Drouillard [28] found that thefugacity equivalents and dry weight concentrations of sevenPCB congeners decreased with progression from spiked foodthrough three sections of the digestive tract to feces in captivering doves (Streptopelia risoria). These studies indicate thatfugacities and concentrations of contaminants can eitherincrease or decrease along the digestive tract of organisms asprey are metabolized depending, in part, on the relative absorp-tion efficiencies of organic matter/water and contaminants. Netcontaminant absorption efficiencies are dependent both oncontaminant uptake into the body from digesta in the digestivetract, as well as depuration from the body into the digestive tract[29]. Thus, the net contaminant absorption efficiency in organ-isms that are contaminated to begin with, such as wild birds, islikely to be less than that of comparatively clean, laboratory-raised organisms as a result of increased depuration and mayassist in explaining the observations noted in the literature andthe present study.
Whole body homogenate concentrations (wet weight) ofcontaminants were higher than in the liver; on average, 14-foldhigher for PCB congeners and 5- to 65-fold higher for OCPs,depending on the chemical. However, no significant differencesbetween the fugacities in WBH and in liver for 17 of the 18chemicals or groups of chemicals reported here were found (17 ttests, all t� 2.08, 0.06� p� 0.99). One exception to this was a-HCH (t¼ 2.75, p¼ 0.02), although, with the application of theBonferroni correction for n¼ 18, this too is not significant.Thus, despite the large difference in concentrations of contam-inants betweenWBH and liver, they appear to be approximatelyat equilibrium for some chemicals. If a chemical is at equili-brium between the WBH and liver, concentrations in WBHcould be calculated from the fugacity in the liver provided thatthe lipid content of both tissues was also known. Additionalresearch is required to assess the accuracy of predicting wholebody concentrations from liver fugacities both for differentspecies of seabirds and different classes of chemicals.
Along the digestive tract the lipid content of digesta, and thusthe fugacity capacity, decrease as lipids are absorbed [27,28].Fugacity capacities in both wild and captive fish decreased byapproximately 25% from prey items through to feces [27]. Inring doves the fugacity capacity also declined from foodthrough to feces, with the largest drop occurring in the first30% of the intestine [28]. The fugacity capacities in the chyme,intestinal content, and guano of the fulmars were higher thanthat of the prey for all four chemicals (Fig. 2). Although therewas considerable variability in the percentage lipid, and low nvalues preclude definitive comparisons, these trends suggestthat amphipods were not the only prey items in the digestivetract of these two fulmars. The lipid content of amphipods in theCanadian Arctic can range from 2.2 to 4.2% [30], the lipidcontent of the amphipods analyzed in the present study was4.2% (Table 1). However, it is possible that these two birds hadbeen eating prey with a higher lipid content, such as fish, prior towhen they were harvested. Fulmars are opportunistic feedersand their diets include a broad range of prey items, in particular,birds from the Canadian High Arctic consume a high proportionof Arctic cod [11,31].
The nonlipid fraction of biological tissues is also thought tocontribute to the overall fugacity capacity of tissue for con-taminants [29]. Fugacity capacities based on the sorption ofcontaminants to proteins, water, carbohydrates, and lipid havebeen used in bioaccumulation modeling; with the sorptive
capacities of protein and carbohydrates modeled as 5 and10% of lipid capacity, respectively [29]. Illustrative calcula-tions of the conversion of concentrations to fugacities usingboth the lipid partitioning assumption and an estimate ofpartitioning to nonlipids for three chemicals in WBH is givenin the Supplemental Data (Table S4). For the purposes of thepresent study, the lipid-only partitioning assumption was made,given the comparatively small difference to fugacities (�10%)and the associated uncertainties and variability of the nonlipidcompositions of all media reported here. However, nonlipidpartitioning is probably more important in biological tissueswith lower lipid content than WBH, and thus proportionallymore nonlipid material.
Contaminant accumulation and clearance
Table 2 shows the ratios of recalcitrant (PCBs 66, 105, 118,and 153) to readily cleared PCB congeners (PCBs 44, 49, 101,and 110) along the digestive tract and in the liver and WBH ofthe fulmars. These congeners were recalcitrant/readily clearedby adult and juvenile American kestrels (Falco sparverius)[32,33]. Also, the recalcitrant congeners do not have vicinalunsubstituted carbon atoms at meta- and para- positions of thebiphenyl rings, and thus are structurally resistant to biotrans-formation [32–34], whereas this occurs at least once in thestructures of the readily cleared congeners. All eight of thesePCB congeners have similar log KOW values (range 5.8–6.9,Supplemental Data, Table S1), thus each of the fulmar mediahas a similar fugacity capacity or Z value for each congener anddifferences in the ratios between fulmar media reflect, in part,differing efficiencies of congener biotransformation. Along thefulmar digestive tract, the ratios of recalcitrant to easily clearedPCBs consistently increased from amphipods, to chyme, tointestine, followed by a decrease in the ratio in guano; similar toconcentration and fugacity trends observed in Figure 2. In theamphipods, some of the ratios were less than one, indicating thatprior to entering the digestive tract of the fulmar, some con-centrations of readily cleared PCBs were higher than those ofrecalcitrant PCBs. For example, concentrations of PCBs 49,101, and 110 were higher than that of PCB 118. Ratios werequite high in the intestine due to the very small concentrationsof readily cleared PCBs. These observations support the resultspreviously found for American kestrels [32,33] that these fourreadily cleared PCBs are metabolized preferentially and that thefour recalcitrant PCBs are retained more efficiently. Thisprocess can be observed incrementally as the prey and asso-ciated contaminants progress through the multistage digestivetract and are metabolized.
Fulmar dietary exposure to contaminants
Concentrations and fugacities of contaminants in the WBHwere generally between one and three orders of magnitudehigher than in the prey items (Fig. 3), indicating that biomag-nification is occurring, i.e., a sequence of solvent switching andsolvent reductions that increase both the fugacity and concen-tration in predators [12]. Crustaceans and Arctic cod areimportant prey items for northern fulmars in remote areas ofthe Canadian Arctic [11,31], thus reported contaminant con-centrations for these taxa in nearby northern Baffin Bay areincluded in Figure 3 and are labeled P1 and P2, respectively.The values shown for crustaceans are the mean of four speciesconsumed by fulmars, Calanus hyperboreus, Mysis oculata,Pandalus sp., and Parathemisto libellula. Standardizing theconcentrations and fugacities of each chemical group in thefulmar media and tissues to those of the WBH makes the trends
2060 Environ. Toxicol. Chem. 30, 2011 K.L. Foster et al.

along the digestive tract in Figure 2 more readily apparent.Indeed, within a given fulmar medium the values of both thestandardized concentrations and fugacities were generallywithin a factor of five for all of the chemical groups treated.
However, it must be noted that the chemical profile comprisingeach of the chemical groups may be different between fulmarsand prey, as discussed above, and birds are known to efficientlyclear some contaminants such as PCB congeners with vicinalhydrogens in meta- and para- positions [32,33].
Stomach oils
Concentrations (wet weight) of organochlorine contami-nants in the stomach oil were generally 1 to 2 orders ofmagnitude higher than in amphipods (Table 1), and between3 and 24 times higher than concentrations of contaminantsreported in Arctic cod and crustaceans (Fig. 3). However, thefugacities of contaminants in stomach oils were more consistentwith those of possible prey items, as discussed below. Thus,stomach oil formation from prey items is consistent with solventswitching [12], i.e., the partitioning of contaminants from low Zprey to high Z stomach oils. Stomach oil samples were morethan 80% lipid and thus had higher Z values, approximatelyfourfold higher, than in chyme and the small intestine.
Fugacities of organochlorine contaminants in stomach oilstended to be more consistent with those of the amphipodsthan with those of the fulmar WBH (Figs. 2, 3). On average,chemical fugacities measured in amphipods (P) were five-foldof stomach oils (S); fP/fS ranged from 0.01 to 4.2 for all PCBcongeners measured and 0.08 to 55.6 for all OCPs measured.Chemicals in the WBH (B) were on average 120-fold ofstomach oils; fB/fS ranged from 1.0 to 376.0 for all PCBcongeners measured and 0.3 to 464.8 for all OCPs. Theseresults support that stomach oils are of dietary origin and notsecreted by the birds. Additional prey items in the fulmar dietmay contribute to variability between stomach oil and amphi-pod fugacities.
Furthermore, ratios of recalcitrant to readily cleared PCBs instomach oils were less than those of either liver or WBH by 1 or2 orders of magnitude. For example, Concn.PCB153/Concn.PCB49was 30 in stomach oils and 5,153 in the WBH, a 172-folddifference. The higher proportion of readily metabolizedPCBs in stomach oils is more consistent with amphipods
Concn.
X/ Concn. B
0.0001
0.001
0.01
0.1
1
P1 P2 P S C I G L B
f X/ f B
0.001
0.01
0.1
1
ΣΣΣΣCBZ ΣΣΣΣCHLΣΣΣΣDDTΣΣΣΣPCB
Fig. 3. Concentrations and fugacities of fulmar tissue X standardized towhole body homogenate (B) values. Tissues are stomach oils (S), chyme (C),small intestine (I), guano (G), and liver (L). Literature values for typical preyitems of fulmars are also shown: crustaceans (P1, [45]), Arctic cod (P2, [30]),and amphipods (P, present study). SCBZ, SCHL, and SPCB are the sum ofchlorobenzenes, chlordanes, and polychlorinated biphenyls, respectively.
Table 2. Concentration ratios (Concn.i/Concn.j) of recalcitrant (i) to readily cleared (j) polychlorinated biphenyl (PCB) congeners in northern fulmar tissues.All eight congeners have similar octanol-water partition coefficients (logKOW)
PCB congeners Concni/Concnj
Recalcitrant Readily cleared Preya Stomach oils Chyme Intestineb Guanoc Liverd Whole body homogenatee
66 44 NAf 2.4 3.9 33.1 NA NA 36.649 NA 3.5 5.3 509.6 NA 49.5 178.2101 NA 2.2 3.2 2476.7 NA 26.9 34.4110 NA 3.8 4.2 23.2 NA 19.0 NA
105 44 NA 2.4 4.7 56.8 NA NA 70.249 2.2 3.5 6.4 874.7 1.1 86.0 342.3101 0.1 2.2 3.9 4251.3 1.7 46.7 66.0110 1.2 3.9 5.1 39.8 1.0 33.0 NA
118 44 NA 8.5 18.3 238.0 NA NA 339.049 3.3E-01 12.5 25.2 3666.6 4.6 334.6 1651.8101 1.9E-02 7.7 15.2 17821.4 6.9 181.9 318.5110 1.8E-01 13.7 19.8 166.7 4.2 128.4 NA
153 44 NA 20.0 49.4 757.7 NA NA 1057.549 13.2 29.6 68.0 11672.7 6.6 1002.5 5153.1101 0.8 18.2 41.0 56735.1 10.0 545.0 993.8110 7.2 32.5 53.6 530.7 6.0 384.7 NA
aConcentrations of PCBs 49, 110 and 118 were below method detection limits (MDLs), PCBs 44 and 66 not detected.b Concentrations of PCBs 49 and 101 were below MDLs.c PCBs 44 and 66 not detected.d PCB 44 not detected.e PCB 110 not detected.f NA¼ not available.
Organochlorine contaminants in fulmars Environ. Toxicol. Chem. 30, 2011 2061

(Concn.PCB153/Concn.PCB49¼ 13) than with WBH, supportingthat stomach oils are diet-derived as opposed to secreted.
Contaminant transfer to predators
The consumption of an average adult fulmar from the CapeVera colony was calculated to transfer approximately 437mg oforganochlorine contaminants (SOCs) to a predator such as anArctic fox. The transfer of contaminants from fulmars topredators was computed by mathematically reconstructingthe fulmar body, which consists of both the liver and WBH,using liver and WBH masses and contaminant concentrations;illustrative calculations forSOCs are given in the SupplementalData (Table S5). These computations are likely a conservativeestimate of the amount of organochlorine contaminants in afulmar that are transferred to a predator because they do notinclude contaminants that could be in the wings, head, legs, ordigestive tract of the fulmars. Also, there are likely additionalorganochlorine chemicals in the fulmar which were not meas-ured here. The assumption is made that the predator willconsume the remainder of the carcass.
In a hypothetical example, if a mature Arctic fox were tosustain itself entirely on fulmars from the Cape Vera colony forfour months (the fulmars attend the colony from May to midSeptember [35]), it would consume approximately 84 fulmarsand be exposed to 51mg kg�1 d�1 of SOCs (Table 3). Chronicexposure to a comparable dosage (17mg kg�1 d�1) of organo-chlorine contaminants obtained from wild minke whale
(Balaenoptera acutorostrata) blubber has been shown to causethyroid gland, liver, and kidney lesions in farmed male Arcticfoxes, and to possibly affect bone strength and mineral density[36–38]. Similar computations of contaminant transfer fromfulmars to predators could be done for other predators, given theenergy requirement of the predator.
CONCLUSIONS
The present study presented organochlorine contaminantconcentrations, stable nitrogen isotopes (where possible),fugacities, and fugacity capacities along the digestive tractfrom prey through to guano and in the whole body and liverof northern fulmars from a High Arctic colony. Such data arenot typically reported for wild Arctic seabirds, yet we haveillustrated their utility not only to the ongoing monitoring ofcolony health, but also to studies of contaminant fate andexposure in fulmars, as well as to the contaminant exposureand risk of fulmar predators including the Arctic fox. Thehomogenization of an entire bird and its analysis for contam-inants may not always be possible, but the fugacity of the livermay serve as a reasonable approximation of the fugacity in thewhole body for some chemicals. Segmenting the digestive tractis a promising approach for investigating the progression ofprey and associated contaminants through the multistagedmetabolism processes of wild seabirds. In addition to improvingunderstanding of chemical metabolism and accumulation
Table 3. Example of energy and mass balance calculations of dietary exposure of fulmar-derived organochlorine contaminants (SOC) to predators. The SOCexposure to an Arctic fox is computed for the hypothetical scenario in which the fox derives all of its energy requirements for four months from northern fulmars
at Cape Vera Devon Island
Value Reference
Arctic fox energy requirementsMass of fox (MFox g) 6000a [36]Field metabolic rate (FMR)FMR (kJ d�1)¼ 6.68 (MFox)
0.67; (for mammals) 2 271b [39]Energy requirement (EFox) for 120 d (four months; May-Aug):EFox (kJ)¼ 120 FMR 272 470
Metabolizable energy fraction (y) fromProtein (yp) 0.83c [40]Fat (yf) 0.97c [40]
Energy content of fulmarsEnergy densities (ED)Protein (EDp kJ g
�1) 19 [41]Fat (EDf kJ g
�1) 40 [42]Fulmar compositionProtein
Mass of protein (Mp g) 100 [43]Fat
Mass fraction of lipids in liver (LL) 0.012 Table 1Mass fraction of lipids in WBH (LB) 0.12 Table 1Average mass of liver (ML g) 15 Table S5Average mass of WBH (MB g) 354 Table S5Total fat (Mf g)¼mass in liverþmass in WBH¼ (LLML)þ (LBMB) 42.7
Energy content available to an Arctic foxEFulmar (kJ fulmar�1)¼ protein energyþ fat energy
¼ (yp EDp Mp)þ (yf EDf Mf) 3233
Arctic fox exposure to SOCsNumber of fulmars consumed in 120 d (nFulmar)nFulmar¼EFox/EFulmar 84
Amount of SOC consumed (ASOC mg fulmar�1) 437 Table S5Exposure (mg kg�1 d�1)¼ nFulmar ASOC/(120MFox/1000) 50.9
aMass of adult farmed Arctic fox in the summer.b Comparable to a FMR of 2328 kJ d�1 measured for free-living red foxes in Australia [44].cMeasured fractions of digestible energy available to blue fox from crude protein and fat. These values have previously been used for Arctic fox bioenergeticscalculations [41].
2062 Environ. Toxicol. Chem. 30, 2011 K.L. Foster et al.

within seabirds, data of this nature are also readily applicable tothe development and validation of mass balance models ofcontaminant fate in seabirds and in seabird media includingstomach oils, which is relevant for petrels, an order of seabirdsthat are widely distributed from the tropics to the poles [7].
SUPPLEMENTAL DATA
Tables S1–S5. (123 KB).
Acknowledgement—Theauthors thank theNaturalSciencesandEngineeringResearch Council Canada for financial support in the form of a CGS Dscholarship awarded to K.L. Foster, and a Strategic Projects Grant to J.M.Blais, as well as Indian and Northern Affairs Canada (Northern ScientificTraining Program), Natural Resources Canada (Polar Continental ShelfProgram), and Environment Canada (Canadian Wildlife Service). Theauthors thank D. Mackay and K. Drouillard for editorial and technicalsuggestions. Excellent assistance in the field was provided by J. Akearok, A.Fontaine, and R. Macdonald.
REFERENCES
1. Hickey JJ, AndersonDW. 1968. Chlorinated hydrocarbons and eggshellchanges in raptorial and fish-eating birds. Science 162:271–273.
2. Weseloh DV, Teeple SM, Gilbertson M. 1983. Double-crestedcormorants of the Great Lakes: Egg-laying parameters, reproductivefailure, and contaminant residues in eggs, LakeHuron1972–1973.CanJZool 61:427–436.
3. GilchristHG,MalloryML.2005.Declines in abundance anddistributionof the ivory gull (Pagophila eburnea) in Arctic Canada. Biol Cons121:303–309.
4. Braune BM, Mallory ML, Gilchrist HG, Letcher RJ, Drouillard KG.2007. Levels and trends of organochlorines and brominated flameretardants in ivory gull eggs from the CanadianArctic, 1976 to 2004. SciTotal Environ 378:403–417.
5. Foster KL, Wang SW, Mackay D, Mallory ML, Blais JM. 2010.A preliminary assessment of avian stomach oils: A vector ofcontaminants to chicks and potential for diet analysis andbiomonitoring.Environ Sci Technol 44:6869–6874.
6. Boersma PD. 1986. Ingestion of petroleum by seabirds can serve as amonitor of water quality. Sci New Ser 231:373–376.
7. Warham J. 1996. The Behaviour, Population Ecology & Physiology ofthe Petrels. Academic Press, San Diego, CA, USA.
8. Roby DD, Brink KL, Place AR. 1989. Relative passage rates of lipidand aqueous digesta in the formation of stomach oils. Auk 106:303–313.
9. Wang SW, Iverson SJ, Springer AM, Hatch SA. 2007. Fatty acidsignatures of stomach oil and adipose tissue of northern fulmars(Fulmarus glacialis) in Alaska: Implications for diet analysis ofProcellariiform birds. J Comp Physiol B 177:893–903.
10. Braune BM, Mallory ML, Butt CM, Mabury SA, Muir DCG. 2010.Persistent halogenated organic contaminants and mercury in northernfulmars (Fulmarus glacialis) from the Canadian Arctic. Environ Pollut158:3513–3519.
11. Hatch SA, Nettleship DN. 1998. Northern fulmar (Fulmarus glacialis).In Poole A, Gill F, eds, The Birds of North America, 361. The Birds ofNorth America, Philadelphia, PA, USA, pp 1–32.
12. Macdonald R,MackayD, Hickie B. 2002. Contaminant amplification inthe environment. Environ Sci Technol 36:462A.
13. Mackay D. 2001. Multimedia Environmental Models: The FugacityApproach, 2nd ed. CRC, Boca Raton, FL, USA.
14. Mallory ML, Forbes MR. 2005. Sex discrimination and measurementbias inNorthernFulmars (Fulmarus glacialis) from theCanadianArctic.Ardea 93:25–36.
15. Warham J. 1977. The incidence, functions and ecological significance ofpetrel stomach oils. Proc N Zeal Ecol Soc 24:84–93.
16. Li NQ,Wania F, Lei YD, Daly GL. 2003. A comprehensive and criticalcompilation, evaluation and selection of physical-chemical propertydata for selected polychlorinated biphenyls. J Phys Chem Ref Data32:1545–1590.
17. Mackay D, Shiu WY, Ma KC. 2006. Handbook of Physical-ChemicalProperties and Environmental Fate for Organic Chemicals. CRC, BocaRaton, FL, USA.
18. U.S. Environmental Protection Agency. 2009. Estimation ProgramInterfaces Suite (EPI Suite) Version 4.0. Washington, DC, USA.
19. Fisk AT, Hobson KA, Norstrom RJ. 2001. Influence of chemical andbiological factors on trophic transfer of persistent organic pollutants
in the northwater marine food web. Environ Sci Technol 35:732–738.
20. Mallory ML, Forbes MR, Ankney CD, Alisauskas RT. 2009. Nutrientdynamics and constraints on the pre-laying exodus of High Arcticnorthern fulmars. Aquat Biol 4:211–223.
21. Hobson KA, Fisk A, Karnovsky N, Holst M, Gagnon J-M, Fortier M.2002. A stable isotope (d13C, d15N) model for the north water food web:Implications for evaluating trophodynamics and the flow of energy andcontaminants. Deep-Sea Res II 49:5131–5150.
22. Barron MG, Galbraith H, Beltman D. 1995. Comparative reproductiveand developmental toxicology of PCBs in birds.Comp BiochemPhysiol112C:1–14.
23. Letcher RJ, Bustnes JO, Dietz R, Jenssen BM, Jørgensen EH, Sonne C,Verreault J, Vijayan MM, Gabrielsen GW. 2010. Exposure and effectsassessment of persistent organohalogen contaminants in arctic wildlifeand fish. Sci Total Environ 408:2995–3043.
24. Mallory ML, McLaughlin JD, Forbes MR. 2007. Breeding status,contaminant burden and helminth parasites of northern fulmarsFulmarus glacialis from the Canadian high Arctic. Ibis 149:338–344.
25. Duke GE. 1997. Gastrointestinal physiology and nutrition in wild birds.Proc Nutr Soc 56:1049–1056.
26. Moser GA, McLachlan MS. 2002. Partitioning of polychlorinatedbiphenyls and hexachlorobenzene into human faeces. Chemosphere46:449–457.
27. Gobas FAPC, Wilcockson JB, Russell RW, Haffner GD. 1999.Mechanism of biomagnification in fish under laboratory and fieldconditions. Environ Sci Technol 33:133–141.
28. Drouillard KG. 2001. Modeling the toxicokinetics and biomagnifica-tions of polychlorinated biphenyls (PCBs) in birds. PhD thesis. TrentUniversity, Peterborough, ON, Canada.
29. KellyBC, IkonomouMG,Blair JD,MorinAE,GobasFAPC.2007.Foodweb-specific biomagnifications of persistent organic pollutants. Science317:236–239.
30. Minister of Public Works and Government Services Canada. 2003.Canadian Arctic Contaminants Assessment Report II (CACAR II):Contaminant levels, trends and effects in the biological environment.QS-8525-001-EE-A1. Indian andNorthernAffairsCanada,Ottawa,ON.
31. Byers T, Smith A, Mallory ML. 2010. Diet of black guillemots andnorthern fulmars breeding beside a High Arctic polynya. Polar Biol33:457–467.
32. Drouillard KG, Fernie KJ, Smits JE, Bortolotti GR, Bird DM, NorstromRJ. 2001. Bioaccumulation and toxicokinetics of 42 polychlorinatedbiphenyl congeners in American kestrels (Falco sparverius). EnvironToxicol Chem 20:2514–2522.
33. Drouillard KG, Fernie KJ, Letcher RJ, Shutt LJ, Whitehead M, GebinkW, Bird DM. 2007. Bioaccumulation and biotransformation of 61polychlorinated biphenyl and four polybrominated diphenyl ethercongeners in juvenile American kestrels (Falco sparverius). EnvironToxicol Chem 26:313–324.
34. Safe S. 1980. Metabolism, uptake, storage and bioaccumulation ofhalogenated aromatic pollutants. In Kimbrough RD, Jenson AA, eds,Halogenated Biphenyls, Terphenyls, Naphthalenes, Dibenxodioxins,and Related Products, 2nd ed. Elsevier, Amsterdam, The Netherlands,pp 81–107.
35. Gaston AJ, Mallory ML, Gilchrist HG, O’Donovan K. 2006. Status,trends and attendance patterns of the Northern Fulmar (Fulmarusglacialis) in Nunavut, Canada. Arctic 59:165–178.
36. Sonne C, Wolkers H, Leifsson PS, Jenssen BM, Fuglei E, Ahlstrøm Ø,Dietz R,KirkegaardM,Muir DCG, Jørgensen E. 2008.Organochlorine-inducedhistopathology inkidneyand liver tissue fromArctic fox (Vulpeslagopus). Chemosphere 71:1214–1224.
37. Sonne C, Wolkers H, Leifsson PS, Iburg T, Jenssen BM, Fuglei E,Ahlstrøm Ø, Dietz R, Kirkegaard M, Muir DCG, Jørgensen EH. 2009.Chronic dietary exposure to environmental organochlorine contami-nants induces thyroid gland lesions in Arctic foxes (Vulpes lagopus).Environ Res 109:702–711.
38. Sonne C, Wolkers H, Riget FF, Jensen J-EB, Teilmann J, Jenssen BM,Fuglei E,AhlstrømØ,DietzR,MuirDCG, Jørgensen EH. 2009.Mineraldensity and biomechanical properties of bone tissue from male Arcticfoxes (Vulpes lagopus) exposed to organochlorine contaminants andemaciation. Comp Biochem Physiol C 149:97–103.
39. RiekA. 2008.Relationshipbetweenfieldmetabolic rate andbodyweightin mammals: Effect of the study. J Zool 276:187–194.
40. Vhile SG, Skrede A, Ahlstrøm Ø, Hove K. 2005. Comparative apparenttotal tract digestibility of major nutrients and amino acids in dogs (Canisfamiliaris), blue foxes (Alopex lagopus) andmink (Mustela vison).AnimSci 81:141–148.
Organochlorine contaminants in fulmars Environ. Toxicol. Chem. 30, 2011 2063

41. Careau V, Giroux J–F, Gauthier G, Berteaux D. 2008. Surviving oncached foods— theenergeticsof egg-cachingbyarctic foxes.CanJZool86:1217–1223.
42. Peters RH. 1983. The Ecological Implications of Body Size. CambridgeUniversity, New York, NY, USA.
43. Mallory ML, Forbes MR. 2008. Costly pre-laying behaviors andphysiological expenditures by northern fulmars in the high Arctic.Ecoscience 15:545–554.
44. Winstanley RK, Buttemer WA, Saunders G. 2003. Field metabolic rateand body turnover of the red fox (Vulpes vulpes) inAustralia.MammRev33:295–301.
45. Fisk AT, Hoekstra PF, Gagnon J-M, Duffe J, Norstrom RJ,Hobson KA, Kwan M, Muir DCG. 2003. Influence of habitat,trophic ecology and lipids on, and spatial trends of, organochlorinecontaminants in Arctic marine invertebrates. Mar Ecol Prog Ser262:201–214.
2064 Environ. Toxicol. Chem. 30, 2011 K.L. Foster et al.