Embed Size (px)
Citation preview

Anaheim, CA | February 2-5, 2014

Chris HopkinsTechnical Product Marketing ManagerMicrosoft
Building Stellar Project BI Dashboards with Visio
PC222

Session Objectives And TakeawaysBuilding a BI dashboard using Visio + Visio ServicesUnlock advanced capabilities using out-of-the-box features
Data Linking Best PracticesExcel ServicesSharePoint ListsSQL Server – On Premises + AzureBCSCustom
Advanced Dashboard CapabilitiesWeb Part ConnectionsMash up APICustom Integration

Capabilities

• Renders diagrams in the browser• High quality PNG(s) for full fidelity• No dependence on Silverlight• Native support for the Visio file format• Diagram consumers do not need a Visio client • Available across devices using desktop browsers and mobile browsers
• Users interact with content• Pan, Zoom, Hyperlinks, View Shape Data
• Accessible only via SharePoint• On premises & in cloud using Office 365
Visio Services…
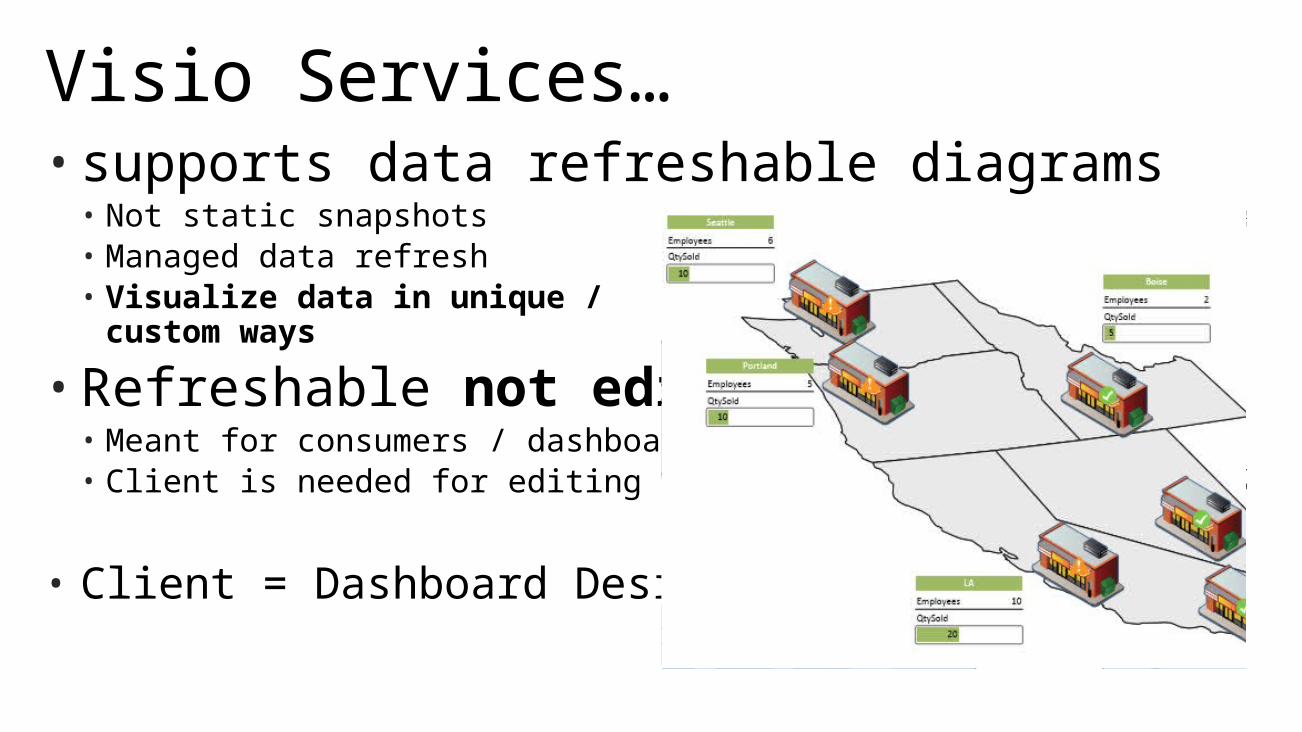
• supports data refreshable diagrams• Not static snapshots• Managed data refresh• Visualize data in unique /
custom ways
• Refreshable not editable• Meant for consumers / dashboards• Client is needed for editing
• Client = Dashboard Designer
Visio Services…

Demo
Various Visio Dashboard Examples

• Microsoft LATAM
Sales Dashboard

Process Repository
© IOZ AG

SharePoint Topology Add-in

Building a Visio dashboard

Components
What Design?Visio ShapesData GraphicsCustom ShapesImagesClipartCADSVG…
What Data?SharePointExcelSQL…

• Surface Shape Data values• Visual version of ‘Insert Field’
• Dynamic shape behaviors• Icon Sets• Text Callouts• Data Bars• Color by Value
• Build your own• These are just special Visio shapes
Data Visualization using Data Graphics
Text Callouts
Icon Sets
Data Bars
Color By Value
Risks 2Issues 1
Total Cost $ 997,220.00Total Benefits $ 1,351,000.00ROI 0.3548
Project HealthRisk Rating
Payroll System Upgrade

Production90 Day Avg (hrs): 21.2
Exceptions: 2
Actual (hrs): 23.7Target (hrs): 22
• Build behavior into your shapes which respondto data changes• Change formatting• Change text• Change geometry• Change size and position• Change visibility
• All shapes evaluated for rendering• Visio Services in 2010 was limited to Data Graphics
Data Visualization using shape behavior
Production90 Day Avg (hrs): 21.2
Exceptions: 2
Actual (hrs): 10Target (hrs): 22

1. Link record set(s) to diagram• Multiple data record sets supported within a single diagram• Data is cached in the diagram for portability
2. Link record(s) to shape(s)• Link 1 record to N number of shapes• Link 1 record from each record set to the same shape
3. Configure Data Graphics• Rules evaluate based on values / formulas
Data Linking - a 3 step process
Risks 2Issues 1
Total Cost $ 997,220.00Total Benefits $ 1,351,000.00ROI 0.3548
Project HealthRisk Rating
Payroll System Upgrade

• Shape Data supports formulas• Create a new property for your shapes that performs calculations
based on the other linked Shape Data properties
• Data Graphics support formulas• {field name}• Otherwise use
ShapeSheetsyntax
• Data Source• Calculated at the source
• Views, Store Procedures, PowerPivot, …
Aggregate data from refresh

Demo
Getting the most out of Visio Services when building a diagram for BI

% Complete
0
Risks 2Issues 1
Total Cost $ 997,220.00Total Benefits $ 1,351,000.00ROI 0.3548
Project HealthRisk Rating
Payroll System Upgrade
Advanced BI starts with the client
IT
68.32%Remaining Work
-14.90%Remaining Spend
Projects Count 6
Hyperlink to detail pages
Combine Data Graphic Items
Link records to multiple shapes
Aggregate using Property Formulas
Data sourcebest practices

• Visio Services refreshes from anumber of data sources• Excel Services
• Ranges and Tables• SharePoint Lists
• Native Lists• External Lists (BCS)
• SQL• SQL Server• SQL Azure
Advanced data scenarios
.NETOLED
BODBC
SP Lists
Excel Servic
es
+
BCS
Custom
Excel Services
SharePoint Lists&BCS
BCS&SQL
Custom
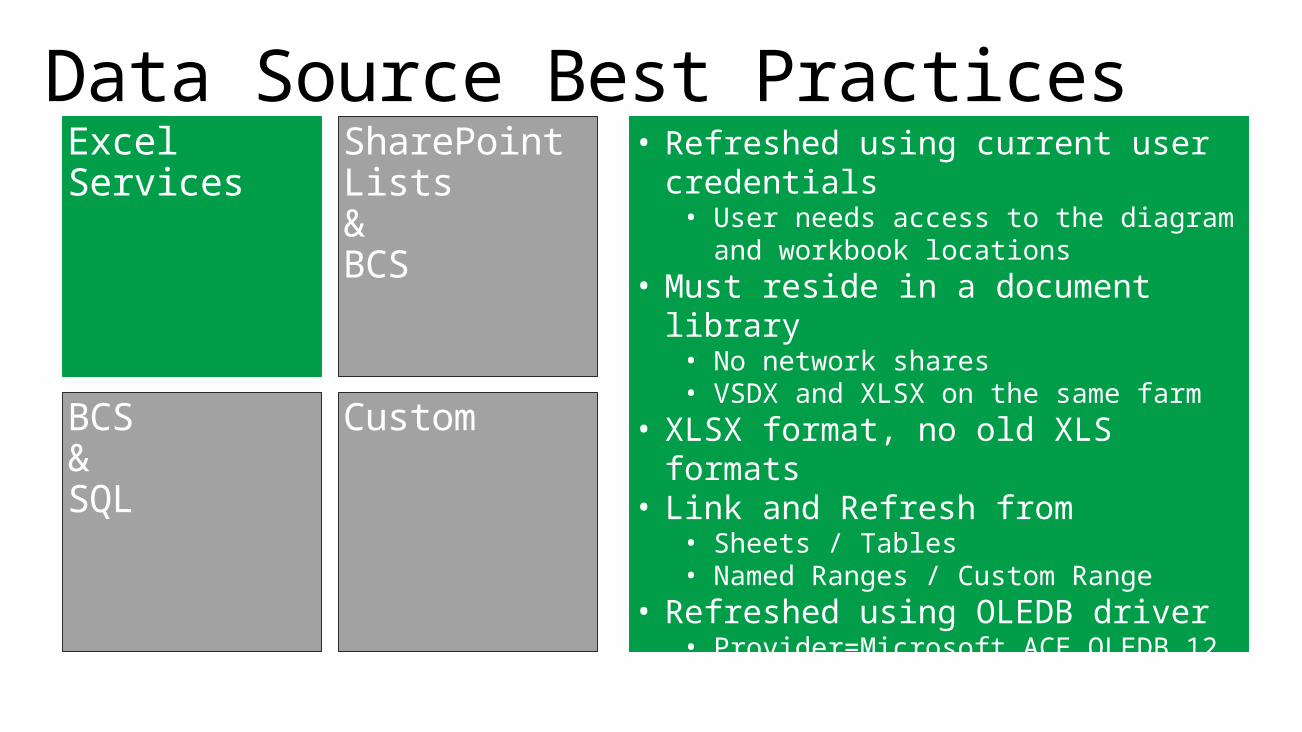
Data Source Best Practices• Refreshed using current user
credentials• User needs access to the diagram and
workbook locations• Must reside in a document library
• No network shares• VSDX and XLSX on the same farm
• XLSX format, no old XLS formats• Link and Refresh from
• Sheets / Tables• Named Ranges / Custom Range
• Refreshed using OLEDB driver• Provider=Microsoft.ACE.OLEDB.12…

Excel Services
SharePoint Lists&BCS
BCS&SQL
Custom
Data Source Best Practices

Excel Services&PowerPivotGallery
SharePoint Lists&BCS
BCS&SQL
Custom
Data Source Best Practices

Excel Services
SharePoint Lists&BCS
BCS&SQL
Custom
Data Source Best Practices• SharePoint Lists are an easy yet
powerful data source• Same farm as the Visio diagram• User needs read access to the list
• Get your data in a list and VGS can refresh from it
• Manual Edit• SharePoint Workflow• Timer Job• Web Service• PowerShell Script• Applications or Services

Excel Services
SharePoint Lists&BCS
SQL &SQL Azure
Custom
Data Source Best Practices• BCS allows you to configure
external content types for connecting to
• External SQL DBs• SQL On Premises• SQL Azure• WCF Services• Custom .NET providers
• External Lists are fully supported inVisio 2013
• BCS add-in for 2010

Excel Services
SharePoint Lists&BCS
SQL&SQL Azure
Custom
Data Source Best Practices• Support for SQL Server 7.0 –>
2012• + SQL Azure
• No Analysis Services or Reporting Services
• at least not directly• Tables & Views
• provided via Visio Data Linking dialog
• Can we refresh from Stored Procedures?
• Yes!• Not available in the Visio client UI for
the SQL data source option• Configure BCS to execute the stored
procedure – connect Visio via External List

Excel Services
SharePoint Lists&BCS
SQL&SQL Azure
Custom
Data Source Best Practices• Server Code
• .NET assembly deployed to the GAC and registered as a Trusted Data Provider for the Visio Services service application
• Implements AddonDataHandler• Returns a .NET DataSet object to Visio
Services• Client Code
• Create and maintain the record set• Set the ConnectionString so Visio
Services knows to call your data provider
• Example: Visio add-in for System Center 2012 Operations Manager

Integration

• Visio Web Access web part• Build a custom page focused on a particular diagram and customize
the user experience• Auto Refresh
• Web Part Connections• Setup part to part communications to enable predetermined
integration scenarios
• JavaScript Mash-up API• Write your own custom dash board using JavaScript, ASP .NET, etc.
SharePoint Integration options

• Control the experience for the diagram• Set Pan, Zoom, Selection, and Hyperlink behavior• No Chrome experience for clean integration• Auto refresh capability by the minute
• Web Part Connections• Set the diagram that is being rendered in the web part• Set the view to a specific shape in the diagram• Highlight a specific shape(s)• Filter the diagram• Send Shape Data to a consumer
Visio Web Access web part

• JavaScript client side API• Investigate pages, shapes, shape data, hyperlinks• React to events like users clicking on shapes• Additional APIs for Commenting features
• HTML Overlays• Embed HTML5 elements at runtime
• Canvas• Videos• Audio• Animations
Visio Services is extensible…

MICROSOFT CONFIDENTIAL – INTERNAL ONLY
Demo
Enhancing the dashboard experienceusing web part connectionsand JavaScript API

Other integration opportunities• Project Server / Project Online
provides project data from Odata based web services.
• Data connect Visio diagrams to the pivot tables in PowerPivot
• Incorporate PowerView in a Mashup with Visio Services connected to the same data source
Project ServerProject Online
System Center
SAPDynamicsWeb Service
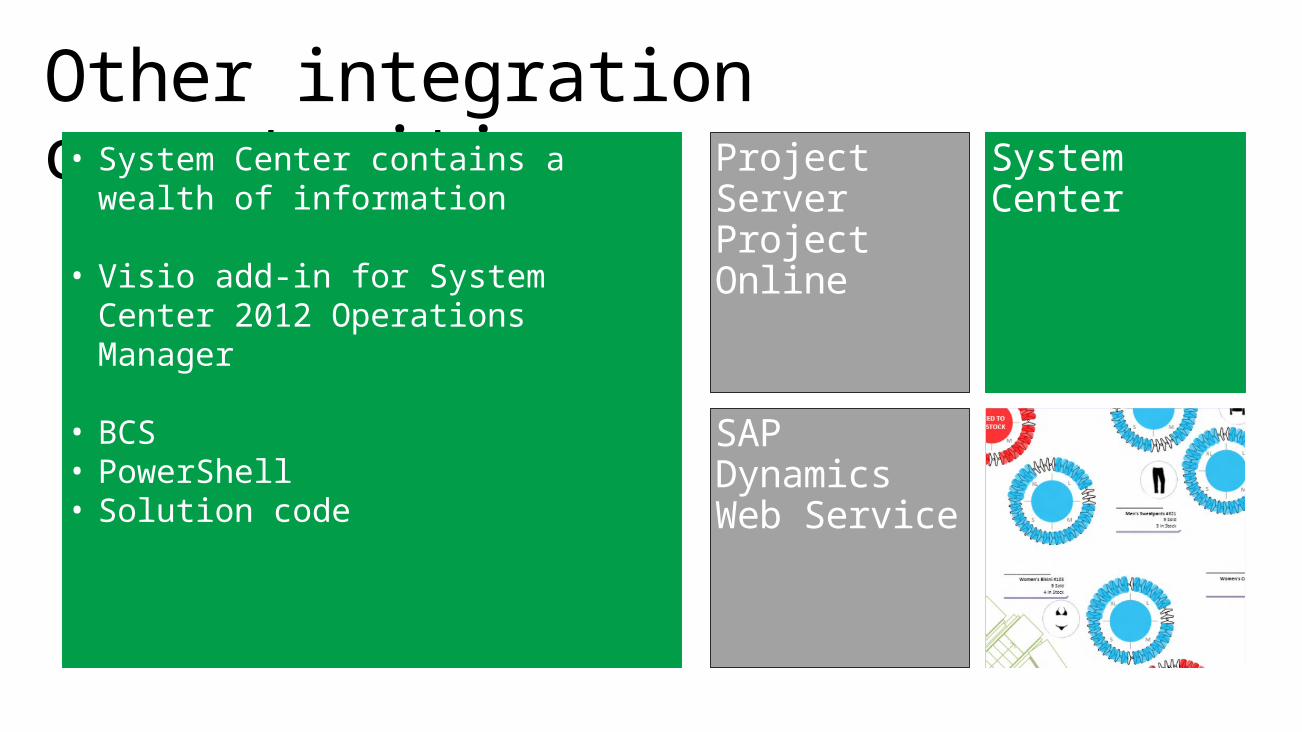
Other integration opportunities• System Center contains a wealth
of information
• Visio add-in for System Center 2012 Operations Manager
• BCS• PowerShell• Solution code
Project ServerProject Online
System Center
SAPDynamicsWeb Service

Other integration opportunities• SAP
• Dynamics
• Web Services• XML, JSON
• BCS• PowerShell• Solution code
Project ServerProject Online
System Center
SAPDynamicsWeb Service

In Review: Session Objectives And TakeawaysData Linking best practices
Utilize OOB data sources - Nothing wrong with Custom but limited to Visio Services refresh
Schema Changes – Were not just talking about Data Types, no missing rows or columnsConfigure views or queries or filters that give you predictable results
Multiple data sources, multiple shapes, Shape Data formulas
Drill downs and PivotsJust hyperlinking and page navigation
MashupsJavaScript API

Related Content
Official Product Sitehttp://visio.microsoft.com
Product Team bloghttp://blogs.office.com/b/visio/
Chris Hopkins Visio Bloghttp://blogs.msdn.com/b/chhopkin/
Visio Ignite Traininghttp://msdn.microsoft.com/en-US/office/dn448488

Q&A

MyPC fill out evaluations & win prizes!
Fill out session evaluations by logging into MyPC on your laptop or mobile device.
Evaluation prizes daily! Claim your prize at the Registration Desk on Level 1.
www.msprojectconference.com
After the event, over 100 hours of resources; including all of the PPT decks and session videos will be available.

© 2014 Microsoft Corporation. All rights reserved. Microsoft, Windows and other product names are or may be registered trademarks and/or trademarks in the U.S. and/or other countries.The information herein is for informational purposes only and represents the current view of Microsoft Corporation as of the date of this presentation. Because Microsoft must respond to changing market conditions, it should not be interpreted to be a commitment on the part of Microsoft, and Microsoft cannot guarantee the accuracy of any information provided after the date of this presentation. MICROSOFT MAKES NO WARRANTIES, EXPRESS, IMPLIED OR STATUTORY, AS TO THE INFORMATION IN THIS PRESENTATION.