Embed Size (px)
Citation preview

1
Appendix for “Default Positions: What Shapes Public Attitudes about International Debt Disputes?
Table A1: Presents summary statistics for all of the variables included in the APES dataset. Table A2: Presents summary statistics for all of the variables included in the Isonomía dataset. Table A3: Presents pairwise correlations for the main variables included in the APES dataset. Table A4: Presents pairwise correlations for the main variables included in the Isonomía dataset. Figure A1: This figure shows trends in four measures of attitudes towards debt repayment, using data from eight surveys conducted by Poliarquía Consultores. The squares indicate the sample proportion for the listed variable in each survey for which data is available; the lines present the 95% confidence intervals of the proportions. All four indicators are consistent with the claim that average opinion was more favorable towards debt repayment in 2016 than earlier. We discuss each indicator in turn.
• Opposition to Repayment: The upper-left quadrant displays the proportion of respondents in each survey that opposed repaying debt. The September 2013 survey asked: “As a rule, do you believe (a) that the Argentinean debt must be paid in full, (b) must be paid only if no other priorities or (c) should not be paid?” Since there are virtually always competing priorities for resources, respondents in both the second and third groups are coded as opposed to debt repayment. The six surveys from 2014 use identical question wording: “What do you think Argentina should do now that there is a judicial ruling that obligates it to pay the debt: (a) to accept the judgment and pay the debt or (b) to reject the judgment and refuse to pay?” The former category are coded as favoring repayment and the latter as opposed to repayment. The February 2016 survey asks the following question: “Argentina maintains an unpaid debt with holdouts that did not enter into the last debt swap. What do you think Mauricio Macri should do: (a) pay the debt, (b) negotiate a reduction or (c) keep it unpaid as it has until now?” Individuals that responded that debt should be kept unpaid are coded as opposed to repayment. We code the middle category as supportive of repayment because it hews closer to the pro-repayment position of the government at the time of the survey, which was in the midst of negotiations to end the dispute, which involved paying the creditors. The fact that respondents that held more positive evaluations of Macri’s handling of the debt dispute in this survey were less likely to favor non-payment but more likely to favor both negotiation and payment also suggests that respondents viewed the negotiation category as being closer to a repayment than non-payment stance at this time. The figure shows that

2
opposition to repayment is much lower in the final survey than in earlier ones. While this is suggestive of a shift in opinion, the differences in question wording and in the number of response-categories, between this question and prior questions makes comparison difficult. Hence, we supplement this data with three other indicators of attitudes towards debt repayment that had identical question wording across multiple surveys.
• Approval of President’s Handling of Debt Dispute: The upper-right quadrant displays the proportion of respondents that approve of the President’s handling of the debt dispute. The five surveys from August 2014 through February 2016 ask: “How do you evaluate how [Kirchner/Macri’s] government is handling the situation with the holdouts?” The June and July 2014 surveys used slightly different language, focusing more broadly on “the issue of foreign debt” rather than focusing more narrowly on the holdouts. Respondents that answered “very good” or “good” in these questions are coded affirmatively; those that responded with “regular”, “bad” or “very bad” are coded as 0. This approval measure is always positive correlated with opposition to repayment variable in the Kirchner period (the correlation coefficient ranges from 0.32 to 0.61); it is negatively correlated with opposition to repayment in the Macri period (r = -0.44). The decline in approval of Kirchner’s handling of this issue in the second half of 2014 is indicative of increasing support for repayment. The very high approval ratings for Macri’s handling of the debt issue in February 2016, at a time when he was nearing completion of a deal with the creditors, also suggests that the population was broadly supportive of repayment.
• Beliefs about Consequences of Repayment: Three surveys asked whether an agreement with the holdouts would be (a) very beneficial, (b) quite beneficial, (c) a little beneficial, or (d) not beneficial. (There were very minor variations in the question phrasing across the three surveys, but not in the nature of the question being asked. These differences seem unlikely to impact average responses.) Respondents in the first two categories were coded as believing that repayment would be beneficial. This variable is also correlated with opposition to repayment in all three surveys, relatively weakly in the first two cases (r = -0.11 and -0.22) and strongly in the final survey (r = -0.52). The lower-left quadrant of the figure shows that more respondents believed that repayment would be beneficial in 2016 than in either of the 2014 surveys. The difference between February 2016 and December 2014 is large and statistically significant. The difference between February 2016 and September 2014 is smaller, though it is statistically significant at the ten percent level.
• Blame Attribution: The lower-right quadrant displays the proportion of respondents, across four surveys, that blamed the creditors, rather than the government, for the debt dispute. Four surveys asked the following question: “Why do you think that the government has not been able to solve the part of the foreign debt that is still in default: (a) because the demands of the creditors are excessive, or (b) because [the Argentine government has/Kirchner government had] no willingness to pay?” This variable is only weakly correlated with opposition to repayment (r = 0.15) in the first survey, but the

3
correlations are strong in the other three surveys (correlation coefficients range from 0.41 to 0.52). Far fewer individuals blamed the excessive demands of the creditors for the ongoing dispute in 2016 than in 2013-2014.
Table A5: Presents results of main regression models. The output of these models is used to construct the marginal effects presented in Figure 1. Table A6: These models add additional control variables to our baseline specification to address alternative explanations. The output of these models is used to construct the marginal effects presented in Figure 2.
• Model 1: Controls for a respondent’s income level. This variable, which was available in the 2015 survey, measures a respondent’s monthly household income. Respondents were given eleven income bins, where higher integers indicate higher levels of income.
• Model 2: Controls for a respondent’s attitude towards four other economic policy issues: agreement with state ownership, agreement with price regulations, agreement with foreign exchange controls, and agreement with trade barriers. These variables are coded as 1 if a respondent strongly agreed or somewhat agreed with these policies and coded as 0 if respondent answered “neither agree nor disagree”, “somewhat disagree”, or “strongly disagree”.
• Model 3: Controls for a respondent’s degree of political knowledge, which is measured as the number of fact-based questions that a respondent answers correctly. In the 2015 survey, we use four factual questions: (1) the number of provinces in Argentina; (2) the name of Argentina’s Minster of Economy; (3) name of the Brazilian President; and (4) type of political reform that occurred within the previous four years.
• Model 4: Controls for a respondent’s degree of political knowledge, which is measured as the number of fact-based questions that a respondent answers correctly. In the 2016 survey, we use nine factual questions, each of which asks which President was responsible for a particular policy change. The nine policies in question are: (1) Mercosur; (2) Convertibility Law; (3) nationalization of YPF; (4) introduction of “cepo cambiario”; (5) repeal of “cepo cambiario”; (6) introduction of unremunerated reserve requirements on foreign investors; (7) removal of the unremunerated reserve requirement on foreign investors; (8) same-sex marriage; (9) Universal Child Allowance.
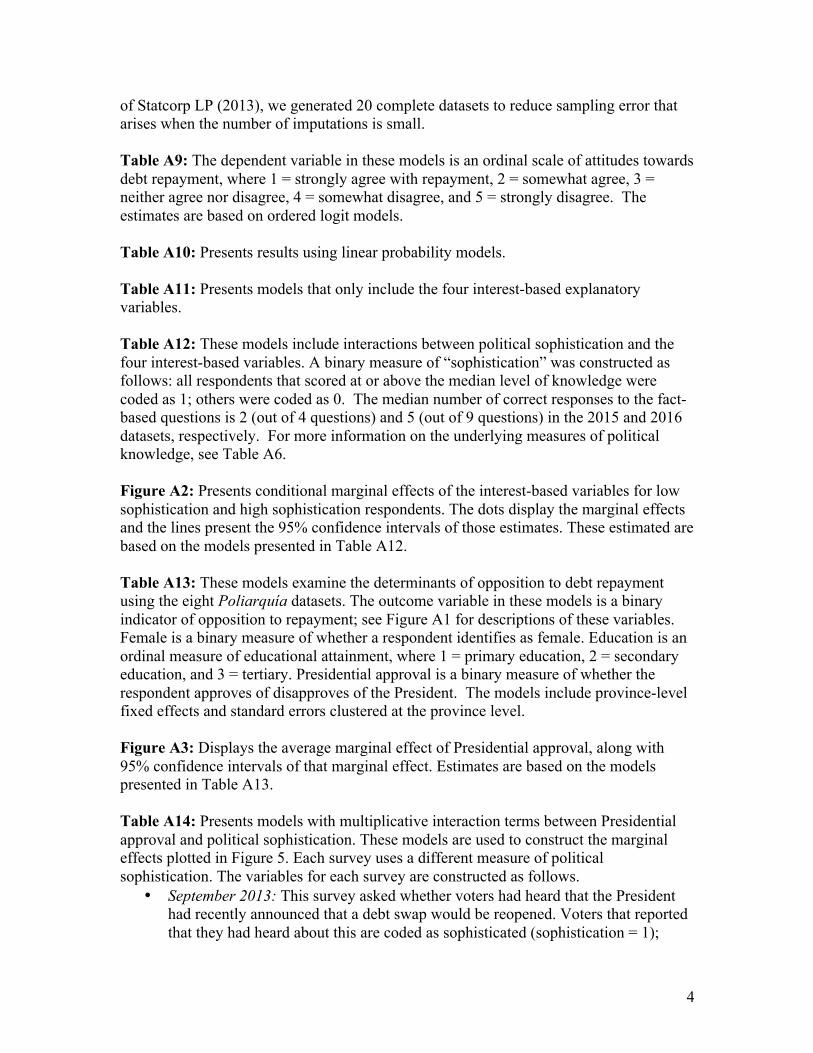
Table A7: These models use alternative measures of some of the key variables of interest. Model 1 uses an indicator of whether the respondent’s father was a Peronist to capture an aspect of political identity that predates the current debt dispute. Models 2 and 3 replaces the credit card ownership variable with a binary indicator of whether a respondent has a loan from a financial institution as an alternative measure of an individual’s sensitivity to interest rates.
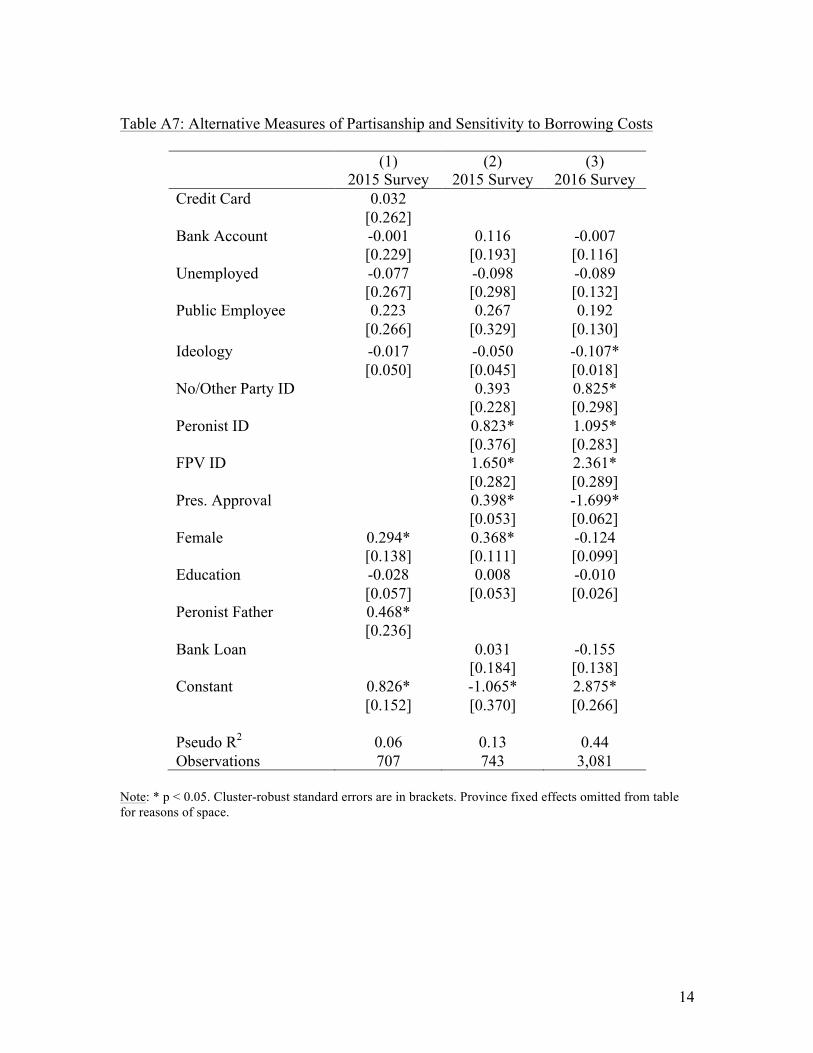
Table A8: These models are based on multiply imputed datasets. Multiple imputation was conducted using the mi suite of commands in Stata. Following the recommendations
4
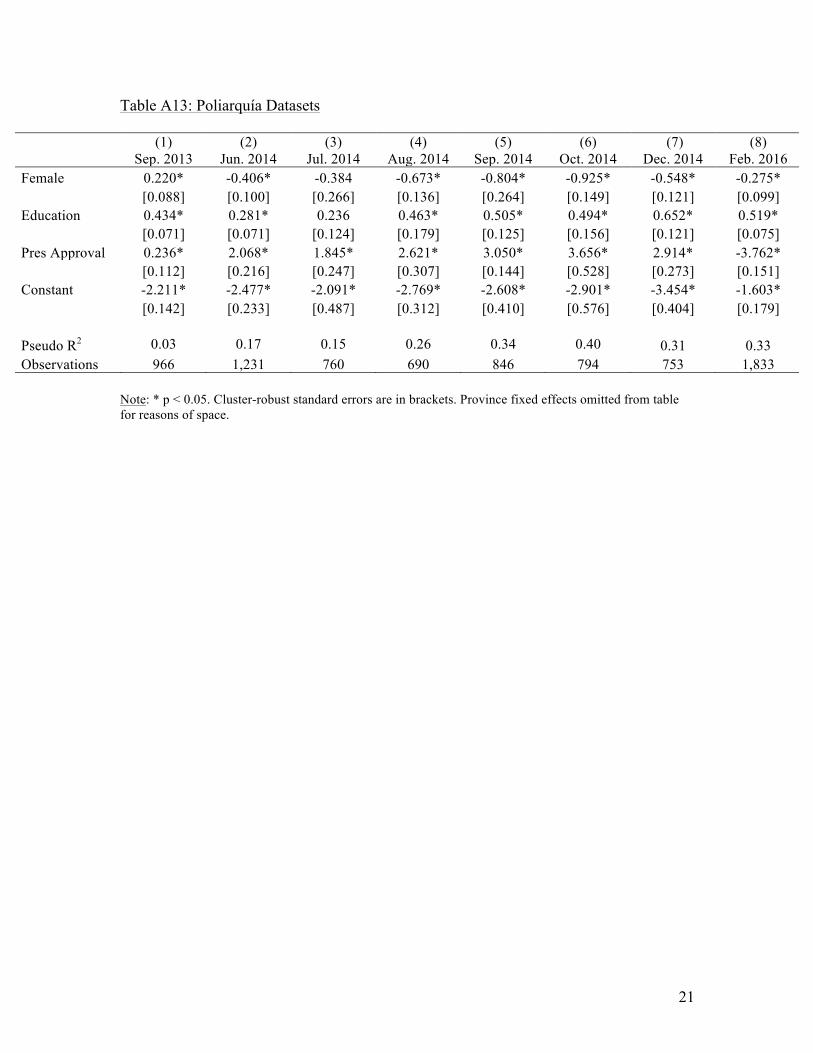
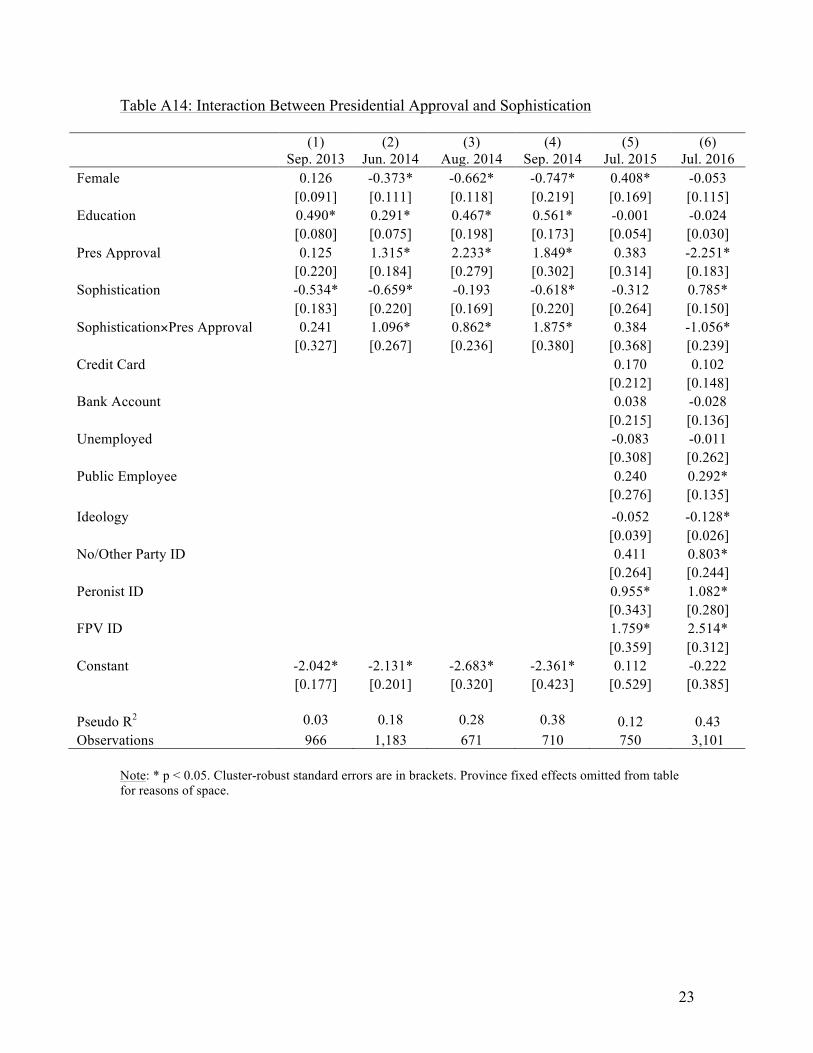
of Statcorp LP (2013), we generated 20 complete datasets to reduce sampling error that arises when the number of imputations is small. Table A9: The dependent variable in these models is an ordinal scale of attitudes towards debt repayment, where 1 = strongly agree with repayment, 2 = somewhat agree, 3 = neither agree nor disagree, 4 = somewhat disagree, and 5 = strongly disagree. The estimates are based on ordered logit models. Table A10: Presents results using linear probability models. Table A11: Presents models that only include the four interest-based explanatory variables. Table A12: These models include interactions between political sophistication and the four interest-based variables. A binary measure of “sophistication” was constructed as follows: all respondents that scored at or above the median level of knowledge were coded as 1; others were coded as 0. The median number of correct responses to the fact-based questions is 2 (out of 4 questions) and 5 (out of 9 questions) in the 2015 and 2016 datasets, respectively. For more information on the underlying measures of political knowledge, see Table A6. Figure A2: Presents conditional marginal effects of the interest-based variables for low sophistication and high sophistication respondents. The dots display the marginal effects and the lines present the 95% confidence intervals of those estimates. These estimated are based on the models presented in Table A12. Table A13: These models examine the determinants of opposition to debt repayment using the eight Poliarquía datasets. The outcome variable in these models is a binary indicator of opposition to repayment; see Figure A1 for descriptions of these variables. Female is a binary measure of whether a respondent identifies as female. Education is an ordinal measure of educational attainment, where 1 = primary education, 2 = secondary education, and 3 = tertiary. Presidential approval is a binary measure of whether the respondent approves of disapproves of the President. The models include province-level fixed effects and standard errors clustered at the province level. Figure A3: Displays the average marginal effect of Presidential approval, along with 95% confidence intervals of that marginal effect. Estimates are based on the models presented in Table A13. Table A14: Presents models with multiplicative interaction terms between Presidential approval and political sophistication. These models are used to construct the marginal effects plotted in Figure 5. Each survey uses a different measure of political sophistication. The variables for each survey are constructed as follows.
• September 2013: This survey asked whether voters had heard that the President had recently announced that a debt swap would be reopened. Voters that reported that they had heard about this are coded as sophisticated (sophistication = 1);

5
those reported that they had not heard about this event are coded as unsophisticated (sophistication = 0).
• June 2014: This survey included two questions about attention to the debt dispute. The first asked whether respondents had seen, heard, or read anything about the US Supreme Court’s ruling about Argentina. The second question asked whether the respondent had seen, heard, or read anything about President Kirchner’s response to the US Supreme Court’s decision. 84% of respondents answered affirmatively to the first question, 74% to the second question, and 70.5% of respondents said they had heard about both issues. Sophistication is coded as 1 if respondents had heard about both issues, and 0 otherwise.
• August 2014: This survey contains one indicator of attention to the debt issue, which asked whether individuals pay no attention (0), a little attention (1), some attention (2), or a lot of attention (3) to this issue. The survey also includes a measure of self-reported understanding of this issue: whether people have no understanding (0), a little understanding (1), some understanding (2), or a lot of understanding (3) of this issue. We combined these two measures by summing them. Next, respondents that are above the median on this composite indicator are defined as sophisticated; all others are defined as unsophisticated.
• September 2014: In this survey, sophistication is measures based on whether respondents had seen, heard, or read anything about upcoming legislation that Argentina’s President will send to Congress to change the jurisdiction under which debt payments are made. Respondents that were aware of this legislation are coded as sophisticated; others are coded as unsophisticated.
• July 2015: This survey contains four fact-based questions, as described in Table A6. A binary measure of sophistication was constructed as follows: all respondents that scored at or above the median level of knowledge were coded as 1; others were coded as 0. For this model, we also created the following binary measure of Presidential approval: all respondents that approved or strongly approved of the President were coded as approvers; all others are treated as disapprovers.
• July 2016: This survey contains nine fact-based questions, as described in Table A6. A binary measure of sophistication was constructed as follows: all respondents that scored at or above the median level of knowledge were coded as 1; others were coded as 0. For this model, we also created the following binary measure of Presidential approval: all respondents that approved or strongly approved of the President were coded as approvers; all others are treated as disapprovers.
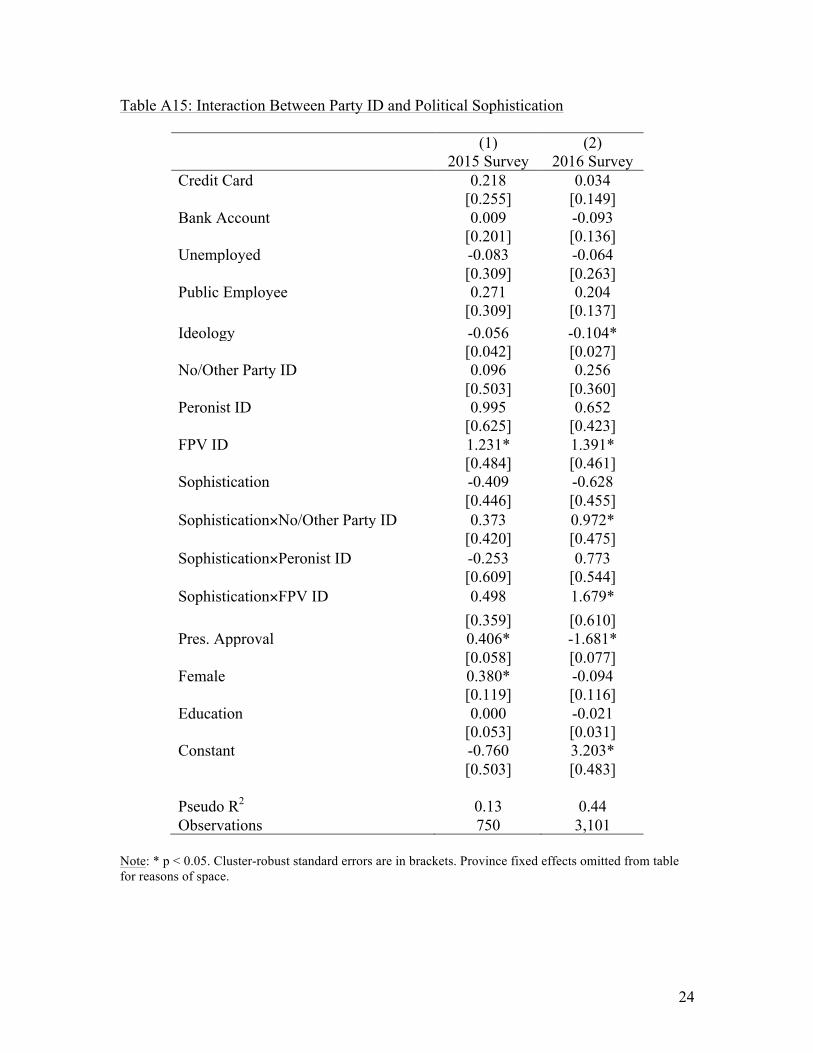
Table A15: These models include interactions between political sophistication and party ID. Political sophistication was measured as in Table A14. Figure A4: Displays the average marginal effect of party ID for sophisticated and unsophisticated voters, along with 95% confidence intervals of the marginal effect. These marginal effects were estimated from the models presented in Table A15. The results indicate that party ID tends to have a stronger relationship with debt attitudes for sophisticated voters than for unsophisticated ones. In both surveys, the marginal effects

6
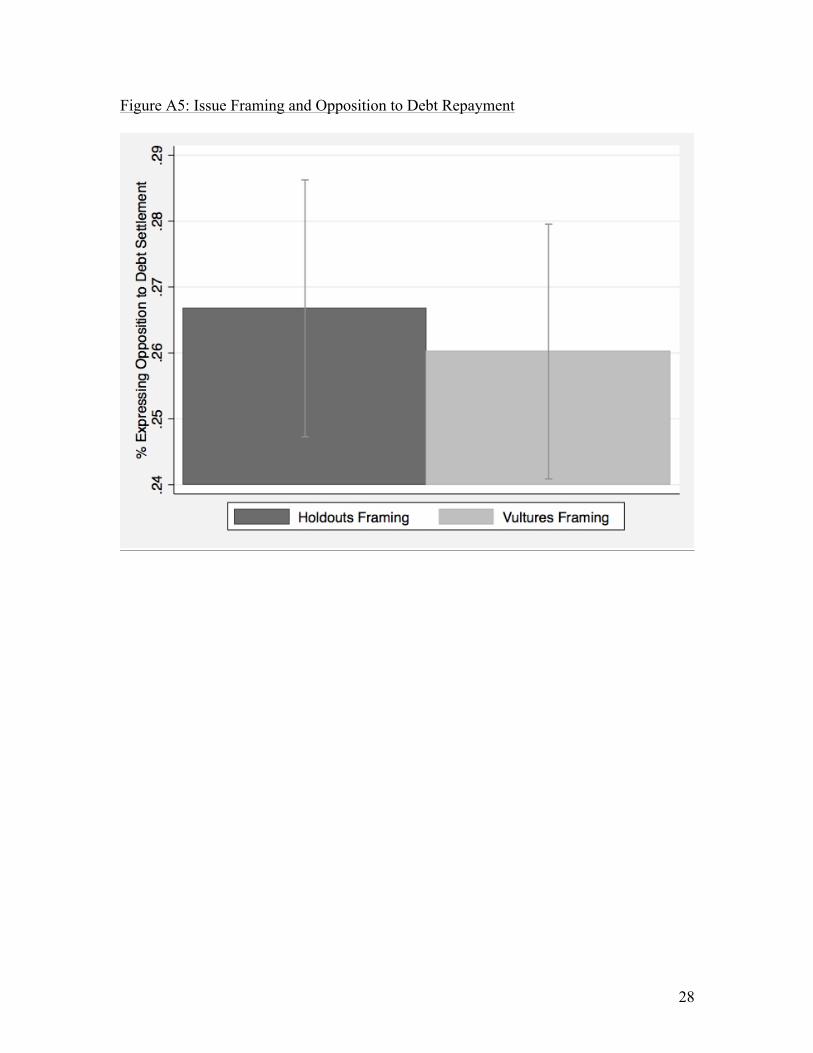
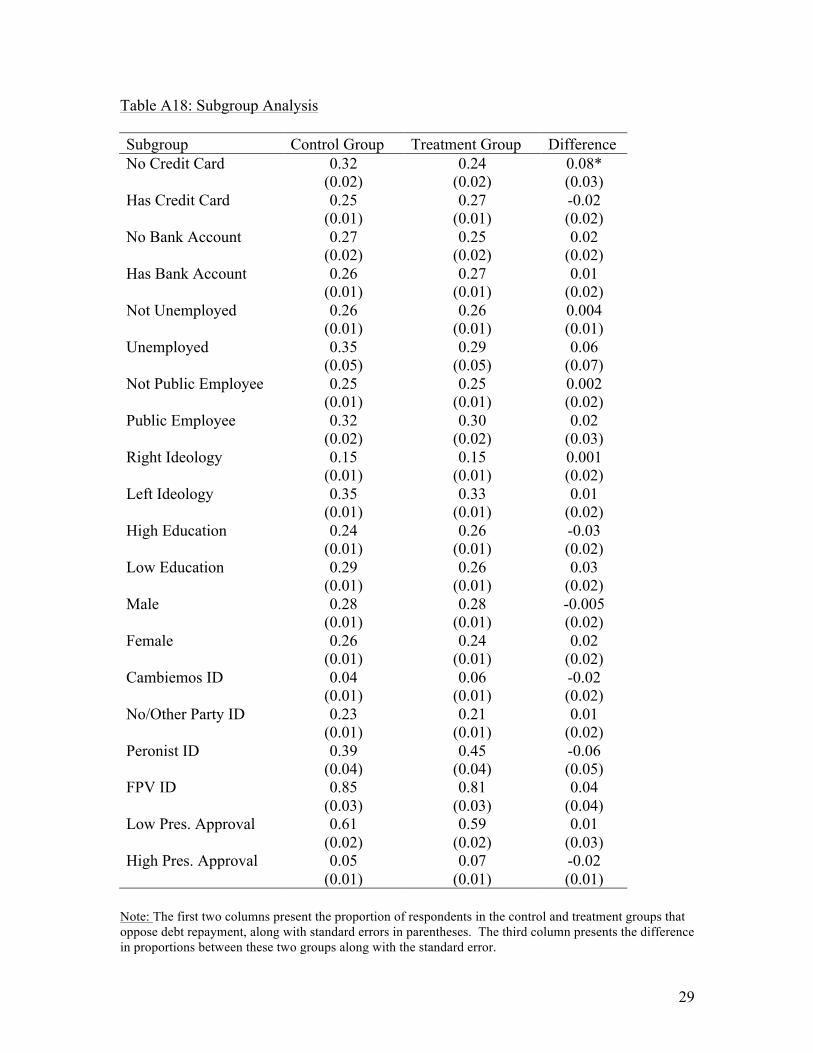
for FPV ID and No Major Party ID are larger for sophisticated respondents than for unsophisticated respondents. In the 2016 survey, Peronist identity has a larger effect for sophisticated than unsophisticated voters, though this is not the case in the 2015 survey. Table A16: The dependent variables in these models are respondent’s attitudes towards other policy issues: agreement with trade protection (model 1), agreement with state ownership of enterprises (model 2), agreement with foreign exchange controls (model 3), and agreement with price regulations (model 4). These models are used to generate the marginal effects presented in Figure 5. Table A17: This table investigates whether the two experimental groups in the Isonomía survey are observationally equivalent. To do so, we fit a logit model where the outcome variable in is whether a respondent was in the treatment or control group, and use the main covariates from our other models. The poor fit of the model and lack of statistical significance for any of the predictors indicates that randomization was successful. Figure A5: Displays the proportion of respondents in the two experimental groups, along with 95% confidence intervals, that opposed debt repayment. Table A18: This table investigates whether the experimental treatment had any effects across different subgroups of the population. We divide all our predictor variables into two groups, with the exception of party identification, which includes four groups. The table presents the proportion of respondents in the treatment and control groups that oppose debt repayment across 20 different subgroups of the population. We only observe statistically significant differences in one case (those without credit cards), though the treatment effect goes in the opposite direction of what was expected. Table A19: This table examines whether describing foreign creditors as “holdouts” versus “vultures” changes the variables that explain support for repayment. Model 1 is restricted to respondents in the control group, who received the “holdout” phrase. Model 2 is restricted to respondents in the “vulture” treatment group. Although there are some variables that are statistically significant in one model, but not the other, these differences are minor and the political orientation variables have the largest effects in both models.

7
Table A1: Summary Statistics for APES Dataset
Variable Obs Mean Std. Dev. Min Max Debt Opinion 949 0.60 0.49 0 1 Credit Card 1,137 0.39 0.49 0 1 Bank Account 1,136 0.31 0.46 0 1 Unemployed 1,144 0.08 0.28 0 1 Public Employee 1,129 0.12 0.32 0 1 Presidential Approval 1,143 3.37 1.11 1 5 No/Other Party ID 1,120 0.57 0.49 0 1 Peronist ID 1,120 0.13 0.33 0 1 FPV ID 1,120 0.20 0.40 0 1 Ideology 911 5.76 2.33 0 10 Education 1,146 4.67 1.86 1 10 Female 1,149 0.47 0.50 0 1 Income 874 4.30 2.39 0 10 Political Knowledge 1,149 1.92 1.31 0 4 Trade Barrier Opinion 1,106 0.49 0.50 0 1 Forex Control Opinion 1,089 0.42 0.49 0 1 Price Regulation Opinion 1,146 0.87 0.34 0 1 State Ownership Opinion 1,106 0.71 0.45 0 1 Peronist Father 1,051 0.36 0.48 0 1 Bank Loan 1,125 0.14 0.35 0 1 Sophistication 1,149 0.59 0.49 0 1

8
Table A2: Summary Statistics for Isonomía Dataset
Variable Obs Mean Std. Dev. Min Max Debt Opinion (Ordinal) 3,966 2.56 1.21 1 5 Debt Opinion (Binary) 3,966 0.26 0.44 0 1 Vulture Treatment 4,300 0.48 0.50 0 1 Credit Card 4,260 0.74 0.44 0 1 Bank Account 4,244 0.62 0.49 0 1 Unemployed 4,209 0.05 0.21 0 1 Public Employee 4,212 0.21 0.41 0 1 Presidential Approval 4,105 2.65 0.93 1 4 No/Other Party ID 4,146 0.67 0.47 0 1 Peronist ID 4,146 0.09 0.29 0 1 FPV ID 4,146 0.08 0.27 0 1 Ideology 3,657 5.22 2.47 0 10 Education 4,292 5.65 2.09 1 9 Female 4,300 0.53 0.50 0 1 Ethnocentrism 4,200 2.49 0.99 1 5 Nationalism 4,225 1.92 0.89 1 5 Isolationism 4,185 2.06 0.84 1 5 Anti-Americanism 4,053 2.87 1.11 1 5 Political Knowledge 4,300 4.66 1.97 0 9 Sophistication 4,300 0.55 0.50 0 1 Bank Loan 4,217 0.29 0.44 0 1

9
Table A3: Correlation Matrix for APES Dataset
Debt O
pinion
Credit C
ard
Bank
Account
Unem
ployed
Public Em
ployee
Pres. A
pproval
No/O
ther Party ID
Peronist ID
FPV ID
Ideology
Education
Female
Debt Opinion 1.00
Credit Card 0.01 1.00 Bank Account -0.02 0.49 1.00 Unemployed -0.03 -0.09 -0.12 1.00 Public Employee 0.03 0.19 0.22 -0.04 1.00 Pres. Approval 0.28 -0.10 -0.10 0.04 -0.03 1.00 No/Other Party ID -0.18 0.01 -0.03 0.03 -0.02 -0.29 1.00 Peronist ID 0.08 -0.04 0.00 -0.02 0.05 0.13 -0.44 1.00 FPV ID 0.22 -0.03 -0.05 -0.01 -0.05 0.41 -0.58 -0.19 1.00 Ideology -0.04 0.01 -0.07 0.03 0.00 0.04 -0.03 0.04 -0.02 1.00 Education -0.03 0.39 0.39 -0.05 0.25 -0.17 0.07 -0.08 -0.09 -0.14 1.00 Female 0.09 -0.01 -0.02 0.05 0.01 -0.01 -0.03 0.05 -0.02 0.01 -0.02 1.00

10
Table A4: Correlation Matrix for Isonomía Dataset
Debt O
pinion
Credit C
ard
Bank
Account
Unem
ployed
Public Em
ployee
Pres. A
pproval
No/O
ther Party ID
Peronist ID
FPV ID
Ideology
Education
Female
Debt Opinion 1.00
Credit Card -0.02 1.00 Bank Account 0.00 0.39 1.00 Unemployed 0.03 -0.07 -0.08 1.00 Public Employee 0.06 0.06 0.08 -0.11 1.00 Pres. Approval -0.63 0.04 0.03 -0.07 -0.04 1.00 No/Other Party ID -0.13 -0.09 -0.11 0.02 -0.02 0.12 1.00 Peronist ID 0.12 0.07 0.02 -0.02 0.07 -0.17 -0.46 1.00 FPV ID 0.39 -0.02 0.06 0.02 0.02 -0.41 -0.41 -0.09 1.00 Ideology -0.35 0.00 -0.01 -0.01 -0.04 0.44 0.08 -0.08 -0.27 1.00 Education -0.03 0.27 0.30 -0.01 0.12 0.04 -0.08 0.03 -0.04 -0.05 1.00 Female -0.04 -0.03 -0.10 0.01 0.02 0.05 -0.01 -0.03 0.01 0.03 0.02 1.00

11
Figure A1: Shifts in Aggregate Opinion Towards Repayment

12
Table A5: Main Models
(1)
2015 Survey (2)
2016 Survey (3)
2016 Survey Credit Card 0.193 0.046 0.215
[0.262] [0.139] [0.146]
Bank Account 0.027 -0.035 -0.137
[0.198] [0.126] [0.131]
Unemployed -0.081 -0.078 -0.055
[0.304] [0.136] [0.126]
Public Employee 0.262 0.197 0.286* [0.304] [0.129] [0.111] Ideology -0.055 -0.108* -0.074* [0.044] [0.018] [0.021] No/Other Party ID 0.396 0.843* 0.522 [0.228] [0.299] [0.299] Peronist ID 0.843* 1.123* 0.646* [0.380] [0.283] [0.290] FPV ID 1.592* 2.393* 1.769* [0.272] [0.293] [0.321] Pres. Approval 0.409* -1.685* -1.418* [0.057] [0.060] [0.068] Female 0.365* -0.114 -0.185 [0.121] [0.099] [0.114] Education -0.008 -0.015 -0.015 [0.050] [0.028] [0.032] Ethnocentrism 0.065 [0.047] Nationalism -0.035 [0.054] Isolationism 0.164* [0.077] Anti-Americanism 0.715* [0.097] Constant -1.072* 2.781* -0.291
[0.349] [0.274] [0.521]
Pseudo R2 0.13 0.44 0.48 Observations 750 3,101 2,932
Note: * p < 0.05. Cluster-robust standard errors are in brackets. Province fixed effects omitted from table for reasons of space.

13
Table A6: Additional Control Variables
(1)
2015 Survey (2)
2015 Survey (3)
2015 Survey (4)
2016 Survey Credit Card -0.027 0.071 0.203 0.045
[0.331] [0.261] [0.259] [0.135]
Bank Account -0.186 0.089 0.032 -0.109
[0.210] [0.230] [0.201] [0.115]
Unemployed -0.180 -0.272 -0.078 -0.042
[0.337] [0.310] [0.305] [0.140]
Public Employee 0.104 0.254 0.265 0.195 [0.391] [0.334] [0.314] [0.135] Ideology -0.022 -0.054 -0.057 -0.105* [0.043] [0.040] [0.038] [0.018] No/Other Party ID 0.477 0.345 0.383 0.886* [0.295] [0.233] [0.252] [0.302] Peronist ID 0.959* 0.647 0.837* 1.175* [0.342] [0.407] [0.396] [0.282] FPV ID 1.740* 1.472* 1.584* 2.431* [0.327] [0.336] [0.256] [0.291] Pres. Approval 0.410* 0.365* 0.408* -1.662* [0.069] [0.093] [0.061] [0.062] Female 0.506* 0.447* 0.376* -0.087 [0.104] [0.120] [0.130] [0.101] Education 0.097 0.015 -0.002 -0.023 [0.064] [0.059] [0.059] [0.029] Income 0.052 [0.028] State Ownership Opinion 0.226 [0.198] Price Regulation Opinion 0.706* [0.199] Forex Control Opinion 0.043 [0.162] Trade Barrier Opinion 0.197 [0.235] Political Knowledge -0.034 0.094* [0.179] [0.032] Constant -1.794* -1.933* -0.988 2.292*
[0.430] [0.402] [0.539] [0.346]
Pseudo R2 0.15 0.15 0.13 0.44 Observations 575 712 750 3,101 Note: * p < 0.05. Cluster-robust standard errors are in brackets. Province fixed effects omitted from table for reasons of space.
14
Table A7: Alternative Measures of Partisanship and Sensitivity to Borrowing Costs
(1)
2015 Survey (2)
2015 Survey (3)
2016 Survey Credit Card 0.032
[0.262]
Bank Account -0.001 0.116 -0.007
[0.229] [0.193] [0.116]
Unemployed -0.077 -0.098 -0.089
[0.267] [0.298] [0.132]
Public Employee 0.223 0.267 0.192 [0.266] [0.329] [0.130] Ideology -0.017 -0.050 -0.107* [0.050] [0.045] [0.018] No/Other Party ID 0.393 0.825* [0.228] [0.298] Peronist ID 0.823* 1.095* [0.376] [0.283] FPV ID 1.650* 2.361* [0.282] [0.289] Pres. Approval 0.398* -1.699* [0.053] [0.062] Female 0.294* 0.368* -0.124 [0.138] [0.111] [0.099] Education -0.028 0.008 -0.010 [0.057] [0.053] [0.026] Peronist Father 0.468* [0.236] Bank Loan 0.031 -0.155 [0.184] [0.138] Constant 0.826* -1.065* 2.875*
[0.152] [0.370] [0.266]
Pseudo R2 0.06 0.13 0.44 Observations 707 743 3,081
Note: * p < 0.05. Cluster-robust standard errors are in brackets. Province fixed effects omitted from table for reasons of space.
15
Table A8: Multiple Imputation
(1)
2015 Survey (2)
2016 Survey (3)
2016 Survey Credit Card 0.21 0.01 0.04
[0.20] [0.10] [0.10]
Bank Account -0.08 -0.04 -0.08
[0.18] [0.11] [0.11]
Unemployed -0.12 -0.07 -0.06
[0.25] [0.19] [0.16]
Public Employee 0.25 0.22 0.29* [0.23] [0.12] [0.12] Ideology -0.05 -0.10* -0.07* [0.04] [0.02] [0.02] No/Other Party ID 0.09 0.75* 0.56 [0.24] [0.28] [0.29] Peronist ID 0.68* 1.04* 0.76* [0.30] [0.30] [0.30] FPV ID 0.97* 2.12* 1.67* [0.25] [0.35] [0.34] Pres. Approval 0.44* -1.64* -1.40* [0.05] [0.07] [0.07] Female 0.48* -0.11 -0.10 [0.13] [0.09] [0.10] Education 0.02 -0.01 -0.001 [0.05] [0.03] [0.03] Ethnocentrism -0.01 [0.05] Nationalism 0.04 [0.06] Isolationism 0.15* [0.06] Anti-Americanism 0.62* [0.06] Constant -1.07* 2.77* 0.01
[0.44] [0.27] [0.45]
Observations 1,149 4,300 4,300 Note: * p < 0.05. Cluster-robust standard errors are in brackets. Province fixed effects omitted from table for reasons of space.

16
Table A9: Ordered Logit Models
(1)
2016 Survey (2)
2016 Survey Credit Card -0.144 -0.069
[0.081] [0.099]
Bank Account 0.146 0.128
[0.125] [0.090]
Unemployed -0.093 -0.097
[0.162] [0.181]
Public Employee 0.106 0.096 [0.082] [0.091] Ideology -0.132* -0.113* [0.011] [0.018] No/Other Party ID 0.636* 0.524* [0.154] [0.109] Peronist ID 0.904* 0.711* [0.192] [0.158] FPV ID 1.945* 1.558* [0.121] [0.180] Pres. Approval -1.354* -1.110* [0.041] [0.056] Female 0.206* 0.133 [0.094] [0.075] Education -0.095* -0.079* [0.028] [0.020] Ethnocentrism -0.080* [0.040] Nationalism 0.046 [0.044] Isolationism 0.223* [0.047] Anti-Americanism 0.593* [0.043]
Pseudo R2 0.22 0.25 Observations 3,101 2,932
Note: * p < 0.05. Cluster-robust standard errors are in brackets. Province fixed effects omitted from table for reasons of space.

17
Table A10: Linear Probability Models
(1)
2015 Survey (2)
2016 Survey (3)
2016 Survey Credit Card 0.039 0.001 0.016
[0.052] [0.016] [0.015]
Bank Account 0.005 0.011 0.004
[0.040] [0.015] [0.012]
Unemployed -0.012 -0.011 -0.004
[0.062] [0.019] [0.017]
Public Employee 0.053 0.028* 0.027* [0.054] [0.012] [0.011] Ideology -0.009 -0.012* -0.007* [0.009] [0.002] [0.002] No/Other Party ID 0.093 0.037* 0.010 [0.053] [0.014] [0.018] Peronist ID 0.187* 0.100* 0.053* [0.079] [0.022] [0.023] FPV ID 0.285* 0.308* 0.230* [0.054] [0.022] [0.032] Pres. Approval 0.085* -0.244* -0.200* [0.012] [0.007] [0.010] Female 0.068* -0.003 -0.014 [0.024] [0.010] [0.011] Education -0.002 -0.004 -0.001 [0.010] [0.003] [0.003] Ethnocentrism 0.004 [0.005] Nationalism -0.010 [0.006] Isolationism 0.020* [0.008] Anti-Americanism 0.086* [0.011] Constant 0.269* 0.947* 0.545*
[0.074] [0.026] [0.050]
R2 0.16 0.46 0.49 Observations 750 3,101 2,932
Note: * p < 0.05. Cluster-robust standard errors are in brackets. Province fixed effects omitted from table for reasons of space.

18
Table A11: Interest-Based Models
(1)
2015 Survey (2)
2016 Survey Credit Card 0.130 -0.135
[0.222] [0.121]
Bank Account -0.047 0.012
[0.176] [0.079]
Unemployed -0.014 0.395
[0.215] [0.212]
Public Employee 0.179 0.351* [0.202] [0.086] Constant 0.768* -0.774*
[0.122] [0.099]
R2 0.03 0.03 Observations 923 3,832
Note: * p < 0.05. Cluster-robust standard errors are in brackets. Province fixed effects omitted from table for reasons of space.

19
Table A12: Interaction Between Interests and Political Sophistication
(1)
2015 Survey (2)
2016 Survey Credit Card -0.124 0.117
[0.463] [0.203]
Bank Account 0.475 -0.343
[0.319] [0.232]
Unemployed 0.394 0.148
[0.585] [0.265]
Public Employee -0.012 0.274 [0.545] [0.186] Sophistication -0.115 0.183 [0.403] [0.243] Sophistication×Credit Card 0.495 -0.105 [0.395] [0.253] Sophistication×Bank Account -0.618 0.445 [0.350] [0.350] Sophistication×Unemployed -0.738 -0.412 [0.890] [0.543] Sophistication×Public Employee 0.381 -0.118 [0.584] [0.277] Ideology -0.059 -0.106* [0.043] [0.018] No/Other Party ID 0.387 0.885* [0.235] [0.299] Peronist ID 0.846* 1.164* [0.387] [0.277] FPV ID 1.672* 2.430* [0.264] [0.285] Pres. Approval 0.407* -1.672* [0.062] [0.063] Female 0.419* -0.094 [0.125] [0.101] Education -0.006 -0.022 [0.050] [0.029] Constant -0.980* 2.601*
[0.469] [0.299]
Pseudo R2 0.14 0.44 Observations 750 3,101
Note: * p < 0.05. Cluster-robust standard errors are in brackets. Province fixed effects omitted from table for reasons of space.

20
Figure A2: Conditional Marginal Effect of Economic Interests
21
Table A13: Poliarquía Datasets
(1)
Sep. 2013 (2)
Jun. 2014 (3)
Jul. 2014 (4)
Aug. 2014 (5)
Sep. 2014 (6)
Oct. 2014 (7)
Dec. 2014 (8)
Feb. 2016 Female 0.220* -0.406* -0.384 -0.673* -0.804* -0.925* -0.548* -0.275* [0.088] [0.100] [0.266] [0.136] [0.264] [0.149] [0.121] [0.099] Education 0.434* 0.281* 0.236 0.463* 0.505* 0.494* 0.652* 0.519* [0.071] [0.071] [0.124] [0.179] [0.125] [0.156] [0.121] [0.075] Pres Approval 0.236* 2.068* 1.845* 2.621* 3.050* 3.656* 2.914* -3.762* [0.112] [0.216] [0.247] [0.307] [0.144] [0.528] [0.273] [0.151] Constant -2.211* -2.477* -2.091* -2.769* -2.608* -2.901* -3.454* -1.603*
[0.142] [0.233] [0.487] [0.312] [0.410] [0.576] [0.404] [0.179]
Pseudo R2 0.03 0.17 0.15 0.26 0.34 0.40 0.31 0.33 Observations 966 1,231 760 690 846 794 753 1,833
Note: * p < 0.05. Cluster-robust standard errors are in brackets. Province fixed effects omitted from table for reasons of space.

22
Figure A3: Average Marginal Effect of Presidential Approval (Poliarquía Datasets)
23
Table A14: Interaction Between Presidential Approval and Sophistication
(1)
Sep. 2013 (2)
Jun. 2014 (3)
Aug. 2014 (4)
Sep. 2014 (5)
Jul. 2015 (6)
Jul. 2016 Female 0.126 -0.373* -0.662* -0.747* 0.408* -0.053 [0.091] [0.111] [0.118] [0.219] [0.169] [0.115] Education 0.490* 0.291* 0.467* 0.561* -0.001 -0.024 [0.080] [0.075] [0.198] [0.173] [0.054] [0.030] Pres Approval 0.125 1.315* 2.233* 1.849* 0.383 -2.251* [0.220] [0.184] [0.279] [0.302] [0.314] [0.183] Sophistication -0.534* -0.659* -0.193 -0.618* -0.312 0.785* [0.183] [0.220] [0.169] [0.220] [0.264] [0.150] Sophistication×Pres Approval 0.241 1.096* 0.862* 1.875* 0.384 -1.056* [0.327] [0.267] [0.236] [0.380] [0.368] [0.239] Credit Card 0.170 0.102
[0.212] [0.148]
Bank Account 0.038 -0.028
[0.215] [0.136]
Unemployed -0.083 -0.011
[0.308] [0.262]
Public Employee 0.240 0.292* [0.276] [0.135] Ideology -0.052 -0.128* [0.039] [0.026] No/Other Party ID 0.411 0.803* [0.264] [0.244] Peronist ID 0.955* 1.082* [0.343] [0.280] FPV ID 1.759* 2.514* [0.359] [0.312] Constant -2.042* -2.131* -2.683* -2.361* 0.112 -0.222
[0.177] [0.201] [0.320] [0.423] [0.529] [0.385]
Pseudo R2 0.03 0.18 0.28 0.38 0.12 0.43 Observations 966 1,183 671 710 750 3,101
Note: * p < 0.05. Cluster-robust standard errors are in brackets. Province fixed effects omitted from table for reasons of space.
24
Table A15: Interaction Between Party ID and Political Sophistication
(1)
2015 Survey (2)
2016 Survey Credit Card 0.218 0.034
[0.255] [0.149]
Bank Account 0.009 -0.093
[0.201] [0.136]
Unemployed -0.083 -0.064
[0.309] [0.263]
Public Employee 0.271 0.204 [0.309] [0.137] Ideology -0.056 -0.104* [0.042] [0.027] No/Other Party ID 0.096 0.256 [0.503] [0.360] Peronist ID 0.995 0.652 [0.625] [0.423] FPV ID 1.231* 1.391* [0.484] [0.461] Sophistication -0.409 -0.628 [0.446] [0.455] Sophistication×No/Other Party ID 0.373 0.972* [0.420] [0.475] Sophistication×Peronist ID -0.253 0.773 [0.609] [0.544] Sophistication×FPV ID 0.498 1.679* [0.359] [0.610] Pres. Approval 0.406* -1.681* [0.058] [0.077] Female 0.380* -0.094 [0.119] [0.116] Education 0.000 -0.021 [0.053] [0.031] Constant -0.760 3.203*
[0.503] [0.483]
Pseudo R2 0.13 0.44 Observations 750 3,101
Note: * p < 0.05. Cluster-robust standard errors are in brackets. Province fixed effects omitted from table for reasons of space.

25
Figure A4: Conditional Marginal Effects of Party Identity

26
Table A16: Agreement with Other Policy Issues
(1)
2015 Survey (2)
2015 Survey (3)
2015 Survey (4)
2015 Survey Credit Card -0.126 0.012 -0.436* 0.233
[0.211] [0.198] [0.146] [0.135]
Bank Account 0.325 -0.035 0.165 -0.530*
[0.171] [0.240] [0.181] [0.232]
Unemployed 0.838* 0.244 1.083* -0.093
[0.292] [0.261] [0.270] [0.302]
Public Employee -0.081 0.003 -0.238 -0.200 [0.336] [0.303] [0.194] [0.274] Ideology -0.050 -0.015 0.035 -0.085* [0.032] [0.037] [0.026] [0.044] No/Other Party ID 0.219 0.185 0.495* -0.210 [0.263] [0.112] [0.140] [0.353] Peronist ID 1.028* 0.719* 0.261* 0.142 [0.295] [0.197] [0.154] [0.462] FPV ID 0.948* 0.694** 0.553* 0.559 [0.251] [0.274] [0.201] [0.463] Pres. Approval -0.233* -0.296* -0.318* -0.542* [0.073] [0.072] [0.051] [0.083] Female 0.172 -0.176 -0.153 -0.438* [0.115] [0.241] [0.125] [0.186] Education 0.143* -0.043 0.036 -0.117* [0.041] [0.049] [0.072] [0.052] Constant -0.114 2.233* 0.244 6.058*
[0.318] [0.479] [0.444] [0.682]
Pseudo R2 0.09 0.07 0.08 0.13 Observations 849 851 838 824 Note: * p < 0.05. Cluster-robust standard errors are in brackets. Province fixed effects omitted from table for reasons of space.

27
Table A17: Randomization Check
(1)
2016 Survey Credit Card 0.136
[0.092]
Bank Account -0.103
[0.083]
Unemployed 0.056
[0.174]
Public Employee -0.056 [0.086] Ideology -0.010 [0.016] Education 0.035 [0.019] Female 0.004 [0.071] No/Other Party ID 0.040 [0.100] Peronist ID 0.036 [0.149] FPV ID -0.010 [0.170] Pres. Approval 0.019 [0.046] Constant -0.315 [0.232]
Prob > χ2 0.183 Pseudo R2 0.009 Observations 3,313
Note: * p < 0.05. Cluster-robust standard errors are in brackets. Province fixed effects omitted from table for reasons of space.
28
Figure A5: Issue Framing and Opposition to Debt Repayment
29
Table A18: Subgroup Analysis Subgroup Control Group Treatment Group Difference No Credit Card 0.32
(0.02) 0.24
(0.02) 0.08* (0.03)
Has Credit Card 0.25 (0.01)
0.27 (0.01)
-0.02 (0.02)
No Bank Account 0.27 (0.02)
0.25 (0.02)
0.02 (0.02)
Has Bank Account 0.26 (0.01)
0.27 (0.01)
0.01 (0.02)
Not Unemployed 0.26 (0.01)
0.26 (0.01)
0.004 (0.01)
Unemployed 0.35 (0.05)
0.29 (0.05)
0.06 (0.07)
Not Public Employee 0.25 (0.01)
0.25 (0.01)
0.002 (0.02)
Public Employee 0.32 (0.02)
0.30 (0.02)
0.02 (0.03)
Right Ideology 0.15 (0.01)
0.15 (0.01)
0.001 (0.02)
Left Ideology 0.35 (0.01)
0.33 (0.01)
0.01 (0.02)
High Education 0.24 (0.01)
0.26 (0.01)
-0.03 (0.02)
Low Education 0.29 (0.01)
0.26 (0.01)
0.03 (0.02)
Male 0.28 (0.01)
0.28 (0.01)
-0.005 (0.02)
Female 0.26 (0.01)
0.24 (0.01)
0.02 (0.02)
Cambiemos ID 0.04 (0.01)
0.06 (0.01)
-0.02 (0.02)
No/Other Party ID 0.23 (0.01)
0.21 (0.01)
0.01 (0.02)
Peronist ID 0.39 (0.04)
0.45 (0.04)
-0.06 (0.05)
FPV ID 0.85 (0.03)
0.81 (0.03)
0.04 (0.04)
Low Pres. Approval 0.61 (0.02)
0.59 (0.02)
0.01 (0.03)
High Pres. Approval 0.05 (0.01)
0.07 (0.01)
-0.02 (0.01)
Note: The first two columns present the proportion of respondents in the control and treatment groups that oppose debt repayment, along with standard errors in parentheses. The third column presents the difference in proportions between these two groups along with the standard error.

30
Table A19: Comparison of Results Across Experimental Groups
(1)
2016 Survey (2)
2016 Survey Credit Card -0.287 0.324
[0.212] [0.247]
Bank Account 0.218 -0.241
[0.287] [0.242]
Unemployed 0.210 -0.320
[0.284] [0.270]
Public Employee 0.568* -0.101 [0.229] [0.210] Ideology -0.115* -0.101* [0.039] [0.039] Education -0.009 -0.002 [0.043] [0.045] Female 0.145 -0.328 [0.159] [0.181] No/Other Party ID 1.252* 0.606 [0.333] [0.353] Peronist ID 1.479* 0.895* [0.352] [0.342] FPV ID 2.833* 2.133* [0.426] [0.379] Pres. Approval -1.747* -1.712* [0.104] [0.108] Constant 2.290* 3.167* [0.490] [0.307]
Pseudo R2 0.48 0.41 Observations 1,527 1,556
Note: * p < 0.05. Cluster-robust standard errors are in brackets. Province fixed effects omitted from table for reasons of space.