Embed Size (px)
Citation preview

PBF Energy Inc.June 2019
1
This presentation contains forward-looking statements made by PBF Energy Inc. (“PBF Energy”), the indirect parent of PBF Logistics LP (“PBFX”, or“Partnership”, and together with PBF Energy, the “Companies”, or “PBF”), and their management teams. Such statements are based on currentexpectations, forecasts and projections, including, but not limited to, anticipated financial and operating results, plans, objectives, expectations andintentions that are not historical in nature. Forward-looking statements should not be read as a guarantee of future performance or results, andmay not necessarily be accurate indications of the times at, or by which, such performance or results will be achieved. Forward-looking statementsare based on information available at the time, and are subject to various risks and uncertainties that could cause the Companies’ actualperformance or results to differ materially from those expressed in such statements. These forward-looking statements include, without limitation,the company’s expectations with respect to timing of the completion of the proposed acquisition; the company’s post-acquisition plans, objectives,expectations and intentions with respect to future earnings and operations; the company’s plans for financing the proposed acquisition; and theconditions to the closing of the proposed acquisition and the possibility that the proposed acquisition will not close. Factors that could impact suchdifferences include, but are not limited to, changes in general economic conditions; volatility of crude oil and other feedstock prices; fluctuations inthe prices of refined products; the impact of disruptions to crude or feedstock supply to any of our refineries, including disruptions due to problemswith third party logistics infrastructure; effects of litigation and government investigations; the timing, announcement and consummation of anypotential acquisitions and subsequent impact of any future acquisitions on our capital structure, financial condition or results ofoperations; changes or proposed changes in laws or regulations or differing interpretations or enforcement thereof affecting our business orindustry; actions taken or non-performance by third parties, including suppliers, contractors, operators, transporters and customers; adequacy,availability and cost of capital; work stoppages or other labor interruptions; operating hazards, natural disasters, weather-related delays, casualtylosses and other matters beyond our control; inability to complete capital expenditures, or construction projects that exceed anticipated orbudgeted amounts; ability to consummate potential acquisitions, the timing for the closing of any such acquisition and our plans for financing anyacquisition; unforeseen liabilities associated with any potential acquisition; inability to successfully integrate acquired refineries or other acquiredbusinesses or operations; effects of existing and future laws and governmental regulations, including environmental, health and safety regulations;and, various other factors.
All forward-looking statements speak only as of the date hereof. The company undertakes no obligation to revise or update any forward-lookingstatements except as may be required by applicable law.
See the Appendix for reconciliations of the differences between the non-GAAP (“U.S. generally accepted accounting principles”) financial measuresused in this presentation, including various estimates of EBITDA (earnings before interest, income taxes, depreciation and amortization), and theirmost directly comparable GAAP financial measures.
Safe Harbor Statements
2

Geographically diverse, high-complexity five-refinery system
Crude and feedstock optionality provides access to advantaged North American and international feedstocks
Strategic partnership with PBF Logistics (NYSE:PBFX)
Track record of investing in high-return, margin-improvement projects
Pipeline of organic opportunities to further increase margin capture
Management team with long and successful history of executing accretive acquisitions and delivering growth
Maintain conservative balance sheet and strong liquidity
Investing to drive long-term earnings growth and enhance assets
Access to public capital through strategic PBFX relationship
Refining and Logistics segments provide dual growth platforms
Increase refining profitability through reliable operations and reduced costs
Diversify logistics footprint through organic growth and third-party transactions
Pure-play Refiner
with Attractive
Asset Base
PBF – Investment Overview
Established
Investment
Track Record
Disciplined
Capital Allocation
Future
Growth Opportunities
3

Providing a wide variety of clean fuels and raw materials to multiple industries across the United States and internationally
Commitment from the Board and the entire organization to run our facilities safely, reliably and environmentally responsibly
Pursuing advanced processes and technology to further reduce greenhouse gas emissions
Actively promoting inclusion and diversity in our workforce at each of our locations
Engaged in our local communities through supportive educational programs, philanthropic and volunteer activities
Environmental, Social, Governance
7

12.812.1
11.4 11.0 10.8 10.59.5
0
1,000
2,000
3,000
0
2
4
6
8
10
12
14
PBF HFC VLO PSX MPC DK CVI
Cru
de
Cap
acit
y
Ne
lso
n C
om
ple
xity
Independent Refiners
Complexity Capacity
Attractive Asset Diversification and Growth
PBF's core strategy is to operate safely, reliably and environmentally responsibly
Pursue disciplined growth through strategic acquisitions and development of organic projects
Diversified, high-complexity asset base with 12.8 Nelson Complexity(1)
RegionThroughput Capacity
(bpd)Nelson
Complexity
Mid-continent 170,000 9.2
East Coast 370,000 12.2
Gulf Coast 189,000 12.7
West Coast(1) 312,000 15.5
Total(1) 1,041,000 12.8
Source: Oil & Gas Journal, company reports
Paulsboro
Toledo
Chalmette
Torrance
PADD 2
PADD 3
PADD 5
Delaware City
PADD 4
PADD 1
5___________________________1. Assuming successful close of the announced transactions to acquire the Martinez refinery
Martinez(1)

___________________________
1) See appendix for a reconciliation of the non-GAAP financial measures
Martinez Refinery Acquisition Highlights
Martinez is a premier West Coast refinery with dual-coking, high-conversion operations and a Nelson Complexity of 16.1
Significantly accretive to earnings with an expected acquisition cost of $900 million to $1 billion with a pro forma historical annual EBITDA of $275 - $375 million(1)
Creates most complex refining system on the West Coast
• Enables realization of West Coast operational and other synergies
• Accomplishes high-priority, West Coast diversification
Demonstrates PBF’s disciplined growth strategy of identifying and pursuing value
• Increases PBF circuit capacity to over 1 million barrels per day
• Highest complexity independent refining system
• Solidifies PBF’s leading position in an IMO-MARPOL marketplace
Renewable Diesel Opportunity – commitment by both Shell and PBF to explore a partnership at Martinez to invest in and build an onsite renewable diesel facility using existing idled equipment
Expected to close in second half of 2019
6

$102 $152$336
$134$233
$396
$712$534
$196
$806
$122$298
$188 $170
$978
$2,131
$411
$ per Complexity Barrel
Attractive Purchase Price
___________________________1. PBF figures based on announced acquisition costs and assumes successful close of the announced transaction to acquire the Martinez refinery
PBF acquisitions completed at an average of $225/complexity barrel(1)
7
Source: Citi Research and company estimates
Versus recent acquisition average of $595/complexity barrel

___________________________
1) See appendix for the definitions and reconciliation of the non-GAAP financial measures. $375 million represents 6-year avg., $275 million removes the high
of 2015 for a 5-year avg.
2) Company assumptions and expectations are subject to change and may not reflect actual market conditions
3) Based on current assumptions and forward curve pricing
$1,929
PBF’s Martinez Potential Earnings Power
8
Significant and sustainable free cash flow(1) generation driven by:
• Resilient earnings power
• Manageable required CapEx aided by near-term seller reimbursements (~$110 million)
• Significant tax shelter from full expensing of up-front purchase price and annual run-rate capex
Synergies ramp to reach an expected run-rate of $125 million in third year of ownership
IMO-driven benefits are excluded from the base case and an incremental positive
Basic assumptions(2)
• Projected throughput of ~150,000 – 160,000 barrels per day
• Estimated crude differential of ~$1.50 under ANS
• Average San Francisco ANS 3/2/1 benchmark crack of ~$16.00
• Operating expenses of ~$450 – $500 million per year
• Average long-term capital expenditures of ~$150 million per year
Historical Pro Forma EBITDA(1) $275 - $375 million
West Coast Operational and other synergies(2) $125 million
IMO-driven Benefits(3) $100 - $200 million
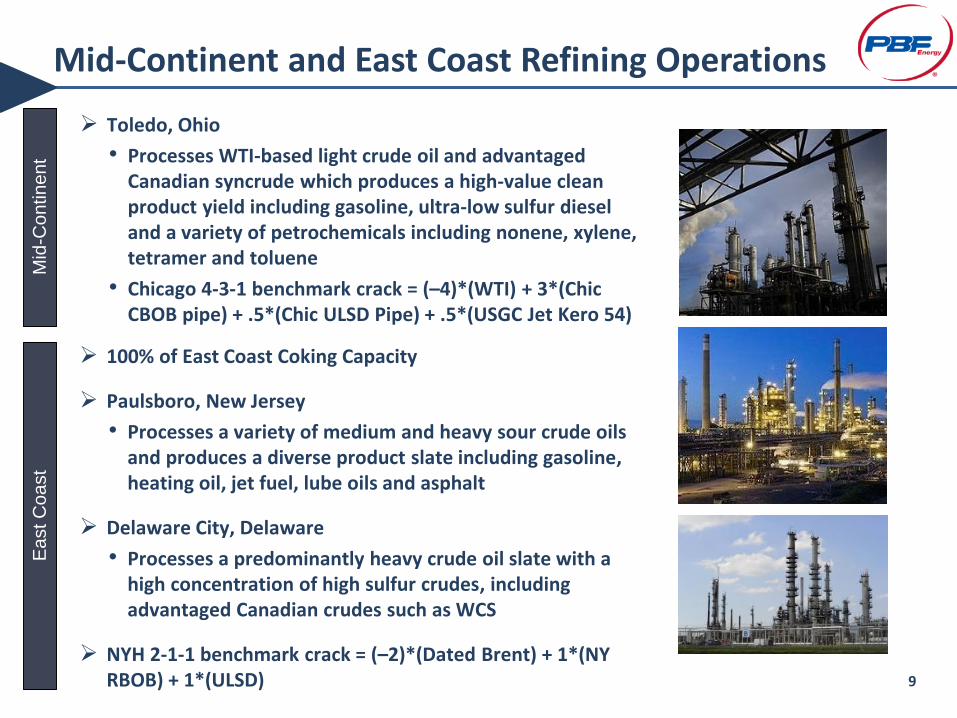
Toledo, Ohio
• Processes WTI-based light crude oil and advantaged Canadian syncrude which produces a high-value clean product yield including gasoline, ultra-low sulfur diesel and a variety of petrochemicals including nonene, xylene, tetramer and toluene
• Chicago 4-3-1 benchmark crack = (–4)*(WTI) + 3*(Chic CBOB pipe) + .5*(Chic ULSD Pipe) + .5*(USGC Jet Kero 54)
Mid
-Co
ntin
en
tE
ast C
oa
st
100% of East Coast Coking Capacity
Paulsboro, New Jersey
• Processes a variety of medium and heavy sour crude oils and produces a diverse product slate including gasoline, heating oil, jet fuel, lube oils and asphalt
Delaware City, Delaware
• Processes a predominantly heavy crude oil slate with a high concentration of high sulfur crudes, including advantaged Canadian crudes such as WCS
NYH 2-1-1 benchmark crack = (–2)*(Dated Brent) + 1*(NY RBOB) + 1*(ULSD)
Mid-Continent and East Coast Refining Operations
9

Continuing to enhance the asset and commercial flexibility
Invested ~$100 million in margin improvement projects
• Restarted idled reformer, hydrotreater and light-ends recovery plant
• Upgrades unfinished naphtha to high-value clean products
• Completed crude storage project improves crude flexibility, reduces vessel demurrage
• Increased clean product exports (and reduced RIN exposure)
Restarting idle 12,000 bpd coker to take advantage of expected discounts for high-sulfur feedstocks (crude and gasoil)
USGC 2-1-1 benchmark crack
• (–2)*(LLS) + 1*(GC 87 Gasoline) + 1*(GC ULSD)
Chalmette Refinery – Focus on Optimization
10

Torrance Refinery – Focus on Reliability
Focus on stable and reliable operations
Reliability improvements have driven increased profitability and operating expense reductions
Margin enhancement
• Increased rack throughput to approximately 70% of gasoline yield
• Optimizing distillate margin contribution through rapid, low-cost opportunities
• Successfully entering new markets, including exports
LA 4-3-1 benchmark crack
• (–4)*(ANS) + 3*(85.5 CARBOB) + .5*(LA CARB Diesel) + .5*(LA Jet 54)
11

Mid-Continent Assets Knoxville Terminals Toledo Storage Facility Toledo LPG Truck Rack Toledo Truck Terminal Toledo Terminal Toledo Rail Unloading
East Coast Assets Paulsboro NG Pipeline East Coast Terminals East Coast Storage Assets DCR Products Pipeline DCR Truck Rack DCR Rail Facility DCR Ethanol Storage Facility Paulsboro Lube Oil Terminal
Paulsboro
Toledo
Chalmette
Torrance
PADD 2
PADD 3
PADD 5
Delaware City
PADD 4
PADD 1
West Coast Assets Torrance Valley Pipeline
Gulf Coast Assets Chalmette Storage Facility Chalmette Truck Rack Chalmette Rosin Yard
PBFX is a Strategic Growth Partner
Since inception, PBFX has delivered over 200% EBITDA growth
• Since 2015, ~65% of growth from third-party acquisitions and organic projects
Targeting ~$100 million of EBITDA* from organic projects to be implemented over the next 4 – 5 years
PBF retains drop-down inventory of ~$200 million EBITDA* of logistics assets
Completed immediately accretive IDR simplification in February 2019
• Eliminated IDR burden, improves cost of capital and strengthens GP/LP alignment
• Enhances ability to pursue organic growth projects and acquisitions
PBF indirectly owns 100% of the general partner and ~48% of the limited partner interests of PBF Logistics LP (NYSE:PBFX)
*Due to the forward-looking nature of forecasted EBITDA, information to reconcile forecasted EBITDA to forecasted earnings and cash flow from operating activities is not
available as management is unable to project financing terms and working capital changes for future periods at this time. 12

IMO is a Differentiator for PBF – Rewards Complexity
International Maritime Organization (IMO) low-sulfur-fuels requirements scheduled to take effect January 1, 2020
Complexity and conversion capacity will be beneficiaries
PBF has no required capital investments
Investment opportunities to capture incremental benefits
• Hydrogen plant at Delaware City refinery
• Restarting coker at Chalmette refinery
• East Coast storage facilities for high-sulfur resid handling
Well-positioned to benefit from discounted high-sulfur feedstocks
• Light-heavy crude differentials
• Intermediate inputs
0%
5%
10%
15%
20%
25%
Coking Capacity(1)
(percentage of crude throughput)
Source: Company Data, 2017 AFPM Refining Capacity Report
13___________________________1. Assuming successful close of the announced transactions to acquire the Martinez refinery

Appendix

Cascading upfront consideration based on the date of closing:
• $1.0 billion closing on or before October 1
• $990 million closing on November 1
• $980 million closing on December 1
• $970 million closing on January 1
• $900 million closing on April 1 or thereafter
Q1-2020 Turnaround Activity
• Regardless of ownership, Seller will fund approximately $70 million for the Q1-2020 turnaround costs
• In addition, if PBF owns Martinez during the turnaround, Shell will provide up to approximately $40 million of compensation for costs associated with the downtime
Seller is committed to fund certain future capital requirements, approximately $80 million over the next 2 to 4 years
Net working capital estimate of approximately $250 - $300 million, based on market conditions at closing
Transaction includes multi-year earn-out with Seller
Martinez Refinery Transaction Summary
15

Martinez Refinery Asset Overview
Martinez Refinery Indicative Inputs
• Heavy: 85% - 90%
• Light/Medium: 5% - 10%
• Other: 5% - 10%
• Average crude API: 20 degrees - TAN: 2.7
Martinez Refinery Indicative Yields
• Gasoline: 55% – 60%
• Distillate: 35% – 40% (approximately 2/3 Jet, 1/3 CARB Diesel)
• Other: 10% – 15%
• Average volume gain of ~3%
Operating units and logistics
• 157kbpd nameplate crude capacity, delayed coker and flexicoker, fluid catalytic cracker, reformer, sulfuric alkylation, significant hydrotreating and additional upgrading capability
• 80 MW Cogeneration facility
• Integrated marine terminal with direct waterborne access, onsite truck rack and third-party pipeline connectivity to Northern California market and San Francisco Airport
• Approximately 8.8 million barrels of feedstock and product storage capacity
16

$ in millions (except where noted)
MartinezPro forma Historical
Annual Run-rate(Low Case)
MartinezPro forma Historical
Annual Run-rate (High Case)
Net Income $145 $220
Add: Depreciation and amortizationexpense(1)
40 40
Add: Interest expense 35 35
Add: Income tax expense @ 27% rate
55 80
EBITDA $275 $375
EBITDA - Our management uses EBITDA (earnings before interest, income taxes, depreciation and amortization) as a measure of operating performance to assist in
comparing performance from period to period on a consistent basis and to readily view operating trends, as a measure for planning and forecasting overall
expectations and for evaluating actual results against such expectations, and in communications with our board of directors, creditors, analysts and investors
concerning our financial performance. PBFX Management defines EBITDA as net income (loss) before net interest expense including amortization of loan fees and
debt premium and accretion on discounted liabilities, income tax expense and depreciation and amortization expense. EBITDA is not a presentation made in
accordance with U.S. generally accepted accounting principles (“GAAP”) and our computation of EBITDA may vary from others in our industry. EBITDA should not be
considered as an alternative to operating income or net income as a measure of operating performance. In addition, EBITDA is not presented as, and should not be
considered, an alternative to cash flows from operations as a measure of liquidity. EBITDA also has limitations as an analytical tool and should not be considered in
isolation, or as a substitute for analysis of our results as reported under GAAP.
17
With respect to projected EBITDA related to synergies, we are unable to prepare a quantitative reconciliation to the most directly comparable GAAP measure without
unreasonable effort, as, among other things, certain items that impact this measure are subject to market conditions and other factors that are out of our control and
cannot be accurately predicted. In addition, management is unable to project working capital changes for future periods at this time.
Note – figures in table are estimates and subject to change based on actual operating performance, market conditions and other factors
___________________________1. Amounts exclude depreciation associated with future capital spending
Free Cash Flow - We define Free Cash Flow as net income plus depreciation and amortization, interest, and income tax expense less cash payments for capital
expenditures, interest and other financing costs and income taxes. Free Cash Flow is considered a non-GAAP financial measure. However, we believe that Free Cash
Flow is an important financial measure for use in evaluating the company's financial performance and assessing our ability to generate discretionary cash from our
business operations. Free Cash Flow should be considered in addition to, and not as a substitute for, net income as a measure of our performance and net cash
provided by operating activities as a measure of our liquidity. Additionally, our definition of Free Cash Flow is limited, in that it may not represent all residual cash flows
available for discretionary expenditures, due to the fact that the measure does not adjust for all non-cash and cash expenditures attributable to our operations.
Additionally, because Free Cash Flow may be defined differently by other companies in our industry, our definition may not be comparable to similarly titled measures
of other companies, thereby diminishing its utility.
Non-GAAP Financial Measures


![g]kfn ;/sf/ pBf]u dGqfno pBf]u ljefu](https://img.dokumen.tips/doc/110x75/61b4af4c99949b10312c9ada/gkfn-sf-pbfu-dgqfno-pbfu-ljefu.jpg)