Embed Size (px)
Citation preview

Paying for Health Insurance: The Trade-Off between Competition and AdverseSelection
David M. Culter; Sarah J. Reber
The Quarterly Journal of Economics, Vol. 113, No. 2. (May, 1998), pp. 433-466.
Stable URL:
http://links.jstor.org/sici?sici=0033-5533%28199805%29113%3A2%3C433%3APFHITT%3E2.0.CO%3B2-N
The Quarterly Journal of Economics is currently published by The MIT Press.
Your use of the JSTOR archive indicates your acceptance of JSTOR's Terms and Conditions of Use, available athttp://www.jstor.org/about/terms.html. JSTOR's Terms and Conditions of Use provides, in part, that unless you have obtainedprior permission, you may not download an entire issue of a journal or multiple copies of articles, and you may use content inthe JSTOR archive only for your personal, non-commercial use.
Please contact the publisher regarding any further use of this work. Publisher contact information may be obtained athttp://www.jstor.org/journals/mitpress.html.
Each copy of any part of a JSTOR transmission must contain the same copyright notice that appears on the screen or printedpage of such transmission.
The JSTOR Archive is a trusted digital repository providing for long-term preservation and access to leading academicjournals and scholarly literature from around the world. The Archive is supported by libraries, scholarly societies, publishers,and foundations. It is an initiative of JSTOR, a not-for-profit organization with a mission to help the scholarly community takeadvantage of advances in technology. For more information regarding JSTOR, please contact [email protected].
http://www.jstor.orgThu Aug 23 09:31:28 2007

PAYING FOR HEALTH INSURANCE: THE TRADE-OFF BETWEEN COMPETITION AND ADVERSE SELECTION*
DAVIDM. CUTLER J. REBERAND SARAH
We use data on health plan choices by employees of Harvard University to compare the benefits of insurance competition with the costs of adverse selection. Moving to a voucher-type system induced significant adverse selection, with a welfare loss of 2 to 4 percent of baseline spending. But increased competition reduced Harvard's premiums by 5 to 8 percent. The premium reductions came from insurer profits, so while Harvard was better off, the net effect for society was only the adverse selection loss. Adverse selection can be minimized by adjusting voucher amounts for individual risk. We discuss how such a system would work.
Governments are increasingly turning to market forces as a way to limit the cost of social insurance. Traditionally, social insurance programs were operated as nonmarket goods; govern- ments mandated participation in a central program, collected revenues to finance the program, and ran the insurance system. There was no role for competition among suppliers in providing the basic benefit.
As the costs of social insurance have increased, however, the centralized model of social insurance is coming under increasing strain. In the United States, for example, recent proposals have called for replacing the Medicare program with a health care voucher for the elderly [Aaron and Reischauer 1995; Cutler 19961. The voucher would guarantee people a basic insurance plan, but the plans would be privately run. Competition among plans would generate plan premiums and enrollments. Similarly, long- standing proposals for Social Security reform have called for replacing the current system with a system of individual ac- counts, where people would make saving, investment, and annu- itization decisions on their own [Advisory Council on Social Security 1996; Feldstein 19961.
The trend is not just domestic. In the United Kingdom the National Health Service has moved to encourage more competi- tion in recent years, with the establishment of hospital "trusts" that bid for patients and partially fixed payments to physicians,
* We are grateful to Sally Zeckhauser, Thomas Schmitt, and Lydia Cummings for providing us data, to them, Jason Furman, Edward Glaeser, Lawrence Katz, Michael Kremer, Christopher Ruhm, Sujata Sanghvi, Andrei Shleifer, Douglas Staiger, Richard Zeckhauser, and two anonymous referees for helpful comments, and to the National Institutes on Aging for research support.
o 1998 by the President and Fellows of Harvard College and the Massachusetts Institute of Technology. The Quarterly Journal ofEconomics, May 1998

434 QUARTERLY JOURNAL OF ECONOMICS
from which they contract for medical services. And recent Social Security reforms have allowed people to opt out of the public system if they have a suitable private pension.
While encouraging competition seems natural for economists, competition in insurance markets is somewhat problematic. Con- sider the case of a voucher for health insurance, the subject of this paper. Under a voucher system, people will have incentives to search for efficient plans, and insurers will have incentives to limit unnecessary care. Both of these are valuable. But adverse selection is a concern as well. The less healthy naturally prefer more generous insurance than the healthy. As a result, more generous insurance plans will cost more than benefit differences alone would dictate. Healthy people, in turn, will want to avoid those plans, to keep from subsidizing their less healthy brethren. If adverse selection is large, it may destroy the market for the generous insurance entirely. The same could be true for annuity markets under a privatized social security system.
There is a lengthy literature documenting adverse selection in annuity markets [Friedman and Warshawsky 1988, 1990; Mitchell, Poterba, and Warshawsky 19971 and in multiple-choice health insurance arrangements [Price and Mays 1985; Scheckler and Schulz 1987; Brown et al. 1993; Feldman and Dowd 1993; Royalty and Solomon 1995; Riley et al. 19961. But the literature is generally silent on the welfare costs of this adverse selection, and on how these costs compare with the benefits (if any) from increased competition. In deciding on social insurance reform, these latter issues are the fundamental ones.
In this paper we analyze empirically the gains and losses from competitive reforms in health insurance payments. We use data from a reform carried out at Harvard University. In 1995 Harvard moved from a system of subsidizing generous insurance to a system of paying a fixed contribution independent of plan choice (essentially a voucher system). This policy change in- creased the price to employees of the most generous policy by over $500 annually.
We use the policy change to estimate the adverse selection costs and competitive gains of reform. We estimate a substantial demand response to the pricing reform; a 1percent increase in the premiums charged by insurers reduces plan enrollment by 2 percent. Consistent with the theory, the policy change induced substantial adverse selection. Within three years of the pricing reform, adverse selection eliminated the market for more gener-
435 PWING FOR HEALTH INSURANCE
ous insurance entirely. We estimate the welfare loss from adverse selection at about 2 to 4 percent of baseline insurance spending.
On the supply side, increasing plan choice and more stringent bargaining induced insurers to lower their premiums to Harvard. These cost savings totaled 5 to 8 percent of baseline health spending, largely from lower insurer profits. On net, pricing reform was a benefit for Harvard; the gains are greater than the losses. For society, however, the efficiency consequences are just the welfare loss from adverse selection; the reduction in insurance company profits is only a transfer from health insurance compa- nies to Harvard.
Because adverse selection is so costly, public and private insurance programs need to minimize the extent of adverse selection. A natural way to do so is to vary the voucher amount with expected spending. In the health insurance context, insurers would receive more for people who are less healthy than for people who are healthier, and in the Social Security context, annuity providers would receive more for those expected to live a long life. Methods of varying the voucher amount with health status are termed "risk adjustment." Risk adjustment can be done either on a prospective basis (using information available at the time of enrollment), or on a retrospective basis (using ex post spending data as well). In the latter part of the paper, we discuss how a risk-adjustment system can be designed.
We begin in Section I with a theoretical discussion of insur- ance market equilibrium under alternative pricing rules. In Section I1 we discuss the experiment we analyze and the data we employ. Section I11 considers demand-side responses to the policy reform. Section IV looks at supply-side changes. Section V dis-cusses the implications of our findings for the design of social insurance programs.
I. PRICINGRULES MARKE~TAND INSURANCE EQUILIBRIUM
To demonstrate the issues involved in alternative pricing rules, consider a situation of individual choice of insurance in a multiple-option system. For example, the market might be for health insurance choices in Medicare; the government would determine how much of a voucher each person is to receive, and whether the amount varies with the actual insurance policy chosen. Or, in the example we consider in this paper, the market could be for health insurance in a large firm. The firm determines

436 QUARTERLY JOURNAL OF ECONOMICS
the contribution for each worker and how that contribution depends on the plan chosen.
We focus primarily on the efficiency implications of alterna- tive pricing rules. There are a number of redistributive issues involved in pricing-from the young to the old, the sick to the healthy, the government to the firm and its employees (through the tax code). We have less to say about redistribution than about efficiency, however, so we stick to efficiency issues.
Employer contributions for insurance plank can be expressed generally as
where Ak is a fixed amount (potentially varying by plan), Pkis the actual plan premium, and P is the marginal subsidy to insurance. Traditionally, many large firms paid a percentage, generally 80 percent, of plan premiums (Ak = 0, p = .8).An increasingly com- mon alternative policy is for firms to make a fixed, equal contribu- tion to all plans (Ak = A*; P = 0).
The rationale for the equal contribution rule is twofold. If employees pay more of the marginal cost of insurance, their insurance choices should be more efficient, as those who do not value generous insurance at its full marginal cost switch to cheaper plans. In addition, if premium increases by insurers are translated dollar-for-dollar into increased prices faced by employ- ees, demand responsiveness will increase, and this may induce price reductions. These benefits are tempered by adverse selec- tion, however. If more generous plans disproportionately attract the sickest employees, prices for more generous policies will be higher than benefit differences alone would suggest. Premium differences due to adverse selection are inefficient. Thus, moving to an equal contribution rule is not guaranteed to increase welfare and may decrease it.
Demand-Side Changes
We begin by showing the trade-off between adverse selection and enrollment efficiency on the demand side. Suppose that the employees in the firm differ in health status, denoted h. For simplicity we take h to be expected health spending the individual would incur if he were enrolled in the most generous plan.
The firm offers two plans: a low-cost plan that restricts choice of providers and provider income (such as a Health Maintenance Organization [HMO]) and a high-cost plan with fewer restrictions

437 PAYING FOR HEALTH INSURANCE
on choice and more generous provider reimbursement (such as a Fee-for-Service [FFSI plan or a Preferred Provider Organization [PPOI).l We assume that the more generous plan is a PPO, to match our later empirical work. For the moment we assume that everyone will choose insurance; the only question is which policy they will choose. We return to this issue in our empirical analysis. Plans must accept anyone who wants to enroll at the same price; in the firm we analyze (as in most firms), plans must agree to this condition if they want to be on the menu of policy options.
Demand for the PPO varies with health status. We express the value of provider choice asg(h). This value is increasing in h if the less healthy value generosity in insurance more than the healthier. This is a plausible assumption, and we shall invoke it. Figure I showsg(h). For any relative out-of-pocket cost of the PPO (termed the "out-of-pocket premium") POOP,there will be a mar- ginal person h', where g(hl) = POOP.All people who are healthier than h' (h < h') will enroll in the HMO, while people who are less healthy than h' (h < h') will enroll in the PP0.2 We show one particular allocation of people in Figure I.
We denote the mean healthiness of the HMO enrollees (the conditional mean of h for h <h') as hL(hl) and mean healthiness of PPO enrollees as hu(ht). Premiums will be proportional to average spending: Pppo= hu(hl) and PHMo= a .hL(hl), where a reflects the cost savings in the HMO net of any higher profits or administrative expense. As discussed below, a is a number on the order of .9. From equation (1)the additional cost to the employee of enrolling in the PPO is Poop= (1- p) . (Pppo- pHMO).
The premium difference between the PPO and the HMO, Pppo- PHMO, depends on h', but the sign of this relation is indeterminate. As the marginal person moves from the PPO to the HMO, the average cost of the remaining PPO enrollees rises, but so does the average cost of HMO enrollees. For many distributions
1. An HMO provides medical care for a prepaid fee. The most restrictive form of HMO is the group/staff model; the physicians in this plan work exclusively for the HMO and are typically paid a salary or capitated amount (fured amount per patient per year). A less restrictive form of HMO is an Independent Practice Association [IPA]. This plan contracts with specific providers, but the providers do not work exclusively for the HMO. Providers are generally paid a capitated rate. A PPO is a plan where providers agree to discount fees in exchange for inclusion in the PPO "network." The generosity of managed care plans is largely determined by the size of the provider network, the method of physician payment, and the cost to the patient for using services outside of the network.
2. The strict delineation by health status is a result of the fact tha tg depends only on health status, not on other factors such as risk aversion. Adding such elements would be straightforward but would not yield any additional insights.

QUARTERLY JOURNAL OF ECONOMICS
HMO ...----.-.---.-.-..-.-..-.h' < p p o Health (h) >
FIGUREI Insurance Market Equilibrium
it will be the case that as more people move from the PPO to the HMO,the relative premium for the PPO will rise, because the very sick will increasingly be concentrated in the PP0.3We assume that the relative PPO premium is increasing as PPO enrollment falls. Figure I shows the relation between HMO enrollment and the out-of-pocket cost of the PPO,denoted PP.
The equilibrium in the insurance market is at point E, where employees have optimally selected plans and premiums are consistent with those enrollments. This equilibrium may or may not be stable. As the marginal person moves from the PPO to the
3. This will be true, for example, for most of the distribution if health spending is distributed lognormally. Empirical studies generally find that medical spending is distributed lognormally [Newhouse, Beeuwkes, and Warshawsky 19931, although we are more interested in the distribution of expected medical spending than of actual medical spending. There are no empirical estimates of the distribution of expected medical spending.

439 PAYING FOR HEALTH INSURANCE
HMO, the PPO premium will increase. If this premium increase results in further people leaving the PPO for the HMO, there will be a cycle of increased PPO premiums and reduced PPO enroll- ment. This is the unstable equilibrium. In order for the equilib- rium to be stable, it must be the case that the increase in PPO premiums as the healthiest person leaves the PPO is smaller than the increase in the PPO reservation value for the new marginal enrollee, or that theg(h) curve is more steeply sloped than the PP curve. This is the situation we show in Figure I.
Now suppose that the firm reduces P. For any level of PPO er~rollment the cost to the employee of enrolling in the PPO increases. Thus, the PP line rotates to PP'. The new equilibrium is at point E' , with lower PPO enrollment and a greater price differential. The dashed line in Figure I shows the factors responsible for this change. Initially, out-of-pocket premiums increase because of the pricing reform, and this induces some people to leave the PPO, so that the equilibrium would be at D. The movement from E to D is the short-run response to the reform. Because the remaining PPO pool is less healthy than the original pool, the PPO premium must rise farther, and more people will leave the plan. This occurs from D to E ' . The movement between D and E ' is the effect of increased adverse ~elect ion.~
Because of adverse selection, even small changes in pricing rules can have large effects on market equilibrium. Indeed, there need not be an equilibrium with positive PPO enrollment. If the value of choice wereg(h), for example, the new equilibrium would have everyone in the HMO (E"). The disappearance of the PPO in equilibrium E" is sometimes termed an adverse selection "death spiral."
Adverse selection results in a welfare loss. The allocation is efficient when people enroll in the HMO only if the resource savings of their own enrollment decision is greater than the value they place on the provider choice offered by the PPO. The person optimally indifferent between the two plans is given by h*, where (1- a)h* =g(h"). This implies an efficient employee price for the PPO of PgOP= (1- a)h:t Under an equal contribution rule the
4. The exact transition from the old to the new equilibrium depends on insurer and individual behavior. If insurers know demand responses well and there are no plan-switching costs, the equilibrium will jump from E to E'. If insurers base premiums on enrollment in the prior year and employees base their enrollment decisions on current year prices, the equilibrium path will be the dashed line.

QUARTERLY JOURNAL OF ECONOMICS
hi Health (h)
FIGUREI1 Welfare Implications of Pricing Reform
actual difference in plan premiums will be
The first term in equation (2) is the efficiency savings in the HMO.5 The second term is adverse selection. Only in particular circumstances-for example, if people are randomly distributed across plans-will the equilibrium premium difference be the efficient premium difference. To the extent that adverse selection increases the price difference above the efficient level, too few people will be in the PPO relative to the efficient level.
Figure I1 shows the welfare consequences explicitly. We
5. Note that this is the resource savings for the average person already in the HMO, not for the marginal person in-between the PPO and the HMO. Since people already enrolled in the HMO will be healthier than people at the margin ofjoining the HMO, this price will be below the optimal price difference that the marginal employee should face. The efficient price will need to exceed this first term by an amount that adjusts for the difference between the average and marginal HMO enrollee.

441 PAYING FOR HEALTH INSURANCE
assume that initially the employer is subsidizing the PPO more than is optimal (P< (1- a)h*), so that there is a deadweight loss of area A. Moving to an equal contribution rule eliminates area A but creates deadweight loss of area B, if the new price is greater than the efficient level (P' > (1- a)h*). In addition, the equal contribution rule involves redistribution of Area C-premium payments by those who remain in the PPO above the socially efficient level, which implicitly are redistributed to HMO enroll- ees (in the form of lower premiums than is ~ p t i m a l ) . ~ Whether reform on net increases or reduces welfare depends on the relative size of areas A and B.
Supply-Side Changes
There may also be supply-side effects of changing pricing rules. Moving to an equal contribution rule will change the sensitivity of employees to premium increases. If Harvard cannot credibly threaten to remove an insurer from the set of choices, then the only constraint on insurer pricing is the elasticity of demand for the insurance policy. The response of demand to price increases will be greater under an equal contribution rule than under a rule where premiums are subsidized at the margin. Suppose that insurer k increases the premium by 100x percent, or xPk dollars. If the employer is subsidizing the premium at rate P at the margin, the increase in costs to the employee is (1- P)xPk. As a share of initial employee payments (EEk), this is (1- p) xPkIEEk. Generally, employee payments are about 25 percent of plan premiums, so the increased cost to employees is roughly 400 (1- p) x percent. The reduction in plan enrollment will therefore be approximately
percent, where q is the elasticity of demand for insurance-the demand response to an increase in the out-of-pocket cost paid by the employee. Thus, as employers move toward a fixed payment for insurance (as p falls), the demand response to a given
6. We term this a redistribution, but it may also involve efficiency issues. Ex ante, people may want to purchase insurance against the risk of being sick and valuing the PPO highly. When the PPO premium is too high, that insurance is denied them ex post. Thus, all payments above the average cost might also be termed an efficiency loss. The amount of the redistribution will naturally depend on whether wages adjust to the policy change; throughout our analysis we assume that wages are unaffected by the pricing reform.

442 QUARTERLY JOURNAL OF ECONOMICS
premium change increases. Employers will thus capture more of the surplus from insurance.
In practice, premiums in most firms, including the firm we analyze, are determined by a negotiation process between firms and insurers. Insurers submit bids for their insurance policy, but the proposed rates are then negotiated. Either party to the negotiations can cancel the plan if the premium is unacceptable. Moving to an equal contribution rule might have no effect on premiums in such a circumstance, if bargaining undoes the effect of greater demand response on profits. But the negotiation may change the division of surplus in other ways, by changing the profitability of selling insurance or by convincing insurers of the seriousness of the firm about reducing costs.
Moving to an equal contribution rule could also change the quality of insurance plans and thus their price. As employees are made to pay more for marginal premium increases, the demand for additional quality improvements will fall. This could lower quality, and thus premiums. In addition, insurers may change the quality of their insurance to attract better risks. Certain types of benefits (oncology services, for example) will attract sicker enroll- ees; other types of benefits (health club memberships and well- baby care, for example) are more likely to attract healthier enrollees. If insurers are concerned about adverse selection under an equal contribution rule, they may tilt their offerings away from benefits for the sick and toward benefits that healthy individuals value.
Pricing reforms could induce quality change for all an insur- er's enrollees or differentially for the firm moving to an equal contribution rule. Insurers would like to set quality on a group-by- group basis, but technology makes this difficult. All enrollees in an insurance plan generally receive services from the same provid- ers, and provider compensation is typically not varied by enroll- ment group. Thus, changes in the quality of providers will almost certainly be common to all enrollees. But cost sharing can differ across groups, so cost sharing changes can be targeted to firms changing their benefits rules.
The net effect of these supply-side factors is likely to lower premiums, but the magnitude of the premium reduction is an empirical question.
If premiums are affected by changes in pricing rules, the efficiency implications of these changes depend on how they are realized. If premium reductions come from insurer profits, the

PAYING FOR HEALTH INSURANCE 443
reduction in premiums is just a transfer of resources from insurers to employers (and presumably on to employees). There will be no efficiency consequences of the profit reduction. The same would be true if premium reductions are financed by lower insurer payments to health care providers; this would just be a transfer from health care providers to insurance purchaser^.^ If premium reductions are financed by reduced services provided, however, there will be social gains or losses equal to the difference between the value of medical care that is no longer provided and the cost of that care. The cost of care eliminated may be equal to its value to consumers, but when insurers change their policies, there is no presumption that this is the case.
Eficient Pricing
While the equal contribution rule may or may not increase efficiency relative to particular alternative payment rules, the equal contribution rule will not be the most efficient rule, so long as there is adverse selection. If preferences for generous coverage are correlated with health status, the relative price of generous insurance will be too high under the equal contribution rule.
There is a pricing scheme that will offset the effects of adverse selection on premiums, producing a more efficient outcome than an equal contribution rule. Suppose that the employer contributes different lump-sum amounts to each plan, taking into account differences in enrollee health: Appo = hu(h*) and AHMo= hL(h*). After factoring out this difference, the remaining price variation between the PPO and the HMO will be the true resource difference between the plans, Poop = (1- a)hL(h*). This is the appropriate price for employees to face.8 In the optimal payment system, therefore, employer contributions should be fixed, but not equal across plans. This approach is frequently termed a "risk- adjusted" pricing rule. We return to how such a system might be implemented in Section V.
7. Both of these effects assume that the reduction in premiums does not induce more people to purchase insurance who would not otherwise have done so or induce providers to leave the medical sector. In the short run this is reasonable. In the long run the insurance purchase decision and the supply of resources to the medical sector will be price elastic.
8. As noted in footnote 5, this is subject to the proviso that the person a t the margin between the HMO and the PPO will be sicker than the average person already enrolled in the HMO and thus should realize a greater cost saving from enrolling in the HMO. AHMowould thus have to be greater than (1- a)hL(hy!to provide the appropriate incentives for the marginal HMO enrollee. The intuition for the optimal price is the same, however.

444 QUARTERLY JOURNAL OF ECONOMICS
TABLE I CHANGESIN EMPLOYEE RESULTING REFORM,1995PAYMENTS FROM PRICING
Employee payment Share of
Total Old New enrollment, Plan premium policy policy Change 1994
Individual PPO HealthFlexBlue $2773 $ 555 $1152 $597 16% IPA BayState 2127 489 576 87 5
Pilgrim 2123 382 564 182 2 Tufts 2119 381 564 183 8
GIs HCHP 1945 253 384 131 25 HUGHP 1957 235 396 161 44
HMO average $1980 $ 277 $ 421 $144 84%
Family PPO HealthFlex Blue $6238 $1248 $2208 $960 22% IPA BayState 5772 1154 1572 418 9
Pilgrim 5734 1032 1488 456 3 Tufts 5721 1030 1488 458 10
GIs HCHP 5252 683 1056 373 28 HUGHP 5264 632 1068 436 29
HMO average $5395 $ 776 $1191 $415 78%
GIs is a grouplstaff model HMO. HCHP is Harvard Community Health Plan. HUGHP is Harvard University Group Health Program, the HMO run by the University. In 1994 there were 3627 individual policies and 3387 family policies among full-time employees.
Out-of-pocket premiums are for a n individual with salary between $45,000and $70,000.
We examine the response to pricing reform empirically using data on health insurance choices by employees of Harvard Univer- sity. The Harvard experience is valuable because of a recent pricing change the University implemented (see Reber [I9961 for more discussion).
Traditionally, Harvard offered its employees a range of insur- ance choices, shown in Table I. The most generous plan was a Blue CrossBlue Shield Preferred Provider Organization (PPO). In addition, the University offered five HMOs: three Independent Practice Organizations [IPAsl; and two grouplstaff [GIs] model HMOs.g The grouplstaff model HMOs are the most restrictive, and
9. There were two other plans offered to employees: a plan available only in central Massachusetts and an out-of-state Blue CrossBlue Shield policy. These were not designed for employees in the Boston area, however, so we omit analysis of them.

445 PAYING FOR HEALTH INSURANCE
the IPAs are between the grouplstaff HMOs and the PPO. One of the GIs model HMOs is run by Harvard's internal health service, Harvard University Group Health Program (HUGHP); the remain- der of the HMOs and the PPO are commercial products provided by insurers not affiliated with the University.
Harvard historically subsidized the PPO quite generously at the margin. As Table I shows, while the PPO premium for an individual was $800 per year more than the premium for an average HMO, under the old policy the individual paid only $280 more for the PPO than for an HMO. For a family, employees paid only $500 more for the PPO than for an HMO, even though the premium was close to $1000 higher. With this set of subsidies, enrollment in the PPO was stable at about 20 percent of total enrollees, as shown in Table 11.
In the mid-1990s Harvard faced a deficit in the employee benefits budget. The rising cost of health insurance in particular was identified as a leading cause.1° The University began looking for ways to reduce health insurance costs, and beginning in 1995, the University implemented a health insurance pricing reform. Under the new policy, Harvard contributes an equal amount to each plan, regardless of which plan an employee chooses.ll Harvard's contribution is 85 percent, 80 percent, and 75 percent of the least expensive commercial policy (excluding HUGHP) for employees earning below $45,000, between $45,000 and $70,000, and more than $70,000, respectively.
Because the budget deficit drew substantial attention and the reforms were significant, the policy change was widely discussed. Harvard's policy change is thus valuable for learning about the implications of pricing reform.
The new policy applied to all of the roughly 10,000 full-time Harvard employees. Two of the unions, representing about 3000 full-time employees, did not agree to the new policy until 1996. This creates a natural "treatmentlcontrol" situation. We divide employees into those who experienced the policy change in 1995 (termed the "1995 Treatment Group") and those who experienced the policy change in 1996 (termed the "1996 Treatment Group").
10. Economically, it may not be meaningful to speak of a deficit in one part of a larger budget, but a t Harvard (as at many other companies), accounts for different services are analyzed separately.
11. The contribution is different for individuals and families. Part-time workers also receive different contributions. We focus our analysis on insurance choices for full-time workers.

446 QUARTERLY JOURNAL OF ECONOMICS
TABLE I1 TRENDSIN REAL PREMIUMS AND ENROLLMENTS
Year
Measure 1992 1993 1994 1995 1996
Individual Out-of-pocket cost of PPO
1995 treatment group 1996 treatment group
Share of enrollees in PPO" 1995 treatment group 1996 treatment group
Real premium PPO HMOs
Family Out-of-pocket cost of PPO
1995 treatment group 1996 treatment group
Share of enrollees in PPO" 1995 treatment group 1996 treatment group
Real premium PPO HMOs
Premiums are in 1995 dollars. Out-of-pocket premiums under the new policy are for employees earning between $45,000 and $70,000.
*Summary data for 19921994 include individuals and families together, and are for both part-time and full-time workers. The divisions into 1995 and 1996 treatment groups include only full-time workers and are reported separately for individuals and families.
In analyzing the 1995 data, we use the 1996 Treatment Group as a control. We reverse this situation in 1996.
The policy change had a dramatic effect on the relative price of different health plans, as shown in Table I. For individuals the cost of the PPO rose from $555 to $1152, a $597 increase, while the cost of an average HMO rose by only $144, for a net increase in PPO costs of $453. For families the net increase in PPO costs was $545.
The first question we examine is the enrollment response to this reform. Table I1summarizes enrollment and cost information

447 PAYING FOR HEALTH INSURANCE
over time. Consistent with a nonzero demand response, PPO enrollment fell by four percentage points for the 1995 Treatment Group when the policy was implemented. PPO enrollment among the 1996 Treatment Group, in contrast, was essentially un-changed. The reverse situation is true in 1996.
To formalize this relationship, we express latent demand for the PPO (denoted PPO") as a function of the effective out-of- pocket price of the PPO (P",, and other covariates (X):
+ 611995 Treatment Groupi + 62 Year, + eit,
where i denotes individuals and t denotes time. In principle, we could estimate a more detailed model of plan choice, separating out the type of HMO enrollment as well as PPO enrollment (as in Feldman et al. [19891).12 Because the change in out-of-pocket premiums was essentially the same for the two largest HMOs, however, our primary source of identification is the decision to enroll in the PPO or an HMO. We thus focus on this decision.
Both before and after the policy change, employee contribu- tions to health insurance at Harvard were made on a pretax basis, since Harvard has a Section 125 ("cafeteria") plan that allows employee contributions for certain benefits to be excluded from taxation. Thus, the effective price to the employee of the PPO is only PbOp= (1- where is the employee's combined 7)POOP, T
marginal federal, state, and Social Security tax rate and Poopis the cost of the PPO relative to the cost of an average HM0.13 The marginal tax rates are imputed based on the worker's salary and family status.14
12. Feldman et al. [I9891 found that the effects of price changes of plans within the same nest had a greater impact on a plan's market share than price changes outside the nest. At Harvard about 80 percent of employees were enrolled in an HMO before the pricing change, so HMOs set their premiums to compete for current HMO market share as well as switchers from the PPO. This price competition among HMOs is an important source of savings to Harvard.
13. We use a simple average of HMO premiums to avoid potential endogene- ity issues from weighting by actual enrollment. In practice, the method used for averaging HMO premiums does not affect our coefficient estimates.
14. We assume that people with a family policy file joint returns, and people with an individual policy file single returns. We adjust the salary of people with a family policy by the average ratio of family income to individual income in the CPS (separately for men and women) to form income for the family. Since we do not know the particulars of anyone's income outside of their Harvard salary, we cannot include direct information on this. We also assume the average number of exemptions and deductions by income.

448 QUARTERLY JOURNAL OF ECONOMICS
TABLE I11 LOGISTICREGRESSION OF INSURANCEESTIMATES CHOICE
PPO enrollment Drop coverage Independent Mean
variable (std devn) 1994-1995 1995-1996 19941995 1995-1996
ln(P",,,) 3.64 - 430":" 784"" 1.618"" ,794""
(.44) (.058) (.I211 (.359) (.367) Treatment group .67 .008 -.I42 - -
(.089) (.I121 Second year - ,058" -.031 - -
(.033) (.086) Individual policy ,52 -,059 -,203*# -,487"" - ,474""
(.067) (.084) (.207) (.245) Age 30-39 ,33 ,568":" 775"# ,443 -.337
(.137) (.151) (.379) (.340) Age 40-49 ,25 1 . 0 0 5 : ~ 1,259":1: ,139 -.881""
(.140) (.I541 (.409) (.404) Age 50-59 ,16 1.340:!'# 1.565:':" .I41 -235"
(.150) (.I631 (.455) (.485) Age 60-69 ,08 1.470:"" 1.653:"" -.484 -1.652""
(.169) (.182) (.603) (.767) Salary between $45,000 .18 .491"" ,531"" ,278 1.054** and $70,000 (.094) (.loo) (268) (287) Salary > $70,000 .15 .995:" 1,176"" ,156 ,918:""
(.I121 (.I241 (.376) (.402) Female .52 .240#" 269#$ -,039 -,I68
(.067) (.072) (.I991 (241) Distance to HMO (miles) 15.0 .0011 -.0016 -.027 -.003
(61.8) (.0048) (.0052) (.038) (.027) Distance > = 300 miles .04 ,019 1.275 9.796 2.675
(1.427) (1.564) (11.301) (8.048) Tenure at University 9.5 ,023":;: ,027"" -.015 -.004
(9.6) (.004) (.004) (.013) (.017) Faculty .17 .435":" ,562'" -.060 -.I31
(.088) (.093) (243) (.322) Hourly .09 -.I46 -.090 -.420 -.461
(.I271 (.136) (.485) (.547) Sample size 9,073 16,727 17,741 7,654 8,601 ln(like1ihood) -6,694.33 -5,692.25 -608.59 -449.67
Summary statistics are for 1995. Standard errors in the equations for PPO enrollment are adjusted for the presence of multiple observations per person.
*Statistically significant a t the 10 percent level. ".'Statistically significant a t the 5 percent level.
We include a variety of control variables in the model, the means of which are reported in the first column of Table 111: age, sex, employee type (faculty, staff, or hourly), job tenure, salary, single or family plan, and distance from the nearest grouplstaff

449 PAYING FOR HEALTH INSURANCE
model HMO clinic.15 Since we also include year and treatment group dummy variables, the coefficient y represents the difference- in-differences estimate of the effect of prices on insurance choice. The most important omitted variable is health status. The theory predicts that the demand elasticity will be greater for people whose health status places them at the margin between PPO and HMO enrollment. Because confidentiality restrictions prevent the inclusion of health-status data, we estimate an average demand elasticity over all health states.
The second and third columns of Table I11 report logit estimates of equation (4). We estimate the model separately for 1994-1995 and 1995-1996 to allow the elasticity to differ over time; in each case, the standard errors are adjusted to account for the fact that we have multiple observations on the same family unit. Most of the independent variables are consistent with expectations. Age is a consistent positive and significant predictor of PPO enrollment, as is being female and job tenure and salary at the University. Faculty members are also more likely to choose the PPO. Surprisingly, distance to an HMO does not affect plan choice.
As the first row shows, the relationship between price and PPO enrollment is negative and significant in both years. The demand elasticity implied by these estimates (the numerical elasticity from a 1percent increase in price) is -0.3 in the first year of reform and -0.6 in the second year. Recall from Section I that the response to an increase in the total premium under an equal contribution rule is roughly four times the demand elastic- ity. Our estimate of the enrollment response to an increase in total premiums is therefore about -2. Interestingly, the coefficient on the Second year variable is about zero or slightly positive. The price change thus explains all of the change in enrollment over time.
The estimate of -2 is higher than traditional estimates of demand responsiveness. Estimates from the 1980s using cross- firm variation in the generosity of benefits typically suggested demand elasticities with respect to total premiums of about - .2 to -.5 [Taylor and Wilensky 1983; Holmer 1984; Farley and Wilen- sky 19841, although some studies [Phelps 1986; Welch 1986; Feldman et al. 19891 generated substantially larger elasticities
15. We match employee zip codes to the zip code of the clinics and find the minimum distance between the employee's home and a clinic. We truncate the distance at 300 miles and include a dummy variable for people with distances beyond that amount.

45 0 QUARTERLY JOURNAL OF ECONOMICS
between -2 and -8. More recently, data from individual choices within multiple option systems have suggested elasticities with respect to out-of-pocket premiums of about -.5 or larger [Dowd and Feldman 1994; Royalty and Solomon 1995; Buchmueller and Feldstein 1996; Hill and Wolfe 19971.l6
To examine the sensitivity of our results to functional form, we estimated a linear probability model for PPO enrollment. The coefficient for the 1994-1995 period is -.063 (.008), for an elasticity of -.4. The coefficient for the 1995-1996 period is somewhat lower, but still statistically significant (a coefficient of -.027 (.009), implying an elasticity of -.2). In this framework we can also instrument for the price change using treatment group/ year interactions, to isolate the component of price changes due only to the differing implementation dates.17 The price elasticity from this model is -.2 and significantly different from zero. Finally, if we estimate a fixed effect linear probability model, the price elasticity is again -.2, which is also statistically different from zero.18
Rather than changing their insurance policy, individuals may decide to stop receiving coverage from Harvard entirely as the premium increases, if they have insurance through a spouse or choose to be uninsured, for example. To test this, we estimate logit models for whether people who had insurance in one year dropped coverage in the next year. We model this decision as a function of the price change for the plan in which the individual was enrolled and the demographic characteristics noted above.lg
The last two columns of Table I11 report these estimates. Out-of-pocket premiums significantly affect the probability of dropping coverage. The elasticity of coverage with respect to the out-of-pocket premium is about -1.While this elasticity is large, the baseline rate of dropping coverage is low-only 1to 2 percent.
16. Dowd and Feldman [I9941 estimate demand elasticities nearly identical to Feldman et al. [1989]. Other studies find very large chan es in HMO enrollment-up to 80 percent-in response to price increases of & or $10 per month.
17. The effective PPO price varies within Treatment groups because of differing marginal tax rates at different salaries and because there was a small phase-in for lower-salaried employees in the 1995 Treatment Group.
18. In the 1995-1996 period the elasticities in the IT' and fixed effects models are about -.I. The fixed effects elasticity is significantly different from zero, but the IV elasticity is not. There is more of a difference across models here, but the results still support the negative demand response.
19. Since our dependent variable is expressed as a change in coverage, we omit the controls for the Treatment group and the Second year dummy variable.

- - - - - - - - - -
PMING FOR HEALTH INSURANCE
TABLE IV CHARACTERISTICS CHANGESOF PLANENROLLMENT
1994-1995 sample 19951996 sample First year enrollment HMO PPO HMO PPO
Second year enrollment HMO PPO HMO PPO HMO PPO HMO PPO
Share of enrollees 99% 1% 15% 85% 100% 0% 39% 61% Average age 41** 46** 46** 50** 41 *** 46** 51**
Percent <40 50% 26% 31% 21% 50% *** 30% 15% Percent 4 M 0 44 68 56 61 45 *** 60 66 Percent >60 6 6 13 18 5 *** 10 19 Index of spending 0.96 1.09 1.09 1.16 0.97 *** 1.09 1.20
Average spending $1893 $2648
Individual and family plans are grouped together. Average spending in the last row is adjusted for individualifamily policies.
**Difference between age of people switching and remaining in plan is statistically significant a t the 5 percent level.
***Too few people for reliable estimates.
Thus, even large changes in premiums would have only a small effect on coverage at Harvard.
Adverse Selection and Enrollment Dynamics
In addition to knowing the average demand elasticity, we want to know whether the people who disenrolled from the PPO were disproportionately the healthier enrollees. Table IV reports evidence on this question. The second row of the table shows the average age of people who switched plans at the end of each year relative to the people who stayed in the same plan both years. Age is a natural indicator of selection since older people use more medical care than younger people.20
There is clear evidence of age-related differences in plan changers. In the 1994-1995 enrollment period, the average age of people who moved from the PPO to an HMO is four years below the average age of those who remained in the PPO both years and ,
five years above those who were enrolled in the HMO the entire time. Both of these differences are statistically significant. The penultimate row of the table shows a spending index for each group, weighting people by average age-specific medical spend-
20. Since age is observable, this is not a case of asymmetric information leading to adverse selection. Because Harvard does not vary its contribution on the basis of age, however, it is as if the information were asymmetric.

452 QUARTERLY JOURNAL OF ECONOMICS
ing.21 The people who left the PPO were predicted to spend 5 percent less than those who remained in the PPO the following year and about 15 percent more than the average HMO enrollee. Thus, the data match well the predictions of the model: younger (healthier) people are disproportionately in the HMO, older (sicker) people are in the PPO, and middle-aged people are at the margin between the two.
Indeed, as a result of this adverse selection, the PPO lost money in 1995. Recognizing the loss, Blue Cross/Blue Shield increased the PPO premium in 1996-by about 16 percent in real terms (see Table 11).
With the new, higher premium, the out-of-pocket cost of the PPO rose markedly. Where families paid $500 more for the PPO in 1994 and $1000 more in 1995, the PPO cost $2000 more than an HMO in 1996 (see Table 11). Not surprisingly, PPO enrollment fell again in 1996 to only 8percent, compared with about 20 percent in 1994 (see Table 11).
As Table IV shows, disenrollment was again nonrandom. People leaving the PPO after 1995 were younger than those remaining in the plan and older than those in an HMO both years. Indeed, Blue Cross/Blue Shield, the sponsor of the PPO, was sufficiently concerned about falling enrollment that it compiled data on average spending in 1995 for those who left the plan at the end of the year and those who stayed. As the last row of Table IV shows,22 those who left the PPO at the end of 1995 spent 20 percent below average, while those who remained in the plan in 1996 spent 11percent above average. Overall, adverse selection is greater than selection based on age alone, but age explains a large part of adverse selection.
The large price increase notwithstanding, adverse selection led to significant financial losses for the PPO again in 1996. By the
21. Data on medical spending are from the 1987 National Medical Expendi- ture Survey (NMES). We sort the NMES into "health insurance unitsn-the group for which health insurance is typically sold and form average spending by age of household head. These are then matched to the Harvard data. To form the spending index, we scale spending for individuals and families separately to have a mean of 1.0.
22. The spending estimates are adjusted for the mix of individuals and families. The same phenomenon occurred in the BayState HMO (also run by Blue Cross/Blue Shield). In 1995 BayState lowered its premium, to compete in the new system. Without cost reductions, however, the plan lost money In response, Baystate's premium increased by 16 percent in 1996, and two-thirds of the 1995 enrollees left the plan. Data similar to those in Table IV show that the people who left BayState after its price increased used 23 percent fewer services than the average BayState enrollee that year.

PAYING FOR HEALTH INSURANCE 453
beginning of the 1997 premium cycle, it was clear to Harvard and Blue CrossBlue Shield that the PPO could not be offered a t a reasonable price, and they agreed to discontinue the plan; the BayState HMO was ended as well. Blue Cross/Blue Shield replaced the two plans with a new, more tightly managed HMO [HMO Blue]. In three years, therefore, the adverse selection "death spiral" was completed at Harvard.
Harvard was not content to offer only HMOs, however, so the University encouraged the remaining HMOs to offer plans with point-of-service (POS) options-which provide some reimburse- ment for out-of-network use. The price of this option was tied to the price of the in-network only option. Three of the HMOs agreed to offer a POS option. In effect, then, Harvard has substituted three slightly less generous plans for one more generous plan.
The Welfare Loss from Adverse Selection
To estimate the welfare consequences of adverse selection, we need to know the efficient price for employees to pay if they want to join the PPO. This information cannot be distilled from our data, but reviews of the literature on HMO savings (the Congres- sional Budget Office [I9921 and Miller and Luft [19941) suggest average savings of about 10 percent (a= .9). Since the average individual premium in 1995 was $2106 and the average family premium was $5581, this suggests an optimal PPO out-of-pocket price of about $200 for individuals and about $550 for families.23
As Table I shows, this is near the relative price for the PPO under the old payment policy ($277 for individuals and $472 for families). Thus, the price of the PPO was close to the optimal level prior to the policy reform. If this is correct, then all of the plan changes induced by the increase in the PPO price reduced efficiency.
We can estimate the magnitude of the welfare loss explicitly. The indirect utility function implied by the logit demand model [Small and Rosen 1981; Trajtenberg 1989; Feldman 19941 is
where we have incorporated the Deatment Group and Second Year dummy variables into the X vector.
23. This ignores any difference between the cost of the average enrollee in the group and the cost of the marginal HMO enrollee under the optimal pricing rule.

454 QUARTERLY JOURNAL OF ECONOMICS
Evaluating equation (5)at the 1994 prices (the optimal price) as well as an infinite price for the PPO (the effective price when it is not offered) yields a welfare loss from adverse selection of $165 per insured worker.24 Since average premiums per insured worker were about $4300, the loss is about 4 percent of baseline spending. This loss is clearly too high, because it does not account for the introduction of the out-of-network options. These plans attracted 7 percent of enrollees in 1997. As an alternative estimate, we simulate the welfare loss if the PPO premium increased just enough to reduce enrollment to 7 percent. The resulting welfare loss is about $100 per insured worker, or about 2 percent of baseline spending.
In addition to uncertainty about the value of the out-of- network option, there is also uncertainty about the functional form of the utility function. We have assumed that demand is logistic, but this need not be the case. For example, employees always have the option of dropping insurance coverage at Har- vard and purchasing insurance in the nongroup market. If we assume that no employee values the PPO more than $6000 for a family ($2400 for an individual)-roughly the average cost of an insurance policy-the loss from adverse selection would be $143 per person, or 3 percent of baseline spending. Of course, nongroup insurance is an imperfect substitute for group insurance; it frequently contains preexisting condition exclusions, and premi- ums usually vary with individual health status. As a result of these constraints, it may be that the sickest people at Harvard value the generous policy even more than we have assumed. We have no way of knowing the true distribution of demand for the PPO (particularly at the tails of the distribution), so we stick with the logit formulation. As a range of potential welfare losses, we thus assume that adverse selection resulted in a loss of 2 to 4 percent of baseline spending.
Pricing reforms clearly affect the demand side of the market; this is one rationale for this type of reform. A second rationale is to
24. As a benchmark for this estimate, note that the welfare loss can be approximated as AW = '/z. AP .Aq. Note from Table I1 that a price increase of about $1000 for individuals and about $2000 for families reduced PPO enrollment by roughly three-quarters. If we assume that a price increase for the PPO of one-third more would reduce PPO enrollment to 0, the implied welfare reduction is $200 per person (.5 x $2,000 x .2). This is close to our 4 percent estimate.

PAYING FOR HEALTH INSURANCE 455
TABLE V CHANGESIN REALFAMILY 1990-1996PREMIUMS,
Effect of increased
cost Harvard Composite rate sharing Net change
199& 1994- 1995- 1990- 1994- 1995- 1 9 9 4 199& 1994- 1995-Plan 1994 1995 1996 1994 1995 1996 1995 1994 1995 1996
PPO HealthFlex - -2.4% 15.5% - 3.2% -7.1% -1.5% - -4.1% 22.5% Blue'"
IPA BayState 5.8 -12.5 19.7 6.2 -5.3 1.8 -1.5 -0.4 -5.8 17.9 Pilgrim 3.8 -14.1 2.8 5.2 -3.5 -3.1 -1.5 -1.4 -9.1 5.9 TuRs 5.6 -12.8 -3.6 4.5 -7.6 -3.1 -1.5 1.1 -3.7 -0.5
G/S HCHP 3.9 -8.6 -3.3 4.9 -2.4 -2.1 -1.5 -1.0 -4.7 -1.1 HUGHF' 5.2 -20.7 -8.7 - - - -3.0 - - -
Difference column is the change for Harvard net of the change for the composite rate and the effect of increased cost sharing. Composite premiums are for large employers (generally 26+ or 51+ employees). The premiums are a family policy for the insurer's "standard plan with outpatient prescription drug coverage.
*Plan begins in 1992. The Boston area premium is for HMO Blue, an HMO that is similar to the HealthFlex Blue PPO.
lower health insurance premiums. In this section we evaluate the response of premiums to the pricing reform.
The first three columns of Table V show the change in premiums at Harvard from 1990-1994, 1994-1995, and 1995- 1996 (we do not report premium changes in 1996-1997 because the set of plans offered is so different). From 1990 to 1994 real premiums rose about 4 to 5 percent per year for all plans. With the implementation of the equal contribution rule in 1995, real premiums fell by 2 to 21 percent. In 1996, most of the HMO premiums continued to decline but by a smaller amount, and two of the plans (PPO and the BayState HMO) had large premium increases. Thus, the evidence suggests a substantial premium reduction in 1995, with continued, less substantial declines in subsequent years.
We want to decompose these premium changes into the three components noted in Section I: increased demand responsiveness from increased marginal prices to enrollees; effects from negotia- tions between Harvard and its insurers; and changes in the quality of insurance. Changes in premiums resulting from in- creased demand responsiveness are difficult to separate from changes in premiums resulting from more stringent negotiations, since the two occurred at the same time. We thus consider these two factors together and focus on the difference between quality and nonquality factors.

456 QUARTERLY JOURNAL OF ECONOMICS
We adjust for quality in two parts. To account for quality changes that are common throughout the insurers' policies,25 we compare the growth of premiums at Harvard with the growth of "composite" premiums charged by the insurers serving Harvard. A composite premium is not a premium charged to any particular group; rather, it is the estimate of expected medical costs for a typical company buying insurance. When a company first pur- chases insurance, it is generally charged the composite rate adjusted for its industry and demographic mix. Over time, the actual premium charged to the company is a blend of the composite rate and the company's realized experience. Thus, the composite premium is like an "average" premium, although it is not the average for any specific group. We gathered composite premiums for the specific insurers in our sample for policies that are as close as possible to the policy offered Harvard employees: a "standard plan" for a large employer in Eastern Massachusetts, including coverage for outpatient pharmaceutical^.^^
The middle columns of Table V show changes in the composite premiums. Premium growth for the composite plans was about the same as the premium growth at Harvard in the 1990-1994 and 1995-1996 periods. But composite rate premium reductions were much smaller in 1994-1995 than they were at Harvard.
Once we have adjusted for changes in composite premiums, the only residual quality change is changes in cost sharing for Harvard employees. Harvard did alter its cost sharing when it moved to the equal contribution rule. Prior to the change, most policies had a $5 copay per visit, and HUGHP had no copay. After the change, all policies charged $10 per visit. The consensus among a number of insurance actuaries we spoke to is that each $5 increase in copayment reduces premiums by about 1.5 percent. The next column of Table V shows the adjustment we use for changes in copayments.
The final columns of Table V show the net change in premi- ums at Harvard-the Harvard change less the change in the composite rate and less the change due to increased cost sharing.
25. These may be true changes in quality (for example, contracting with fewer well-trained physicians) or changes in factor prices in the Boston area that translate into lower premiums.
26. Massachusetts requires HMOs to file composite premiums with the State Insurance Department, from whom we acquired the data. The State does not require PPO rates to be filed; we thus cannot compare HealthFlex Blue with the comparable product in the Boston area. Instead, we compare HealthFlex Blue to HMO Blue, Blue CrossA3lue Shield's HMO.

457 PAYING FOR HEALTH INSURANCE
In the 1990-1994 period, the net change in premiums was small. Premium growth at Harvard was within 1.5 percent of the area average for all plans. In the 1994-1995 period, premiums fell a t Harvard by 5 to 10 percent, depending on the plan. In the 1995-1996 period, the situation is mixed, with some plans increas- ing premiums and some reducing them.
To analyze the aggregate impact of these changes, we com- pare the growth of actual spending per insured worker at Harvard with the growth of simulated spending if premiums a t Harvard had increased at the same rate as composite premiums in the Boston area and enrollment had not changed over time. In forming the growth of actual spending, we need to make one adjustment. Cost growth at Harvard fell both because premiums fell and because more people moved to cheaper plans. The second of these effects is not a resource savings to Harvard; it is just the purchase of fewer goods. We thus subtract from actual spending growth the part that results solely from employees moving into cheaper plans; the residual is the pure savings to H a r ~ a r d . ~ ~
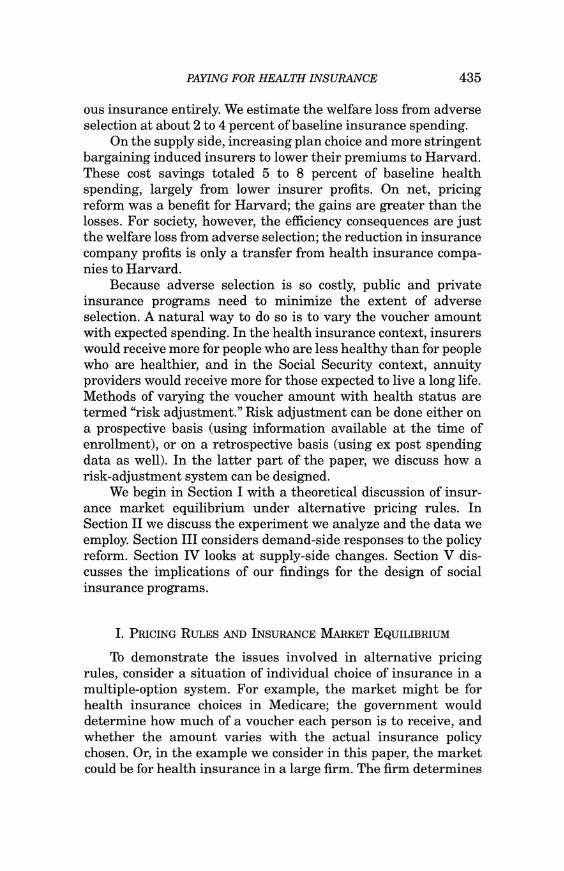
Figure 111 shows the growth of actual spending per insured worker and simulated spending per insured worker. Between 1990 and 1994 the two grew at roughly the same rate; the difference is on the order of one percentage point or less. In 1994-1995 costs fell by 8 percent more a t Harvard than in the simulation. In the subsequent two years actual cost growth was again very close to simulated cost growth. Thus, Figure I11 suggests a one-time 8 percent reduction in the level of spending relative to the baseline as a result of the policy change.
Since there is no composite premium to compare with Har- vard's internal HMO, one might be worried that the premium growth for that plan includes some quality change that we could not account for. If we assume that the quality-adjusted premium change at HUGHP was the same as at HCHP (the other group1 staff model HMO), the overall savings to Harvard from reduced premiums is 5 percent in 1994-1995, again with no reversal of this trend in the next two years. We therefore take as our range of savings estimates a one-time reduction in premiums of about 5 to 8 percent, with premiums continuing at this lower level after- wards.
27. To make this calculation, we assume that HMOs save 10 percent of average PPO costs, and that HMOs with a point-of-service option save 5 percent. Using the average premium to proxy for the cost savings overstates the resource savings, because it assumes no adverse selection. Thus, we will understate the pure price savings to Harvard.

458 QUARTERLY JOURNAL OF ECONOMICS
- 1 5 l ' 1 I I I I I 1 1991 1992 1993 1994 1995 1996 1997
Year
I .Actual 0Simulated 1
FIGUREI11 Actual and Simulated Cost Growth at Harvard, 1990-1997
Note: Actual cost growth is net of changes in cost sharing and savings from more employees enrolling in cheaper plans.
This finding is consistent with conversations we have had with executives from Harvard and the insurance companies who were involved in the negotiations. Harvard told the insurers about the policy change before it occurred, and bargained strenuously for lower rates in the first year. Several insurers stressed that being the lowest cost plan, or near the lowest cost plan, became quite important. Some of the insurers, for example, indicated that in response to the change they decided to "buy" market share at Harvard by submitting lower bids. The reduced premiums, they indicated, came at the expense of profits. The negotiations with Harvard were also quite contentious. In one case, Harvard bargained down the "experience factor" used to adjust the insur- er's standard premium for Harvard-specific utilization. In an- other case, an insurer submitted a proposed premium which Harvard accepted, but was then told that other plans had cut premiums even more and was encouraged to reconsider its bid. The plan resubmitted a lower premium.
Thus, while results based on only six plans and three years of

459 PAYING FOR HEALTH INSURANCE
postreform data cannot be definitive, the data on premiums and our anecdotal evidence suggest that the pricing reform, coupled with tighter negotiations, resulted in lower premiums to Harvard. The net savings was about 5 to 8 percent of baseline spending, largely coming from lower insurer profits. The savings did not diminish after the first year, but they did not increase either.
Private and Social Gains
The fact that the savings to Harvard (5 to 8 percent of baseline spending) were greater than the welfare loss from adverse selection (2 to 4 percent of baseline spending) means that for Harvard as a whole, the reform was a potential Pareto improvement. The losers from adverse selection could have been compensated with enough money to make everyone in the Univer- sity better off.
For social efficiency, however, we care about the source of the cost savings. As noted above, the bulk of the savings, at least initially, came from lower profits. Socially, this reduction in profits is just a transfer from insurance company shareholders to Har- vard (and its employees). There are no efficiency implications of this transfer. Thus, the "first round impact is that society as a whole is worse off by the increase in adverse selection.
There is an important dynamic issue, however. As more employers engage in this type of policy change, it may be that insurers will reduce utilization rather than just profits. Since providers ultimately control the provision of medical services, reducing the amount of care that is provided must involve limiting provider behavior. But this is costly; it involves monitoring provider behavior more carefully, installing new information systems, denying payments, and renegotiating contracts. Indeed, if only one insurer implemented these measures, providers might just avoid that plan entirely. Thus, it is possible that if only some firms push for cost reductions these cost savings measures would not be implemented, but if many firms implement competitive reforms, these changes might make sense. Indeed, some reports have suggested that the overall reduction in premium growth we noted was a result of this type of competitive pressure [Center for the Study of Health Systems Change 19971.
Some evidence on this point comes from the experience of Harvard's internal HMO [HUGHP]. Initially, HUGHP financed its premium reductions in 1995 by drawing down a "wasting fund" the plan maintains to keep premiums below the other grouplstaff

460 QUARTERLY JOURNAL OF ECONOMICS
model HMO. This is analogous to the profit reduction of the other insurers. But more recently, HUGHP has reduced costs enough so that the wasting fund is no longer being depleted. Lower revenues for HUGHP are now matched by lower costs, rather than addi- tional losses.28
The social consequences of these cost savings depend on how they are realized. If the savings come entirely from reduced payments to providers, with no changes in the allocation of resources to the medical sector, they would again be transfers, in this case from medical providers to the rest of society. If the savings come from reductions in resource utilization, in contrast, there will be efficiency implications depending on the value of the services saved relative to their cost. We do not know about the source of the recent cost savings at HUGHP, nor about long-term cost savings for the other insurers serving Harvard, so we cannot provide further evidence on this issue. This is clearly an impor- tant topic for future research.
Our results on insurance market dynamics show that adverse selection is a serious concern. Because of adverse selection, the most generous policy could not be sustained under an equal contribution rule. We estimate the welfare loss from adverse selection at 2 to 4 percent of baseline spending. On the positive side, we estimate that the policy reform reduced the premiums Harvard faced by about 5 to 8 percent. These savings are sufficiently large that the adverse effects of selection could be offset and everyone at the University could be better off. Socially, the first round effects of savings to Harvard appear to be a redistribution from insurer profits more than a net saving in resource utilization. Thus, society is worse off by the adverse selection loss.
One might wonder whether our results about adverse selec- tion are unique to Harvard, or whether they apply to multiple- choice insurance arrangements more generally. While we do not have definitive evidence on this question, we suspect that our findings are quite general. Harvard is not alone in finding difficulty maintaining more generous plans. Stanford University
28. Because some of HUGHP's savings come from cost reductions, the savings are not just a transfer from one part of the University to another, as they would be if they were deficit financed.

461 PAYING FOR HEALTH INSURANCE
and the State of Minnesota, for example, also moved to equal contribution rules and were forced, a few years later to discon- tinue their most generous plans. There is a suggestion in each case that adverse selection was to blame [Royalty and Solomon 1995; Feldman and Dowd 19931. Similarly, the Massachusetts Institute of Technology also moved to an equal contribution rule in the 1980s and was forced in 1997 to discontinue its indemnity policy. Our conversations with officials running the MIT plan suggested that the growing presence of adverse selection was an important factor in this decision. And even in cases where generous insurance options are still available, adverse selection is a concern. Cutler and Zeckhauser [I9971 document the difficulties that the Group Insurance Commission (GIG) of Massachusetts- the Agency that manages insurance for state and local employees in Massachusetts-has had in maintaining an indemnity plan. The GIC subsidizes 85 percent of the additional premium of the indemnity policy, but even with that subsidy, additional steps have had to be taken to limit the costs of the indemnity policy and prevent adverse selection, including switching to a mail-order drug benefit and negotiating more strenuously with hospitals and clinical laboratories. While we have not examined all of these case studies in enough detail to make definite conclusions, all suggest that adverse selection is an important concern, and that it impinges greatly on the feasibility of alternative payment policies.
The question raised by our results is how to realize the gains from competition without the losses from adverse selection. One potential strategy was discussed in Section I: employer payments could be "risk-adjusted to account for the differential selection of employees across plans [Newhouse 1996; Newhouse, Beeuwkes, and Chapman 1996; Cutler and Zeckhauser 19971.
The simplest form of risk adjustment is prospective adjust- ment. Suppose that the employer measures expected spending in each plan at the beginning of the year, using information on the demographic mix of enrollees and their past medical conditions. Then, the employer could vary the payments to plans based on these health status differences. Plans with less healthy enrollees would get more than the average, and plans with healthier enrollees would get less than the average.
For example, Table IV shows that the average enrollee in an HMO is about 20 percent healthier (based on age) than the average enrollee in the PPO. If Harvard implemented an age- based risk-adjustment system, it would reduce its payments to

462 QUARTERLY JOURNAL OF ECONOMICS
the HMOs by 20 percent of average costs and increase its payments to the PPO by 20 percent of average costs. Note that Harvard's contribution would not vary with actual premiums charged, so that insurers would still face the higher demand responsiveness.
If adverse selection were entirely on an age basis, this risk-adjustment system would exactly compensate for nonrandom selection. Plans would perceive their enrollee mix, net of the additional payments, as exactly equal to the average in the group as a whole. Prices would differ across plans only because of efficiency differences and profits. In such a circumstance, indi- vidual choices over their insurance options would be efficient.
The difficulty, however, is if there is selection along dimen- sions not accounted for by the risk-adjustment system. In our example above, suppose that even within a given age group, sicker employees opted into the PPO and healthier employees opted into the HMOs. Then, there would still be adverse selection even after the risk-adjustment system were implemented, and the problems that we noted above might still occur. Of course, an actual risk-adjustment system would be based on medical conditions as well as demographic status, but the problem still remains. As an example, we might have a risk-adjustment system that compen- sates for the share of diabetics in each plan, but if diabetics who know they are a t greatest risk for renal failure opt into the PPO while those who know they are at lower risk opt into the HMOs, the risk-adjustment system will again be imperfect.
An alternative to prospective risk adjustment is retrospective risk adjustment-measuring differences in utilization at the end of the enrollment period and making payment adjustments at that point. For example, Harvard could measure how much insurers spent on care during the year and give additional amounts to plans with above average spending, taking the money from plans with below average spending. If the adjustment were complete, there would be no difference in ex post costs across plans. Each plan could therefore charge an average rate, again with variation only because of efficiency differences and profits.
A related concept to retrospective risk adjustment is reinsur- ance. Suppose that Harvard purchased reinsurance for very high cost medical cases-for example, the amount of spending an individual incurs above $25,000 in a given year. The reinsurance would be financed by reducing payments to all insurers. Then, very high cost cases would not show up differentially in one plan,

463 PAYING FOR HEALTH INSURANCE
and that part of adverse selection would be minimized. Reinsur- ance is likely to be particularly important in the medical care context because medical spending is so skewed. The top 10 percent of medical care users account for nearly 70 percent of total spending [Berk and Monheit 19921. If high cost users differen- tially select into more generous plans, as seems likely, reinsur- ance might offset a great deal of adverse selection.
The weakness of retrospective risk adjustment is relatively obvious, however: it reduces the incentives for plans to monitor utilization carefully. This is true whether risk adjustment is based on all spending or is limited to very high cost cases. Indeed, this is exactly the same problem as when employers subsidize premiums at the margin. In both cases, the incentives for insurers to control costs are blunted.
The choice between prospective and retrospective risk adjust- ment is analogous to the problem of optimal insurance with moral hazard [Arrow 19631. In the optimal insurance context, the goal is to balance risk-sharing and moral hazard. In the risk-adjustment context, the goal is to balance incentives for efficiency and adverse selection. And just as an interior insurance policy (neither full insurance nor self-insurance) is optimal in the health insurance design problem, so too a mix of prospective and retrospective risk adjustment is likely to be optimal in the plan payment situation. For example, Harvard might implement a risk-adjustment sys- tem that makes transfers ex ante on the basis of demographics and health status, and then makes additional payments ex post to partially compensate plans with very high cost users.
A number of unanswered questions about the most appropri- ate risk-adjustment methodology remain, and current methods can account for only a fraction of the predictable variation in medical costs. Still, even an imperfect risk-adjustment system could ameliorate the losses from adverse selection, particularly if it could prevent the elimination of the market for generous insurance.
Harvard has not implemented a risk-adjustment system, although the requirement that premiums for the point-of-service plans be tied to the premiums for the underlying HMO is a limited form of risk adjustment. Indeed, most employers that have moved to competitive pricing systems have not implemented risk adjust- ment. One might wonder why this is the case if risk adjustment is so valuable. We do not have a complete answer to this puzzle, but there are several possibilities. One potential reason may be

464 QUARTERLY JOURNAL OF ECONOMICS
adverse selection. Employers that fear attracting or differentially retaining high cost employees may want to raise the price of more expensive insurance above its actuarial This equilibrium would not be efficient, since high risk people would not get full insurance even though they might value additional coverage more than it costs. A second explanation is the magnitude of the change involved. Moving to an equal contribution rule and implementing risk adjustment both involve substantial internal costs; firms may prefer to do only one a t a time. At Harvard, for example, there was some discussion of implementing a risk-adjustment system after the equal contribution rule was in place. Risk adjustment may also change the distribution of employer and employee costs for health insurance. Implementing risk adjustment generally raises the cost of less expensive plans while lowering the cost of more expensive plans. If employers cannot vary their contribution rate at will (as in many unionized settings), implementing risk adjust- ment could lead to undesirable changes in employer or employee payments.
Since risk adjustment has rarely been tried, we do not know the optimal combination of prospective and retrospective risk adjustment in designing a choice-based insurance system. Design- ing appropriate risk-adjustment systems is essential, however, if social insurance programs are to become more competitive. Imple- menting a system of Medicare vouchers, we suspect, would raise the same issues as came up a t Harvard. So too would a privatized Social Security system where individuals are left to purchase annuities in a private market. Some risk-adjustment mechanism must be found to minimize adverse selection, or we will forgo a large part of the potential gains from market reform of social insurance programs.
Aaron, Henry, and Robert Reischauer, "The Medicare Reform Debate: What Is the Next Step?"Health Affairs, XIV (Winter 1995), 8-30.
Advisory Council on Social Security, Report of the 199P96Advisory Council on Social Security, Volume I: Findings and Recommendations (Washington, DC: GPO, 1996).
29. We have no evidence that Harvard considered this factor, but other employers might.

PAYING FOR HEALTH INSURANCE 465
Arrow, Kenneth, "Uncertainty and the Welfare Economics of Medical Care," American Economic Review, LIII (1963), 941-969.
Berk, Mark L., and Alan C. Monheit, "The Concentration of Health Expenditures: An Update,"HealthAffairs, XI (Winter 1992),145-149.
Brown, R. S., et al., The Medicare Risk Program for HMOs-Final Summary Report on Findings from the Evaluation, Final Report under HCFA Contract Number 500-88-0006 (Princeton, NJ: Mathematica Policy Research, Inc., 1993).
Buchmueller, Thomas C., and Paul J . Feldstein, "Consumers' Sensitivity to Health Plan Premiums: Evidence from a Natural Exoeriment in California." Health
~ongressional Budget Office, "The Effects of Managed Care on Use and Costs of Health Services," mimeo, June 1992.
Cutler. David M.. "Restructurinn Medicare for the Future," in Robert Reischauer, ed., Setting ~ a t i o n a l ~rioriTies(Washington, DC: ~ h 6 Brookings ~nstitution; 1996).
Cutler, David M., and Richard J. Zeckhauser, "Adverse Selection in Health Insurance," NBER Working Paper No. 6107, July 1997.
Dowd, Bryan, and Roger Feldman, "Premium Elasticities of Health Plan Choice," Inquiry, XXXI (Winter 199415),438444.
Farley, Pamela, and Gail Wilensky, "Household Wealth and Health Insurance as Protection against Medical Risks." in Martin David and Timothv Smeedinn. eds., ~ o r i z o ~ t a lEquity, Uncertainty, and Economic ~ e l l - ~ e i i ~(chicago: University of Chicago Press, 1984), pp. 323-354.
Feldman, Roger, "The Welfare Economics of a Health Plan Merger," Journal of Regulatory Economics, VI (1994),67-86.
Feldman, Roger, and Bryan Dowd, "The Effectiveness of Managed Competition: Results from a Natural Experiment," Institute for Health Services Research, University of Minnesota, April 6,1993.
Feldman, Roger, Michael Finch, Bryan Dowd, and Steven Cassou, "The Demand for Employment-Based Health Insurance Plans," Journal of Human Re- sources, XXIV (Winter 1989),115-142.
Feldstein, Martin, "The Missing Piece in Policy Analysis: Social Security Reform," American Economic Reuiew, LXXXVI (May 1996),1-14.
Friedman, Benjamin, and Mark Warshawsky, "Annuity Prices and Saving Behav- ior in the United States," in Zvi Bodie, John Shoven, and David Wise, eds., Pensions in the U. S . Economy (Chicago: University of Chicago Press, 19881, pp. 53-77.
Friedman, Benjamin, and Mark Warshawsky, "The Cost ofhnuit ies: Implications for Saving Behavior and Bequests," Quarterly Journal of Economics, CV (February 1990), 135-154.
Hill, Stephen C., and Barbara Wolfe, "Testing the HMO Competitive Strategy: An Analysis of Success and Failure in Wisconsin," Journal of Health Economics, XVI (1997), 261-286.
Holmer, Martin, "Tax Policy and the Demand for Health Insurance," Journal of Health Economics, I11 (December 19841,203-221.
Miller, Robert, and Harold Luft, "Managed Care Plan Performance Since 1980," Journal of the American Medical Association, CCIXXI (191, (May 18, 19941, 1512-1519.
Mitchell, Olivia S., James M. Poterba, and Mark J . Warshawsky, "New Evidence on the Money's Worth of Individual Annuities," MIT mimeo, 1997.
Newhouse, Joseph P., "Reimbursing Health Plans and Health Providers: Efficiency in Production versus Selection," Journal of Economic Literature, XXXIV (September 1996), 1236-1263.
Newhouse, Joseph P., Melinda Beeuwkes, and John D. Chapman, "Risk Adjust- ment and Medicare,"Harvard University mimeo, 1996.
Newhouse, Joseph P., and the Insurance Experiment Group, Free For All? Lessons From the Rand Health Insurance Experiment (Cambridge, M A : Harvard University Press, 1993).

466 QUARTERLY JOURNAL OF ECONOMICS
Phelps, Charles E., "Large-Scale Tax Reform: The Example of Employee-Paid Health Insurance Premiums," University of Rochester Center for Economic Research Working Paper, No. 37,1986.
Price, James R., and James W. Mays, "Biased Selection in the Federal Employees Health Benefits Program," Inquiry, XXII (Spring 1985),67-77.
Reber, Sarah J., "Does Price Matter? An Analysis of Harvard Employees' Health Insurance Decisions Under Managed Competition," senior thesis Harvard University, 1996.
Riley, Gerald, Cynthia Tudor, Yen-pin Chiang, and Melvin Ingber, "Health Status of Medicare Enrollees in HMOs and Fee-for-Service in 1994," Health Care Financing Review, XVII (Summer 1996),65-76.
Royalty, Anne Beeson, and Neil Soloman, "Health Plan Choice: Price Elasticities in a Managed Competition Setting," Stanford University, October 1995.
Scheckler, William E., and Rockwell Schulz, "Rapid Change to HMO Systems: Profile of Dane County, Wisconsin, Experience," Journal of Family Practice, XXIV (1987), 417-424.
Small, Kenneth A., and Harvey S. Rosen, "Applied Welfare Economics with Discrete Choice Models,"Econometrica, XLM (19811, 105-130.
Taylor, Amy, and Gail Wilensky, "The Effect of Tax Policies on Expenditures for Private Health Insurance," in Jack A. Meyer, ed., Market Reforms in Health Care: Current Issues, New Directions, Strategic Decisions (Washington, DC: American Enterprise Institute, 1983).
Trajtenberg, Manuel, "The Welfare Analysis of Product Innovations, with an Application to Computed Tomography Scanners," Journal ofPolitica1 Economy, XCVII (1989), 444-479.
Welch, W. Pete, "The Elasticity of Demand for Health Maintenance Organiza- tions,"Journal ofHuman Resources, XXI (Spring 1986), 252-266.