Embed Size (px)
Citation preview

1
The Deer Hunter:
Moral Hazard of Gaming Regulations∗
Michael Conlin Michigan State University
Stacy Dickert-Conlin
Michigan State University
John Pepper University of Virginia
February 2006
Abstract
Pennsylvania hunting laws designed to control the population of deer in the state provide a unique empirical test of moral hazard. By allowing hunters to harvest both bucks and does at the same time, the law provides insurance against harvesting the wrong type of deer. This lowers the marginal cost of taking a shot at a potential deer and therefore increases the probability of accidentally shooting a person. We find evidence that allowing hunters to harvest both bucks and does increases the probability of accidentally shooting another hunter. In contrast, we find no evidence that these laws increase the probability of an accident that is unrelated to accidental shootings of another person. Further, laws passed in 2002 increased the marginal cost of taking a shot at a potential deer by restricting buck harvests to those with a minimum of three or four points on one antler. In counties with the higher restriction of four points, the probability of an accident related to mistaking another hunter as game decreases dramatically and at statistically significant levels. There is no such change in the probability of an accident that is unrelated to accidentally shooting another person. Together, this evidence suggests that the laws designed to control the deer population had an unintended effect on safety. JEL Classification: D81, J28, K32
∗ Acknowledgments: For providing the data, we are indebted to Chris Rosenberry, Dennis Neideigh, Dwayne Carson, Roger Cooke, Keith Snyder and Cheryl Baker at the Pennsylvania Game Commission. We are especially grateful to Chris Rosenberry for providing institutional information and detailed comments on an early draft of this paper. Many thanks to Dick Dickert who answered question after question about hunting in Pennsylvania at his hunting “camp” in western Pennsylvania.

2
I. INTRODUCTION
Each year over ten million individuals devote millions of hours hunting deer and spend
an estimated $10 billion on hunting related equipment and activities.1 Hunting regulations serve
to balance this demand against both the ecosystem impacts of deer and the safety of hunters.
Regulated hunting is an effective method available for managing and maintaining wild deer
populations. 2 At the same time, regulations designed to manage herd size may have unintended
effects on hunter safety. A moral hazard arises in that changing the probability of violating
harvesting regulations may change the probability of mistaking another person as game.
In this paper, we assess the moral hazard problem by considering the unintended effect
on safety of hunting laws enacted to control and manipulate the deer population. The first law of
interest allows licensed hunters to harvest (that is, shoot) both bucks and does on the same days
during the hunting season. The freedom to shoot at both bucks and does provides insurance
against accidentally shooting the “wrong” kind of deer. A second law with potential for creating
moral hazard is the minimum antler requirement for legally harvesting bucks, which decreases
the insurance associated with shooting the “wrong” kind of deer. A moral hazard may arise in
that changing the probability of making a mistake may change the probability of shooting at all,
which may in turn change the probability of hunting related accidents.3
1 See U.S. Department of the Interior, Fish and Wildlife Service, U.S. Department of Commerce and U.S. Census Bureau (2001) for further details. 2 Deer have few natural predators, and other sources of mortality (e.g., diseases, injuries) are not sufficient to control populations. Gaming commissions use hunters to regulate the deer population. 3 In the broader literature, labor markets are the setting for many of the empirical test of moral hazard. Using differences in contractual arrangements, this literature finds evidence of moral hazard by physicians (Gaynor and Gertler, 1995), farmers (Foster and Rosenzweig, 1994), and professional football players (Conlin and Emerson, 2003). An additional set of empirical evidence of moral hazard is found in response to prescription drug insurance (Coulson, Terza, Neslusan and Stuart, 1995), thrifts’ deposit insurance (Grossman, 1992), and automobile insurance (Cohen and Dehejia, 2004). Hubbard (1998) even finds evidence of moral hazard in the vehicle inspection market. Cohen and Einav (2003), in contrast, find no evidence that seat belt use increases reckless driving.

3
To assess this moral hazard, we rely on a unique panel dataset of hunting accidents in
Pennsylvania counties from 1990 through 2002.4 Pennsylvania provides an ideal area for
studying the impact of hunting regulation on accidents. The state has more deer hunters (over
900,000) and the largest proportion of deer hunters (9%) than any other (U.S. Department of
Interior, 2004). Moreover, over the 13-year period covered by the panel, hunting regulations
varied over time and across counties.
After describing the institutional details and data in Sections II and III, we then turn to
the empirical model and results in Section IV. Here, we exploit these discrete policy changes to
consider whether the probability of a hunting accident varies with restrictions on what types of
deer can be harvested. In particular, we assess whether the probability of an accident: (i)
increases when hunters are allowed to harvest both bucks and does compared to either only
bucks or only does; and (ii) decreases when more stringent antler requirements are imposed
when harvesting a buck.
To evaluate the moral hazard that may arise when hunters use less care in assessing the
specific type of game they aim to kill, we use the detailed accident information provided by the
Pennsylvania Game Commission. We distinguish between accidents that are the result of the
injured person being mistaken as game and those that occur for other reasons (for example, self-
inflicted wounds). This distinction between what we term related and unrelated accidents is key
to our identification of the effects of the regulations. Accidents due to the mistaken identity of
the victim are arguably associated with the care hunters take in deciding whether to fire a rifle.
When only bucks or only does can be harvested, the hunter incurs a marginal cost from failing to 4 Between 2002 and 2003, the Pennsylvania Game Commission changed the geographic designations from which they collected data from county to Wildlife Management Units: resulting in post-2002 data not being comparable to the pre-2003 data.

4
distinguish a buck from a doe. Eliminating this marginal cost may lead hunters to take less care,
which may result in a higher number of accidents due to mistaken identity. Similarly, when
hunters can harvest only bucks that satisfy stringent antler requirements, this increases the
marginal cost from failing to distinguish between bucks with different size antlers. In contrast,
we do not expect these regulations designed to manage the herd size and composition to be
correlated with accidents that are unrelated to moral hazard.
Gaming laws in Pennsylvania provide a clear empirical setting in which to assess the
extent of moral hazard. Still, one might not expect to find any noticeable effect of these
regulations on hunting accidents. After all, accidents are rare events (in general, less than 25 per
hunting season) by which to measure changes in behavior and the probability of being caught
violating a restriction is often quite small. Despite these concerns, we find compelling evidence
that hunters react to changes in the probability of violating gaming regulations consistent with
moral hazard. In particular, our results suggest that allowing both bucks and does to be harvested
had the unintended consequence of increasing the probability of a related accident, while the
more stringent antler restrictions decreases this probability. At the same time, we find these laws
had a negligible impact on the probability of an unrelated accident.
II. Institutional Details
In 1721, the Pennsylvania House of Representatives passed the nation's first game laws to
protect the whitetail deer. Today, Pennsylvania deer hunting laws restrict the types of game that
can be harvested on particular days with particular weaponry. We focus on the deer hunting with

5
rifles that occurs in the three-week period starting the Monday after Thanksgiving.5 During this
period, regulations restricting the types of deer that can be harvested by licensed hunters vary by
day, by county and by the age of the hunter. While the basics have remained stable for some
time, the particulars have varied.
Table 1 summarizes the Pennsylvanian deer hunting regulations from 1990 to 2002. Prior
to 1998, only bucks could be harvested throughout Pennsylvania the first two weeks after
Thanksgiving (referred to as “buck season”).6 After these twelve days, there were three days
where hunters could harvest only does (referred to as “doe season”).7 From 1998 to 2000, these
same rules applied for hunters ranging from age 16 to age 65, but young and senior hunters could
harvest both bucks and does for some parts of the “buck season”. In 2000, the Pennsylvania
Game Commission allowed all hunters to hunt both bucks and does the last day of “buck season”
and allowed only two subsequent days for hunters to harvest only does. Post-2000, all hunters
could harvest both bucks and does throughout the entire twelve-day hunting season.
When harvesting bucks, there are antler restrictions. In all years prior to 2002, the
Pennsylvania Game Commission required at least one of the buck’s antlers to have a minimum
of two points, a very minimal restriction in that most antlered bucks satisfy this antler
requirement.8 In 2002, the game commission imposed more stringent antler requirements. Ten
counties required a minimum of four-points on at least one antler and the other 51 counties
required a minimum of three-points on at least one antler.
5 This is the primary deer-hunting season where the large majority of deer are harvested. 6 To be precise, “buck season” is when only deer with antlers can be harvested and “doe season” is when only anterless deer can be harvested. Very young bucks do not have antlers and can therefore be harvested in “Doe” season. 7 The Pennsylvania Game Commission prohibited hunting on Sundays. 8 A 2001 sampling done by the Pennsylvania Game Commission suggests that 75 to 80 percent of all bucks (including antlerless bucks) satisfy this two point requirement.

6
These deer hunting regulations are enforced by the Pennsylvania Gaming Commission,
which employs a force comprised of approximately 200 full-time Wildlife Conservation Officers
and close to 700 Deputy Officers. In addition to assisting in wildlife research and education
projects, officers enforce hunting and trapping laws and investigate hunting accidents. An
officer's area of responsibility is about 350 square miles (Pennsylvania Gaming Commission,
2006). As with most policing, effective enforcement strategies often involve engaging concerned
citizens, and the Game Commission actively encourages hunter participation in monitoring and
reporting violations. Hunters are asked to report violations to gaming officers, a toll-free phone
line is devoted to citizen reporting, and in some cases rewards are offered for relevant
information.9
To effectively manage and enforce the gaming regulations, the Commission requires
hunters to obtain a general hunting license to harvest antlered deer during the season, and a
different county-specific license to take an antlerless deer.10 Each licensed hunter is provided
with the Pennsylvania Hunting Digest (Pennsylvania Game Commission, 1990-2003) that
describes the procedures and penalties for violating a gaming restriction. Hunters killing a
protected deer are required deliver the carcass to the gaming commission and to provide a
written statement about the violation. An officer then determines whether the kill was an 9 The 2002 Pennsylvania Hunter Digest has a section entitled “Reporting a Violation” which provides a “Violation Report Form” and states: “Immediately after witnessing a suspected violation, note as many details as possible. The more information you provide, the faster a violator may be caught and prosecuted. Transmit this information to the Commission region office serving your area as quickly as possible… Gather as much information as possible about the suspect: an accurate physical description and any other pertinent information. If possible, get a hunting license number. Try to secure names and addresses of other witnesses, and any information they may have about the violation or suspect.” For an example of a case prosecuted based on citizen reporting, see http://www.pgc.state.pa.us/pgc/cwp/view.asp?A=11&Q=155522 . 10 The price of a hunting license for an adult increased from $12.75 in 1990 to $20 in 2002. The price of a doe license for an adult increased from $5.50 in 1990 to $6 in 2002. The Pennsylvania Game Commission allocates to each county a certain number of doe licenses per season. These doe licenses are allocated through a lottery and, if all licenses are not purchased through this lottery, hunters may purchase a second doe license.
7
accident, in which case the penalty is nominal (for example, $25 in 2003), or a result of
carelessness, in which case the penalty can be substantial (for example, a minimum of $500 in
2003). Likewise, failing to report a violation can lead to a substantial fine (for example., a
minimum of $500 in 2003). Notice that in addition to the fine, hunters who violate these
regulations must also incur the cost of transporting the entire carcass to a Game Commission
officer.11
Each year, the Game Commission issues thousands of citations and warnings. During
calendar year 2003, for example, the Game Commission prosecuted 8,333 cases and issued
12,532 warnings (Pennsylvania Game Commission, 2004). A total of $1,540,444 in penalties
was assessed, averaging $184.86 per violation. Many of the citations involve violations of the
management restrictions focused on this paper. For example, in 2003 Conservation Officers
handled 2,096 mistaken kills of antlered deer, of which 2,050 resulted in hunters paying a $25
administrative fee and surrendering the antlers. Of the remaining 46 cases, the Officers rejected
the mistake kill claims and issued a $500 fine.
III. Data
To identify the effects of regulations on accidents, we require detailed information on
hunting related accidents. The Hunter-Trapper Education Division of the Pennsylvania Game
Commission has a detailed description of each reported hunting accident that occurred in
Pennsylvania from 1990 through 2002. Using these descriptions, we assemble a unique panel of
hunting accidents from 1990 through 2002 for 61 of the 67 counties in Pennsylvania. The six
11 The carcass often weighs well over 100 pounds and the game commission office could be many miles from the kill.

8
“Special Regulation” counties in the Philadelphia and Pittsburgh metropolitan areas, which have
different regulations and different available information, are excluded from our empirical
analysis. For each accident, we observe the date and county of the incident. Thus, we have
outcome data on whether there was a hunting accident for all 11,468 county-days of rifle deer
hunting season during the 13-year period from 1990 to 2002.
We further disaggregate this accident data using information on the cause of each
accident. To help assess whether accident rates are sensitive to the moral hazard resulting from
gaming regulations, that is, occur because hunters take less care to distinguish their prey, we
create two outcome variables for each county-day: accidents related and unrelated to moral
hazard. Related accidents include those not self-inflicted and reportedly caused when the
“Victim is shot as game,” as well as those caused by “a ricochet”, “a stray bullet” or because “the
victim was in the line of fire.” These accident classifications are those most likely provided by
hunters who have accidentally shot another person as game.12,13 Of the 121 accidents classified
as related, 17 indicate the cause to be shot as game, 18 indicate a ricochet, 18 indicate a stray
bullet, and 68 indicate that victim was in line of fire. Self-inflicted and all other accident causes
are classified as unrelated to the moral hazard issue. The causes stated for these unrelated
accidents include “sports arm in dangerous position”, “unintentional discharge”, “hunter slipped
or fell”, “hunter dropped sports arm”, “sports arm defective”, “used sports arm as club”, and
“other”. These unrelated accidents generally occur from careless handling of the rifle, as opposed
to related accidents that occur because of mistaken identity.
12 For legal reasons, hunters may not have incentive to truthfully reveal that the accident was due to the victim being mistaken as game. 13 We find similar results when related accidents is defined as either victim in line of fire or shot as game (not a ricochet or a stray bullet).

9
Table 2 reveals the means and standard deviations for the variables used in this study. As
expected, the probability of a county having a reported hunting accident on a given day is quite
low. The fraction of county-days where an accident related to moral hazard occurs is 0.011
while the fraction with an accident unrelated to moral hazard is 0.015.14
Figure 1 depicts the total number of related and unrelated accidents by year from 1990
through 2002. For both types of accidents, the total number appears to trend downward across
years. Given our question of interest, the accident rates in 2000-2002 are the most notable
feature of the figure. In 2000, concurrent with allowing all hunters to harvest both bucks and
does on certain days, there is a qualitative shift in the ordering of related and unrelated accident
rates, with the number of related accidents exceeding the number of unrelated accidents. This
shift, however, is short lived. By 2002, following the changes to the antler requirements, the
number of unrelated accidents exceeds the number of related accidents.
The key independent variables that pertain to moral hazard are antler restrictions and the
types of deer (that is, bucks and/or does) that can be harvested by the age of the hunter
(youth/senior or all). The summary statistics in Table 2 reveal the fraction of county-days under
each regime. Over the 13-year period, hunters could legally harvest only bucks in 61.7 percent
of county-days and only does in 17.0 percent. For 8.0 percent of the county-days, youth and
seniors could harvest both bucks and does.15 In the remaining 13.3 percent of the county-days,
14 No county-day has more than one related accident and six county-days have more than one unrelated accident occur. In all six cases, there were two unrelated accidents that occur. 15 The accident data identify whether the perpetrator is a youth, adult or senior. Of the 33 (39) related (unrelated) accidents attributable to a youth or senior, five (four) occurred on days when both bucks and does can be harvested. The fact that 15% of the related accidents, while only 10% of the unrelated accidents, occur on these days is consistent with moral hazard. Unfortunately, due to the minimal number of these accidents, we could not estimate an analogous specification to the bivariate probit models presented in Section IV.

10
all hunters can harvest both bucks and does.16 Antler restrictions beyond two points were in
place in 2002, resulting in 93.6 percent of the county-days having a minimum antler requirement
of two points.
While the panel data allow us to control for county-specific factors that are fixed over
time, other factors that may vary over time can confound any observed association between
gaming regulations and accident rates. In particular, we include an indicator variable that
accounts for the only law change specifically related to safety between 1990 and 2002.
Beginning in 1991, hunters are required to wear at least 250 square inches of fluorescent orange
clothing. There was no clothing requirement in 1990.
We also account for specific trends in hunting, including the average daily number of
hunters, the congestion of the hunting area, and the number of shots taken.
The Wildlife Management Division of the Pennsylvania Game Commission estimates the
number of hunter-days (total number of days spent hunting deer for all hunters). These measures
are annual, not daily, county-level counts.17 We take these annual counts for each county and
divide them by the number of hunting days in the season to obtain the average daily number of
hunters per county. To account for days that might be particularly populated, we control for
whether the day is the first day of the hunting season, whether the day was the first or second
Saturday of hunting season, whether the day is the first day (Monday) of “doe season”, and the
number of days since the start of hunting season.
16 For related (unrelated) accidents, one (five) of the 15 (27) in 1998 and 1999 occurred on the two Saturdays of “buck season” where youth and seniors could harvest both bucks and does. In 2000, five of the eleven related accidents and only one of the seven unrelated accidents occurred on the last day of “buck season” when all hunters could harvest both bucks and does. 17 The annual number of hunter-days includes hunting during the three-week period starting the Monday after Thanksgiving as well as during the muzzleloader, flintlock and archery seasons. Well over ninety percent of the hunter-days occur during the three week period immediately after Thanksgiving.
11
While the average daily number of hunters per county is 8,136, this average has trended
upward across years with a significant increase in 2000 and 2001 (See Table 2 and Figure 2.)
This increase reflects the shorter hunting season (14 and 12 days compared to 15 days), not an
increase in the total number of hunters in the season. In fact, the total numbers of hunter-days are
actually less in 2001 and 2002 than in any other year.
In addition to accounting for the average daily number of hunters, we also divide average
daily number of hunters by square miles of forested land for each county-year to construct a
hunter congestion measure.18 Arguably, the impact of regulations on related accidents is
sensitive to the degree of hunter congestion. At the most basic level, the numbers of hunters who
can be mistaken as game increase with the level of congestion. Moreover, if citizens serve to
monitor and report on mistaken kills, one might expect the probability of a violation being
reported to be greater in more congested areas. This would result in the effect of the regulations
to be greater in more congested areas.
Along with accounting for the number of hunters, we also want some measure of the
number of shots being fired per day. As with hunter-days, we have county-level information on
the numbers of bucks and does harvested each year and, therefore, divide these number by the
number of hunting days in the season to obtain average daily harvests at the county level. We
proxy for shots taken in a day using these average daily harvests of bucks and does as well as the
overall deer population.19 Table 2 reveals an average herd size of nearly 14,000 per county and
18 The Wildlife Management Division provided the forested land data obtained from United State Forest Service Surveys. Our basic findings do not change when the congestion measure is based on acres of gamelands and acres of gamelands excluding farmland. 19 The Wildlife Management Division estimates county-year harvests based on those who report a kill as well as game commission checks of butcher shops and hunting camps. At the end of each hunting season, the Wildlife Management Division estimates deer population for each county using a model of reproductive rates and accounting

12
average daily numbers of bucks and does harvested in a county of 189.4 and 256.7, respectively.
Figure 3 displays the average daily harvests of bucks and does for each year from 1990-2002.
The law change that allowed the harvesting of both bucks and does is contemporaneous with a
dramatic increase in daily doe harvests. Not only were the daily doe harvests greater in the later
years but the total number of doe harvested was also greater. While the daily buck harvest
trended slightly upward prior to 2001, it increased in 2001 when the concurrent seasons were
introduced and then decreased in 2002 when more stringent antler requirements were put into
effect. As for the total buck harvest in a season, it was almost identical in 2001 as in 2000 and
decreased dramatically from 2001 to 2002.
IV. EMPIRICAL EVIDENCE
To evaluate whether the observed relationships between hunting regulations and
accidents found in Figure 1 are sensitive to other confounding factors, we estimate a series of
bivariate probit models that account for observed and unobserved county-specific characteristics.
In Section 4.A, we outline the basic fixed effect model that explicitly accounts for county-
specific factors that may be related to both gaming regulations and accident rates. In Section 4.B,
we present and discuss the estimates.
for the number and type (both gender and age) of deer harvested. The trend in the deer population is slightly increasing across years.

13
4.A Model
To assess whether hunting accidents are sensitive to gaming regulations aimed at
managing the deer population, let the latent variables, y1id* and y2id*, represent the care hunters
in county i on day d take in shooting and maintaining their weaponry, respectively. Let
yrid* = Zidβr + Xidθr +αri + νrid for r =1,2,
where Z is a vector of indicator variables reflecting the different regulation regimes, X is a vector
of other observed covariates and (β,θ) are unknown parameters. To account for county-specific,
time invariant unobservables that may affect the care in shooting and maintaining their
weaponry, we include county-specific fixed effects (αri). These county-specific effects capture
such things as the number of experienced hunters that hunt annually in a given county and the
hunter education program in the county. Finally, the unobserved random variable, νrid, is
assumed to be standard normally distributed conditional on the regressors. We allow ν1id to be
correlated with ν2id.
The vector Z includes five distinct indicators of different policy regimes, which include:
A dummy equal to one if a minimum of four points is required on at least one antler, a dummy
equal to one if the minimum is three points, a dummy equal to one if only youth and seniors can
harvest both bucks and does, a dummy that equals 1 if all hunters can harvest both bucks and
does, and a dummy that equals 1 if hunters can harvest only does. The excluded categories are
two point bucks and periods where all hunters can harvest only bucks. The vector Xid includes
measures of the deer population, the daily numbers of bucks and does harvested, daily number of
hunters, our measure of congestion, a set of indicator variables identifying whether it was the
first Saturday, second Saturday, first day of the hunting season or first day of “doe season”, the

14
number of days from the start of the hunting season, an indicator variable identifying whether
hunters must wear 250 square inches of fluorescent orange clothing, and year (to capture trends
in accidents over time).
Although the latent measures of hunter care in shooting and maintaining are unobserved,
we do observe whether there is an accident in county i on day d. Let y1id =1 if there was a related
accident in county i on day d (y1id =0 otherwise) and y2id =1 if there was an unrelated accident in
county i on day d (y2id =0 otherwise). Assume the following bivariate probit model:
y1id = 1 if y1id* > 0 and = 0 if y1id* < 0 y2id = 1 if y2id* > 0 and = 0 if y2id* < 0.
We estimate the parameters (βr, θr, and αri) using maximum likelihood estimation. In our basic
specification, we assume the impact of gaming regulations is the same in all counties across all
times. We also present results from a model that interacts the measure of congestion with
whether a hunter can harvest both bucks and does as well as with the point restriction. As
discussed in Section III, we expect the probability of a related accident to: (i) increase more in
the highly congested areas as the result of hunters being able to harvest both bucks and does; and
(ii) decrease more in the highly congested areas as the result of more stringent antler
requirements.
4.B Results
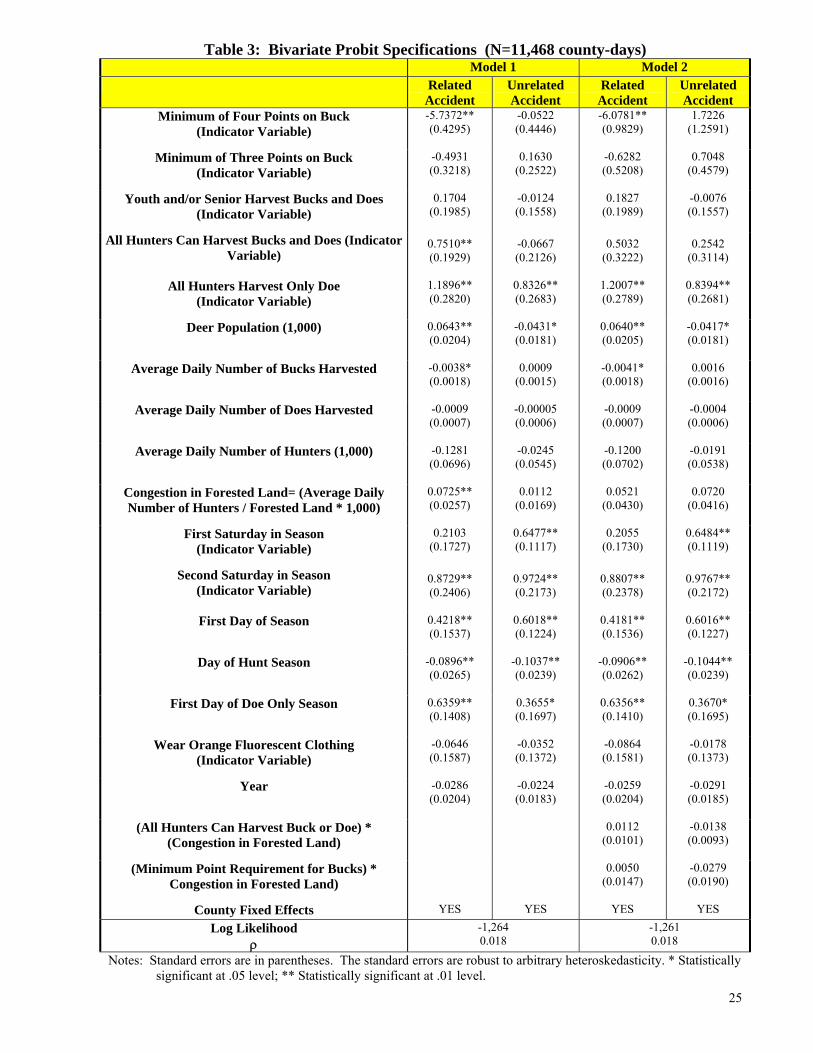
The first two columns in Table 3 (Model 1) contain the coefficient estimates associated
with the basic bivariate probit. For related accidents, the negative (-5.7372) and statistically
significant (s.e. = 0.4295) coefficient on the variable indicating a four point antler requirement

15
and the positive (0.7510) and statistically significant (s.e. = 0.1929) coefficient on the variable
indicating adults can harvest both bucks and does are consistent with moral hazard resulting in
additional accidents. Likewise, the positive estimates on the variable indicating that youth and
seniors can hunt both bucks and does and the negative estimate on the three point antler
restriction also lend support to the influence of moral hazard, although both of these estimates
are statistically insignificant at the 5 percent level. In contrast, Column 2 shows that we find no
economic or statistically significant effect of these policy changes on the probability of an
unrelated accident. In fact, we can reject the nulls that the coefficients associated with the four
point requirement and harvesting both bucks and does are equal for the related and unrelated
probits. Apparently, these regulations impact the probability of mistaking other hunters for
game, but have no such effect on other types of hunting related accidents.
To give some content to these findings, it is useful to compare the predicted probability
of a related accident with and without the particular restriction. To do this, we compute the
estimate of the accident probability with and without the regulation of interest for each county-
day, holding fixed all other covariate values. The average estimated probability of a related
accident decreases from 0.011 to almost zero when the antler requirement increases from two to
four points. Likewise, the accident probability increases from 0.009 to 0.041 when all hunters
are allowed to harvest both bucks and does during the same period. This probability increase
suggests that the expected annual number of related accidents would have increased from 10 to
25.8 if both bucks and does could have been harvested during the 1990 through 1999 hunting
16
seasons.20 The fact that approximately 15 percent of these related accidents are fatal, suggests
that allowing hunters to harvest both bucks and does throughout the 1990s would increase the
expected number of hunting deaths from 14.2 to 36.6. In contrast, as noted above, there is no
appreciable change in the estimate probability of an unrelated accident for either of these two
policy regimes.
One notable result in Table 3 is the positive coefficient estimate associated with the
variable indicating hunters can legally harvest only does. All else equal, one would not expect
the care a hunter takes to depend on whether he can harvest only bucks or only does. If all else
were equal, we would expect the coefficient associated with the doe only variable to be zero.
Note, however, that the expected probability of both related and unrelated accidents is higher on
days when all hunters can harvest only doe compared to only buck. Moreover, we cannot reject
that these two coefficients are equal at the 10 percent significance level.
Thus, there appears to be something about the doe only season that leads to higher rates
of both related and unrelated accidents. In particular, these results would seem to reflect the
limitations of our measures of hunting activity. From 1990 through 1999, nearly all doe hunting
occurred during the last few days of the season. During this three-day doe season, more deer are
harvested than during the two-week buck season. Not only are more deer harvested during these
three days than in the two-week buck season, but it seems possible that the types of hunters may
differ across the seasons.21 In any case, it seems likely that the level of congestion and the
number of shots fired varies across the buck only and doe only seasons. Our measures of the
20 This change in the expected number of related accidents is based on the assumption that no other policy change occurred during this period and that the harvests as well as the number of hunters would not change as the result of these policy changes. 21 For example, to the extent that hunters interested in harvesting a single deer for venison, those left hunting during the final three days may be less skilled than those who were successful during the buck season.

17
number of hunters, congestion, and harvests, however, are based on annual, not daily, data.
Thus, the coefficient on the doe only regulation variable may simply reflect the greater number
of hunters and shots fired during the doe season.
In fact, other coefficient estimates point to the importance of specific periods in the
hunting season and generally support the notion that more accidents occur when there are more
hunters. Specifically, the probabilities of both a related and unrelated accidents increases on the
first and second Saturday of the hunting season, the first day of hunting season, the first day of
doe only season and falls across days of the season.22 In addition, the positive coefficient
associated with our congestion measure in the related accidents probit suggests that the
probability of an accident increases with congestion. Interestingly, the probabilities of a related
and unrelated accident do not appear to increase with the number of deer harvested. However,
the probability if a related accident appears to increase while the probability of an unrelated
accident appears to decrease with estimated deer population.
To further assess the result, we consider whether the impacts of the regulations are
sensitive to the level of hunter congestion. As explained in Section III, due to the increase in
targets that can be mistaken as deer and the increase in enforcement, we expect the effect of the
regulations on related accidents to be greater in more congested areas. To test these hypotheses,
we add interactions of the congestion measure with the indicator variable for whether hunters can
harvest both bucks and does as well as with the point requirement.23 The estimates of this
specification (Model 2 in Table 3) show the positive effect of allowing bucks and does to be
22 The coefficient on the First Saturday in the season is positive for both unrelated and related accidents and statistically significant for unrelated accidents. 23 The bivariate probit model does not converge if we include interactions between our congestion measure and the individual antler restriction indicator variables.

18
harvested on related accidents is greater in areas more densely populated with hunters. Because
the coefficient is not statistically significant, it provides only minimal support that the effect on
the probability of a related accident of allowing both bucks and does to be harvested is greater in
more congested areas. As for the minimum point requirement for a buck, the results suggest that
the effect of changing this requirement on related accidents does not depend on the congestion in
the area.
III. CONCLUSION
Pennsylvania hunting laws designed to control the population of deer in the state provide
a unique empirical test of moral hazard. By allowing hunters to harvest both bucks and does at
the same time, the law provides insurance against harvesting the wrong type of deer. This lowers
the marginal cost of taking a shot at a potential deer and therefore increases the probability of
accidentally shooting a person. We find evidence that these laws increased the probability of
accidents that are likely to be related to accidental shootings of other hunters. In contrast, we
find no statistical evidence that these laws increased the probability of an accident that is
unrelated to accidental shootings of another person. Further, laws passed in 2002 increased the
marginal cost of taking a shot at a potential deer by restricting buck harvests to those with a
minimum of three or four points on one antler. In counties with the higher restriction of four
points, the probability of a related accident decreased dramatically and at statistically significant
levels. There is no such change in the probability of an accident that is unrelated to accidentally
shooting another person. Together, this evidence suggests that the laws designed to control the
deer population had an unintended effect on safety. In terms of magnitudes, the expected total

19
number of related accidents during the 1990 through 1999 hunting seasons would increase from
100 to 258 if both bucks and does could have been harvested and, thereby, increase the expected
number of hunting deaths by approximately 22.

20
REFERENCES Cohen, Alma and Rajeev Dehejia (2003). “The Effects of Automobile Insurance and Accident Liability
Laws on Traffic Fatalities”, Journal of Law and Economics, v47: 357-393. Cohen, Alma and Liran Einav (2003). “The Effects of Mandatory Seat Belt Laws on Driving Behavior
and Traffic Fatalities”, The Review of Economics and Statistics, v85: 828-843. Conlin, Michael and Patrick M. Emerson (2003). “Multi-Dimensional Separating Equilibrium and Moral
Hazard: An Empirical Study of National Football League Contract Negotiations”, The Review of Economics and Statistics, v85: 760-765.
Coulson, N. Edward, Joseph V. Terza, Cheryl A. Neslusan and Bruce C. Stuart (1995). “Estimating the Moral-Hazard Effect of Supplemental Medical Insurance in the Demand for Prescription Drugs by the Elderly”, The American Economic Review, v85: 122-126.
Foster, Andrew D. and Mark R. Rosenzweig (1994). “A Test for Moral Hazard in the Labor Market: Contractual Arrangements, Effort and Health”, The Review of Economics and Statistics, v76: 213-227.
Gaynor, Martin and Paul Gertler (1995). “Moral Hazard and Risk Spreading in Partnerships”, The RAND Journal of Economics, v26: 591-613.
Grossman, Richard S. (1992). “Deposit Insurance, Regulation, and Moral Hazard in the Thrift Industry: Evidence from the 1930’s”, The American Economic Review, v82: 800-821.
Hubbard, Thomas N. (1998). “An Empirical Examination of Moral Hazard in the Vehicle Inspection Market”, The RAND Journal of Economics, v29: 406-426.
Pennsylvania Game Commission, 1990-2003, Pennsylvania Digest of Hunting and Trapping Regulations. Pennsylvania Game Commission, 2004. Press Release #008-004: Game Commission Delivers Annual
Report to the House Committee, http://www.pgc.state.pa.us/pgc/cwp/view.asp?A=11&Q=161136 Pennsylvania Game Commission, 2006. About the Pennsylvania Game Commission.
http://www.pgc.state.pa.us/pgc/cwp/view.asp?a=481&q=151287&pgcNav=%7C State of California, Department of Fish and Game, 1999. International Hunter Education Association
1998 Casualty Report, http://www.dfg.ca.gov/ihea/ihea98a.html. U.S. Department of the Interior, Fish and Wildlife Service and U.S. Department of Commerce,
U.S. Census Bureau, 2001 National Survey of Fishing, Hunting and Wildlife-Associated Recreation.
U.S. Department of the Interior, Fish and Wildlife Service and U.S. Department of Commerce, U.S. Census Bureau, 2004 Deer Hunting in the United States: An Analysis of Hunter Demographics and Behavior.

21
Table 1: Hunting Regulations During the Two-Week Season After Thanksgiving1
1990-1997 1998-1999 2000 2001 2002
Does No No except for youth and senior hunters on the two
Saturdays
No except for youth and senior hunters on the first Saturday and all hunters on the second Saturday
Yes Yes
Buck 2 or more pts 2 or more pts 2 or more pts 2 or more pts 3 or more pts, 51 counties
4 or more pts, 10 counties
1. From 1990-1999, there was a three day doe hunting season that followed the two weak buck season. In 2000, the doe
hunting season was two days. .

22
Table 2: Descriptive Statistics
Means and Standard Deviations
Fraction of County-Days where an Accident Related to Moral Hazard Occurred
0.011 (0.102)
Fraction of County-Days where an Accident Unrelated to Moral Hazard Occurred
0.015 (0.122)
Fraction of County-Days where All Hunters Can Harvest Only Buck
0.617 (0.486)
Fraction of County-Days where All Hunters Can Harvest Only Doe
0.170 (0.376)
Fraction of County-Days where Only Youth and/or Seniors Can Harvest Both Buck and Doe
0.080 (0.271)
Fraction of County-Days where All Hunters Can Harvest Both Buck and Doe
0.133 (0.340)
Minimum of Two Points on Buck’s Antler
0.936 (0.244)
Minimum of Three Points on Buck’s Antler
0.053 (0.225)
Minimum of Four Points on Buck’s Antler
0.010 (0.102)
Average Daily Number of Hunters 8,136 (3,484)
Forested Land (square miles) 422
(224)
Congestion= Average Daily Number of Hunters divided by Forested Land
23.31 (12.98)
Deer Population
13,609 (7,049)
Average Daily Number of Bucks Harvested
189.4 (98.3)
Average Daily Number of Does Harvested
256.7 (159.9)
Total Number of County-Days
11,468

23
FIGURE 1 Total Related and Unrelated Accidents
0
5
10
15
20
25
3019
90
1991
1992
1993
1994
1995
1996
1997
1998
1999
2000
2001
2002
Num
ber o
f Acc
iden
ts
Related Accidents Unrelated Accidents
FIGURE 2 Average Daily Number of Hunters
7,6007,8008,0008,2008,4008,6008,8009,0009,200
1990
1991
1992
1993
1994
1995
1996
1997
1998
1999
2000
2001
2002
Average Daily Number of Hunters

24
FIGURE 3 Average Daily Buck and Doe Harvests
140180220260300340380420460
1990
1991
1992
1993
1994
1995
1996
1997
1998
1999
2000
2001
2002
Num
ber o
f Dee
r
Buck Harvest Doe Harvest
25
Table 3: Bivariate Probit Specifications (N=11,468 county-days) Model 1 Model 2 Related
Accident Unrelated Accident
Related Accident
Unrelated Accident
Minimum of Four Points on Buck (Indicator Variable)
-5.7372** (0.4295)
-0.0522 (0.4446)
-6.0781** (0.9829)
1.7226 (1.2591)
Minimum of Three Points on Buck
(Indicator Variable) -0.4931 (0.3218)
0.1630 (0.2522)
-0.6282 (0.5208)
0.7048 (0.4579)
Youth and/or Senior Harvest Bucks and Does
(Indicator Variable) 0.1704
(0.1985)
-0.0124 (0.1558)
0.1827 (0.1989)
-0.0076 (0.1557)
All Hunters Can Harvest Bucks and Does (Indicator
Variable)
0.7510** (0.1929)
-0.0667 (0.2126)
0.5032 (0.3222)
0.2542 (0.3114)
All Hunters Harvest Only Doe
(Indicator Variable) 1.1896** (0.2820)
0.8326** (0.2683)
1.2007** (0.2789)
0.8394** (0.2681)
Deer Population (1,000) 0.0643**
(0.0204)
-0.0431* (0.0181)
0.0640** (0.0205)
-0.0417* (0.0181)
Average Daily Number of Bucks Harvested -0.0038*
(0.0018)
0.0009 (0.0015)
-0.0041* (0.0018)
0.0016 (0.0016)
Average Daily Number of Does Harvested -0.0009
(0.0007)
-0.00005 (0.0006)
-0.0009 (0.0007)
-0.0004 (0.0006)
Average Daily Number of Hunters (1,000)
-0.1281 (0.0696)
-0.0245 (0.0545)
-0.1200 (0.0702)
-0.0191 (0.0538)
Congestion in Forested Land= (Average Daily Number of Hunters / Forested Land * 1,000)
0.0725** (0.0257)
0.0112 (0.0169)
0.0521 (0.0430)
0.0720 (0.0416)
First Saturday in Season
(Indicator Variable) 0.2103
(0.1727)
0.6477** (0.1117)
0.2055 (0.1730)
0.6484** (0.1119)
Second Saturday in Season
(Indicator Variable)
0.8729** (0.2406)
0.9724** (0.2173)
0.8807** (0.2378)
0.9767** (0.2172)
First Day of Season
0.4218** (0.1537)
0.6018** (0.1224)
0.4181** (0.1536)
0.6016** (0.1227)
Day of Hunt Season
-0.0896** (0.0265)
-0.1037** (0.0239)
-0.0906** (0.0262)
-0.1044** (0.0239)
First Day of Doe Only Season
0.6359** (0.1408)
0.3655* (0.1697)
0.6356** (0.1410)
0.3670* (0.1695)
Wear Orange Fluorescent Clothing
(Indicator Variable) -0.0646 (0.1587)
-0.0352 (0.1372)
-0.0864 (0.1581)
-0.0178 (0.1373)
Year -0.0286
(0.0204)
-0.0224 (0.0183)
-0.0259 (0.0204)
-0.0291 (0.0185)
(All Hunters Can Harvest Buck or Doe) *
(Congestion in Forested Land) 0.0112
(0.0101)
-0.0138 (0.0093)
(Minimum Point Requirement for Bucks) *
Congestion in Forested Land) 0.0050
(0.0147)
-0.0279 (0.0190)
County Fixed Effects YES YES YES YES
Log Likelihood ρ
-1,264 0.018
-1,261 0.018
Notes: Standard errors are in parentheses. The standard errors are robust to arbitrary heteroskedasticity. * Statistically significant at .05 level; ** Statistically significant at .01 level.