Embed Size (px)
Citation preview

Page 1 of 15
Pay Inequality in Fujitsu Unite dossier, 10 November 2017
Summary
The latest company accounts show the top director of Fujitsu Services Limited, the main UK company, receiving £1,635,000 – more than 100 times the salary of its lowest paid staff. Fujitsu’s pay inequality is worse than the general UK labour market. Analysis of median Fujitsu salaries (IRS) against Fujitsu’s view of market rates (MRS) shows that Fujitsu generally pays workers in lower paid jobs less than market rates and workers in the highest paid jobs above market rates. Anyone would think the highest paid people were taking the decisions.
Fujitsu recently published a report (https://goo.gl/J29ssx) showing that its Gender Pay Gap (GPG) was 16.7% (mean) and 17.9% (median), while the gap on bonus was 40.8% (mean) and 23.6% (median). These figures illustrate the proportion of the average male salary that the average woman misses out on. Fujitsu says that the biggest cause of its GPG is the under-representation of women in better paid senior management, technical and sales roles. However, Unite’s analysis, using data from the Manchester Bargaining Unit, suggests that women are on average paid 1.7% less relative to the IRS for their role compared to men – suggesting that “in role” pay is an issue as well as job segregation.
In addition this data shows that the gender pay gap is far from consistent; demographics plays a significant role, particularly the different age profile of male and female employees. Unite found huge variations with age, with younger women actually getting paid more than men, and between business units, with women within BAS suffering a GPG of 27.1% compared to just 9.3% in EPS. This is particularly striking given that BAS was the area where Unite demonstrated a very strong correlation between gender and redundancy selection in a previous redundancy programme. Fujitsu has addressed this apparent discrimination by refusing to release the equality information associated with the Agenda 2020 redundancy selection.
It is encouraging that Fujitsu has published its report before the statutory deadline, and shared some plans to improve gender diversity. Improving recruitment and promotion processes and putting flexible working policies into practice could make a real difference. However, there are big gaps. Fujitsu’s action plan is focused on getting better use of available workers, not on tackling discrimination in areas such as work allocation with jobs (especially for assignment workers), performance management, pay reviews, benefit allocation and redundancy selection – all of which have large elements of management discretion and potential bias. Fujitsu still shows no interest in addressing the fact that its pay system uses nearly all the “risky practices” identified in the statutory Code of Practice on Equal Pay.
Friday 10 November is Equal Pay Day, the date after which women would be working for free if they were paid at the same hourly rate as men. It was strike action of women union members at Ford Dagenham that led to the introduction of equal pay legislation, which helped reduce the GPG from 36% for full-time workers and 49% for part-time workers in 1970. Within Fujitsu the union has been campaigning over this issue for decades, including supporting several legal cases to force more transparency over pay scales and supporting members with equal pay cases.
The news that Fujitsu intends to carry out an Equal Pay Review this financial year is extremely welcome – they have been promising this for ten years. Unfortunately it is hard for employees have any confidence in the process because it is shrouded in secrecy. Fujitsu abolished Fujitsu Voice, which has meant that employees no longer have access to UK-wide information about pay review outcomes, let alone influence over it. The company refused to agree to the Your Forum replacement covering pay and benefits to the same extent. Unite is having to use rights arising from recognition in Manchester to bring a legal case to force disclosure of UK-wide pay equality information; this case is due to be heard on 4 December. In the meantime, Unite is publishing this updated version of its dossier on pay inequality in Fujitsu based on the information currently available.

Page 2 of 15
Contents
Summary ........................................................................................................................................................... 1
Background ....................................................................................................................................................... 3
Overall inequality ............................................................................................................................................. 4
Gender Pay Gap in the Manchester Bargaining Unit ....................................................................................... 5
Manchester overall gender pay gap ............................................................................................................. 5
Job segregation ............................................................................................................................................. 7
Pay differences within Professional Community Role Code ........................................................................ 8
Pay differences by Division ......................................................................................................................... 11
Pay differences by Age ............................................................................................................................... 12
What next? ..................................................................................................................................................... 15

Page 3 of 15
Background Fujitsu Services Limited (FSL) is the main Fujitsu company in the UK and directly employs 7795 people in the UK1. It also has subsidiaries employing much smaller numbers, including Fujitsu Services (Engineering Services) Limited.
The company recognises unions in several parts of the company, the largest of which is the Manchester Bargaining Unit with Unite.
Fujitsu allocates each employee a “Professional Community Role Code” (“role code” for short), which is made of three parts. The “Professional Community” is a broad job family. These are divided into narrower job families called “roles”, which are in turn divided into “benchmarks” reflecting seniority within the particular “role”. This system is currently being changed to the “Fujitsu Role Framework”, however the data in this document is based on the old Professional Communities structure.
Fujitsu generates an “Internal Reference Salary” (IRS) for each Professional Community Role Code which is the median salary of its UK employees on that role code, excluding a few hundred on a separate pay system for service desks and some related jobs, and normalised to a 37-hour week.
Fujitsu also creates two “Market Reference Salary” (MRS) figures for each role code. These are Fujitsu’s estimates of lower and upper quartile external market rates, using information from external data providers.
The “standard” pay system, for those without collective bargaining, is based entirely on management discretion based on “guidelines”.
This dossier has been produced using company accounts, information provided to Unite for collective bargaining covering 612 employees in the Manchester bargaining unit, and Fujitsu’s IRS and MRS figures.
1 Based on constituency totals for Your Forum, the new information and consultation forum
Page 4 of 15
Overall inequality Fujitsu provides both IRS and MRS figures for each role code, allowing us to compare Fujitsu UK median salaries with Fujitsu’s view of the external market rate for the same role.
Figure 1 Fujitsu pay v Market pay
The red line on the graph above shows median Fujitsu UK salaries (IRS) for all the roles present in the Manchester bargaining unit. The orange and blue trend-lines based on the black and green markers, which are Fujitsu’s view of the lower and upper quartile external market rates for the same roles (MRS). It is clearly visible that for lower-paid roles Fujitsu tends to pay below the market rate, but for higher paid roles Fujitsu tends to pay above the market rate.
In a society and labour market that many feel is too unequal, with disproportionate rewards going to a tiny percentage of people at the top, Fujitsu is more unequal still.

Page 5 of 15
Gender Pay Gap in the Manchester Bargaining Unit The data available to us only allows us to analyse the gender pay gap in the Manchester Bargaining Unit. There isn’t sufficient reliable data to analyse pay gaps based in other protected characteristics such as race and disability, however there are indications of pay gaps in these areas.
Note the gender pay gap is calculated as defined by the legislation in the Equality Act 2010, as being:
(Male pay – Female pay) / Male pay
and expressed as a percentage.
Manchester overall gender pay gap
Using data provided by the company for the 612 employees in the Manchester bargaining unit, Unite was able to calculate the mean hourly rates for female and male employees:
Mean hourly rate Median hourly rate Number of employees
Female £18.58 £18.42 119
Male £22.56 £21.50 493
All £21.79 £20.64 612
The gender pay gap based on mean hourly pay is therefore £3.98 an hour, or 17.6%.
Based on median pay, is it £3.08, or 14.3%.
The same data also enables the calculation of the gender pay gap at percentiles.
Percentile Female Male Gap £ Gap %
10% £ 9.12 £10.18 £1.06 10.4%
20% £11.15 £14.81 £3.66 24.7%
30% £14.01 £16.80 £2.79 16.6%
40% £16.59 £19.39 £2.80 14.4%
50% £18.42 £21.50 £3.08 14.3%
60% £19.86 £23.50 £3.64 15.5%
70% £21.77 £25.30 £3.53 14.0%
80% £24.36 £28.78 £4.42 15.4%
90% £27.77 £34.38 £6.61 19.2%

Page 6 of 15
Figure 2 shows the gap at various percentiles:
Figure 2 Gender pay gap at hourly salary percentiles
Also the percentage of men and women in each quartile of the pay spectrum:
Quartile Female Male
Lower quartile 28.1% 71.9%
Lower middle quartile 24.8% 75.2%
Upper middle quartile 13.1% 86.9%
Upper quartile 11.8% 88.2%
Page 7 of 15
Understanding the gender pay gap can be confounded by part-time working, which is generally more prevalent among women, who bear disproportionate caring responsibilities, and which is generally lower paid. If we exclude current part-time workers (those on less than 35 hours per week) from the calculations:
>=35 hour week only Mean hourly rate Number of employees
Female £18.64 94
Male £22.48 476
All £21.84 570
The gender pay gap for full-time workers only is £3.84 or 17.1%, so the part-time pay gap accounts for very little of the observed gender pay gap. However this doesn’t account for previous part time working or career breaks.
Comparing full-time and part-time workers (ignoring gender) showed a mean hourly part-time pay gap of £0.84 or 3.9%:
Hours Number of employees Mean hourly rate
>=35 hours 570 £21.84
<35 hours 42 £21.00
All 612 £21.79
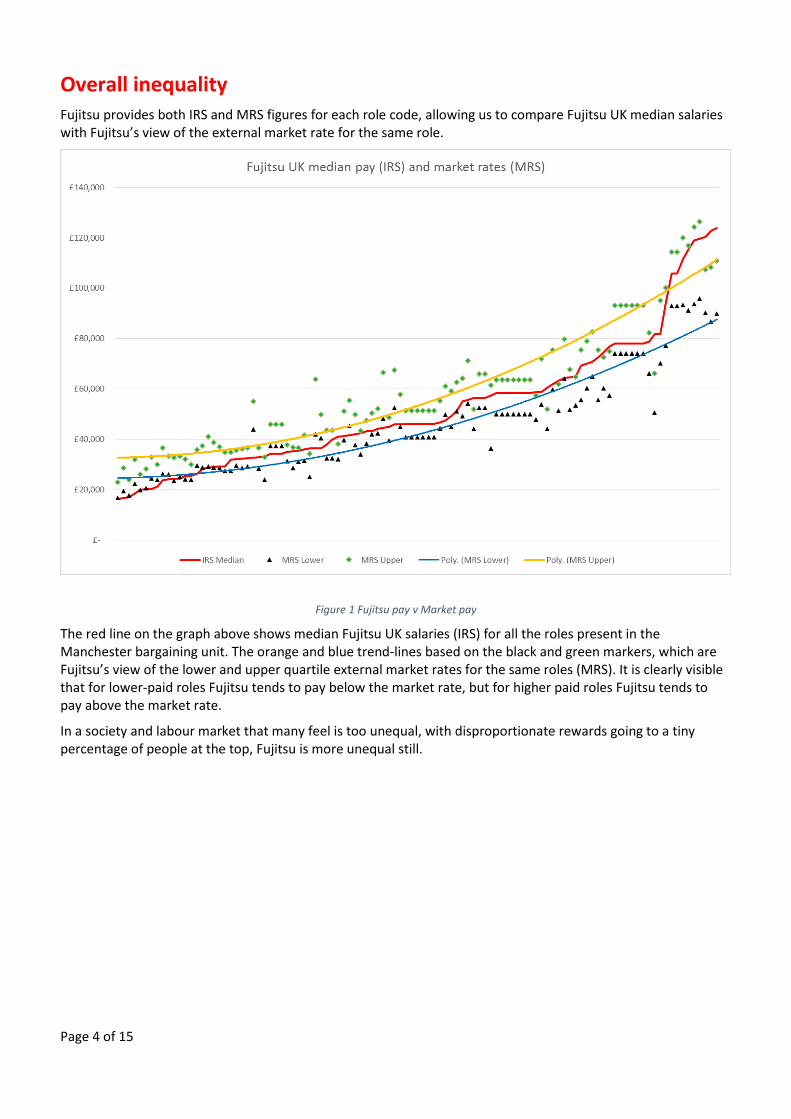
Job segregation
One of the causes of gender pay gaps is job segregation. Women may be concentrated in occupations which are paid less, or at lower levels within a particular occupation. Jobs mainly done by women may be undervalued relative to jobs mainly done by men.
The following graph shows how women are concentrated in the lower-paid Professional Community Role Codes, measured by the Fujitsu-wide “IRS” median salary. Each blue dot represents a role code, the black line is the trend.
Figure 3 Women are concentrated in lower-paid roles

Page 8 of 15
Pay differences within Professional Community Role Code
It is hard to explore the impact of job segregation in detail, given Fujitsu’s refusal to provide data beyond the Manchester bargaining unit, as the majority of roles do not contain enough people to allow meaningful analysis.
While the population within most role codes is too small for meaningful analysis, each role has an IRS median salary with which the 612 employees in the Manchester bargaining unit can be compared. This shows that both men and women in the bargaining unit are paid above the median for their role, showing the benefits of collective bargaining, however on average, women are paid a smaller percentage of their IRS median than men (1.8% less relative to the median, resulting in a 1.7% gender pay gap using the formula described above).
Female Male % gender pay gap
Mean % of IRS median 103.1% 104.9% 1.7%
There are 7 role codes which contain at least 5 men and 5 women. The following table shows the pay gap in these roles:
Professional Community / Role
Women Mean hourly rate (female)
Men Mean hourly rate (male)
Gender pay gap
% gender pay gap
SSD/DEV/4 8 £19.39 12 £20.93 £1.54 7.4%
OPC/TSS/2 6 £10.65 16 £11.01 £0.37 3.3%
OPC/TSS/4 6 £19.11 68 £19.35 £0.24 1.2%
SDM/SDMG/L5 6 £24.50 7 £24.37 -£0.13 -0.5%
SDM/SDMG/L4 8 £19.09 8 £18.94 -£0.16 -0.8%
OPC/TSS/1 11 £8.98 33 £8.87 -£0.11 -1.2%
PRM/PJM/L3 7 £16.07 5 £15.52 -£0.54 -3.5%
Figure 4 Gender pay gaps in role code

Page 9 of 15
The following table and bar chart show jobs grouped at the 2nd level of Professional Community / Role for roles
with at least 5 men and 5 women in the data available:
2nd level Professional Community / Role
Women Mean hourly rate (female)
Men Mean hourly rate (male)
Gender pay gap
% gender pay gap
OPC/TSS 25 £12.51 160 £16.05 £3.53 22.0%
PRM/PJM 12 £19.83 21 £23.58 £3.75 15.9%
SDM/SDMG 15 £23.07 20 £26.99 £3.92 14.5%
SSD/DEV 11 £19.33 56 £22.48 £3.15 14.0%
BSC/BSC 5 £21.66 19 £24.33 £2.68 11.0%
OPC/SCO 6 £12.80 11 £10.64 -£2.17 -20.4%
Figure 5 Gender pay gap by 2nd level prof community/role
Page 10 of 15
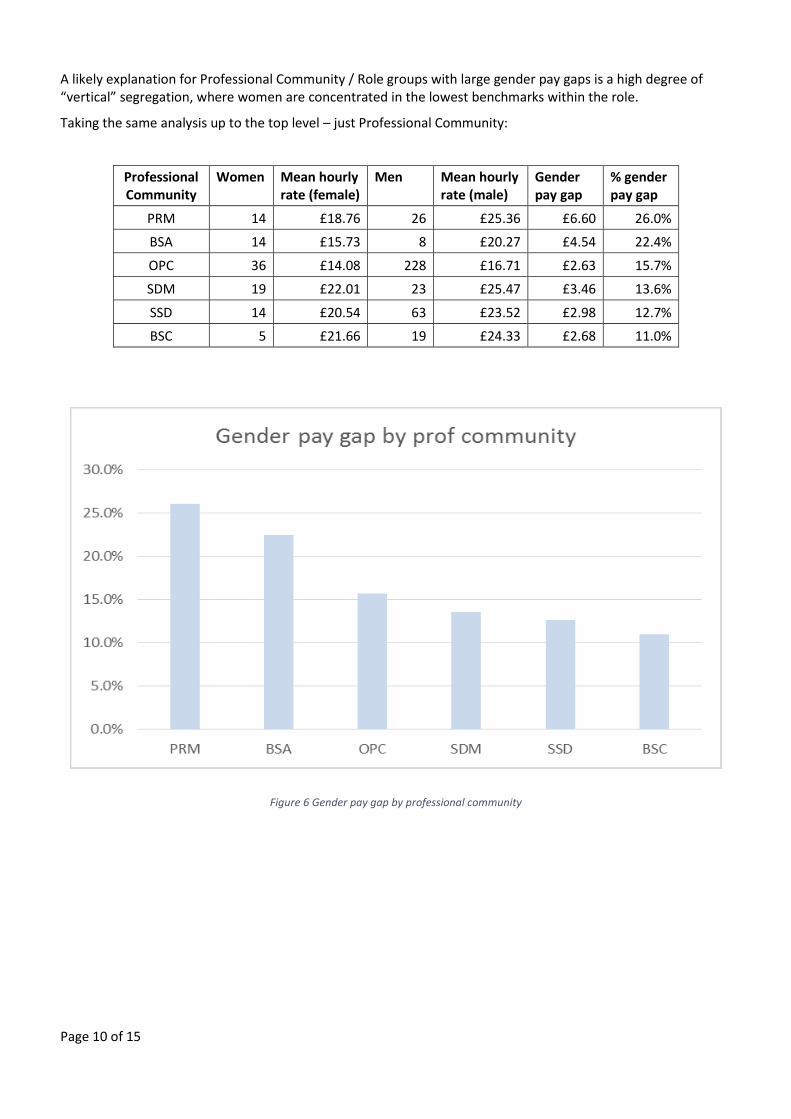
A likely explanation for Professional Community / Role groups with large gender pay gaps is a high degree of “vertical” segregation, where women are concentrated in the lowest benchmarks within the role.
Taking the same analysis up to the top level – just Professional Community:
Professional Community
Women Mean hourly rate (female)
Men Mean hourly rate (male)
Gender pay gap
% gender pay gap
PRM 14 £18.76 26 £25.36 £6.60 26.0%
BSA 14 £15.73 8 £20.27 £4.54 22.4%
OPC 36 £14.08 228 £16.71 £2.63 15.7%
SDM 19 £22.01 23 £25.47 £3.46 13.6%
SSD 14 £20.54 63 £23.52 £2.98 12.7%
BSC 5 £21.66 19 £24.33 £2.68 11.0%
Figure 6 Gender pay gap by professional community

Page 11 of 15
Pay differences by Division
There are some very significant differences between divisions. In particular, contrast the very high gender pay
gap in BAS with the relatively low gap in EPS (mainly VME). This is even more surprising given that (as we’ll see
later), the gap is much larger amongst older people and EPS has a much higher average age than BAS.
Again, only divisions with at least 5 men and 5 women are shown.
Division Women Mean hourly rate
(female)
Men Mean hourly rate (male)
Gender pay gap
% gender pay gap
BAS 11 £19.89 50 £27.26 £7.38 27.1%
MIS 43 £15.32 257 £19.30 £3.99 20.6%
EMEIA
Operations
22 £14.82 17 £18.27 £3.45 18.9%
EPS 8 £21.73 83 £23.95 £2.23 9.3%
IT Strategies
Unit
8 £21.14 7 £22.52 £1.38 6.1%
Figure 7 Gender pay gap by division
Page 12 of 15
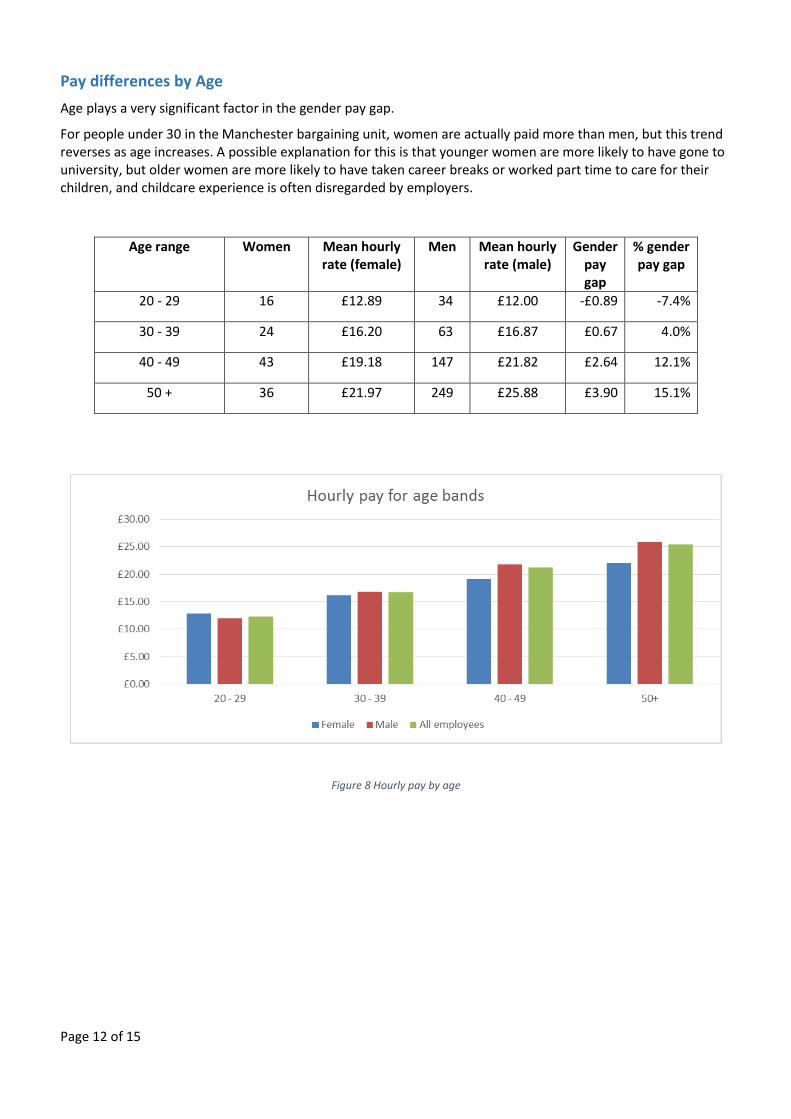
Pay differences by Age
Age plays a very significant factor in the gender pay gap.
For people under 30 in the Manchester bargaining unit, women are actually paid more than men, but this trend reverses as age increases. A possible explanation for this is that younger women are more likely to have gone to university, but older women are more likely to have taken career breaks or worked part time to care for their children, and childcare experience is often disregarded by employers.
Age range Women Mean hourly
rate (female) Men Mean hourly
rate (male) Gender
pay gap
% gender pay gap
20 - 29 16 £12.89 34 £12.00 -£0.89 -7.4%
30 - 39 24 £16.20 63 £16.87 £0.67 4.0%
40 - 49 43 £19.18 147 £21.82 £2.64 12.1%
50 + 36 £21.97 249 £25.88 £3.90 15.1%
Figure 8 Hourly pay by age

Page 13 of 15
Figure 9 Gender pay gap by age
An interesting point is that for all age bands, the gender pay gap is lower than the overall 17.6% gender pay gap. At first this may appear paradoxical, how can they all be lower than the overall average?
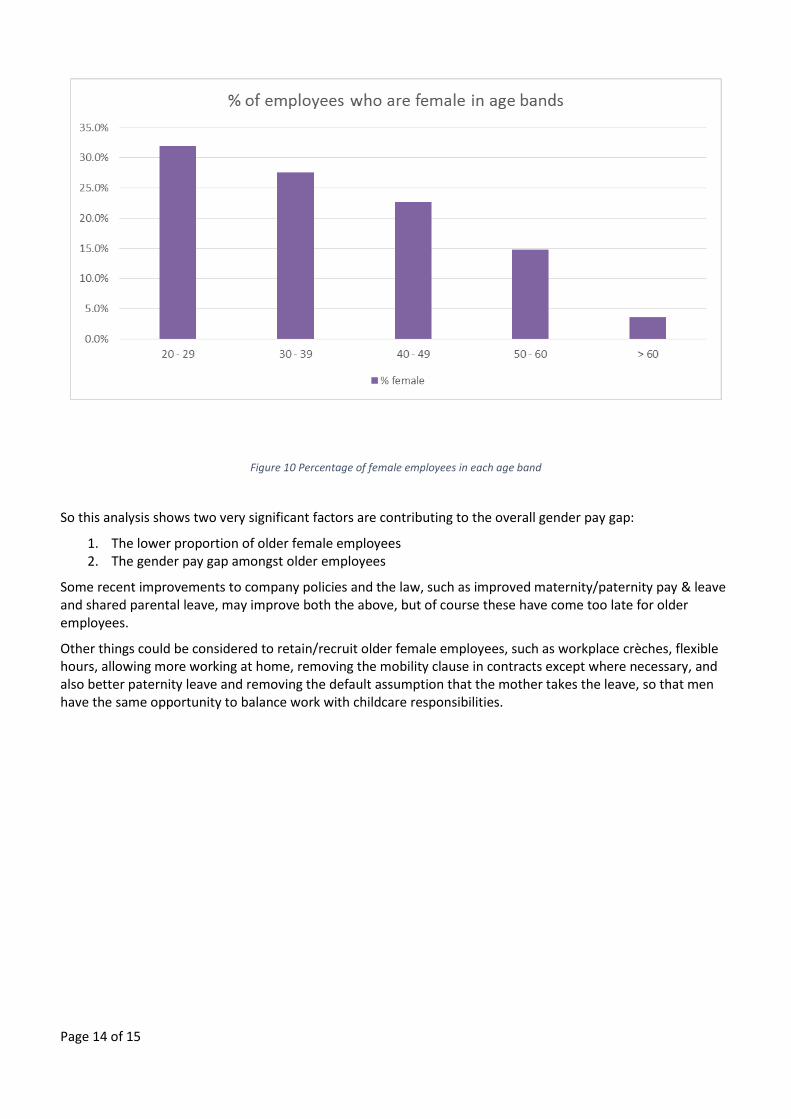
This is explained by the fact that there is a very significant drop in the female proportion of the workforce as age increases, as shown below. Women make up 32% of employees under 30’s, but only 3.6% of over 60’s and the drop is fairly linear at intermediate ages, as can be seen in Figure 10 on the next page.
As older people are paid significantly more than younger people (over 50’s are paid on average about twice as much as under 30’s), and female employees are younger on average, part of the overall gender pay gap can be explained by the “age pay gap”.
Age range Number of women Number of men Total % female
20 - 29 16 34 50 32.0%
30 - 39 24 63 87 27.6%
40 - 49 43 147 190 22.6%
50 - 60 34 196 230 14.8%
> 60 2 53 55 3.6%
Page 14 of 15
Figure 10 Percentage of female employees in each age band
So this analysis shows two very significant factors are contributing to the overall gender pay gap:
1. The lower proportion of older female employees 2. The gender pay gap amongst older employees
Some recent improvements to company policies and the law, such as improved maternity/paternity pay & leave and shared parental leave, may improve both the above, but of course these have come too late for older employees.
Other things could be considered to retain/recruit older female employees, such as workplace crèches, flexible hours, allowing more working at home, removing the mobility clause in contracts except where necessary, and also better paternity leave and removing the default assumption that the mother takes the leave, so that men have the same opportunity to balance work with childcare responsibilities.

Page 15 of 15
What next? The statutory Code of Practice on Equal Pay2 explains that “Employers are responsible for providing equal pay for equal work and for ensuring that pay systems are transparent. Where a pay system lacks transparency the employer must be able to prove there is no sex discrimination behind a pay differential”.
Fujitsu’s pay system is not transparent – there is no way for an individual to know why they get paid what they get paid or how that relates to the pay of others. The Code lists a number of common pay practices which pose risks in terms of potential non-compliance with an employer’s legal obligations. Comparing them to Fujitsu’s approach to pay and benefits perhaps indicates why the company may have a problem:
Risky practice Fujitsu
Lack of transparency and unnecessary secrecy over grading and pay Yes
Discretionary pay systems (for example, merit pay and performance-related pay) unless they are clearly structured and based on objective criteria
Yes
Different non-basic pay, terms and conditions for different groups of employees (for example, attendance allowances, overtime or unsocial hours payments)
Yes
More than one grading and pay system within the organisation Yes
Long pay scales or ranges Yes
Overlapping pay scales or ranges, where the maximum of the lower pay scale is higher than the minimum of the next higher scale, including ‘broad-banded’ structures where there are significant overlaps
Yes
Managerial discretion over starting salaries Yes
Market-based pay systems or supplements not underpinned by job evaluation
No
Job evaluation systems which have been incorrectly implemented or not kept up to date
No job evaluation system
Pay protection policies No
The company is now making radical changes to the job / grading structure to create a Fujitsu Role Framework, but there is no indication that the company is taking into account its obligations to avoid discriminating against employees in the design of the system.
Fujitsu claims to be a Responsible Business. It is time the company stopped trying to conceal issues and started working with Unite to identify and correct them. Continuing unwillingness to do so in the light of such overwhelming evidence will leave it exposed to potential litigation by employees. The company’s refusal to tackle inconsistent pay and benefits is a significant factor in the current dispute.
2 https://www.equalityhumanrights.com/en/publication-download/equal-pay-statutory-code-practice