Embed Size (px)
Citation preview
2011 PATTERNS AND TRENDS IN UK HIGHER EDUCATION
IN FOCUS Universities UK

1
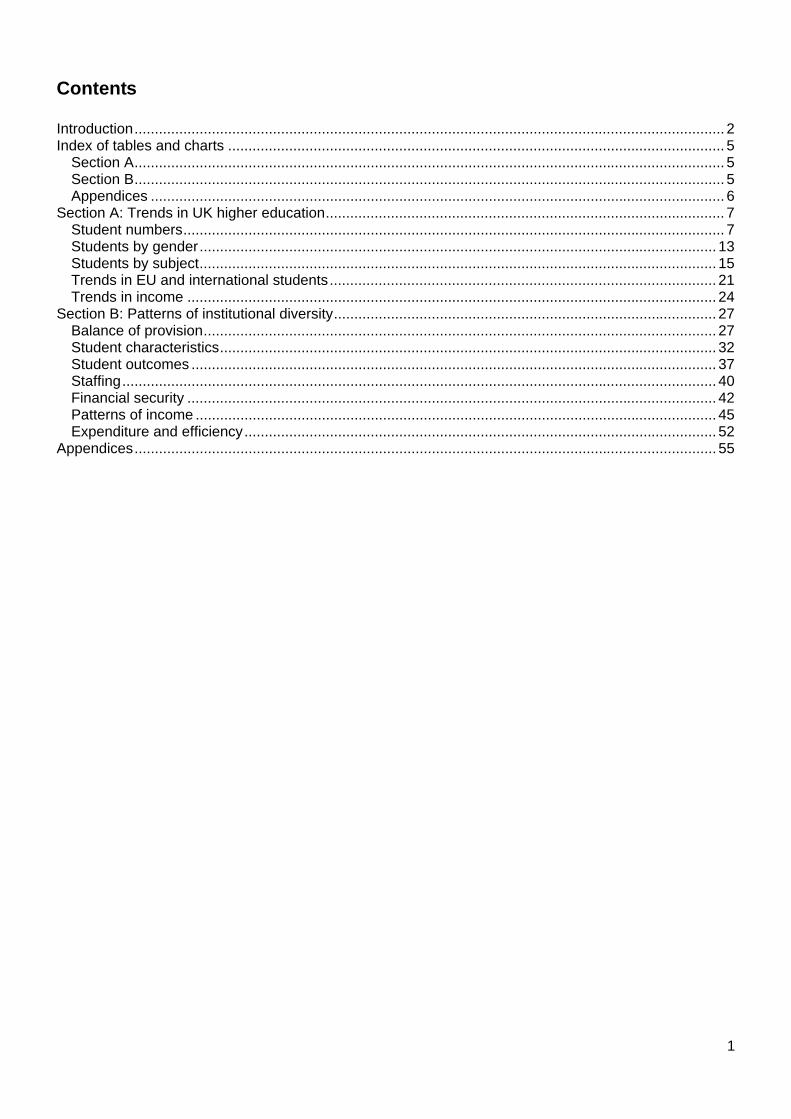
Contents Introduction ................................................................................................................................................. 2 Index of tables and charts .......................................................................................................................... 5
Section A ................................................................................................................................................. 5 Section B ................................................................................................................................................. 5 Appendices ............................................................................................................................................. 6
Section A: Trends in UK higher education .................................................................................................. 7 Student numbers ..................................................................................................................................... 7 Students by gender ............................................................................................................................... 13 Students by subject ............................................................................................................................... 15 Trends in EU and international students ............................................................................................... 21 Trends in income .................................................................................................................................. 24
Section B: Patterns of institutional diversity .............................................................................................. 27 Balance of provision .............................................................................................................................. 27 Student characteristics .......................................................................................................................... 32 Student outcomes ................................................................................................................................. 37 Staffing .................................................................................................................................................. 40 Financial security .................................................................................................................................. 42 Patterns of income ................................................................................................................................ 45 Expenditure and efficiency .................................................................................................................... 52
Appendices ............................................................................................................................................... 55
2
Introduction Patterns and trends in UK higher education
This report – Patterns and trends in UK higher education – builds on the time series data produced annually since 2001 under the title Patterns of higher education institutions in the UK. It offers a unique overview of provision at publicly-funded higher education institutions in the UK. All charts and tables in the report are now also available to download from the Universities UK website1. Section A shows sector-level trends over the last 10 years from 2000/01 to 2009/10. For the first time, this offers a true time series provided by the Higher Education Statistics Agency (HESA), accounting for changes to the way student numbers are counted. Section B looks at patterns of institutional diversity covering students, staff and finance. The report provides a very helpful insight into high-level trends during a decade of significant expansion and change. Among other things, the report tracks the rise of student numbers, the changing popularity of different subject areas, and a notable shift in the funding regime. It also demonstrates how higher education institutions continue to make a large contribution to civil society and the economy in the UK. The higher education student population UK higher education institutions together educate some 2.5 million students annually, including over 400,000 from outside the UK, making the higher education sector one of the most important export earners for the UK economy. The last 10 years has seen significant expansion, with a 28 per cent increase in student numbers from all domiciles. As in previous years female students studying higher education at UK higher education institutions remain in the majority, accounting for 56.6 per cent of all students in 2009/10. This pattern is also present for all levels and modes of study other than full-time postgraduate provision, where males account for the majority of students since 2008/09. How are students choosing to study? Since 2000/01, full-time postgraduate numbers have increased by 73.1 per cent compared with an increase of 28.5 per cent for full-time undergraduates over the same period. This is partly due to the rate of increase in non-UK students, who tend to study at postgraduate level. For all UK countries other than Scotland, growth in full-time undergraduate provision was higher than that seen for part-time undergraduate provision between 2000/01 and 2009/10. The last year has seen minor changes in the distribution of students amongst institutions. There have been slight decreases in the proportion of other undergraduate, part-time and mature full-time students across the range of institutions compared to 2008/09, despite increases in the absolute number of students in most of these groups. Part of this trend could be due to the greater increase in non-UK students, who tend to be younger and study full-time and postgraduate-level courses. EU and international students One of the main trends over the last 10 years has been the success of UK higher education institutions in attracting international students. Since 2000/01, the number of non-EU students has more than doubled, with an increase of 11.7 per cent in the last year. Although this is approximately four times the
1 Available at http://www.universitiesuk.ac.uk/PolicyAndResearch/PolicyAreas/Data-Analysis/Pages/HE-in-Focus.aspx
3
equivalent increase in UK-domiciled students it should be noted that the UK’s share of the international student market has reduced over this period, with other countries becoming more competitive in attracting these students. This trend does not include the impact of recent changes to non-EU student visas, which may result in a greater loss of market share in the future. China (excluding Hong Kong, Taiwan and Macao) continues to provide the highest numbers of international students on first degree, postgraduate research and other undergraduate courses and the second highest numbers on postgraduate taught courses. India provided the highest numbers on postgraduate taught courses. Although overall numbers have increased, there were no significant changes in the top 20 countries across levels from the previous year. The concentration of non-EU students across institutions remains at a similar level to last year, with recent increases in the number of EU students concentrated mostly in those institutions with smaller numbers of these students. What are students studying? Between 2003/04 and 2009/10 student numbers increased by 13.3 per cent across all subjects. There have, however, been significant changes in the relative popularity of different subject areas. Over the period, large increases are seen in students studying clinical and biological sciences, mathematics, physical sciences, and architecture, building and planning. The only subjects to see decreases in the absolute number of students between 2003/04 and 2009/10 are computer science and historical and philosophical studies. Both, however, show increases in the last year. Employment of graduates Employment rates six months after graduation remain high across the sector, with 80 per cent of institutions showing between 86 per cent and 94 per cent of their students recorded as in employment or further study six months after graduation. The impact of the recession is evident, however, with small decreases across the sector in the proportion of students in employment or further study over the last year. It should be noted that recent analysis by the Organisation for Economic Co-operation and Development (OECD) and the Office for National Statistics demonstrates that graduates have been less impacted by the effects of the recession than those with lower qualifications. Trends in income In 2009/10 higher education institutions had a combined turnover of £26.8 billion. Tuition fees and education contracts accounted for 31 per cent of total income, compared to 23 per cent in 2000/01. Between 2008/09 and 2009/10, income from research grants and contracts rose 4.6 per cent, to £4.3 million. 142 institutions posted a surplus in 2009/10. The level of long-term borrowing compared to total income varied significantly across the sector, ranging from a lower decile of 0 per cent to an upper decile of 44 per cent. Four institutions showed levels of long-term borrowing above 70 per cent of total income in 2009/10. In line with trends in recent years, the level of income from funding body grants has decreased across institutions since 2008/09 at similar rates for those institutions with high and low proportions of income from this source. The impact of the recession is evident in a number of indicators, most clearly in the 38.6 per cent decrease in endowment and investment income over the last year. The recession has also contributed to a large decrease in the ratio of research income from research grants and contracts (including funding from research councils) to funding body research grants over the last year. This is evident across the sector, demonstrating the importance of QR funding in the current economic climate.

These are just a few of the many interesting observations to be found in Patterns and trends in UK higher education, which contains a great deal of rich and informative material. Readers will, I am sure, find much to interest them beyond these brief highlights.
Professor Paul O’Prey Vice-Chancellor of the University of Roehampton and Chair, Universities UK Longer Term Strategy Network October 2011
4
Index of tables and charts
5
Section B 2.1 Percentage of postgraduate students by institution 2009/10 282.2 Number of postgraduate students by institution 2009/10 282.3 Number of undergraduate students by institution 2009/10 292.4 Percentage of other undergraduate students by institution 2009/10 292.5 Percentage of part-time students by institution 2009/10 302.6 Number of non UK-domiciled students by institution 2009/10 312.7 Number of non EU-domiciled students by institution 2009/10 312.8 Number of EU (excluding UK)-domiciled students by institution 2009/10 322.9 Percentage of mature full-time undergraduate students by institution 2009/10 332.10 Percentage of male students by institution 2009/10 332.11 Percentage of UK-domiciled first year ethnic minority students by institution 2009/10 342.12 Percentage of young full-time first degree entrants from NS-SEC classes 4, 5, 6 and 7 by institution 2009/10
35
2.13 Percentage of young, full-time, first degree students from state schools by institution 2009/10
36
2.14 Average tariff points of entrants to full-time undergraduate courses by institution 2009/10
37
2.15 Percentage of first-class degrees awarded by institution 2009/10 382.16 Percentage of first and upper second-class degrees awarded by institution 2009/10 382.17 Percentage of UK-domiciled, first degree, full-time leavers not unemployed by institution 2009/10
39
2.18 Number of cost centres within which academic staff are employed by institution 2009/10
40
2.19 Percentage of female academic staff by institution 2009/10 412.20 Percentage of ethnic minorities among academic staff by institution 2009/10 412.21 Surplus/deficit as a percentage of income by institution 2009/10 422.22 Days ratio of net liquidity to total expenditure (excluding depreciation) 2009/10 432.23 Days ratio of total general funds to total expenditure by institution 2009/10 432.24 Percentage ratio of total long-term borrowings to total income by institution 2009/10 442.25 The Security Index 2011 45
Section A
1.1 Higher education students by mode of study, level of study, country of institution and type of institution 2009/10
8
1.2 Students by academic year and country of institution 91.3 Students by mode of study, level of study and country of institution 2009/10 91.4 Students by academic year, level of study, mode of study and country of institution 111.5 Students by level of study 2009/10 121.6 Change over time in undergraduate and postgraduate numbers by mode of study, level of study and country of institution
13
1.7 Students by academic year, mode of study, level of study and gender 141.8 Percentage of male students by academic year, mode of study and level of study 151.9 Change over time in student numbers by subject area 161.10 Percentage change in student numbers by subject area between 2003/04 and 2009/10 171.11 Percentage of full-time first degree students by subject area and academic year 201.12 Change over time in student numbers by domicile 221.13 Major countries supplying non-UK students to UK higher education institutions by level of study 2009/10
23
1.14 Income of higher education institutions by source of income 2009/10 (£ thousands) 251.15 Main sources of income received by academic year and country of institution (£ thousands)
26
6
2.26 Percentage ratio of total funding body grants to total income by institution 2009/10 462.27 Percentage ratio of recurrent teaching grants from funding bodies for higher education provision to total income by institution 2009/10
46
2.28 Funding of research through the dual support system (£ thousands) by institution 2009/10
47
2.29 Funding of research through the dual support system as a percentage of total income by institution 2009/10
48
2.30 Research grants and contracts as a percentage of funding council research grant by institution 2009/10
49
2.31 Income for other services rendered (£ thousands) by institution 2009/10 502.32 Income from non-EU student fees (£ thousands) by institution 2009/10 512.33 Income from non-EU student fees as a percentage of total income by institution 2009/10
51
2.34 Ratio of staff payroll costs to total income by institution 2009/10 522.35 Administrative expenditure per full-time equivalent student (£) by institution 2009/10 532.36 Academic departmental costs per full-time equivalent student, excluding academic staff (£) by institution 2009/10
53
2.37 Total academic services expenditure per full-time equivalent student (£) by institution 2009/10
54
2.38 Premises expenditure per full-time equivalent student (£) by institution 2009/10 54 Appendices
Appendix 1 – Students by mode of study, level of study and country of institution 2009/10 55Appendix 2 – Students by subject of study and academic year 56Appendix 3 – Non UK-domiciled students by country of domicile and level of study 2009/10 60Appendix 4 – Income of higher education institutions by academic year, source of income and country of institution (£ thousands)
65
Appendix 5 – Administrative expenditure per full-time equivalent student (£) by institution 2008/09
67
Appendix 6 – Academic departmental costs per full-time equivalent student, excluding academic staff costs (£) by institution 2008/09
67
Appendix 7 – Total academic services expenditure per full-time equivalent student (£) by institution 2008/09
68
Appendix 8 – Premises expenditure per full-time equivalent student (£) by institution 2008/09
68
Appendix 9 – Summary of institutional charts for 2008/09 and 2009/10 69
7
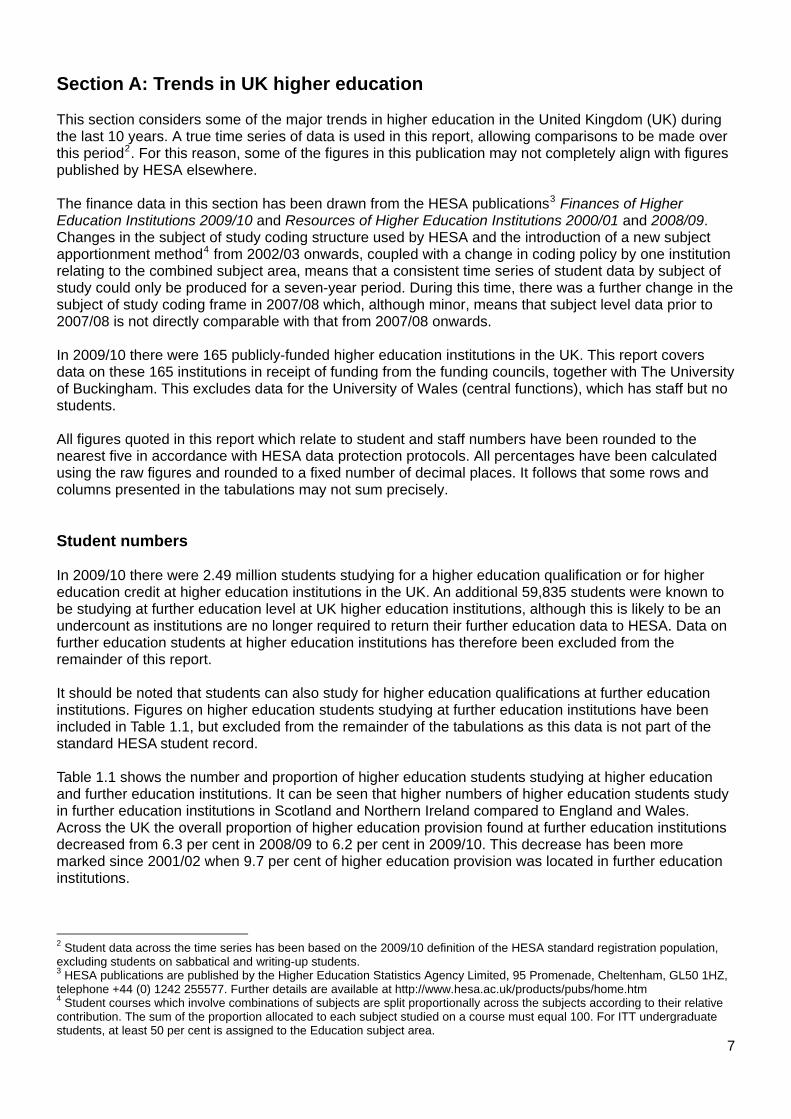
Section A: Trends in UK higher education This section considers some of the major trends in higher education in the United Kingdom (UK) during the last 10 years. A true time series of data is used in this report, allowing comparisons to be made over this period2. For this reason, some of the figures in this publication may not completely align with figures published by HESA elsewhere. The finance data in this section has been drawn from the HESA publications3 Finances of Higher Education Institutions 2009/10 and Resources of Higher Education Institutions 2000/01 and 2008/09. Changes in the subject of study coding structure used by HESA and the introduction of a new subject apportionment method4 from 2002/03 onwards, coupled with a change in coding policy by one institution relating to the combined subject area, means that a consistent time series of student data by subject of study could only be produced for a seven-year period. During this time, there was a further change in the subject of study coding frame in 2007/08 which, although minor, means that subject level data prior to 2007/08 is not directly comparable with that from 2007/08 onwards. In 2009/10 there were 165 publicly-funded higher education institutions in the UK. This report covers data on these 165 institutions in receipt of funding from the funding councils, together with The University of Buckingham. This excludes data for the University of Wales (central functions), which has staff but no students. All figures quoted in this report which relate to student and staff numbers have been rounded to the nearest five in accordance with HESA data protection protocols. All percentages have been calculated using the raw figures and rounded to a fixed number of decimal places. It follows that some rows and columns presented in the tabulations may not sum precisely. Student numbers In 2009/10 there were 2.49 million students studying for a higher education qualification or for higher education credit at higher education institutions in the UK. An additional 59,835 students were known to be studying at further education level at UK higher education institutions, although this is likely to be an undercount as institutions are no longer required to return their further education data to HESA. Data on further education students at higher education institutions has therefore been excluded from the remainder of this report. It should be noted that students can also study for higher education qualifications at further education institutions. Figures on higher education students studying at further education institutions have been included in Table 1.1, but excluded from the remainder of the tabulations as this data is not part of the standard HESA student record. Table 1.1 shows the number and proportion of higher education students studying at higher education and further education institutions. It can be seen that higher numbers of higher education students study in further education institutions in Scotland and Northern Ireland compared to England and Wales. Across the UK the overall proportion of higher education provision found at further education institutions decreased from 6.3 per cent in 2008/09 to 6.2 per cent in 2009/10. This decrease has been more marked since 2001/02 when 9.7 per cent of higher education provision was located in further education institutions.
2 Student data across the time series has been based on the 2009/10 definition of the HESA standard registration population, excluding students on sabbatical and writing-up students. 3 HESA publications are published by the Higher Education Statistics Agency Limited, 95 Promenade, Cheltenham, GL50 1HZ, telephone +44 (0) 1242 255577. Further details are available at http://www.hesa.ac.uk/products/pubs/home.htm 4 Student courses which involve combinations of subjects are split proportionally across the subjects according to their relative contribution. The sum of the proportion allocated to each subject studied on a course must equal 100. For ITT undergraduate students, at least 50 per cent is assigned to the Education subject area.
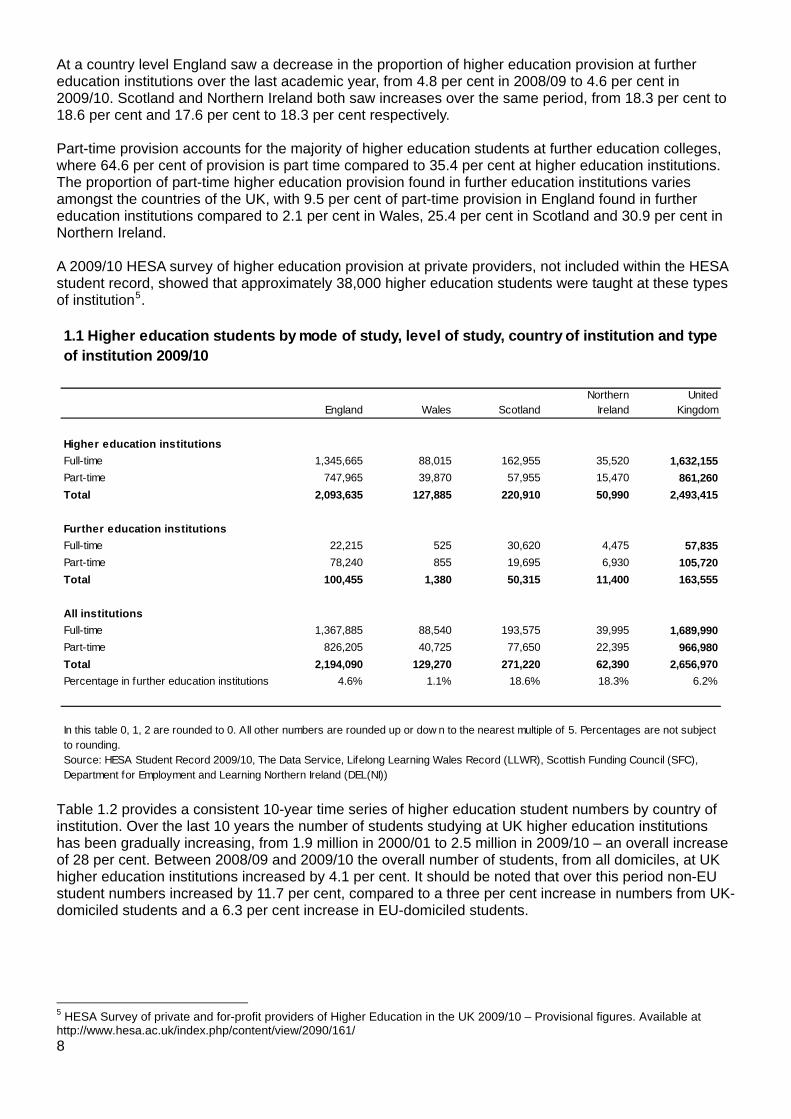
At a country level England saw a decrease in the proportion of higher education provision at further education institutions over the last academic year, from 4.8 per cent in 2008/09 to 4.6 per cent in 2009/10. Scotland and Northern Ireland both saw increases over the same period, from 18.3 per cent to 18.6 per cent and 17.6 per cent to 18.3 per cent respectively. Part-time provision accounts for the majority of higher education students at further education colleges, where 64.6 per cent of provision is part time compared to 35.4 per cent at higher education institutions. The proportion of part-time higher education provision found in further education institutions varies amongst the countries of the UK, with 9.5 per cent of part-time provision in England found in further education institutions compared to 2.1 per cent in Wales, 25.4 per cent in Scotland and 30.9 per cent in Northern Ireland. A 2009/10 HESA survey of higher education provision at private providers, not included within the HESA student record, showed that approximately 38,000 higher education students were taught at these types of institution5.
England Wales ScotlandNorthern
IrelandUnited
Kingdom
Higher education institutionsFull-time 1,345,665 88,015 162,955 35,520 1,632,155Part-time 747,965 39,870 57,955 15,470 861,260Total 2,093,635 127,885 220,910 50,990 2,493,415
Further education institutionsFull-time 22,215 525 30,620 4,475 57,835Part-time 78,240 855 19,695 6,930 105,720Total 100,455 1,380 50,315 11,400 163,555
All institutionsFull-time 1,367,885 88,540 193,575 39,995 1,689,990Part-time 826,205 40,725 77,650 22,395 966,980Total 2,194,090 129,270 271,220 62,390 2,656,970Percentage in further education institutions 4.6% 1.1% 18.6% 18.3% 6.2%
1.1 Higher education students by mode of study, level of study, country of institution and type of institution 2009/10
Source: HESA Student Record 2009/10, The Data Service, Lifelong Learning Wales Record (LLWR), Scottish Funding Council (SFC), Department for Employment and Learning Northern Ireland (DEL(NI))
In this table 0, 1, 2 are rounded to 0. All other numbers are rounded up or dow n to the nearest multiple of 5. Percentages are not subject to rounding.
Table 1.2 provides a consistent 10-year time series of higher education student numbers by country of institution. Over the last 10 years the number of students studying at UK higher education institutions has been gradually increasing, from 1.9 million in 2000/01 to 2.5 million in 2009/10 – an overall increase of 28 per cent. Between 2008/09 and 2009/10 the overall number of students, from all domiciles, at UK higher education institutions increased by 4.1 per cent. It should be noted that over this period non-EU student numbers increased by 11.7 per cent, compared to a three per cent increase in numbers from UK-domiciled students and a 6.3 per cent increase in EU-domiciled students.
8
5 HESA Survey of private and for-profit providers of Higher Education in the UK 2009/10 – Provisional figures. Available at http://www.hesa.ac.uk/index.php/content/view/2090/161/
EnglandPercentage of UK total Wales
Percentage of UK total Scotland
Percentage of UK total
Northern Ireland
Percentage of UK total
United Kingdom
2009/10 2,093,635 84.0% 127,885 5.1% 220,910 8.9% 50,990 2.0% 2,493,4152008/09 2,005,840 83.7% 126,475 5.3% 215,495 9.0% 48,240 2.0% 2,396,0502007/08 1,922,180 83.4% 125,540 5.4% 210,180 9.1% 48,200 2.1% 2,306,1052006/07 1,912,050 83.0% 128,230 5.6% 215,560 9.4% 48,860 2.1% 2,304,7002005/06 1,894,835 83.1% 125,715 5.5% 207,840 9.1% 52,845 2.3% 2,281,2352004/05 1,856,930 83.0% 123,645 5.5% 202,760 9.1% 52,930 2.4% 2,236,2652003/04 1,831,890 83.3% 118,610 5.4% 198,650 9.0% 51,025 2.3% 2,200,1752002/03 1,774,540 83.3% 116,465 5.5% 190,980 9.0% 49,125 2.3% 2,131,1102001/02 1,694,410 83.0% 110,295 5.4% 190,725 9.3% 47,155 2.3% 2,042,5802000/01 1,623,735 83.3% 104,745 5.4% 174,250 8.9% 45,400 2.3% 1,948,135
Source: HESA Student Record 2000/01-2009/10
In this table 0, 1, 2 are rounded to 0. All other numbers are rounded up or dow n to the nearest multiple of 5. Percentages are not subject to rounding.
1.2 Students by academic year and country of institution
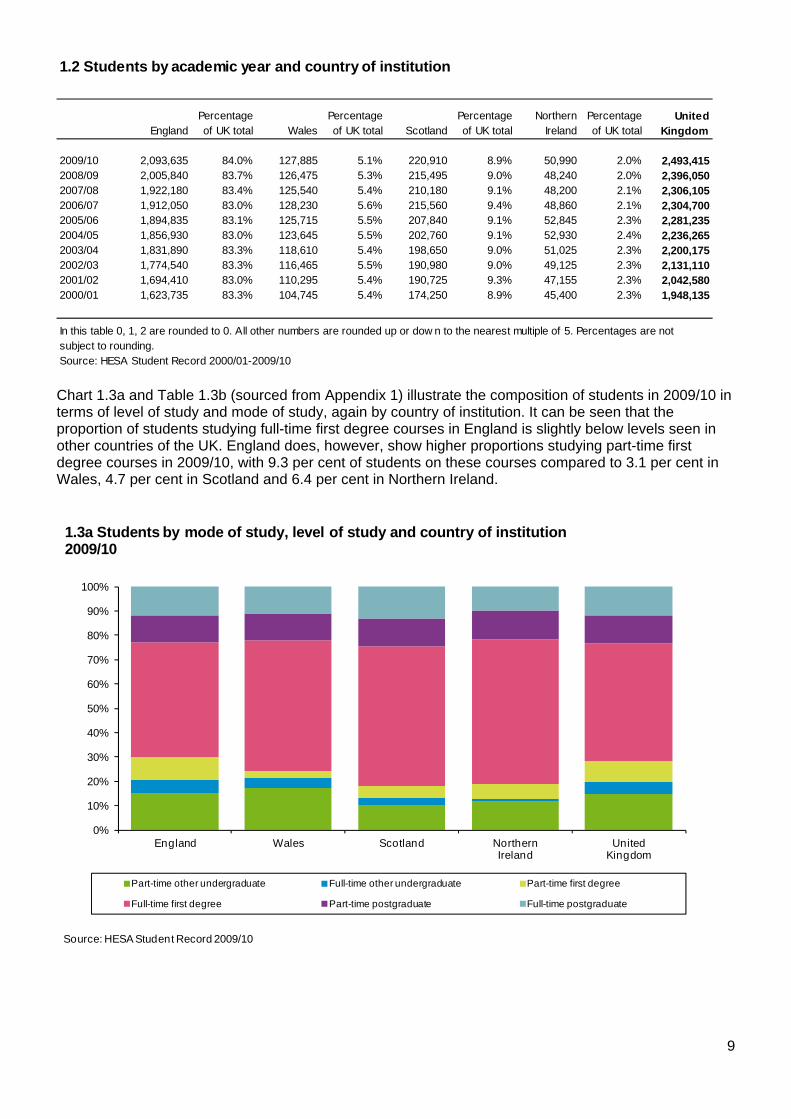
Chart 1.3a and Table 1.3b (sourced from Appendix 1) illustrate the composition of students in 2009/10 in terms of level of study and mode of study, again by country of institution. It can be seen that the proportion of students studying full-time first degree courses in England is slightly below levels seen in other countries of the UK. England does, however, show higher proportions studying part-time first degree courses in 2009/10, with 9.3 per cent of students on these courses compared to 3.1 per cent in Wales, 4.7 per cent in Scotland and 6.4 per cent in Northern Ireland.
0%
10%
20%
30%
40%
50%
60%
70%
80%
90%
100%
England Wales Scotland Northern Ireland
United Kingdom
1.3a Students by mode of study, level of study and country of institution 2009/10
Part-time other undergraduate Full-time other undergraduate Part-time first degree
Full-time first degree Part-time postgraduate Full-time postgraduate
Source: HESA Student Record 2009/10
9
England Wales ScotlandNorthern
IrelandUnited
Kingdom
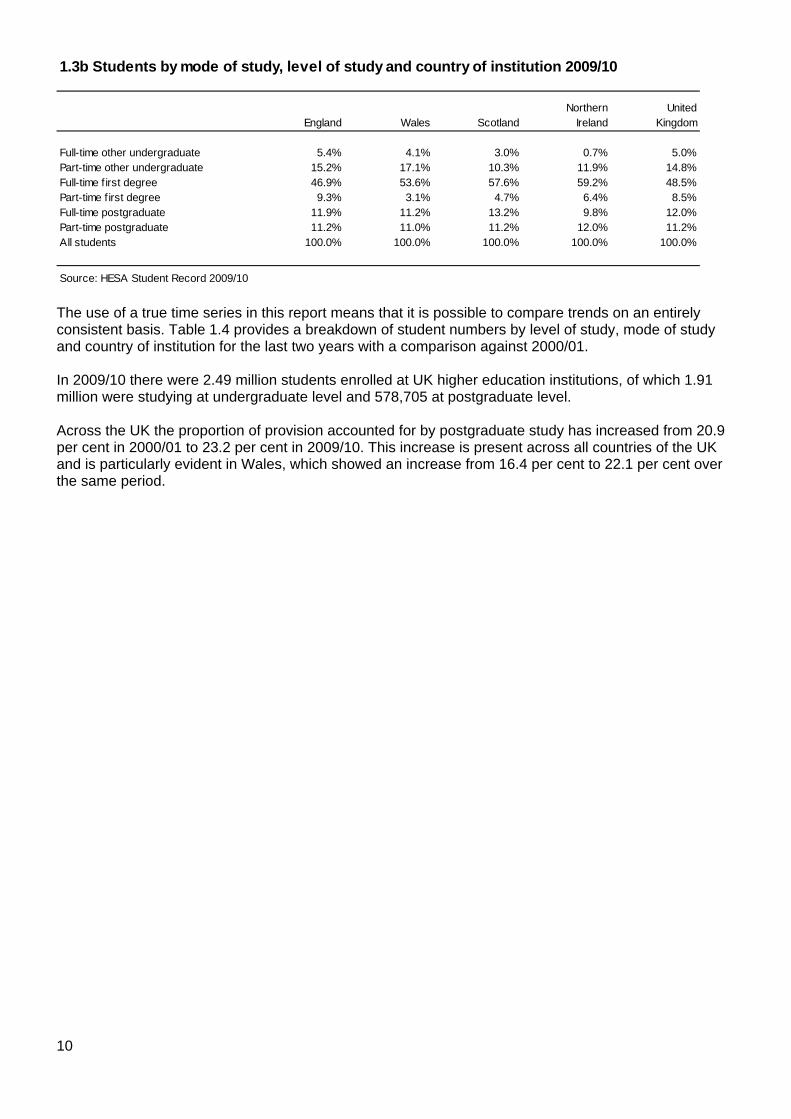
Full-time other undergraduate 5.4% 4.1% 3.0% 0.7% 5.0%Part-time other undergraduate 15.2% 17.1% 10.3% 11.9% 14.8%Full-time f irst degree 46.9% 53.6% 57.6% 59.2% 48.5%Part-time f irst degree 9.3% 3.1% 4.7% 6.4% 8.5%Full-time postgraduate 11.9% 11.2% 13.2% 9.8% 12.0%Part-time postgraduate 11.2% 11.0% 11.2% 12.0% 11.2%All students 100.0% 100.0% 100.0% 100.0% 100.0%
Source: HESA Student Record 2009/10
1.3b Students by mode of study, level of study and country of institution 2009/10
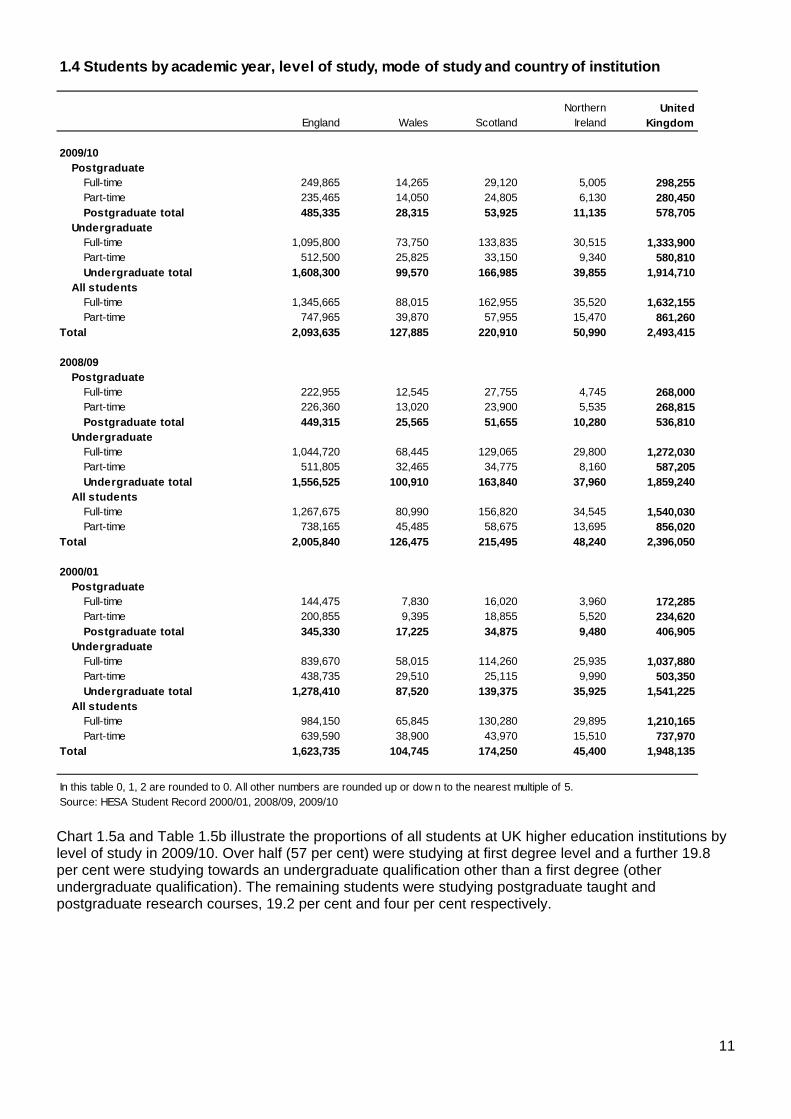
The use of a true time series in this report means that it is possible to compare trends on an entirely consistent basis. Table 1.4 provides a breakdown of student numbers by level of study, mode of study and country of institution for the last two years with a comparison against 2000/01. In 2009/10 there were 2.49 million students enrolled at UK higher education institutions, of which 1.91 million were studying at undergraduate level and 578,705 at postgraduate level. Across the UK the proportion of provision accounted for by postgraduate study has increased from 20.9 per cent in 2000/01 to 23.2 per cent in 2009/10. This increase is present across all countries of the UK and is particularly evident in Wales, which showed an increase from 16.4 per cent to 22.1 per cent over the same period.
10
England Wales ScotlandNorthern
IrelandUnited
Kingdom
2009/10Postgraduate
Full-time 249,865 14,265 29,120 5,005 298,255Part-time 235,465 14,050 24,805 6,130 280,450Postgraduate total 485,335 28,315 53,925 11,135 578,705
UndergraduateFull-time 1,095,800 73,750 133,835 30,515 1,333,900Part-time 512,500 25,825 33,150 9,340 580,810Undergraduate total 1,608,300 99,570 166,985 39,855 1,914,710
All studentsFull-time 1,345,665 88,015 162,955 35,520 1,632,155Part-time 747,965 39,870 57,955 15,470 861,260
Total 2,093,635 127,885 220,910 50,990 2,493,415
2008/09Postgraduate
Full-time 222,955 12,545 27,755 4,745 268,000Part-time 226,360 13,020 23,900 5,535 268,815Postgraduate total 449,315 25,565 51,655 10,280 536,810
UndergraduateFull-time 1,044,720 68,445 129,065 29,800 1,272,030Part-time 511,805 32,465 34,775 8,160 587,205Undergraduate total 1,556,525 100,910 163,840 37,960 1,859,240
All studentsFull-time 1,267,675 80,990 156,820 34,545 1,540,030Part-time 738,165 45,485 58,675 13,695 856,020
Total 2,005,840 126,475 215,495 48,240 2,396,050
2000/01Postgraduate
Full-time 144,475 7,830 16,020 3,960 172,285Part-time 200,855 9,395 18,855 5,520 234,620Postgraduate total 345,330 17,225 34,875 9,480 406,905
UndergraduateFull-time 839,670 58,015 114,260 25,935 1,037,880Part-time 438,735 29,510 25,115 9,990 503,350Undergraduate total 1,278,410 87,520 139,375 35,925 1,541,225
All studentsFull-time 984,150 65,845 130,280 29,895 1,210,165Part-time 639,590 38,900 43,970 15,510 737,970
Total 1,623,735 104,745 174,250 45,400 1,948,135
1.4 Students by academic year, level of study, mode of study and country of institution
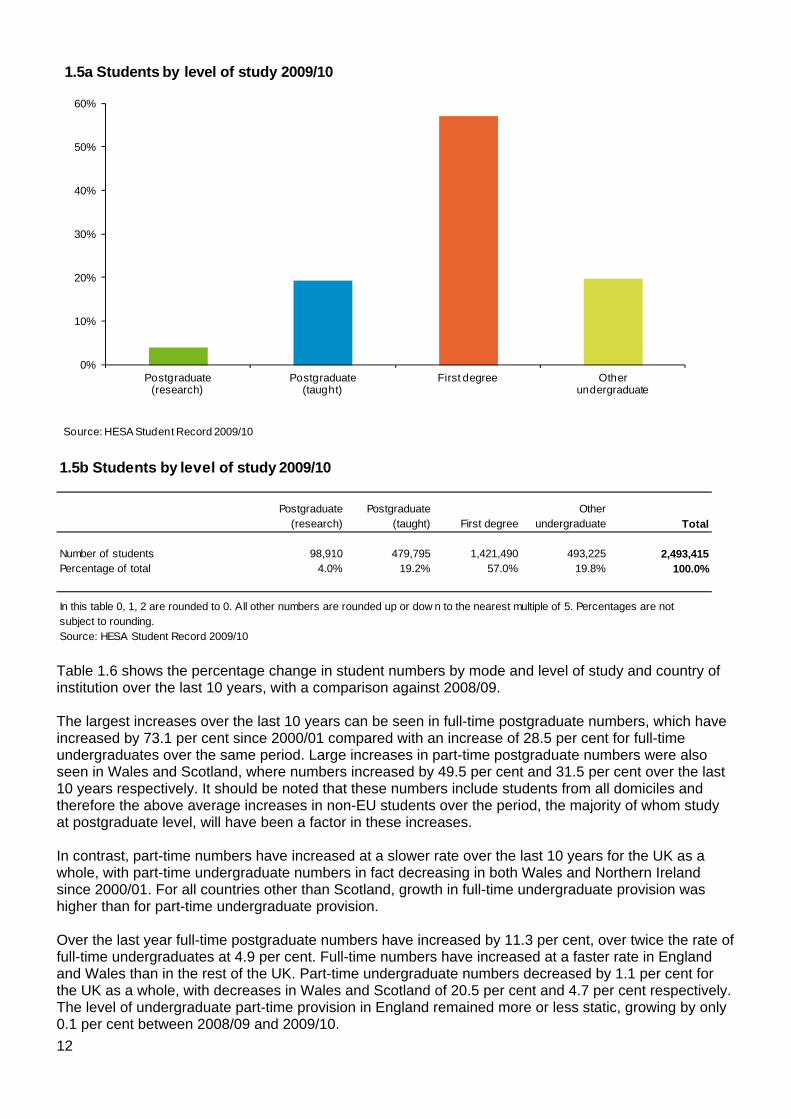
In this table 0, 1, 2 are rounded to 0. All other numbers are rounded up or dow n to the nearest multiple of 5.Source: HESA Student Record 2000/01, 2008/09, 2009/10 Chart 1.5a and Table 1.5b illustrate the proportions of all students at UK higher education institutions by level of study in 2009/10. Over half (57 per cent) were studying at first degree level and a further 19.8 per cent were studying towards an undergraduate qualification other than a first degree (other undergraduate qualification). The remaining students were studying postgraduate taught and postgraduate research courses, 19.2 per cent and four per cent respectively.
11
0%
10%
20%
30%
40%
50%
60%
Postgraduate (research)
Postgraduate (taught)
First degree Other undergraduate
1.5a Students by level of study 2009/10
Source: HESA Student Record 2009/10
Postgraduate (research)
Postgraduate (taught) First degree
Other undergraduate Total
Number of students 98,910 479,795 1,421,490 493,225 2,493,415Percentage of total 4.0% 19.2% 57.0% 19.8% 100.0%
Source: HESA Student Record 2009/10
In this table 0, 1, 2 are rounded to 0. All other numbers are rounded up or dow n to the nearest multiple of 5. Percentages are not subject to rounding.
1.5b Students by level of study 2009/10
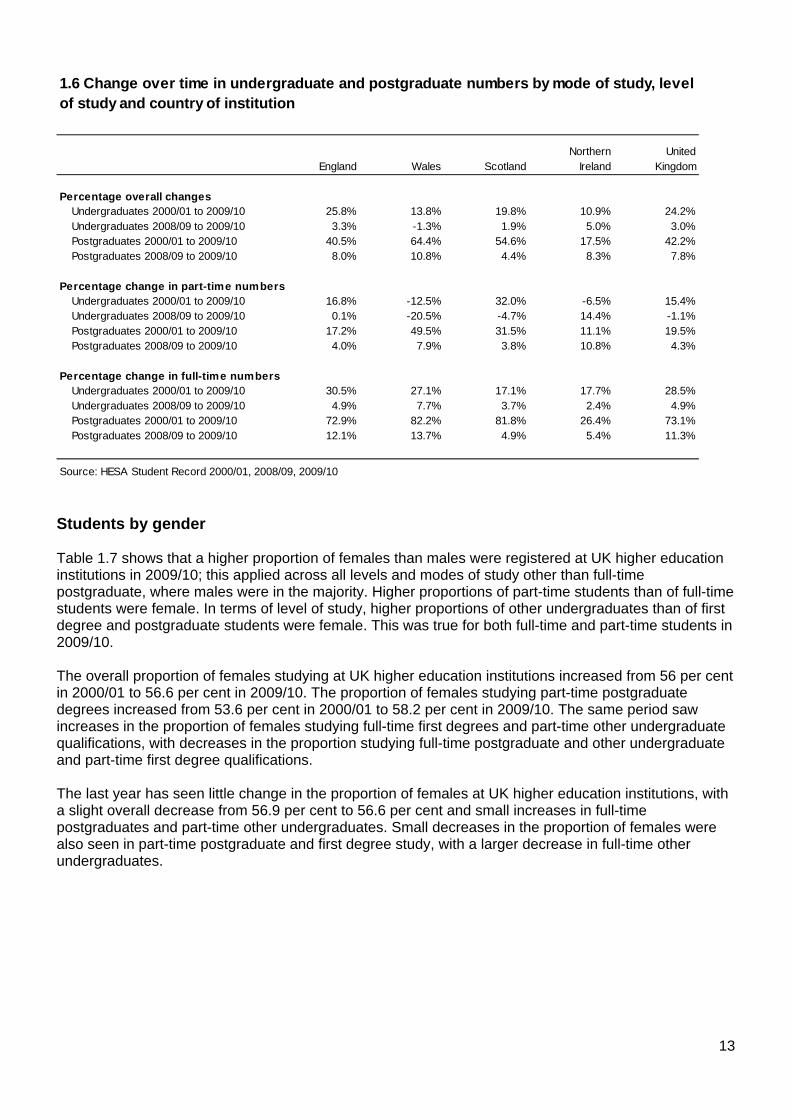
Table 1.6 shows the percentage change in student numbers by mode and level of study and country of institution over the last 10 years, with a comparison against 2008/09. The largest increases over the last 10 years can be seen in full-time postgraduate numbers, which have increased by 73.1 per cent since 2000/01 compared with an increase of 28.5 per cent for full-time undergraduates over the same period. Large increases in part-time postgraduate numbers were also seen in Wales and Scotland, where numbers increased by 49.5 per cent and 31.5 per cent over the last 10 years respectively. It should be noted that these numbers include students from all domiciles and therefore the above average increases in non-EU students over the period, the majority of whom study at postgraduate level, will have been a factor in these increases. In contrast, part-time numbers have increased at a slower rate over the last 10 years for the UK as a whole, with part-time undergraduate numbers in fact decreasing in both Wales and Northern Ireland since 2000/01. For all countries other than Scotland, growth in full-time undergraduate provision was higher than for part-time undergraduate provision. Over the last year full-time postgraduate numbers have increased by 11.3 per cent, over twice the rate of full-time undergraduates at 4.9 per cent. Full-time numbers have increased at a faster rate in England and Wales than in the rest of the UK. Part-time undergraduate numbers decreased by 1.1 per cent for the UK as a whole, with decreases in Wales and Scotland of 20.5 per cent and 4.7 per cent respectively. The level of undergraduate part-time provision in England remained more or less static, growing by only 0.1 per cent between 2008/09 and 2009/10. 12
England Wales ScotlandNorthern
IrelandUnited
Kingdom
Percentage overall changesUndergraduates 2000/01 to 2009/10 25.8% 13.8% 19.8% 10.9% 24.2%Undergraduates 2008/09 to 2009/10 3.3% -1.3% 1.9% 5.0% 3.0%Postgraduates 2000/01 to 2009/10 40.5% 64.4% 54.6% 17.5% 42.2%Postgraduates 2008/09 to 2009/10 8.0% 10.8% 4.4% 8.3% 7.8%
Percentage change in part-time numbersUndergraduates 2000/01 to 2009/10 16.8% -12.5% 32.0% -6.5% 15.4%Undergraduates 2008/09 to 2009/10 0.1% -20.5% -4.7% 14.4% -1.1%Postgraduates 2000/01 to 2009/10 17.2% 49.5% 31.5% 11.1% 19.5%Postgraduates 2008/09 to 2009/10 4.0% 7.9% 3.8% 10.8% 4.3%
Percentage change in full-time numbersUndergraduates 2000/01 to 2009/10 30.5% 27.1% 17.1% 17.7% 28.5%Undergraduates 2008/09 to 2009/10 4.9% 7.7% 3.7% 2.4% 4.9%Postgraduates 2000/01 to 2009/10 72.9% 82.2% 81.8% 26.4% 73.1%Postgraduates 2008/09 to 2009/10 12.1% 13.7% 4.9% 5.4% 11.3%
Source: HESA Student Record 2000/01, 2008/09, 2009/10
1.6 Change over time in undergraduate and postgraduate numbers by mode of study, level of study and country of institution
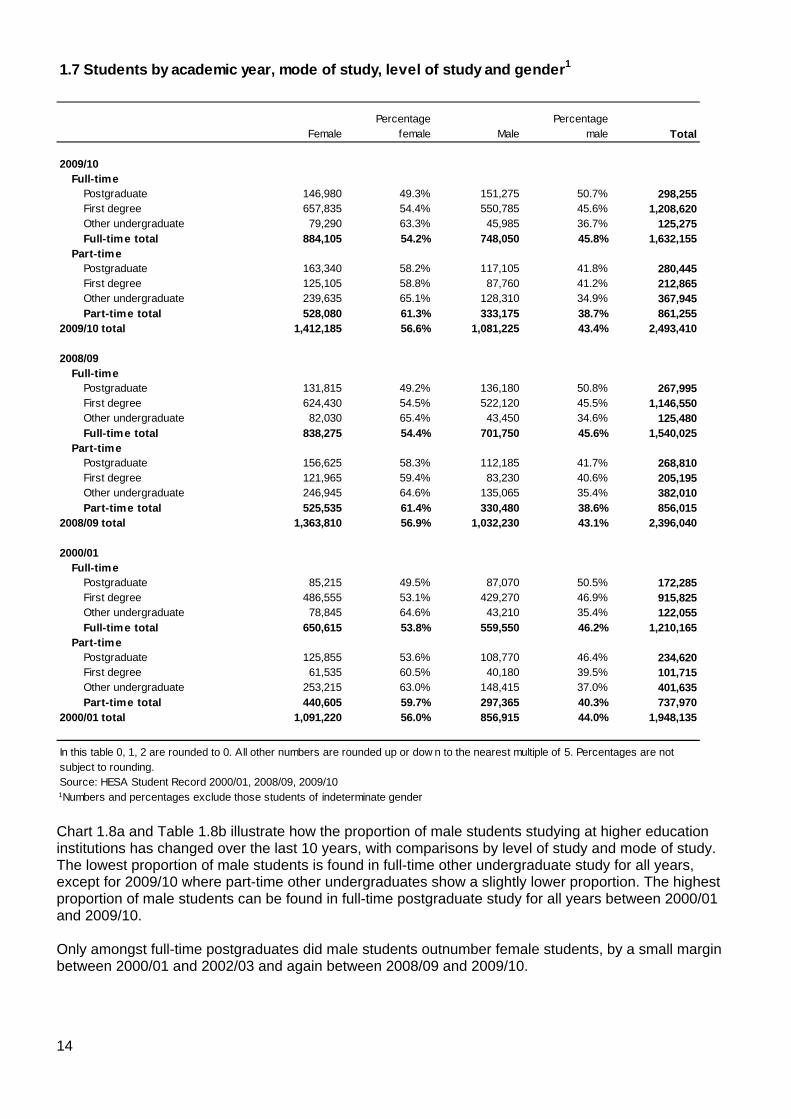
Students by gender Table 1.7 shows that a higher proportion of females than males were registered at UK higher education institutions in 2009/10; this applied across all levels and modes of study other than full-time postgraduate, where males were in the majority. Higher proportions of part-time students than of full-time students were female. In terms of level of study, higher proportions of other undergraduates than of first degree and postgraduate students were female. This was true for both full-time and part-time students in 2009/10. The overall proportion of females studying at UK higher education institutions increased from 56 per cent in 2000/01 to 56.6 per cent in 2009/10. The proportion of females studying part-time postgraduate degrees increased from 53.6 per cent in 2000/01 to 58.2 per cent in 2009/10. The same period saw increases in the proportion of females studying full-time first degrees and part-time other undergraduate qualifications, with decreases in the proportion studying full-time postgraduate and other undergraduate and part-time first degree qualifications. The last year has seen little change in the proportion of females at UK higher education institutions, with a slight overall decrease from 56.9 per cent to 56.6 per cent and small increases in full-time postgraduates and part-time other undergraduates. Small decreases in the proportion of females were also seen in part-time postgraduate and first degree study, with a larger decrease in full-time other undergraduates.
13
FemalePercentage
female MalePercentage
male Total
2009/10Full-time
Postgraduate 146,980 49.3% 151,275 50.7% 298,255First degree 657,835 54.4% 550,785 45.6% 1,208,620Other undergraduate 79,290 63.3% 45,985 36.7% 125,275Full-time total 884,105 54.2% 748,050 45.8% 1,632,155
Part-timePostgraduate 163,340 58.2% 117,105 41.8% 280,445First degree 125,105 58.8% 87,760 41.2% 212,865Other undergraduate 239,635 65.1% 128,310 34.9% 367,945Part-time total 528,080 61.3% 333,175 38.7% 861,255
2009/10 total 1,412,185 56.6% 1,081,225 43.4% 2,493,410
2008/09Full-time
Postgraduate 131,815 49.2% 136,180 50.8% 267,995First degree 624,430 54.5% 522,120 45.5% 1,146,550Other undergraduate 82,030 65.4% 43,450 34.6% 125,480Full-time total 838,275 54.4% 701,750 45.6% 1,540,025
Part-timePostgraduate 156,625 58.3% 112,185 41.7% 268,810First degree 121,965 59.4% 83,230 40.6% 205,195Other undergraduate 246,945 64.6% 135,065 35.4% 382,010Part-time total 525,535 61.4% 330,480 38.6% 856,015
2008/09 total 1,363,810 56.9% 1,032,230 43.1% 2,396,040
2000/01Full-time
Postgraduate 85,215 49.5% 87,070 50.5% 172,285First degree 486,555 53.1% 429,270 46.9% 915,825Other undergraduate 78,845 64.6% 43,210 35.4% 122,055Full-time total 650,615 53.8% 559,550 46.2% 1,210,165
Part-timePostgraduate 125,855 53.6% 108,770 46.4% 234,620First degree 61,535 60.5% 40,180 39.5% 101,715Other undergraduate 253,215 63.0% 148,415 37.0% 401,635Part-time total 440,605 59.7% 297,365 40.3% 737,970
2000/01 total 1,091,220 56.0% 856,915 44.0% 1,948,135
Source: HESA Student Record 2000/01, 2008/09, 2009/101Numbers and percentages exclude those students of indeterminate gender
1.7 Students by academic year, mode of study, level of study and gender1
In this table 0, 1, 2 are rounded to 0. All other numbers are rounded up or dow n to the nearest multiple of 5. Percentages are not subject to rounding.
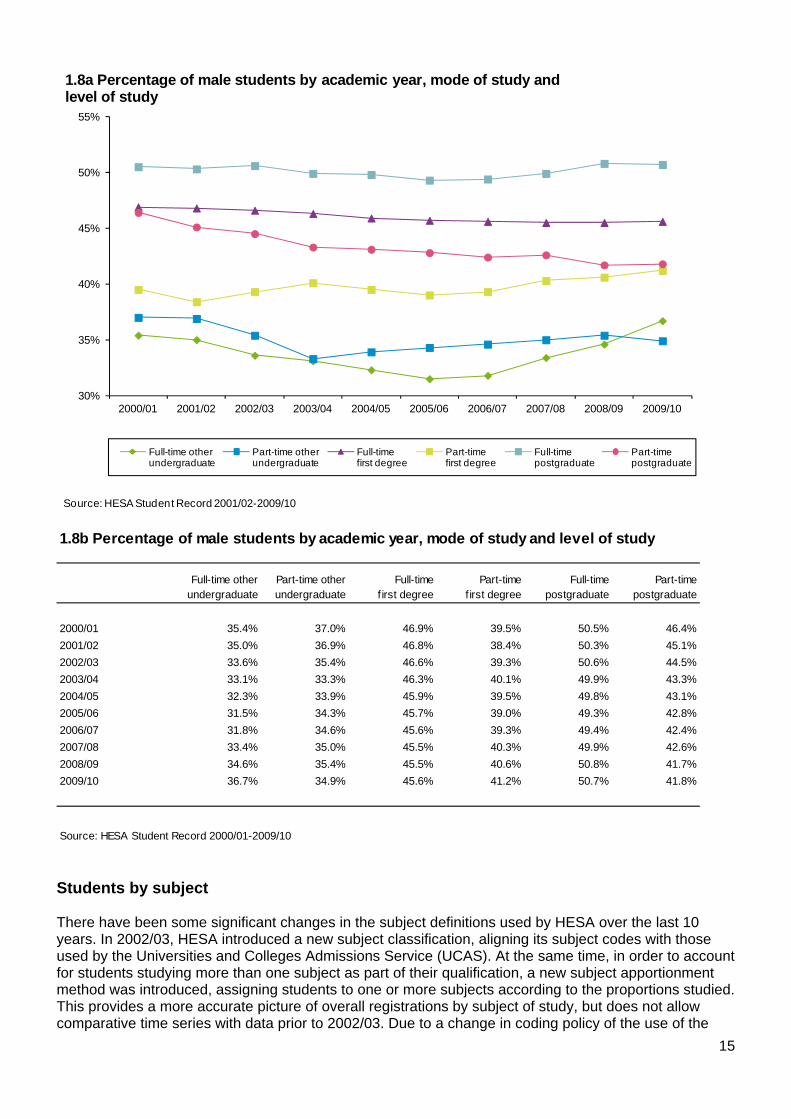
Chart 1.8a and Table 1.8b illustrate how the proportion of male students studying at higher education institutions has changed over the last 10 years, with comparisons by level of study and mode of study. The lowest proportion of male students is found in full-time other undergraduate study for all years, except for 2009/10 where part-time other undergraduates show a slightly lower proportion. The highest proportion of male students can be found in full-time postgraduate study for all years between 2000/01 and 2009/10. Only amongst full-time postgraduates did male students outnumber female students, by a small margin between 2000/01 and 2002/03 and again between 2008/09 and 2009/10.
14
30%
35%
40%
45%
50%
55%
2000/01 2001/02 2002/03 2003/04 2004/05 2005/06 2006/07 2007/08 2008/09 2009/10
1.8a Percentage of male students by academic year, mode of study and level of study
Full-time other undergraduate
Part-time other undergraduate
Full-time first degree
Part-time first degree
Full-time postgraduate
Part-time postgraduate
Source: HESA Student Record 2001/02-2009/10
Full-time other undergraduate
Part-time other undergraduate
Full-time f irst degree
Part-time f irst degree
Full-time postgraduate
Part-time postgraduate
2000/01 35.4% 37.0% 46.9% 39.5% 50.5% 46.4%2001/02 35.0% 36.9% 46.8% 38.4% 50.3% 45.1%2002/03 33.6% 35.4% 46.6% 39.3% 50.6% 44.5%2003/04 33.1% 33.3% 46.3% 40.1% 49.9% 43.3%2004/05 32.3% 33.9% 45.9% 39.5% 49.8% 43.1%2005/06 31.5% 34.3% 45.7% 39.0% 49.3% 42.8%2006/07 31.8% 34.6% 45.6% 39.3% 49.4% 42.4%2007/08 33.4% 35.0% 45.5% 40.3% 49.9% 42.6%2008/09 34.6% 35.4% 45.5% 40.6% 50.8% 41.7%2009/10 36.7% 34.9% 45.6% 41.2% 50.7% 41.8%
Source: HESA Student Record 2000/01-2009/10
1.8b Percentage of male students by academic year, mode of study and level of study
Students by subject There have been some significant changes in the subject definitions used by HESA over the last 10 years. In 2002/03, HESA introduced a new subject classification, aligning its subject codes with those used by the Universities and Colleges Admissions Service (UCAS). At the same time, in order to account for students studying more than one subject as part of their qualification, a new subject apportionment method was introduced, assigning students to one or more subjects according to the proportions studied. This provides a more accurate picture of overall registrations by subject of study, but does not allow comparative time series with data prior to 2002/03. Due to a change in coding policy of the use of the
15
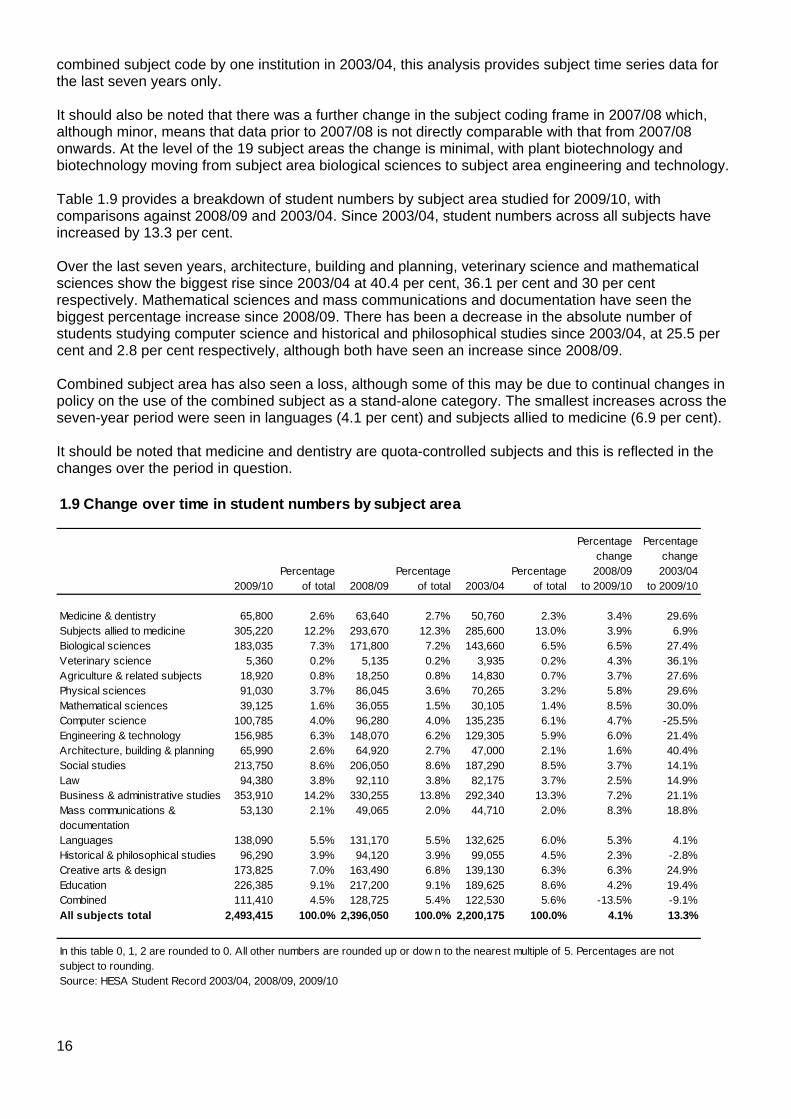
combined subject code by one institution in 2003/04, this analysis provides subject time series data for the last seven years only. It should also be noted that there was a further change in the subject coding frame in 2007/08 which, although minor, means that data prior to 2007/08 is not directly comparable with that from 2007/08 onwards. At the level of the 19 subject areas the change is minimal, with plant biotechnology and biotechnology moving from subject area biological sciences to subject area engineering and technology. Table 1.9 provides a breakdown of student numbers by subject area studied for 2009/10, with comparisons against 2008/09 and 2003/04. Since 2003/04, student numbers across all subjects have increased by 13.3 per cent. Over the last seven years, architecture, building and planning, veterinary science and mathematical sciences show the biggest rise since 2003/04 at 40.4 per cent, 36.1 per cent and 30 per cent respectively. Mathematical sciences and mass communications and documentation have seen the biggest percentage increase since 2008/09. There has been a decrease in the absolute number of students studying computer science and historical and philosophical studies since 2003/04, at 25.5 per cent and 2.8 per cent respectively, although both have seen an increase since 2008/09. Combined subject area has also seen a loss, although some of this may be due to continual changes in policy on the use of the combined subject as a stand-alone category. The smallest increases across the seven-year period were seen in languages (4.1 per cent) and subjects allied to medicine (6.9 per cent). It should be noted that medicine and dentistry are quota-controlled subjects and this is reflected in the changes over the period in question.
2009/10Percentage
of total 2008/09Percentage
of total 2003/04Percentage
of total
Percentage change 2008/09
to 2009/10
Percentage change 2003/04
to 2009/10
Medicine & dentistry 65,800 2.6% 63,640 2.7% 50,760 2.3% 3.4% 29.6%Subjects allied to medicine 305,220 12.2% 293,670 12.3% 285,600 13.0% 3.9% 6.9%Biological sciences 183,035 7.3% 171,800 7.2% 143,660 6.5% 6.5% 27.4%Veterinary science 5,360 0.2% 5,135 0.2% 3,935 0.2% 4.3% 36.1%Agriculture & related subjects 18,920 0.8% 18,250 0.8% 14,830 0.7% 3.7% 27.6%Physical sciences 91,030 3.7% 86,045 3.6% 70,265 3.2% 5.8% 29.6%Mathematical sciences 39,125 1.6% 36,055 1.5% 30,105 1.4% 8.5% 30.0%Computer science 100,785 4.0% 96,280 4.0% 135,235 6.1% 4.7% -25.5%Engineering & technology 156,985 6.3% 148,070 6.2% 129,305 5.9% 6.0% 21.4%Architecture, building & planning 65,990 2.6% 64,920 2.7% 47,000 2.1% 1.6% 40.4%Social studies 213,750 8.6% 206,050 8.6% 187,290 8.5% 3.7% 14.1%Law 94,380 3.8% 92,110 3.8% 82,175 3.7% 2.5% 14.9%Business & administrative studies 353,910 14.2% 330,255 13.8% 292,340 13.3% 7.2% 21.1%Mass communications & documentation
53,130 2.1% 49,065 2.0% 44,710 2.0% 8.3% 18.8%
Languages 138,090 5.5% 131,170 5.5% 132,625 6.0% 5.3% 4.1%Historical & philosophical studies 96,290 3.9% 94,120 3.9% 99,055 4.5% 2.3% -2.8%Creative arts & design 173,825 7.0% 163,490 6.8% 139,130 6.3% 6.3% 24.9%Education 226,385 9.1% 217,200 9.1% 189,625 8.6% 4.2% 19.4%Combined 111,410 4.5% 128,725 5.4% 122,530 5.6% -13.5% -9.1%All subjects total 2,493,415 100.0% 2,396,050 100.0% 2,200,175 100.0% 4.1% 13.3%
Source: HESA Student Record 2003/04, 2008/09, 2009/10
1.9 Change over time in student numbers by subject area
In this table 0, 1, 2 are rounded to 0. All other numbers are rounded up or dow n to the nearest multiple of 5. Percentages are not subject to rounding.
16
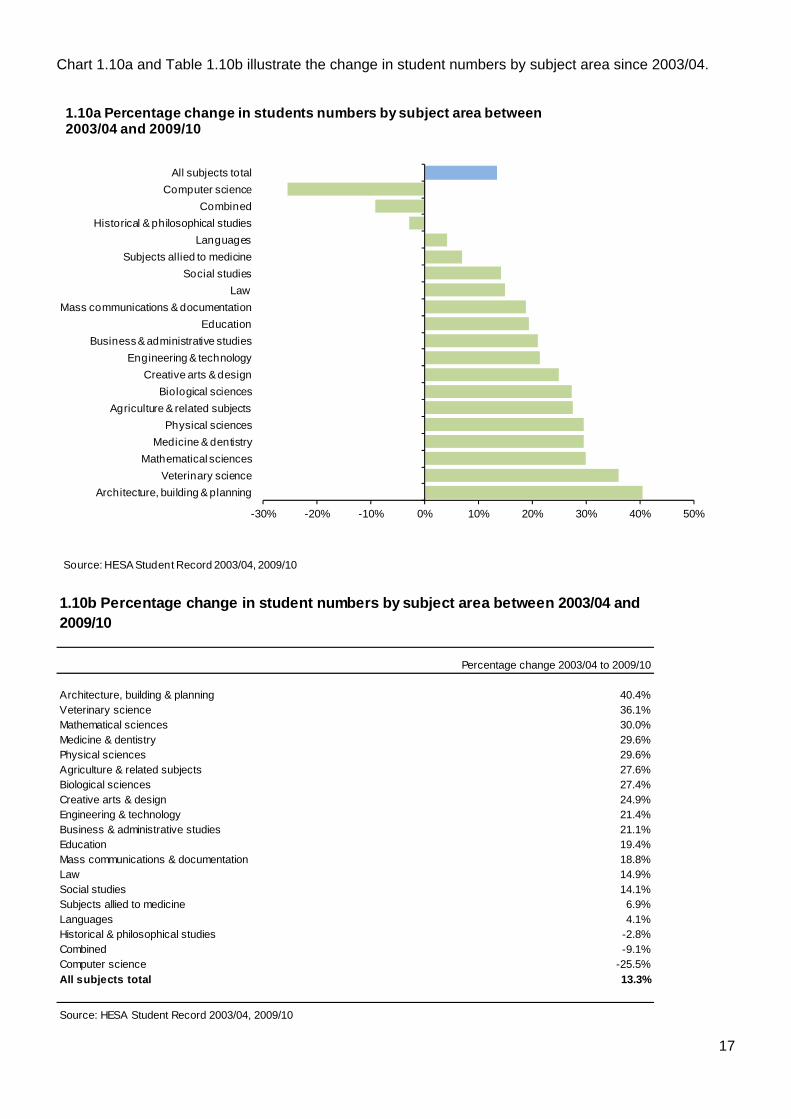
Chart 1.10a and Table 1.10b illustrate the change in student numbers by subject area since 2003/04.
-30% -20% -10% 0% 10% 20% 30% 40% 50%
Architecture, building & planningVeterinary science
Mathematical sciencesMedicine & dentistry
Physical sciencesAgriculture & related subjects
Biological sciencesCreative arts & design
Engineering & technologyBusiness & administrative studies
EducationMass communications & documentation
LawSocial studies
Subjects allied to medicineLanguages
Historical & philosophical studiesCombined
Computer scienceAll subjects total
1.10a Percentage change in students numbers by subject area between 2003/04 and 2009/10
Source: HESA Student Record 2003/04, 2009/10
Percentage change 2003/04 to 2009/10
Architecture, building & planning 40.4%Veterinary science 36.1%Mathematical sciences 30.0%Medicine & dentistry 29.6%Physical sciences 29.6%Agriculture & related subjects 27.6%Biological sciences 27.4%Creative arts & design 24.9%Engineering & technology 21.4%Business & administrative studies 21.1%Education 19.4%Mass communications & documentation 18.8%Law 14.9%Social studies 14.1%Subjects allied to medicine 6.9%Languages 4.1%Historical & philosophical studies -2.8%Combined -9.1%Computer science -25.5%All subjects total 13.3%
Source: HESA Student Record 2003/04, 2009/10
1.10b Percentage change in student numbers by subject area between 2003/04 and 2009/10
17
18
Appendix 2 provides a full breakdown of all students by individual subject of study, using the 2009/10 subject labels. Changes to the subject coding frame in 2007/08 had slightly more impact at individual subject level than at subject area level, so care should be taken when interpreting the time series data shown in Appendix 26. With this caveat in mind, the following changes by subject of study between 2003/04 and 2009/10 can be seen:
• Numbers in medicine increased by 29.6 per cent over the period in question, which is above the overall increase of 13.3 per cent for all subjects. Changes in the structure of clinical degrees have led to a shift from pre-clinical to clinical studies.
• Subjects allied to medicine showed a below average increase of 6.9 per cent since 2003/04. This
included a 4.4 per cent decrease in the number of students studying nursing, who accounted for 58.3 per cent of students in this subject area in 2009/10. Large increases were seen in pharmacology, toxicology and pharmacy (50.2 per cent), complementary medicine (86.9 per cent) and nutrition (98 per cent) since 2003/04. Between 2008/09 and 2009/10 all subjects of study in this group saw increases apart from anatomy, physiology and pathology, which saw a 0.1 per cent decrease in student numbers.
• Within biological sciences there was considerable variation between 2003/04 and 2009/10 in the number of students studying certain subjects, with increases in the numbers studying general biology (17.1 per cent), zoology (8.3 per cent), sports science (73 per cent) and psychology (30.1 per cent) and decreases in botany (21.3 per cent), genetics (10.9 per cent) and microbiology (18.6 per cent). All subjects other than genetics (2.2 per cent decrease) saw increases between 2008/09 and 2009/10.
• Veterinary science showed an above average increase of 36.1 per cent between 2003/04 and 2009/10.
• All subjects under physical sciences, other than physical geographical sciences (15.4 per cent decrease) and broadly-based programmes within physical sciences (3.1 per cent decrease), saw increases since 2003/04. Large increases were particularly evident in forensic and archaeological science (157.6 per cent), science of aquatic and terrestrial environments (521.9 per cent) and astronomy (47 per cent). Since 2008/09 only materials science showed a small decrease (of 0.3 per cent).
• As in previous years mathematics continues to show increases from both 2003/04 (44.9 per cent) and 2008/09 (7.9 per cent). Statistics showed a below total increase of 11.1 per cent since 2003/04 but an above total increase of 11.9 per cent since 2008/09.
• Within computer science all subjects recorded decreases between 2003/04 and 2009/10, with particularly large decreases in information systems (34.5 per cent) and general computer science (23.3 per cent). Over the last year, however, all subjects showed increases, with software engineering (9.1 per cent) and artificial intelligence (9.3 per cent) increasing at a greater rate than the total figure for all subjects.
• Overall numbers in engineering increased by 21.4 per cent since 2003/04 and six per cent since 2008/09, both above the increase seen for all subjects. Between 2003/04 and 2009/10 decreases were seen in production and manufacturing engineering, metallurgy, electronic and electrical engineering, and ceramics and glasses. Over the last year, ceramics and glasses and maritime technology showed decreases of 22.7 per cent and 4.9 per cent respectively.
6 Full details of the changes can be found at http://www.hesa.ac.uk/C07051/mappingJACS
19
• Although reporting increases in students since 2003/04, with particularly large increases in architecture and building architecture, building and planning showed a below total increase of 1.6 per cent between 2008/09 and 2009/10.
• All subjects within social studies showed an above total increase except for anthropology, which showed a below total increase of 6.3 per cent, and human and social geography, which decreased by 18.9 per cent between 2003/04 and 2009/10. Since 2008/09 most subjects showed increases, but social policy showed a decrease of 2.5 per cent.
• Law showed an above total increase of 14.9 per cent since 2003/04 and a below total increase of 2.5 per cent between 2008/9 and 2009/10.
• Significant increases within business and administrative studies since 2003/04 were shown by management studies (42.2 per cent), finance (86.6 per cent), accounting (18.5 per cent) and marketing (13 per cent). Since 2008/09 only office skills showed a decrease in student numbers (of 8.5 per cent).
• Although overall increases in mass communications and documentation since 2003/04 and 2008/09 were close to the overall increase for all subjects, there was significant variation amongst subjects within this group, with large increases in journalism and media studies over both the last seven years and last year. In contrast, publishing saw a decrease in numbers since 2003/04.
• Languages showed the smallest increase in student numbers amongst subjects showing growth over the last seven years. Over the last year, however, the rate of increase has grown and is now above that seen for all subjects. Within languages significant decreases since 2003/04 were shown by Celtic, Latin, Classical Greek, Italian, Scandinavian and South Asian studies. Over the same period significant increases were shown by ancient language studies, classical studies, Chinese and Japanese.
• Historical and philosophical studies showed a small decrease in numbers since 2003/04 of 2.8 per cent, with a slight increase since 2008/09. Archaeology showed decreases over both the last seven years and the last year.
• Since 2003/04 numbers in creative arts and design have increased at a rate above that seen for all students. Over the same period, within creative arts and design, significant increases have been shown by music, dance, cinematics and photography, and imaginative writing.
• Education increased by 19.4 per cent over the period 2003/04 to 2009/10, with teacher training increasing by 22.7 per cent over the same period.
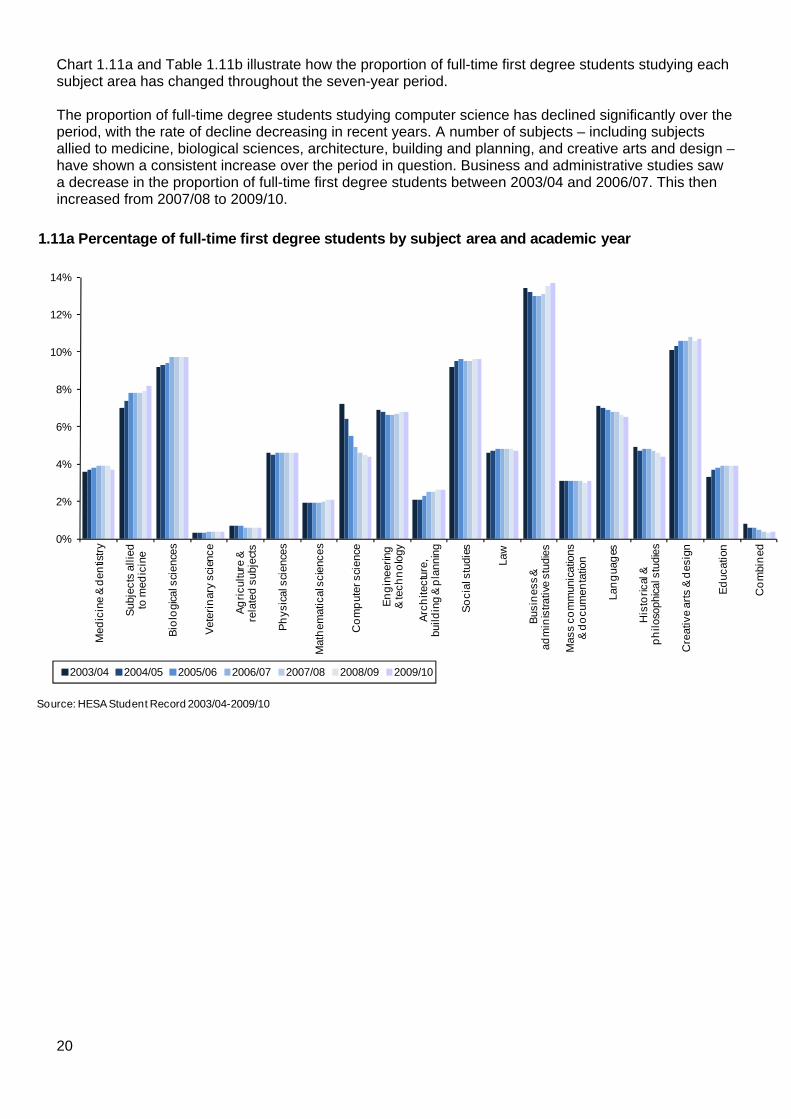
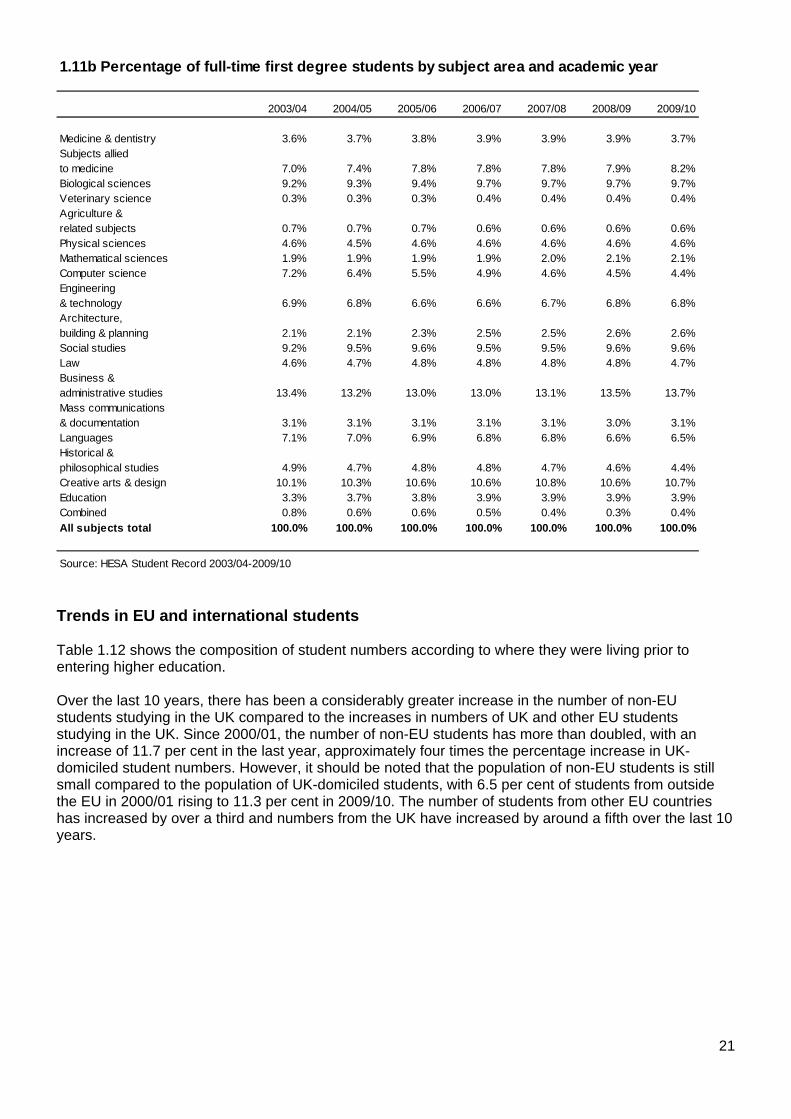
Chart 1.11a and Table 1.11b illustrate how the proportion of full-time first degree students studying each subject area has changed throughout the seven-year period. The proportion of full-time degree students studying computer science has declined significantly over the period, with the rate of decline decreasing in recent years. A number of subjects – including subjects allied to medicine, biological sciences, architecture, building and planning, and creative arts and design – have shown a consistent increase over the period in question. Business and administrative studies saw a decrease in the proportion of full-time first degree students between 2003/04 and 2006/07. This then increased from 2007/08 to 2009/10.
0%
2%
4%
6%
8%
10%
12%
14%
Med
icin
e &
dent
istry
Subj
ects
alli
ed
to m
edic
ine
Biol
ogica
l sci
ence
s
Vete
rinar
y sc
ienc
e
Agric
ultu
re &
re
late
d su
bjec
ts
Phys
ical
sci
ence
s
Mat
hem
atic
al s
cien
ces
Com
pute
r sci
ence
Engi
neer
ing
& te
chno
logy
Arch
itect
ure,
bu
ildin
g &
plan
ning
Soci
al s
tudi
es
Law
Busi
ness
&
adm
inis
trativ
e st
udie
s
Mas
s co
mm
unic
atio
ns
& do
cum
enta
tion
Lang
uage
s
His
toric
al &
ph
iloso
phica
l stu
dies
Cre
ativ
e ar
ts &
des
ign
Educ
atio
n
Com
bine
d
1.11a Percentage of full-time first degree students by subject area and academic year
2003/04 2004/05 2005/06 2006/07 2007/08 2008/09 2009/10
Source: HESA Student Record 2003/04-2009/10
20
2003/04 2004/05 2005/06 2006/07 2007/08 2008/09 2009/10
Medicine & dentistry 3.6% 3.7% 3.8% 3.9% 3.9% 3.9% 3.7%Subjects allied to medicine 7.0% 7.4% 7.8% 7.8% 7.8% 7.9% 8.2%Biological sciences 9.2% 9.3% 9.4% 9.7% 9.7% 9.7% 9.7%Veterinary science 0.3% 0.3% 0.3% 0.4% 0.4% 0.4% 0.Agriculture & related subjects 0.7% 0.7% 0.7% 0.6% 0.6% 0.6% 0.6%Physical sciences 4.6% 4.5% 4.6% 4.6% 4.6% 4.6% 4.6%Mathematical sciences 1.9% 1.9% 1.9% 1.9% 2.0% 2.1% 2.1%Computer science 7.2% 6.4% 5.5% 4.9% 4.6% 4.5% 4.Engineering & technology 6.9% 6.8% 6.6% 6.6% 6.7% 6.8% 6.8%Architecture, building & planning 2.1% 2.1% 2.3% 2.5% 2.5% 2.6% 2.6%Social studies 9.2% 9.5% 9.6% 9.5% 9.5% 9.6% 9.6%Law 4.6% 4.7% 4.8% 4.8% 4.8% 4.8% 4.7%Business & administrative studies 13.4% 13.2% 13.0% 13.0% 13.1% 13.5% 13.7%Mass communications & documentation 3.1% 3.1% 3.1% 3.1% 3.1% 3.0% 3.Languages 7.1% 7.0% 6.9% 6.8% 6.8% 6.6% 6.5%Historical & philosophical studies 4.9% 4.7% 4.8% 4.8% 4.7% 4.6% 4.4%Creative arts & design 10.1% 10.3% 10.6% 10.6% 10.8% 10.6% 10.7%Education 3.3% 3.7% 3.8% 3.9% 3.9% 3.9% 3.Combined 0.8% 0.6% 0.6% 0.5% 0.4% 0.3% 0.4%All subjects total 100.0% 100.0% 100.0% 100.0% 100.0% 100.0% 100.0%
Source: HESA Student Record 2003/04-2009/10
1.11b Percentage of full-time first degree students by subject area and academic year
4%
4%
1%
9%
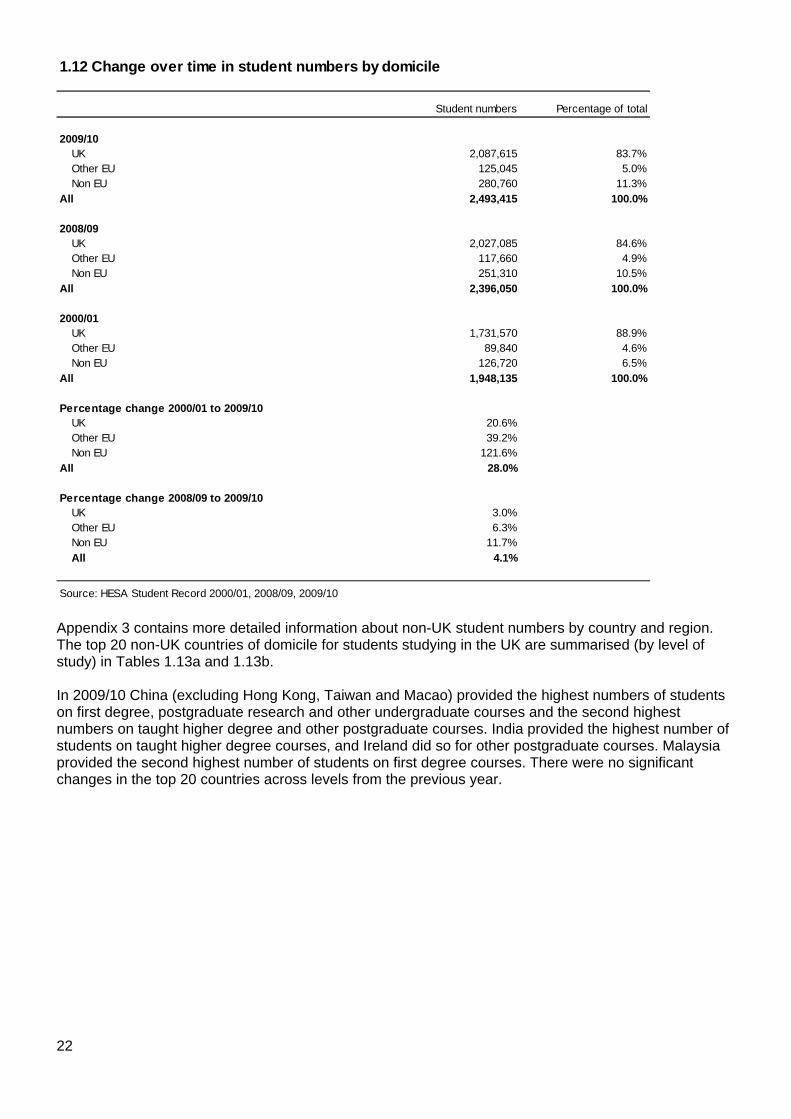
Trends in EU and international students Table 1.12 shows the composition of student numbers according to where they were living prior to entering higher education. Over the last 10 years, there has been a considerably greater increase in the number of non-EU students studying in the UK compared to the increases in numbers of UK and other EU students studying in the UK. Since 2000/01, the number of non-EU students has more than doubled, with an increase of 11.7 per cent in the last year, approximately four times the percentage increase in UK-domiciled student numbers. However, it should be noted that the population of non-EU students is still small compared to the population of UK-domiciled students, with 6.5 per cent of students from outside the EU in 2000/01 rising to 11.3 per cent in 2009/10. The number of students from other EU countries has increased by over a third and numbers from the UK have increased by around a fifth over the last 10 years.
21
Student numbers Percentage of total
2009/10UK 2,087,615 83.7%Other EU 125,045 5.0%Non EU 280,760 11.3%
All 2,493,415 100.0%
2008/09UK 2,027,085 84.6%Other EU 117,660 4.9%Non EU 251,310 10.5%
All 2,396,050 100.0%
2000/01UK 1,731,570 88.9%Other EU 89,840 4.6%Non EU 126,720 6.5%
All 1,948,135 100.0%
Percentage change 2000/01 to 2009/10UK 20.6%Other EU 39.2%Non EU 121.6%
All 28.0%
Percentage change 2008/09 to 2009/10UK 3.0%Other EU 6.3%Non EU 11.7%All 4.1%
Source: HESA Student Record 2000/01, 2008/09, 2009/10
1.12 Change over time in student numbers by domicile
Appendix 3 contains more detailed information about non-UK student numbers by country and region. The top 20 non-UK countries of domicile for students studying in the UK are summarised (by level of study) in Tables 1.13a and 1.13b. In 2009/10 China (excluding Hong Kong, Taiwan and Macao) provided the highest numbers of students on first degree, postgraduate research and other undergraduate courses and the second highest numbers on taught higher degree and other postgraduate courses. India provided the highest number of students on taught higher degree courses, and Ireland did so for other postgraduate courses. Malaysia provided the second highest number of students on first degree courses. There were no significant changes in the top 20 countries across levels from the previous year.
22
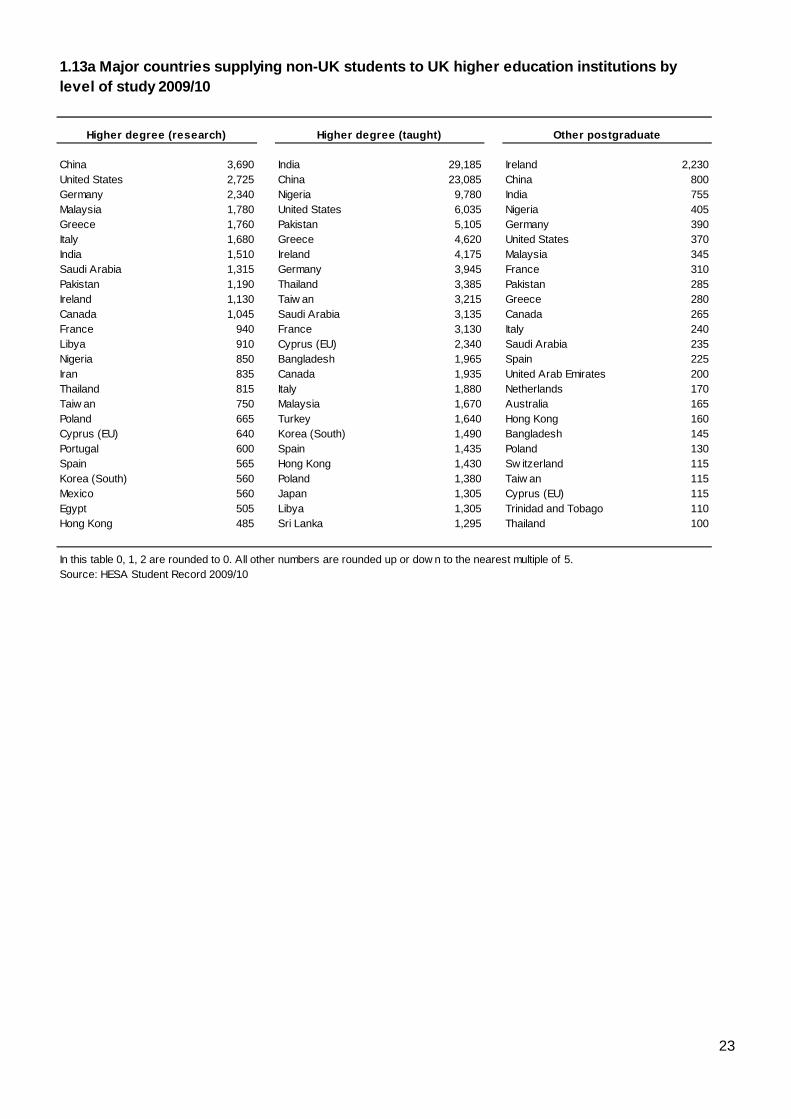
China 3,690 India 29,185 Ireland 2,230United States 2,725 China 23,085 China 800Germany 2,340 Nigeria 9,780 India 755Malaysia 1,780 United States 6,035 Nigeria 405Greece 1,760 Pakistan 5,105 Germany 390Italy 1,680 Greece 4,620 United States 370India 1,510 Ireland 4,175 Malaysia 345Saudi Arabia 1,315 Germany 3,945 France 310Pakistan 1,190 Thailand 3,385 Pakistan 285Ireland 1,130 Taiw an 3,215 Greece 280Canada 1,045 Saudi Arabia 3,135 Canada 265France 940 France 3,130 Italy 240Libya 910 Cyprus (EU) 2,340 Saudi Arabia 235Nigeria 850 Bangladesh 1,965 Spain 225Iran 835 Canada 1,935 United Arab Emirates 200Thailand 815 Italy 1,880 Netherlands 170Taiw an 750 Malaysia 1,670 Australia 165Poland 665 Turkey 1,640 Hong Kong 160Cyprus (EU) 640 Korea (South) 1,490 Bangladesh 145Portugal 600 Spain 1,435 Poland 130Spain 565 Hong Kong 1,430 Sw itzerland 115Korea (South) 560 Poland 1,380 Taiw an 115Mexico 560 Japan 1,305 Cyprus (EU) 115Egypt 505 Libya 1,305 Trinidad and Tobago 110Hong Kong 485 Sri Lanka 1,295 Thailand 100
In this table 0, 1, 2 are rounded to 0. All other numbers are rounded up or dow n to the nearest multiple of 5. Source: HESA Student Record 2009/10
1.13a Major countries supplying non-UK students to UK higher education institutions by level of study 2009/10
Other postgraduateHigher degree (research) Higher degree (taught)
23
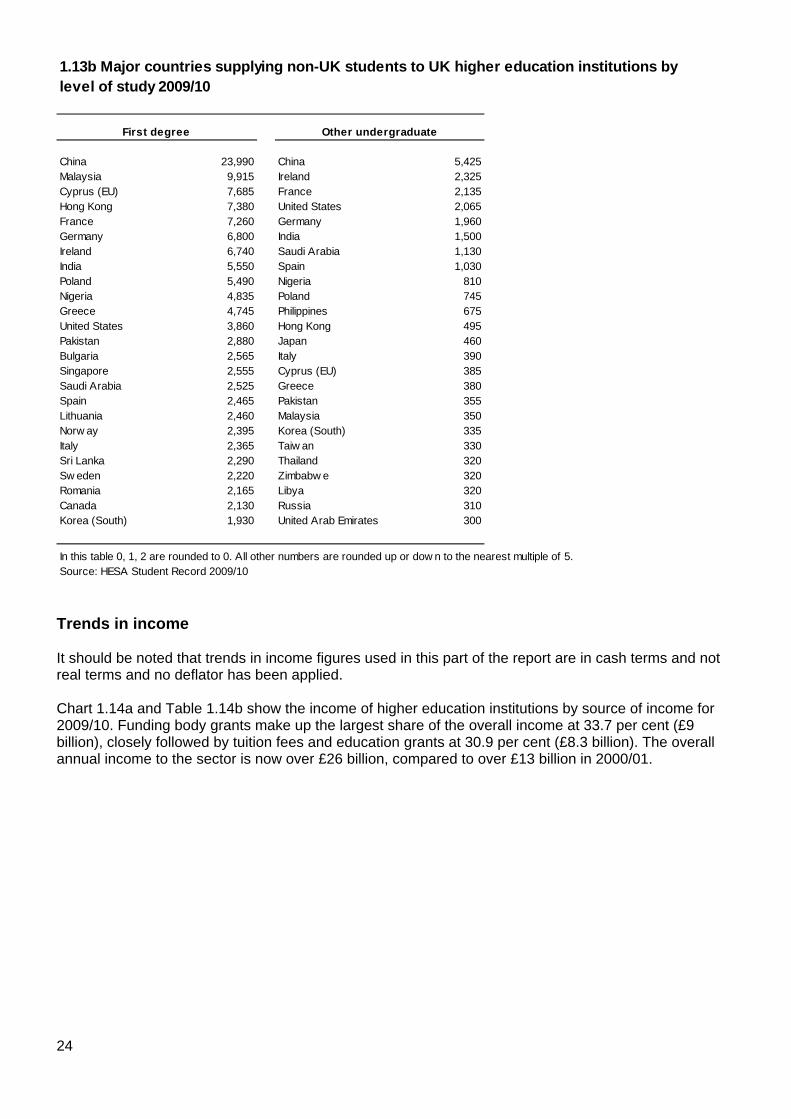
China 23,990 China 5,425Malaysia 9,915 Ireland 2,325Cyprus (EU) 7,685 France 2,135Hong Kong 7,380 United States 2,065France 7,260 Germany 1,960Germany 6,800 India 1,500Ireland 6,740 Saudi Arabia 1,130India 5,550 Spain 1,030Poland 5,490 Nigeria 810Nigeria 4,835 Poland 745Greece 4,745 Philippines 675United States 3,860 Hong Kong 495Pakistan 2,880 Japan 460Bulgaria 2,565 Italy 390Singapore 2,555 Cyprus (EU) 385Saudi Arabia 2,525 Greece 380Spain 2,465 Pakistan 355Lithuania 2,460 Malaysia 350Norw ay 2,395 Korea (South) 335Italy 2,365 Taiw an 330Sri Lanka 2,290 Thailand 320Sw eden 2,220 Zimbabw e 320Romania 2,165 Libya 320Canada 2,130 Russia 310Korea (South) 1,930 United Arab Emirates 300
In this table 0, 1, 2 are rounded to 0. All other numbers are rounded up or dow n to the nearest multiple of 5. Source: HESA Student Record 2009/10
1.13b Major countries supplying non-UK students to UK higher education institutions by level of study 2009/10
Other undergraduateFirst degree
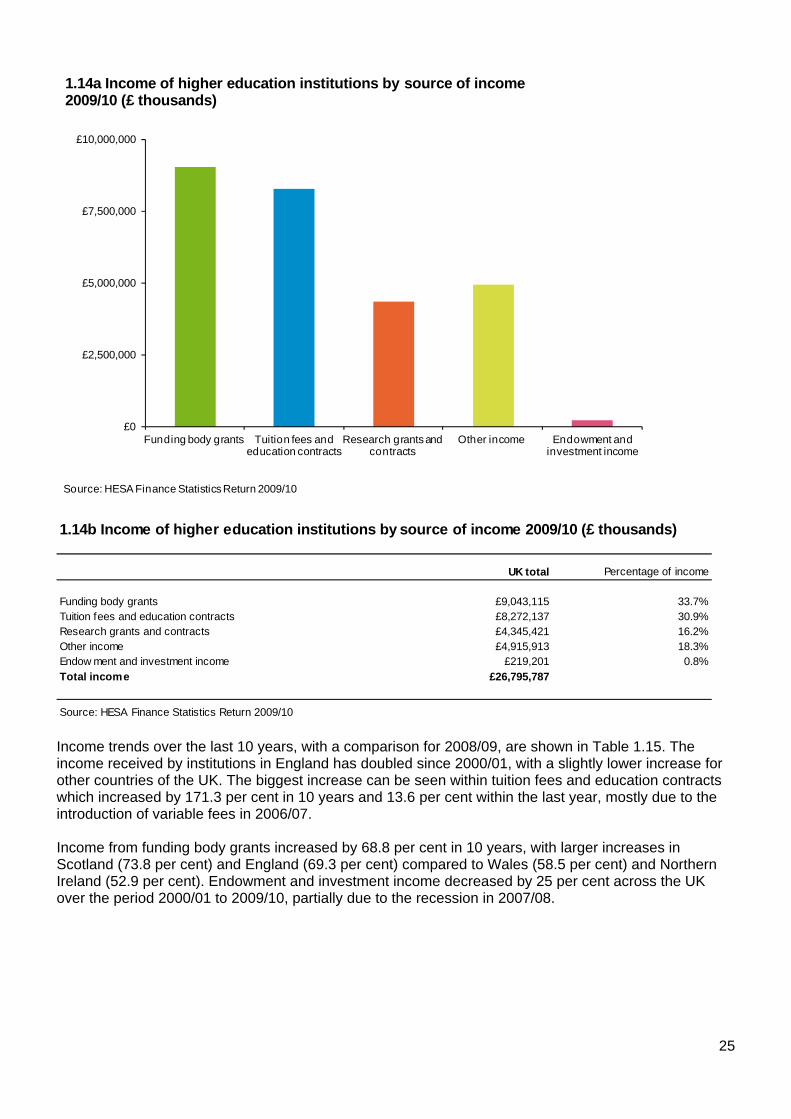
Trends in income It should be noted that trends in income figures used in this part of the report are in cash terms and not real terms and no deflator has been applied. Chart 1.14a and Table 1.14b show the income of higher education institutions by source of income for 2009/10. Funding body grants make up the largest share of the overall income at 33.7 per cent (£9 billion), closely followed by tuition fees and education grants at 30.9 per cent (£8.3 billion). The overall annual income to the sector is now over £26 billion, compared to over £13 billion in 2000/01.
24
£0
£2,500,000
£5,000,000
£7,500,000
£10,000,000
Funding body grants Tuition fees and education contracts
Research grants and contracts
Other income Endowment and investment income
1.14a Income of higher education institutions by source of income 2009/10 (£ thousands)
Source: HESA Finance Statistics Return 2009/10
UK total Percentage of income
Funding body grants £9,043,115 33.7%Tuition fees and education contracts £8,272,137 30.9%Research grants and contracts £4,345,421 16.2%Other income £4,915,913 18.3%Endow ment and investment income £219,201 0.8%Total income £26,795,787
Source: HESA Finance Statistics Return 2009/10
1.14b Income of higher education institutions by source of income 2009/10 (£ thousands)
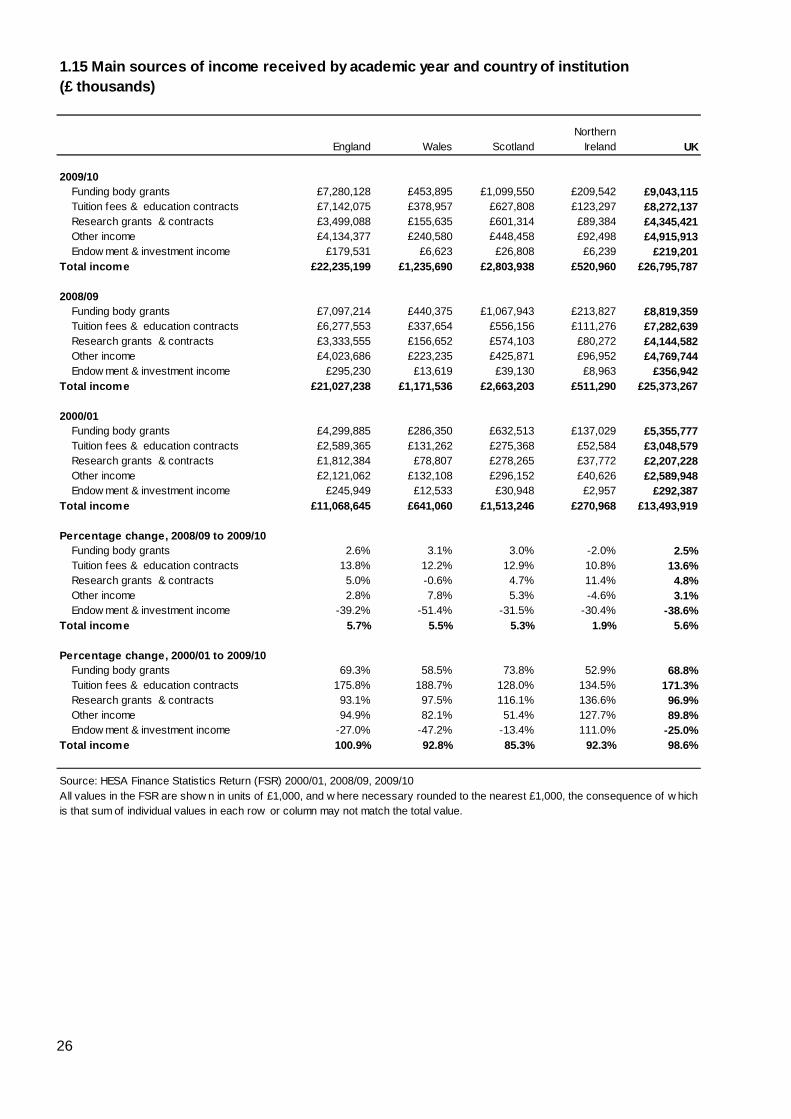
Income trends over the last 10 years, with a comparison for 2008/09, are shown in Table 1.15. The income received by institutions in England has doubled since 2000/01, with a slightly lower increase for other countries of the UK. The biggest increase can be seen within tuition fees and education contracts which increased by 171.3 per cent in 10 years and 13.6 per cent within the last year, mostly due to the introduction of variable fees in 2006/07. Income from funding body grants increased by 68.8 per cent in 10 years, with larger increases in Scotland (73.8 per cent) and England (69.3 per cent) compared to Wales (58.5 per cent) and Northern Ireland (52.9 per cent). Endowment and investment income decreased by 25 per cent across the UK over the period 2000/01 to 2009/10, partially due to the recession in 2007/08.
25
England Wales ScotlandNorthern
Ireland UK
2009/10Funding body grants £7,280,128 £453,895 £1,099,550 £209,542 £9,043,115Tuition fees & education contracts £7,142,075 £378,957 £627,808 £123,297 £8,272,137Research grants & contracts £3,499,088 £155,635 £601,314 £89,384 £4,345,421Other income £4,134,377 £240,580 £448,458 £92,498 £4,915,913Endow ment & investment income £179,531 £6,623 £26,808 £6,239 £219,201
Total income £22,235,199 £1,235,690 £2,803,938 £520,960 £26,795,787
2008/09Funding body grants £7,097,214 £440,375 £1,067,943 £213,827 £8,819,359Tuition fees & education contracts £6,277,553 £337,654 £556,156 £111,276 £7,282,639Research grants & contracts £3,333,555 £156,652 £574,103 £80,272 £4,144,582Other income £4,023,686 £223,235 £425,871 £96,952 £4,769,744Endow ment & investment income £295,230 £13,619 £39,130 £8,963 £356,942
Total income £21,027,238 £1,171,536 £2,663,203 £511,290 £25,373,267
2000/01Funding body grants £4,299,885 £286,350 £632,513 £137,029 £5,355,777Tuition fees & education contracts £2,589,365 £131,262 £275,368 £52,584 £3,048,579Research grants & contracts £1,812,384 £78,807 £278,265 £37,772 £2,207,228Other income £2,121,062 £132,108 £296,152 £40,626 £2,589,948Endow ment & investment income £245,949 £12,533 £30,948 £2,957 £292,387
Total income £11,068,645 £641,060 £1,513,246 £270,968 £13,493,919
Percentage change, 2008/09 to 2009/10Funding body grants 2.6% 3.1% 3.0% -2.0% 2.5%Tuition fees & education contracts 13.8% 12.2% 12.9% 10.8% 13.6%Research grants & contracts 5.0% -0.6% 4.7% 11.4% 4.8%Other income 2.8% 7.8% 5.3% -4.6% 3.1%Endow ment & investment income -39.2% -51.4% -31.5% -30.4% -38.6%
Total income 5.7% 5.5% 5.3% 1.9% 5.6%
Percentage change, 2000/01 to 2009/10Funding body grants 69.3% 58.5% 73.8% 52.9% 68.8%Tuition fees & education contracts 175.8% 188.7% 128.0% 134.5% 171.3%Research grants & contracts 93.1% 97.5% 116.1% 136.6% 96.9%Other income 94.9% 82.1% 51.4% 127.7% 89.8%Endow ment & investment income -27.0% -47.2% -13.4% 111.0% -25.0%
Total income 100.9% 92.8% 85.3% 92.3% 98.6%
Source: HESA Finance Statistics Return (FSR) 2000/01, 2008/09, 2009/10
1.15 Main sources of income received by academic year and country of institution (£ thousands)
All values in the FSR are show n in units of £1,000, and w here necessary rounded to the nearest £1,000, the consequence of w hich is that sum of individual values in each row or column may not match the total value.
26
27
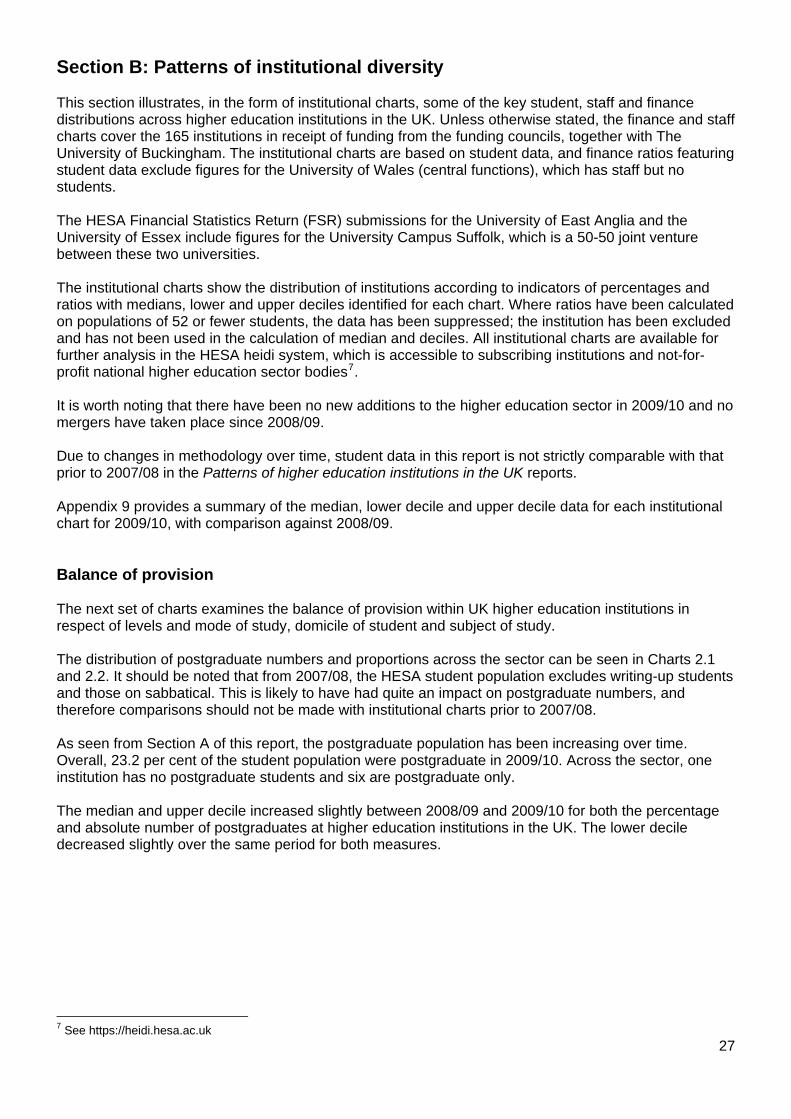
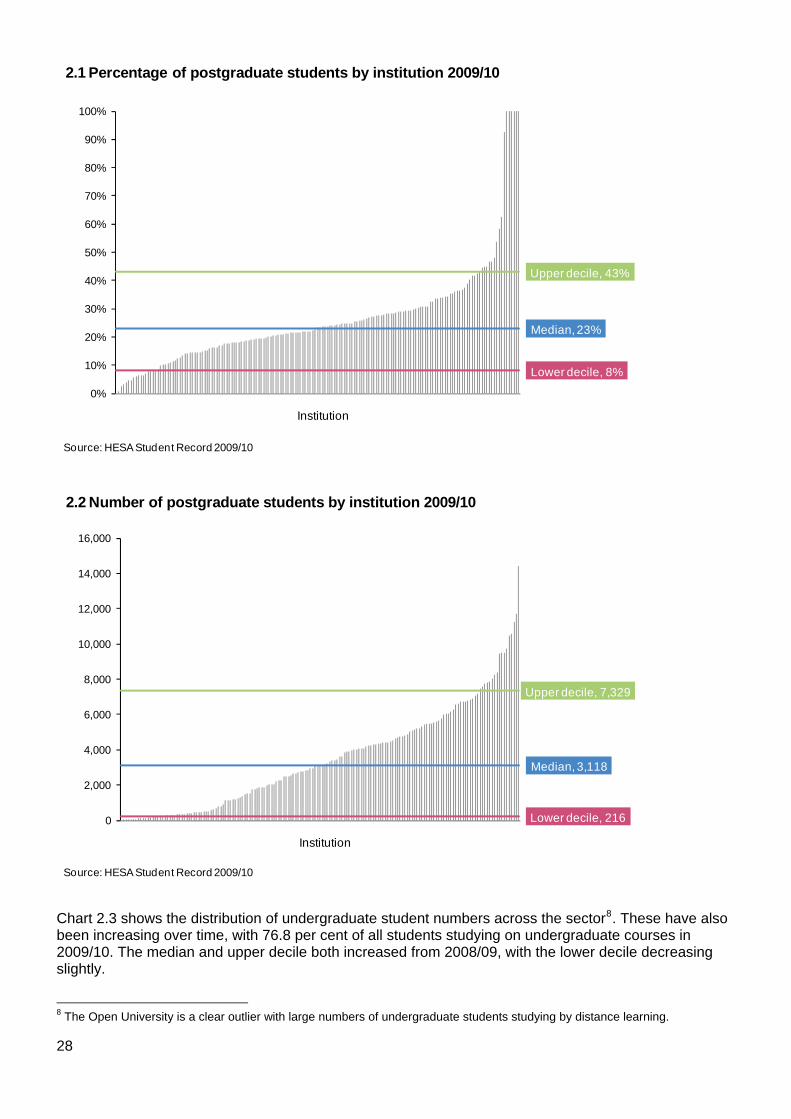
Section B: Patterns of institutional diversity This section illustrates, in the form of institutional charts, some of the key student, staff and finance distributions across higher education institutions in the UK. Unless otherwise stated, the finance and staff charts cover the 165 institutions in receipt of funding from the funding councils, together with The University of Buckingham. The institutional charts are based on student data, and finance ratios featuring student data exclude figures for the University of Wales (central functions), which has staff but no students. The HESA Financial Statistics Return (FSR) submissions for the University of East Anglia and the University of Essex include figures for the University Campus Suffolk, which is a 50-50 joint venture between these two universities. The institutional charts show the distribution of institutions according to indicators of percentages and ratios with medians, lower and upper deciles identified for each chart. Where ratios have been calculated on populations of 52 or fewer students, the data has been suppressed; the institution has been excluded and has not been used in the calculation of median and deciles. All institutional charts are available for further analysis in the HESA heidi system, which is accessible to subscribing institutions and not-for-profit national higher education sector bodies7. It is worth noting that there have been no new additions to the higher education sector in 2009/10 and no mergers have taken place since 2008/09. Due to changes in methodology over time, student data in this report is not strictly comparable with that prior to 2007/08 in the Patterns of higher education institutions in the UK reports. Appendix 9 provides a summary of the median, lower decile and upper decile data for each institutional chart for 2009/10, with comparison against 2008/09. Balance of provision The next set of charts examines the balance of provision within UK higher education institutions in respect of levels and mode of study, domicile of student and subject of study. The distribution of postgraduate numbers and proportions across the sector can be seen in Charts 2.1 and 2.2. It should be noted that from 2007/08, the HESA student population excludes writing-up students and those on sabbatical. This is likely to have had quite an impact on postgraduate numbers, and therefore comparisons should not be made with institutional charts prior to 2007/08. As seen from Section A of this report, the postgraduate population has been increasing over time. Overall, 23.2 per cent of the student population were postgraduate in 2009/10. Across the sector, one institution has no postgraduate students and six are postgraduate only. The median and upper decile increased slightly between 2008/09 and 2009/10 for both the percentage and absolute number of postgraduates at higher education institutions in the UK. The lower decile decreased slightly over the same period for both measures.
7 See https://heidi.hesa.ac.uk
Lower decile, 8%
Median, 23%
Upper decile, 43%
0%
10%
20%
30%
40%
50%
60%
70%
80%
90%
100%
Institution
2.1 Percentage of postgraduate students by institution 2009/10
Source: HESA Student Record 2009/10
Lower decile, 216
Median, 3,118
Upper decile, 7,329
0
2,000
4,000
6,000
8,000
10,000
12,000
14,000
16,000
Institution
2.2 Number of postgraduate students by institution 2009/10
Source: HESA Student Record 2009/10
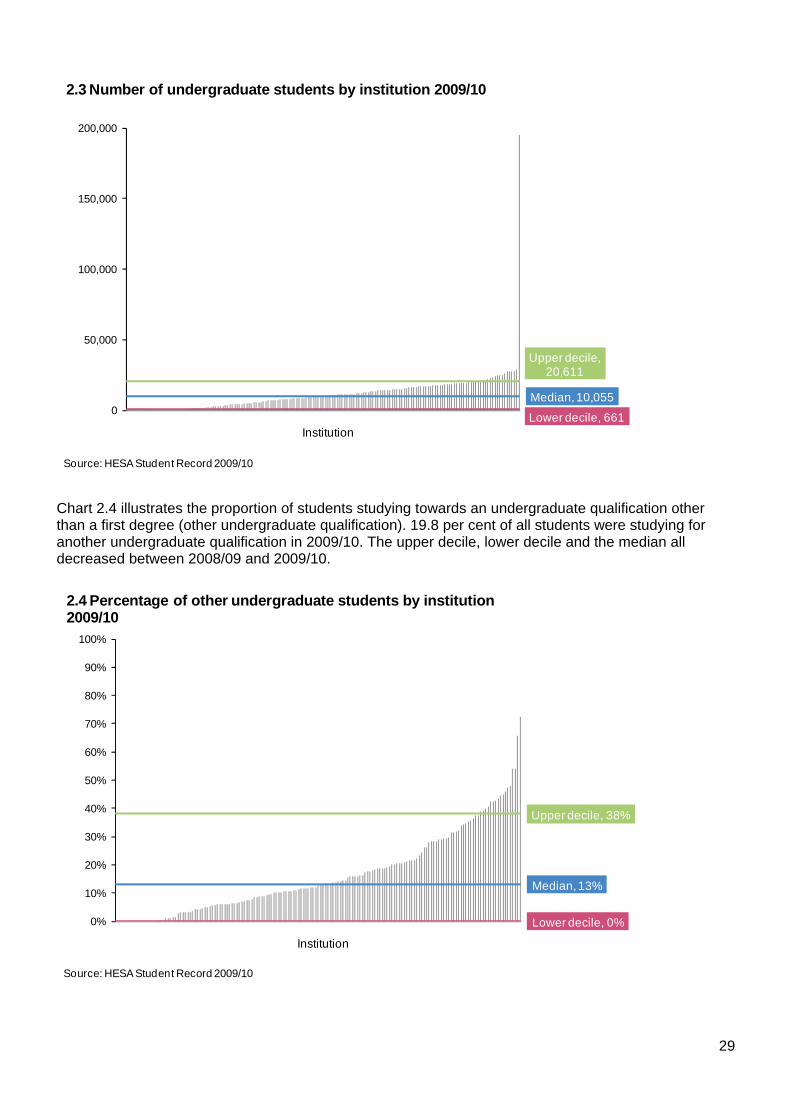
Chart 2.3 shows the distribution of undergraduate student numbers across the sector8. These have also been increasing over time, with 76.8 per cent of all students studying on undergraduate courses in 2009/10. The median and upper decile both increased from 2008/09, with the lower decile decreasing slightly.
8 The Open University is a clear outlier with large numbers of undergraduate students studying by distance learning.
28
Lower decile, 661
Median, 10,055
Upper decile, 20,611
0
50,000
100,000
150,000
200,000
Institution
2.3 Number of undergraduate students by institution 2009/10
Source: HESA Student Record 2009/10
Chart 2.4 illustrates the proportion of students studying towards an undergraduate qualification other than a first degree (other undergraduate qualification). 19.8 per cent of all students were studying for another undergraduate qualification in 2009/10. The upper decile, lower decile and the median all decreased between 2008/09 and 2009/10.
Lower decile, 0%
Median, 13%
Upper decile, 38%
0%
10%
20%
30%
40%
50%
60%
70%
80%
90%
100%
Institution
2.4 Percentage of other undergraduate students by institution 2009/10
Source: HESA Student Record 2009/10
29
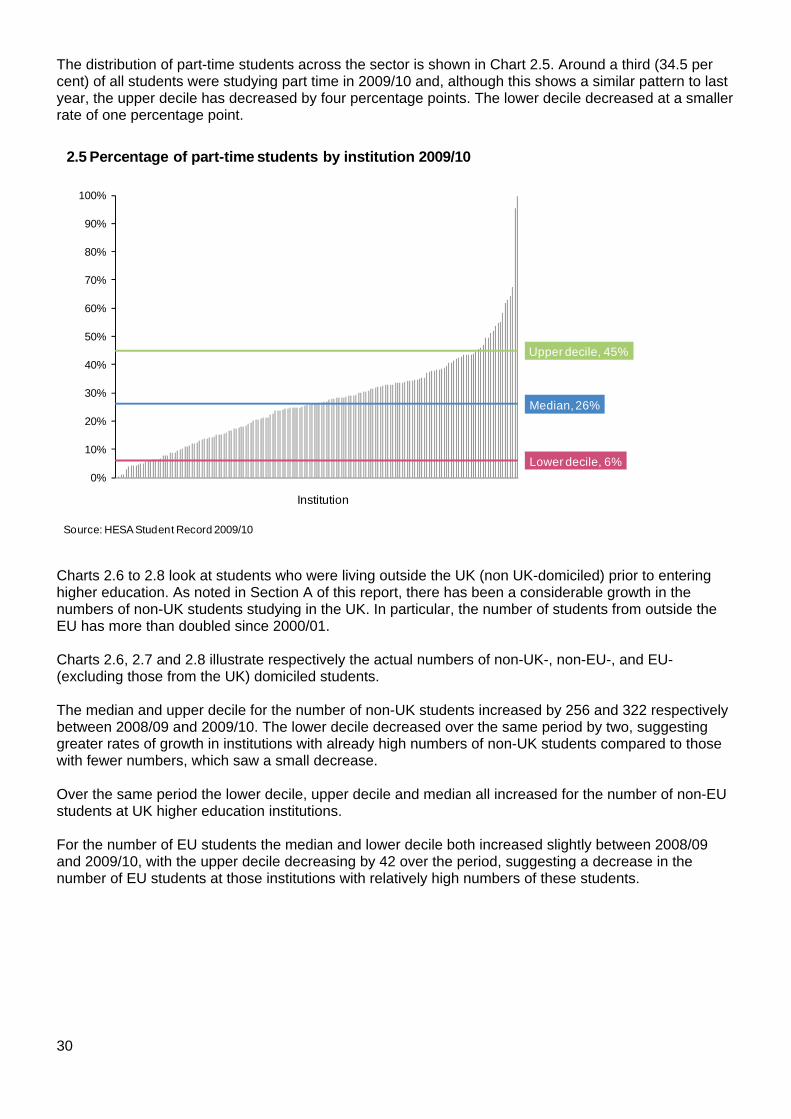
The distribution of part-time students across the sector is shown in Chart 2.5. Around a third (34.5 per cent) of all students were studying part time in 2009/10 and, although this shows a similar pattern to last year, the upper decile has decreased by four percentage points. The lower decile decreased at a smaller rate of one percentage point.
Lower decile, 6%
Median, 26%
Upper decile, 45%
0%
10%
20%
30%
40%
50%
60%
70%
80%
90%
100%
Institution
2.5 Percentage of part-time students by institution 2009/10
Source: HESA Student Record 2009/10
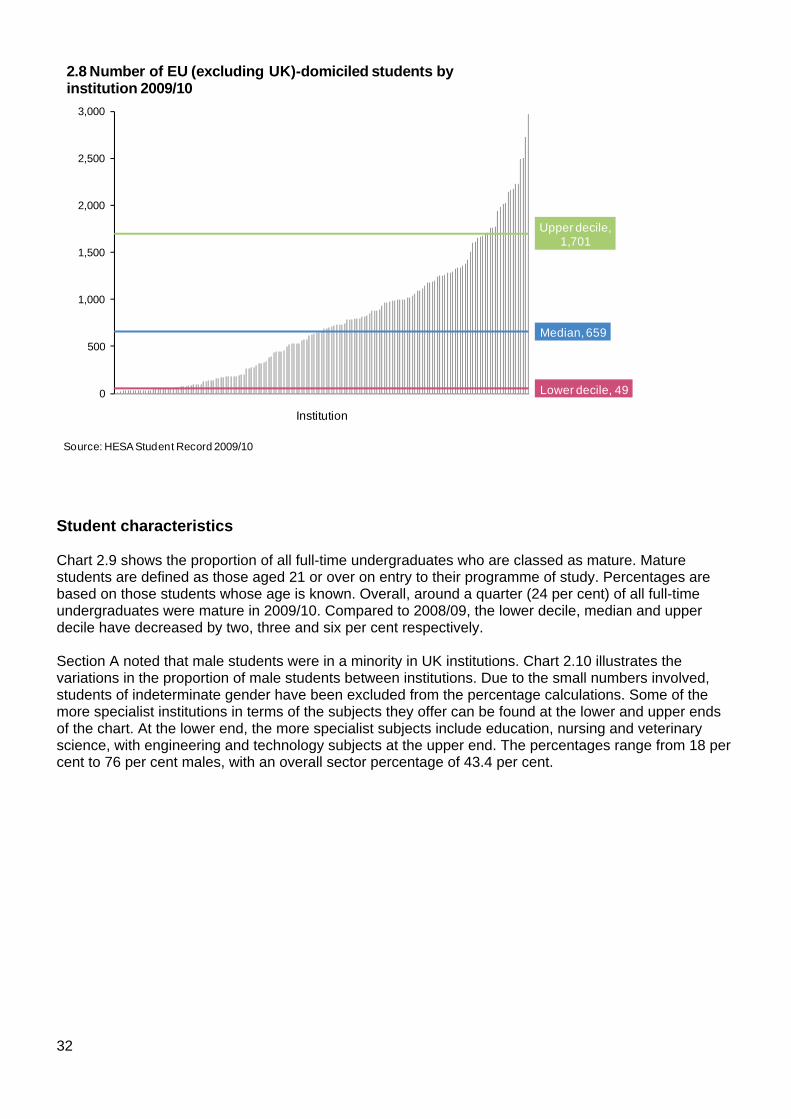
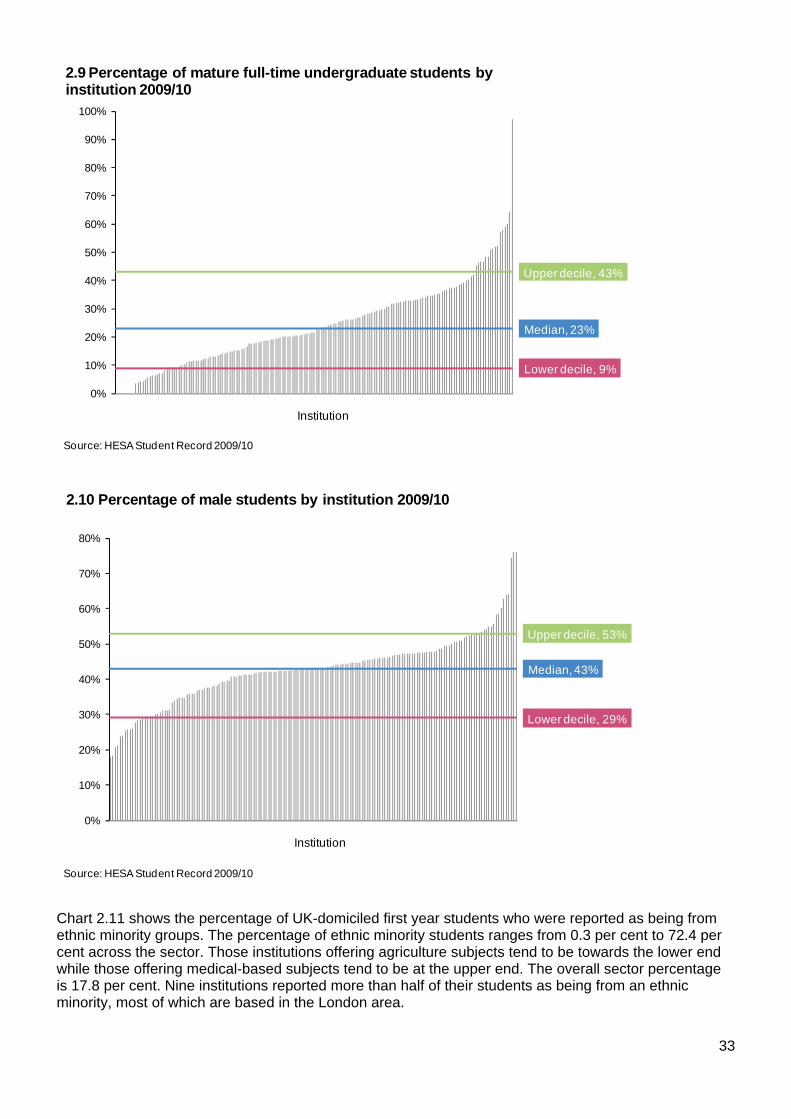
Charts 2.6 to 2.8 look at students who were living outside the UK (non UK-domiciled) prior to entering higher education. As noted in Section A of this report, there has been a considerable growth in the numbers of non-UK students studying in the UK. In particular, the number of students from outside the EU has more than doubled since 2000/01. Charts 2.6, 2.7 and 2.8 illustrate respectively the actual numbers of non-UK-, non-EU-, and EU- (excluding those from the UK) domiciled students. The median and upper decile for the number of non-UK students increased by 256 and 322 respectively between 2008/09 and 2009/10. The lower decile decreased over the same period by two, suggesting greater rates of growth in institutions with already high numbers of non-UK students compared to those with fewer numbers, which saw a small decrease. Over the same period the lower decile, upper decile and median all increased for the number of non-EU students at UK higher education institutions. For the number of EU students the median and lower decile both increased slightly between 2008/09 and 2009/10, with the upper decile decreasing by 42 over the period, suggesting a decrease in the number of EU students at those institutions with relatively high numbers of these students.
30
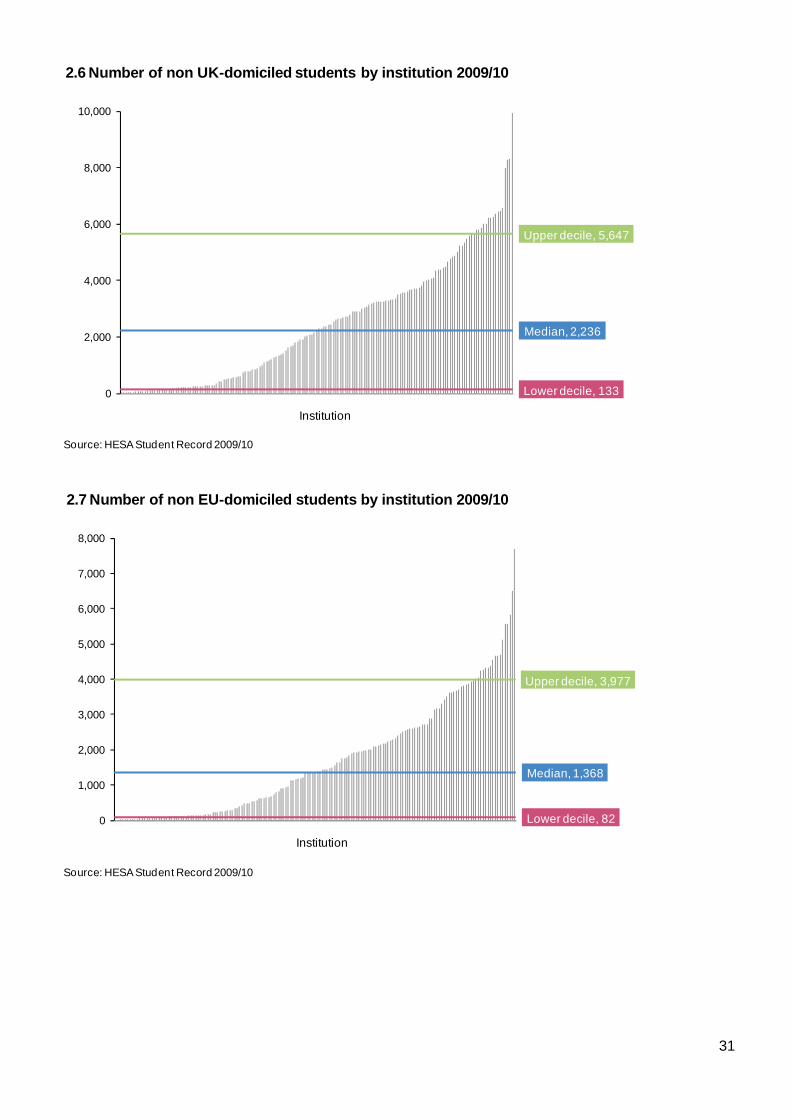
Lower decile, 133
Median, 2,236
Upper decile, 5,647
0
2,000
4,000
6,000
8,000
10,000
Institution
2.6 Number of non UK-domiciled students by institution 2009/10
Source: HESA Student Record 2009/10
Lower decile, 82
Median, 1,368
Upper decile, 3,977
0
1,000
2,000
3,000
4,000
5,000
6,000
7,000
8,000
Institution
2.7 Number of non EU-domiciled students by institution 2009/10
Source: HESA Student Record 2009/10
31
Lower decile, 49
Median, 659
Upper decile,1,701
0
500
1,000
1,500
2,000
2,500
3,000
Institution
2.8 Number of EU (excluding UK)-domiciled students by institution 2009/10
Source: HESA Student Record 2009/10
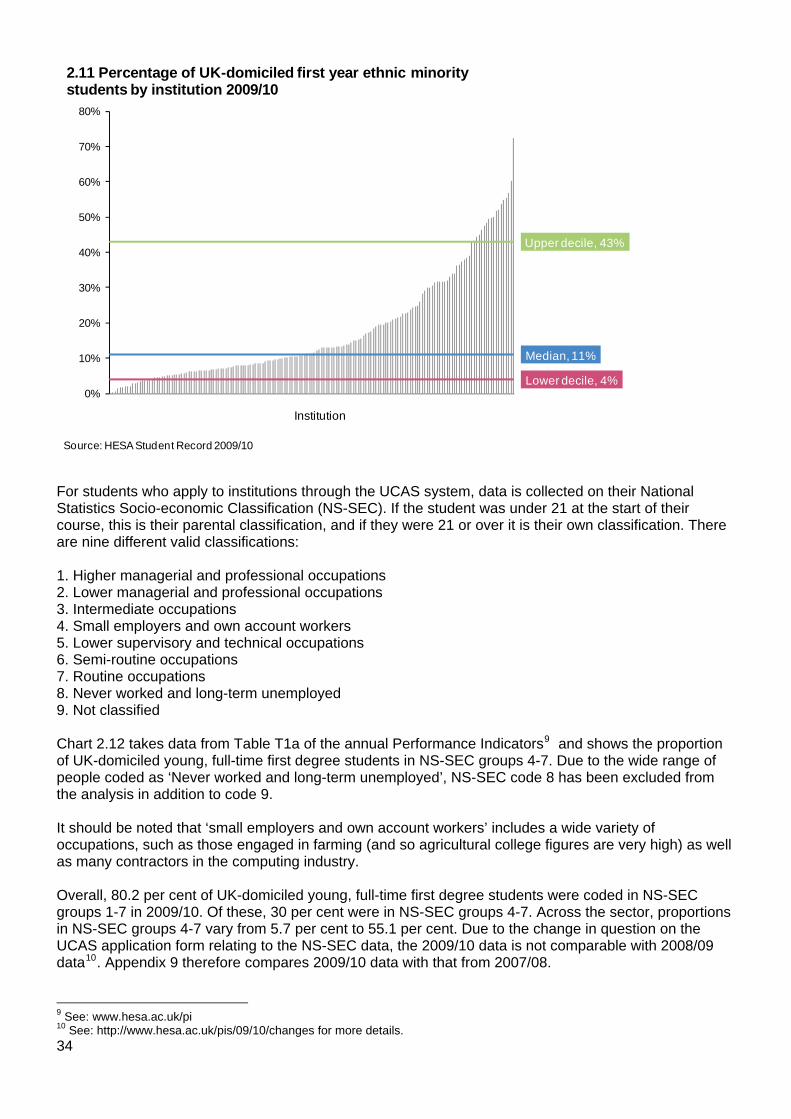
Student characteristics Chart 2.9 shows the proportion of all full-time undergraduates who are classed as mature. Mature students are defined as those aged 21 or over on entry to their programme of study. Percentages are based on those students whose age is known. Overall, around a quarter (24 per cent) of all full-time undergraduates were mature in 2009/10. Compared to 2008/09, the lower decile, median and upper decile have decreased by two, three and six per cent respectively. Section A noted that male students were in a minority in UK institutions. Chart 2.10 illustrates the variations in the proportion of male students between institutions. Due to the small numbers involved, students of indeterminate gender have been excluded from the percentage calculations. Some of the more specialist institutions in terms of the subjects they offer can be found at the lower and upper ends of the chart. At the lower end, the more specialist subjects include education, nursing and veterinary science, with engineering and technology subjects at the upper end. The percentages range from 18 per cent to 76 per cent males, with an overall sector percentage of 43.4 per cent.
32
Lower decile, 9%
Median, 23%
Upper decile, 43%
0%
10%
20%
30%
40%
50%
60%
70%
80%
90%
100%
Institution
2.9 Percentage of mature full-time undergraduate students by institution 2009/10
Source: HESA Student Record 2009/10
Lower decile, 29%
Median, 43%
Upper decile, 53%
0%
10%
20%
30%
40%
50%
60%
70%
80%
Institution
2.10 Percentage of male students by institution 2009/10
Source: HESA Student Record 2009/10
Chart 2.11 shows the percentage of UK-domiciled first year students who were reported as being from ethnic minority groups. The percentage of ethnic minority students ranges from 0.3 per cent to 72.4 per cent across the sector. Those institutions offering agriculture subjects tend to be towards the lower end while those offering medical-based subjects tend to be at the upper end. The overall sector percentage is 17.8 per cent. Nine institutions reported more than half of their students as being from an ethnic minority, most of which are based in the London area.
33
Lower decile, 4%
Median, 11%
Upper decile, 43%
0%
10%
20%
30%
40%
50%
60%
70%
80%
Institution
2.11 Percentage of UK-domiciled first year ethnic minority students by institution 2009/10
Source: HESA Student Record 2009/10
For students who apply to institutions through the UCAS system, data is collected on their National Statistics Socio-economic Classification (NS-SEC). If the student was under 21 at the start of their course, this is their parental classification, and if they were 21 or over it is their own classification. There are nine different valid classifications: 1. Higher managerial and professional occupations 2. Lower managerial and professional occupations 3. Intermediate occupations 4. Small employers and own account workers 5. Lower supervisory and technical occupations 6. Semi-routine occupations 7. Routine occupations 8. Never worked and long-term unemployed 9. Not classified Chart 2.12 takes data from Table T1a of the annual Performance Indicators9 and shows the proportion of UK-domiciled young, full-time first degree students in NS-SEC groups 4-7. Due to the wide range of people coded as ‘Never worked and long-term unemployed’, NS-SEC code 8 has been excluded from the analysis in addition to code 9. It should be noted that ‘small employers and own account workers’ includes a wide variety of occupations, such as those engaged in farming (and so agricultural college figures are very high) as well as many contractors in the computing industry. Overall, 80.2 per cent of UK-domiciled young, full-time first degree students were coded in NS-SEC groups 1-7 in 2009/10. Of these, 30 per cent were in NS-SEC groups 4-7. Across the sector, proportions in NS-SEC groups 4-7 vary from 5.7 per cent to 55.1 per cent. Due to the change in question on the UCAS application form relating to the NS-SEC data, the 2009/10 data is not comparable with 2008/09 data10. Appendix 9 therefore compares 2009/10 data with that from 2007/08. 9 See: www.hesa.ac.uk/pi
34
10 See: http://www.hesa.ac.uk/pis/09/10/changes for more details.
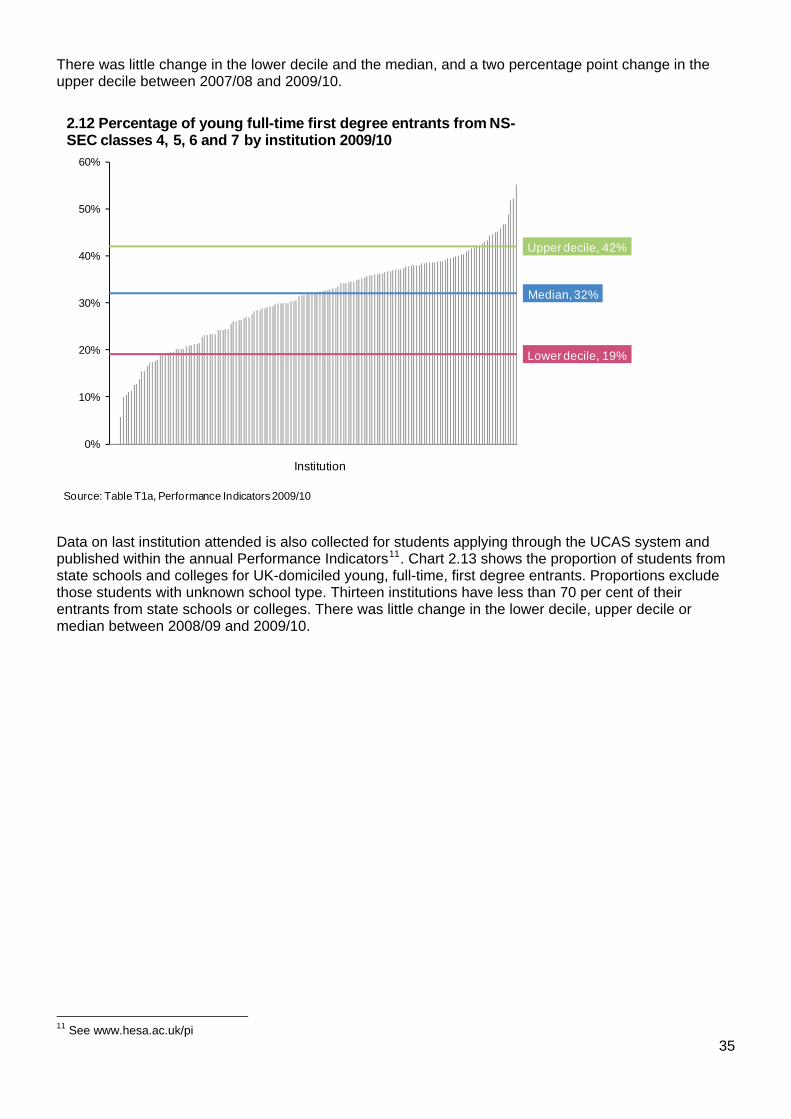
There was little change in the lower decile and the median, and a two percentage point change in the upper decile between 2007/08 and 2009/10.
Lower decile, 19%
Median, 32%
Upper decile, 42%
0%
10%
20%
30%
40%
50%
60%
Institution
2.12 Percentage of young full-time first degree entrants from NS-SEC classes 4, 5, 6 and 7 by institution 2009/10
Source: Table T1a, Performance Indicators 2009/10
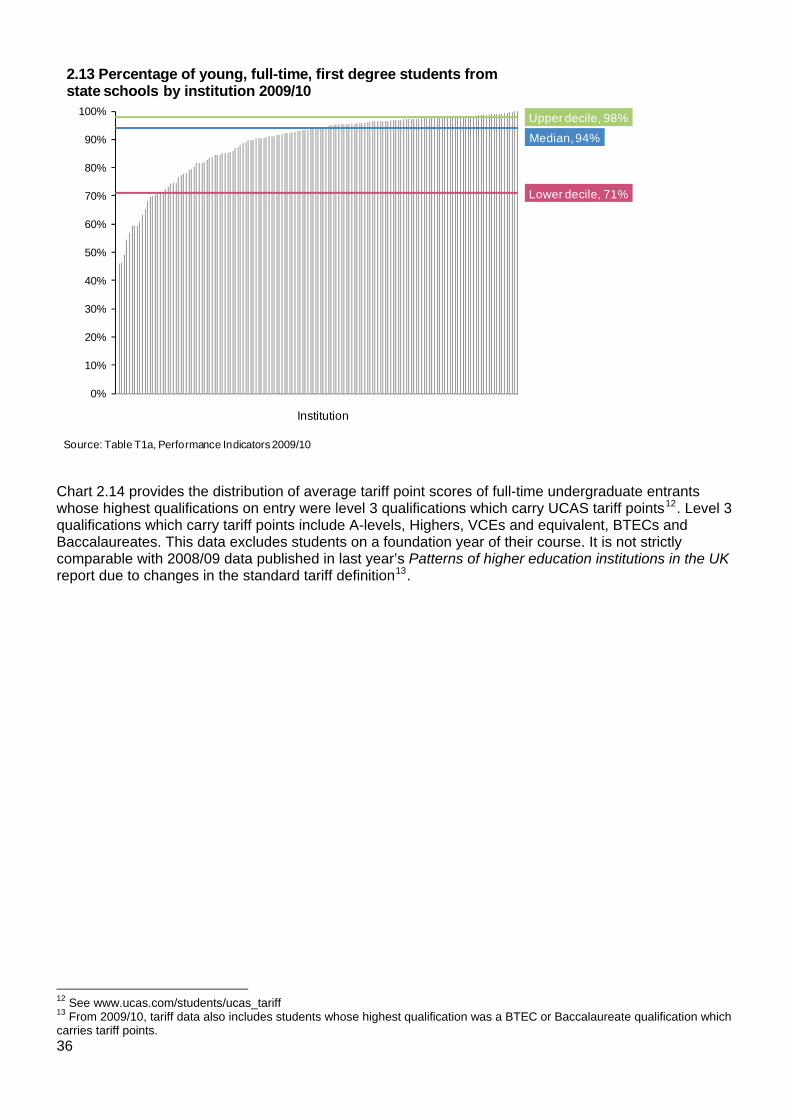
Data on last institution attended is also collected for students applying through the UCAS system and published within the annual Performance Indicators11. Chart 2.13 shows the proportion of students from state schools and colleges for UK-domiciled young, full-time, first degree entrants. Proportions exclude those students with unknown school type. Thirteen institutions have less than 70 per cent of their entrants from state schools or colleges. There was little change in the lower decile, upper decile or median between 2008/09 and 2009/10.
35
11 See www.hesa.ac.uk/pi
Lower decile, 71%
Median, 94%
Upper decile, 98%
0%
10%
20%
30%
40%
50%
60%
70%
80%
90%
100%
Institution
2.13 Percentage of young, full-time, first degree students from state schools by institution 2009/10
Source: Table T1a, Performance Indicators 2009/10
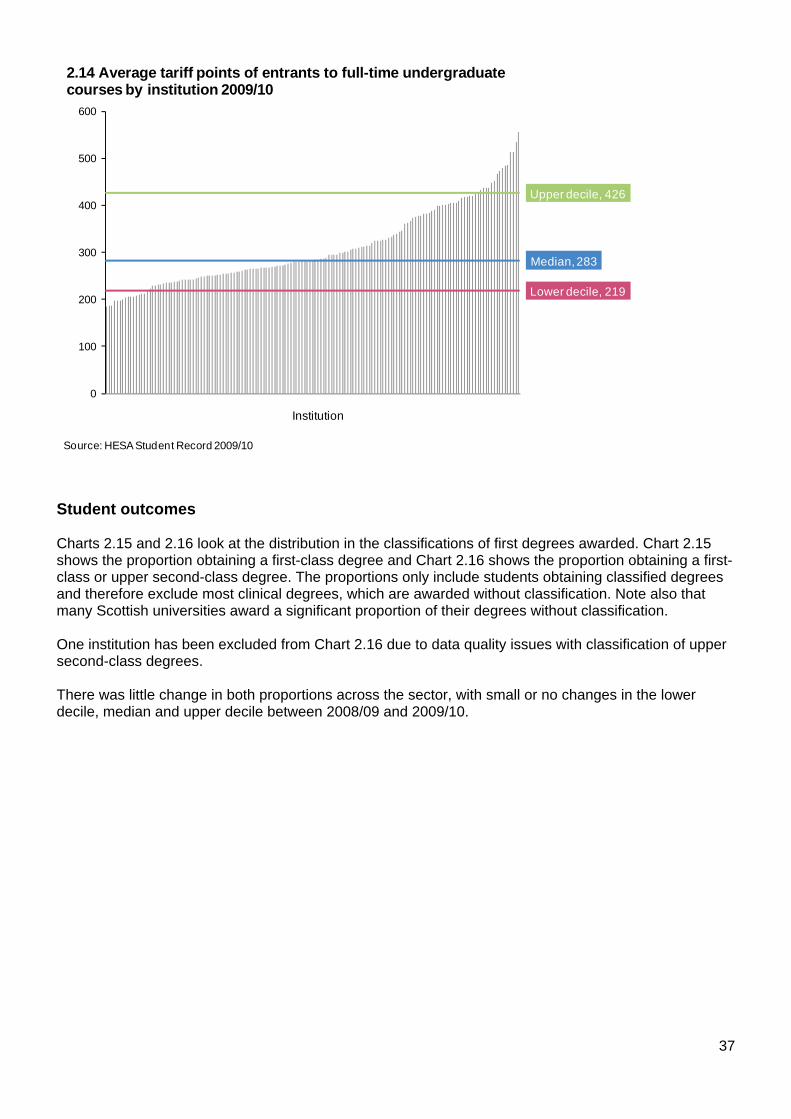
Chart 2.14 provides the distribution of average tariff point scores of full-time undergraduate entrants whose highest qualifications on entry were level 3 qualifications which carry UCAS tariff points12. Level 3 qualifications which carry tariff points include A-levels, Highers, VCEs and equivalent, BTECs and Baccalaureates. This data excludes students on a foundation year of their course. It is not strictly comparable with 2008/09 data published in last year’s Patterns of higher education institutions in the UK report due to changes in the standard tariff definition13.
12 See www.ucas.com/students/ucas_tariff
36
13 From 2009/10, tariff data also includes students whose highest qualification was a BTEC or Baccalaureate qualification which carries tariff points.
Lower decile, 219
Median, 283
Upper decile, 426
0
100
200
300
400
500
600
Institution
2.14 Average tariff points of entrants to full-time undergraduate courses by institution 2009/10
Source: HESA Student Record 2009/10
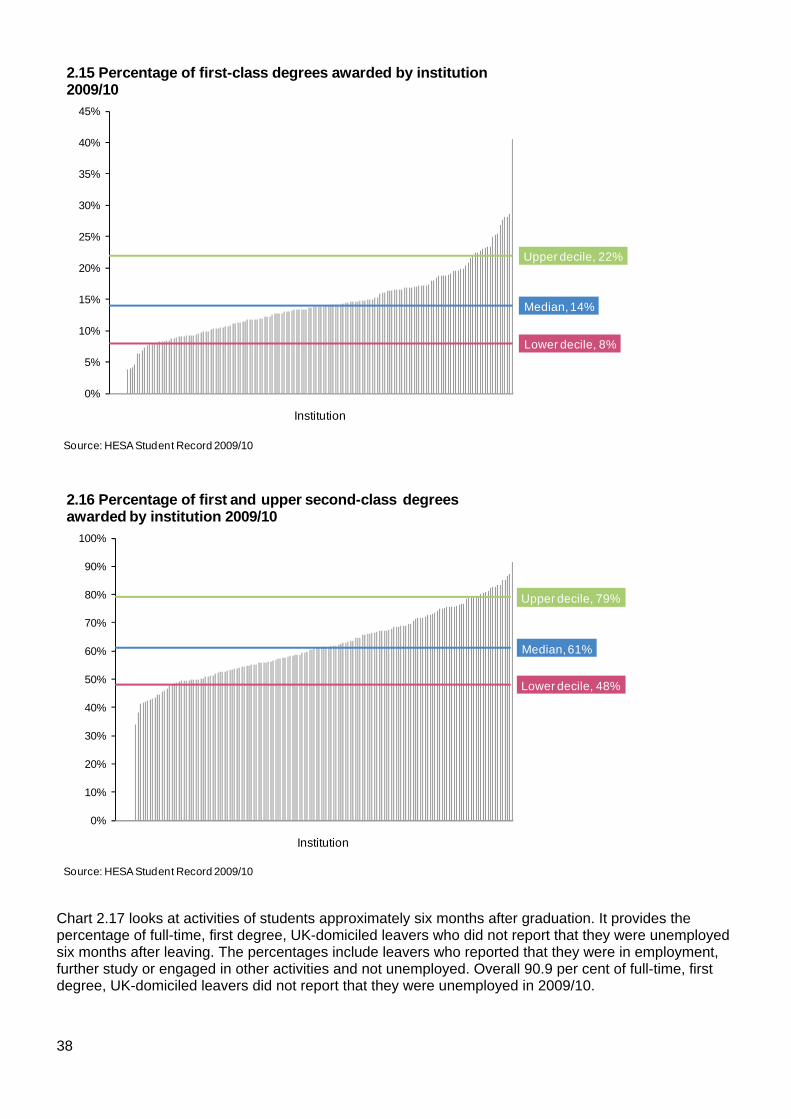
Student outcomes Charts 2.15 and 2.16 look at the distribution in the classifications of first degrees awarded. Chart 2.15 shows the proportion obtaining a first-class degree and Chart 2.16 shows the proportion obtaining a first-class or upper second-class degree. The proportions only include students obtaining classified degrees and therefore exclude most clinical degrees, which are awarded without classification. Note also that many Scottish universities award a significant proportion of their degrees without classification. One institution has been excluded from Chart 2.16 due to data quality issues with classification of upper second-class degrees. There was little change in both proportions across the sector, with small or no changes in the lower decile, median and upper decile between 2008/09 and 2009/10.
37
Lower decile, 8%
Median, 14%
Upper decile, 22%
0%
5%
10%
15%
20%
25%
30%
35%
40%
45%
Institution
2.15 Percentage of first-class degrees awarded by institution 2009/10
Source: HESA Student Record 2009/10
Lower decile, 48%
Median, 61%
Upper decile, 79%
0%
10%
20%
30%
40%
50%
60%
70%
80%
90%
100%
Institution
2.16 Percentage of first and upper second-class degrees awarded by institution 2009/10
Source: HESA Student Record 2009/10
Chart 2.17 looks at activities of students approximately six months after graduation. It provides the percentage of full-time, first degree, UK-domiciled leavers who did not report that they were unemployed six months after leaving. The percentages include leavers who reported that they were in employment, further study or engaged in other activities and not unemployed. Overall 90.9 per cent of full-time, first degree, UK-domiciled leavers did not report that they were unemployed in 2009/10.
38
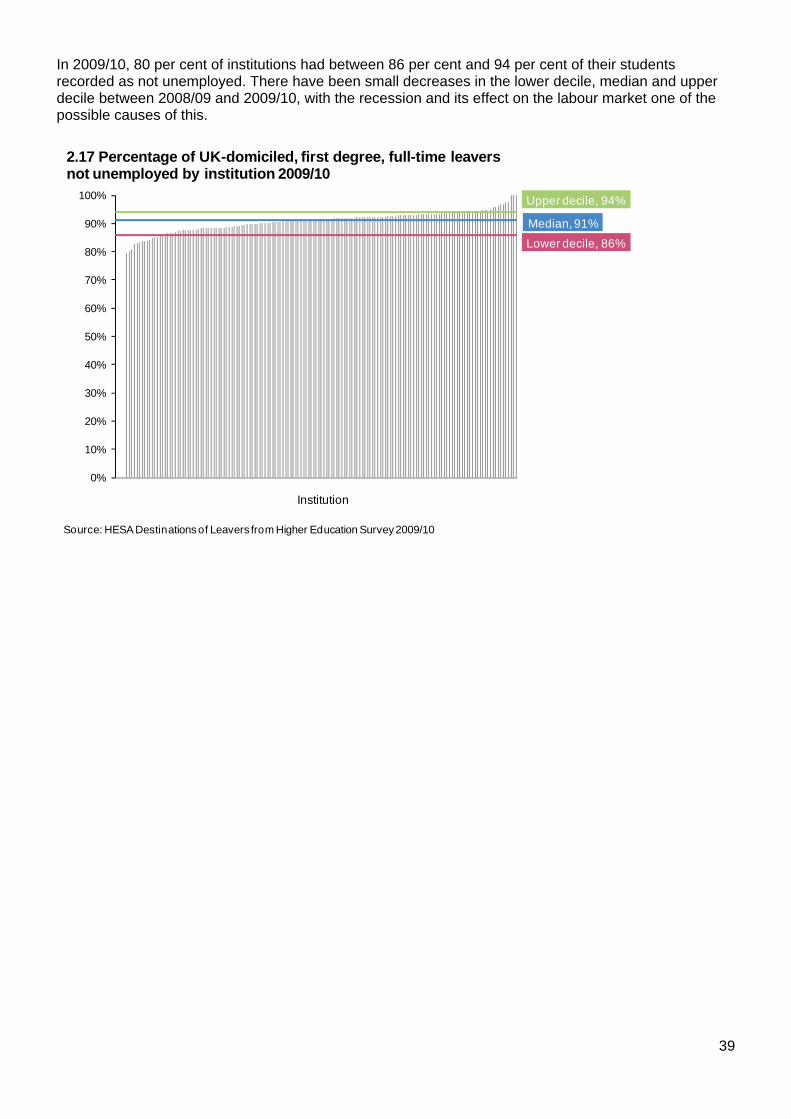
In 2009/10, 80 per cent of institutions had between 86 per cent and 94 per cent of their students recorded as not unemployed. There have been small decreases in the lower decile, median and upper decile between 2008/09 and 2009/10, with the recession and its effect on the labour market one of the possible causes of this.
Lower decile, 86%
Median, 91%
Upper decile, 94%
0%
10%
20%
30%
40%
50%
60%
70%
80%
90%
100%
Institution
2.17 Percentage of UK-domiciled, first degree, full-time leavers not unemployed by institution 2009/10
Source: HESA Destinations of Leavers from Higher Education Survey 2009/10
39
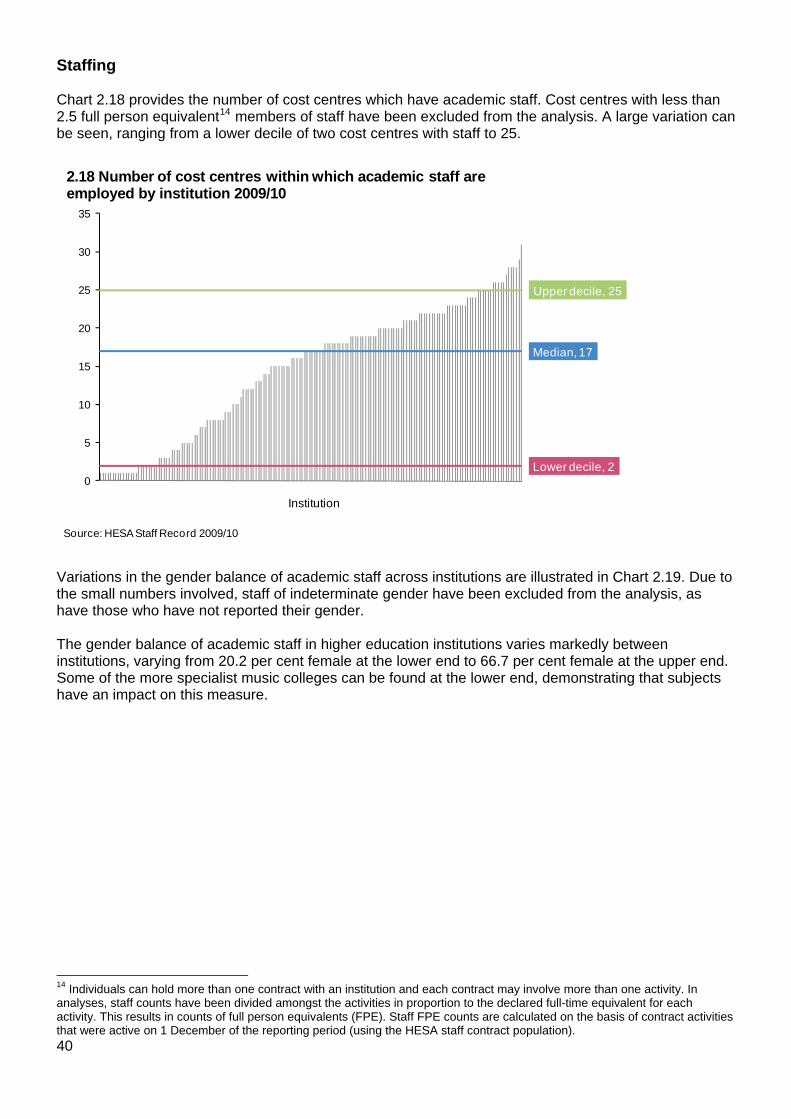
Staffing Chart 2.18 provides the number of cost centres which have academic staff. Cost centres with less than 2.5 full person equivalent14 members of staff have been excluded from the analysis. A large variation can be seen, ranging from a lower decile of two cost centres with staff to 25.
Lower decile, 2
Median, 17
Upper decile, 25
0
5
10
15
20
25
30
35
Institution
2.18 Number of cost centres within which academic staff are employed by institution 2009/10
Source: HESA Staff Record 2009/10
Variations in the gender balance of academic staff across institutions are illustrated in Chart 2.19. Due to the small numbers involved, staff of indeterminate gender have been excluded from the analysis, as have those who have not reported their gender. The gender balance of academic staff in higher education institutions varies markedly between institutions, varying from 20.2 per cent female at the lower end to 66.7 per cent female at the upper end. Some of the more specialist music colleges can be found at the lower end, demonstrating that subjects have an impact on this measure.
40
14 Individuals can hold more than one contract with an institution and each contract may involve more than one activity. In analyses, staff counts have been divided amongst the activities in proportion to the declared full-time equivalent for each activity. This results in counts of full person equivalents (FPE). Staff FPE counts are calculated on the basis of contract activities that were active on 1 December of the reporting period (using the HESA staff contract population).
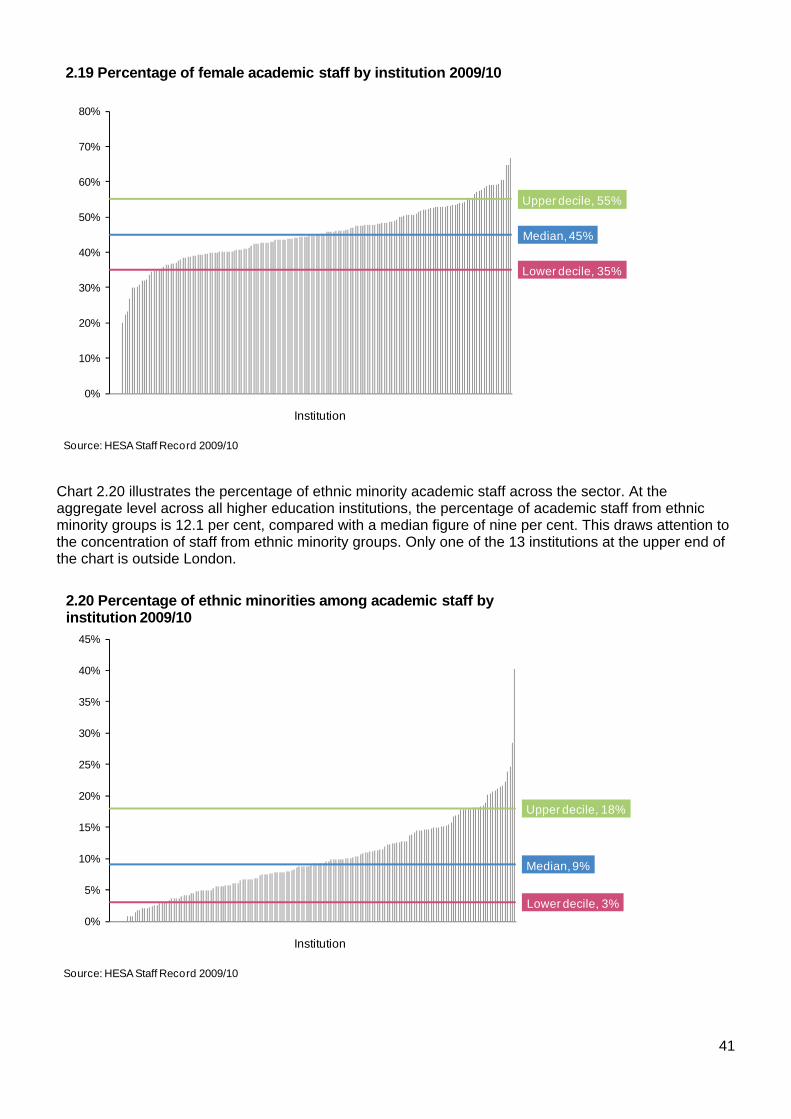
Lower decile, 35%
Median, 45%
Upper decile, 55%
0%
10%
20%
30%
40%
50%
60%
70%
80%
Institution
2.19 Percentage of female academic staff by institution 2009/10
Source: HESA Staff Record 2009/10
Chart 2.20 illustrates the percentage of ethnic minority academic staff across the sector. At the aggregate level across all higher education institutions, the percentage of academic staff from ethnic minority groups is 12.1 per cent, compared with a median figure of nine per cent. This draws attention to the concentration of staff from ethnic minority groups. Only one of the 13 institutions at the upper end of the chart is outside London.
Lower decile, 3%
Median, 9%
Upper decile, 18%
0%
5%
10%
15%
20%
25%
30%
35%
40%
45%
Institution
2.20 Percentage of ethnic minorities among academic staff by institution 2009/10
Source: HESA Staff Record 2009/10
41
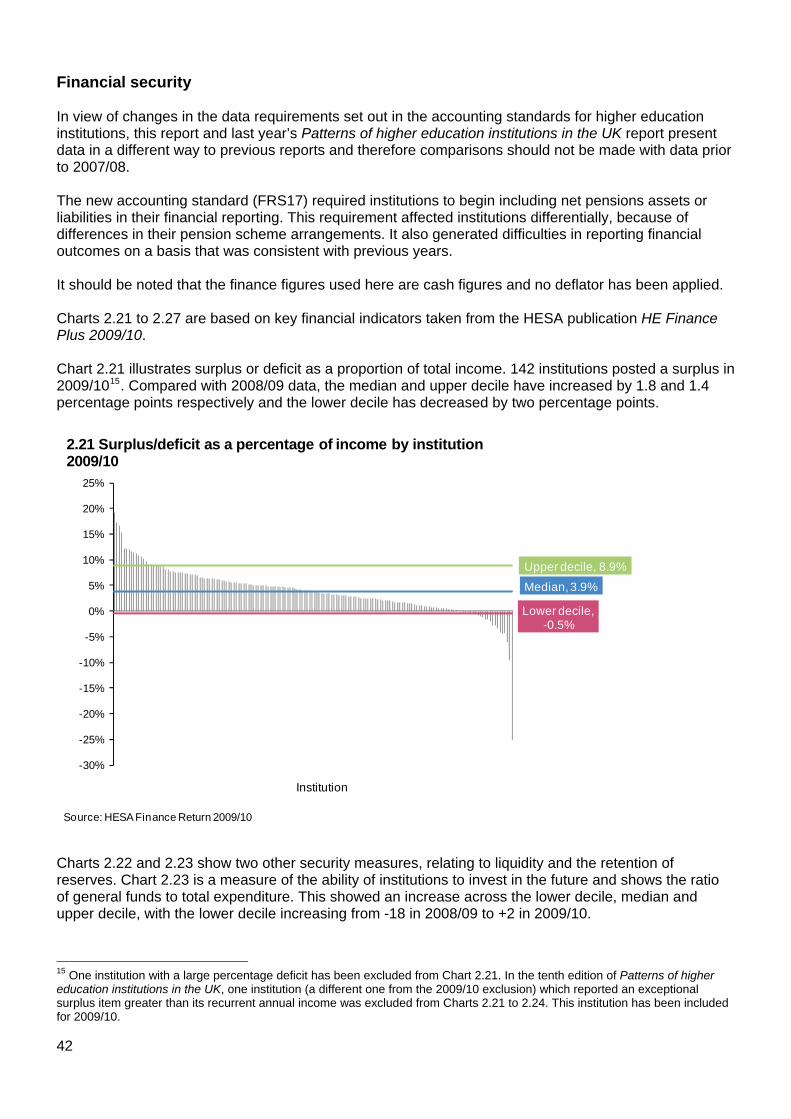
Financial security In view of changes in the data requirements set out in the accounting standards for higher education institutions, this report and last year’s Patterns of higher education institutions in the UK report present data in a different way to previous reports and therefore comparisons should not be made with data prior to 2007/08. The new accounting standard (FRS17) required institutions to begin including net pensions assets or liabilities in their financial reporting. This requirement affected institutions differentially, because of differences in their pension scheme arrangements. It also generated difficulties in reporting financial outcomes on a basis that was consistent with previous years. It should be noted that the finance figures used here are cash figures and no deflator has been applied. Charts 2.21 to 2.27 are based on key financial indicators taken from the HESA publication HE Finance Plus 2009/10. Chart 2.21 illustrates surplus or deficit as a proportion of total income. 142 institutions posted a surplus in 2009/1015. Compared with 2008/09 data, the median and upper decile have increased by 1.8 and 1.4 percentage points respectively and the lower decile has decreased by two percentage points.
Lower decile,-0.5%
Median, 3.9%
Upper decile, 8.9%
-30%
-25%
-20%
-15%
-10%
-5%
0%
5%
10%
15%
20%
25%
Institution
2.21 Surplus/deficit as a percentage of income by institution 2009/10
Source: HESA Finance Return 2009/10
Charts 2.22 and 2.23 show two other security measures, relating to liquidity and the retention of reserves. Chart 2.23 is a measure of the ability of institutions to invest in the future and shows the ratio of general funds to total expenditure. This showed an increase across the lower decile, median and upper decile, with the lower decile increasing from -18 in 2008/09 to +2 in 2009/10.
15 One institution with a large percentage deficit has been excluded from Chart 2.21. In the tenth edition of Patterns of higher education institutions in the UK, one institution (a different one from the 2009/10 exclusion) which reported an exceptional surplus item greater than its recurrent annual income was excluded from Charts 2.21 to 2.24. This institution has been included for 2009/10.
42
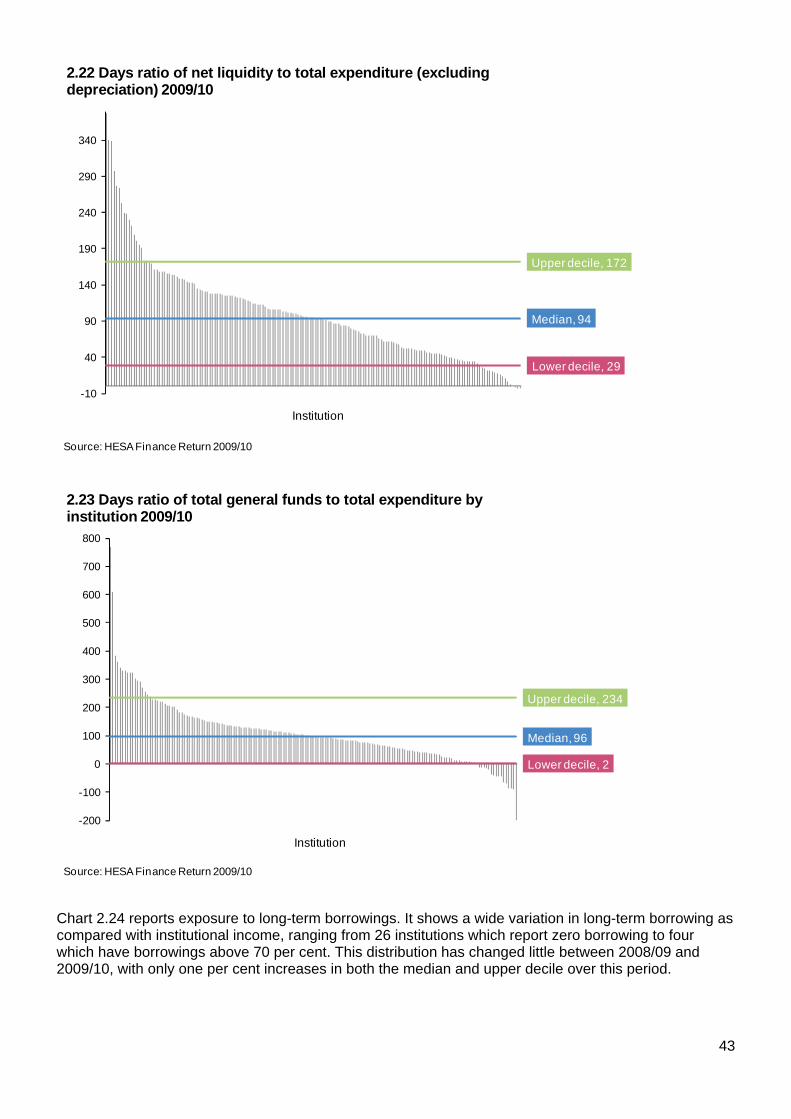
Lower decile, 29
Median, 94
Upper decile, 172
-10
40
90
140
190
240
290
340
Institution
2.22 Days ratio of net liquidity to total expenditure (excluding depreciation) 2009/10
Source: HESA Finance Return 2009/10
Lower decile, 2
Median, 96
Upper decile, 234
-200
-100
0
100
200
300
400
500
600
700
800
Institution
2.23 Days ratio of total general funds to total expenditure by institution 2009/10
Source: HESA Finance Return 2009/10
Chart 2.24 reports exposure to long-term borrowings. It shows a wide variation in long-term borrowing as compared with institutional income, ranging from 26 institutions which report zero borrowing to four which have borrowings above 70 per cent. This distribution has changed little between 2008/09 and 2009/10, with only one per cent increases in both the median and upper decile over this period.
43
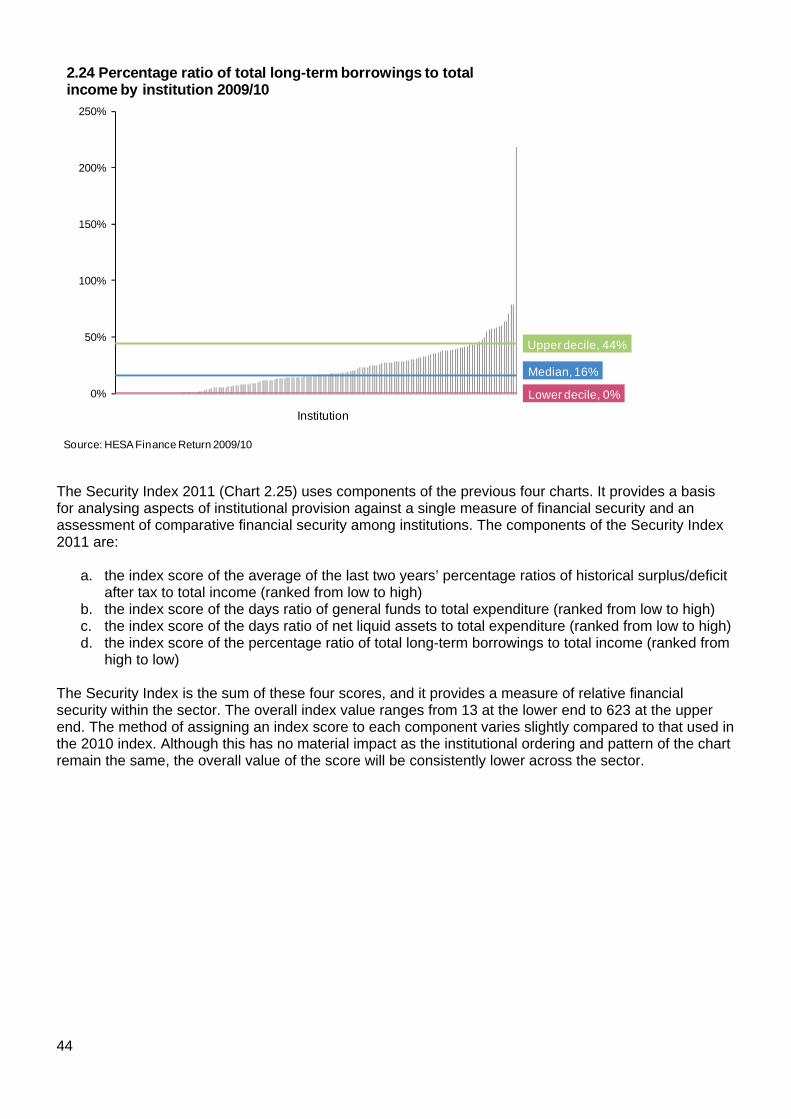
Lower decile, 0%
Median, 16%
Upper decile, 44%
0%
50%
100%
150%
200%
250%
Institution
2.24 Percentage ratio of total long-term borrowings to total income by institution 2009/10
Source: HESA Finance Return 2009/10
The Security Index 2011 (Chart 2.25) uses components of the previous four charts. It provides a basis for analysing aspects of institutional provision against a single measure of financial security and an assessment of comparative financial security among institutions. The components of the Security Index 2011 are:
a. the index score of the average of the last two years’ percentage ratios of historical surplus/deficit after tax to total income (ranked from low to high)
b. the index score of the days ratio of general funds to total expenditure (ranked from low to high) c. the index score of the days ratio of net liquid assets to total expenditure (ranked from low to high) d. the index score of the percentage ratio of total long-term borrowings to total income (ranked from
high to low) The Security Index is the sum of these four scores, and it provides a measure of relative financial security within the sector. The overall index value ranges from 13 at the lower end to 623 at the upper end. The method of assigning an index score to each component varies slightly compared to that used in the 2010 index. Although this has no material impact as the institutional ordering and pattern of the chart remain the same, the overall value of the score will be consistently lower across the sector.
44
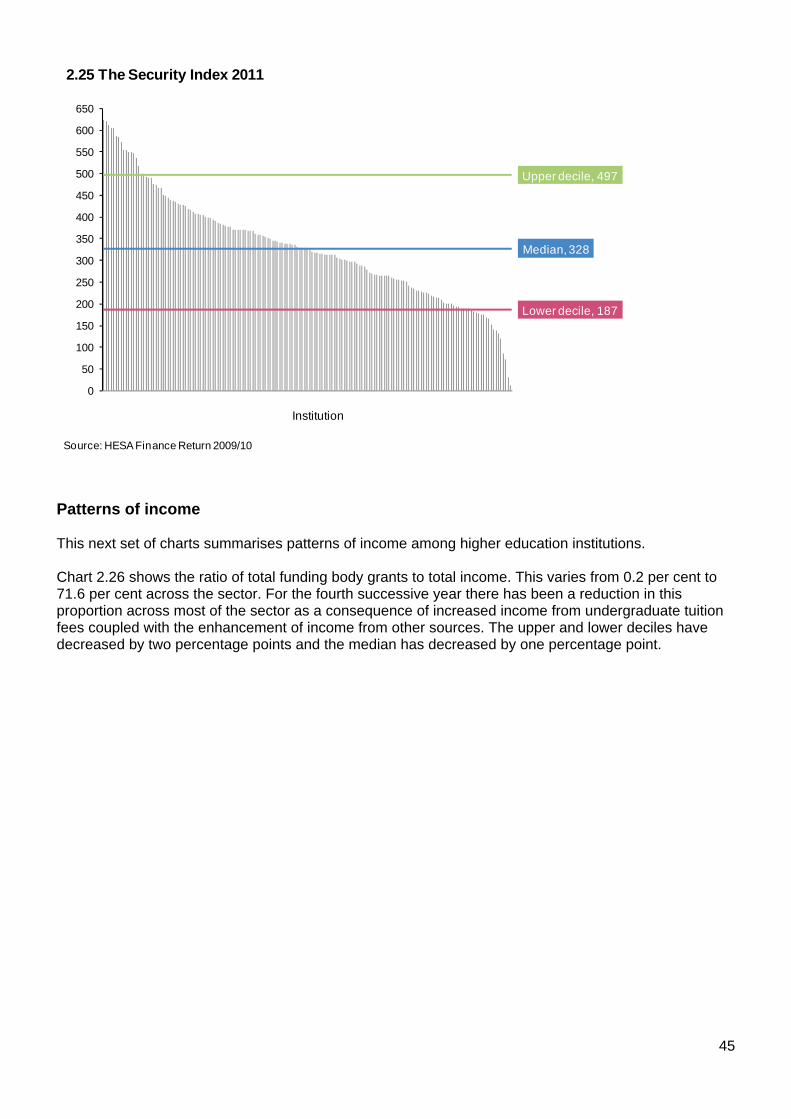
Lower decile, 187
Median, 328
Upper decile, 497
0
50
100
150
200
250
300
350
400
450
500
550
600
650
Institution
2.25 The Security Index 2011
Source: HESA Finance Return 2009/10
Patterns of income This next set of charts summarises patterns of income among higher education institutions. Chart 2.26 shows the ratio of total funding body grants to total income. This varies from 0.2 per cent to 71.6 per cent across the sector. For the fourth successive year there has been a reduction in this proportion across most of the sector as a consequence of increased income from undergraduate tuition fees coupled with the enhancement of income from other sources. The upper and lower deciles have decreased by two percentage points and the median has decreased by one percentage point.
45
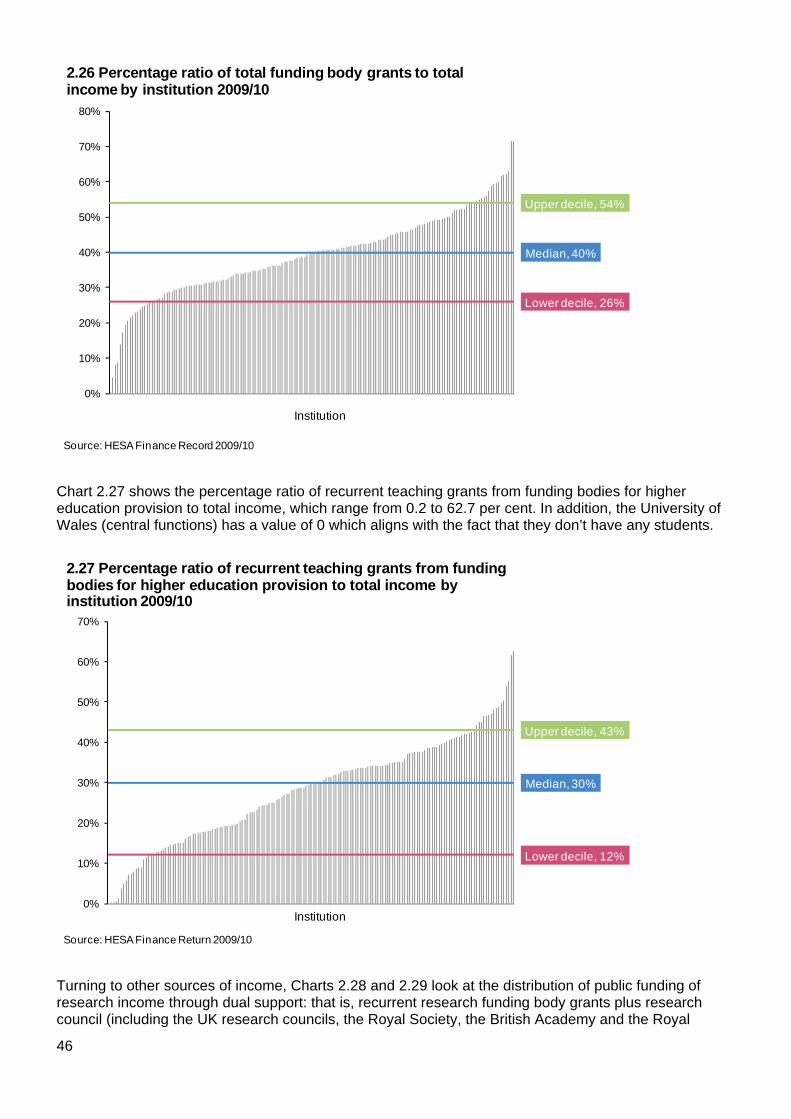
Lower decile, 26%
Median, 40%
Upper decile, 54%
0%
10%
20%
30%
40%
50%
60%
70%
80%
Institution
2.26 Percentage ratio of total funding body grants to total income by institution 2009/10
Source: HESA Finance Record 2009/10
Chart 2.27 shows the percentage ratio of recurrent teaching grants from funding bodies for higher education provision to total income, which range from 0.2 to 62.7 per cent. In addition, the University of Wales (central functions) has a value of 0 which aligns with the fact that they don’t have any students.
Lower decile, 12%
Median, 30%
Upper decile, 43%
0%
10%
20%
30%
40%
50%
60%
70%
Institution
2.27 Percentage ratio of recurrent teaching grants from funding bodies for higher education provision to total income by institution 2009/10
Source: HESA Finance Return 2009/10
Turning to other sources of income, Charts 2.28 and 2.29 look at the distribution of public funding of research income through dual support: that is, recurrent research funding body grants plus research council (including the UK research councils, the Royal Society, the British Academy and the Royal
46
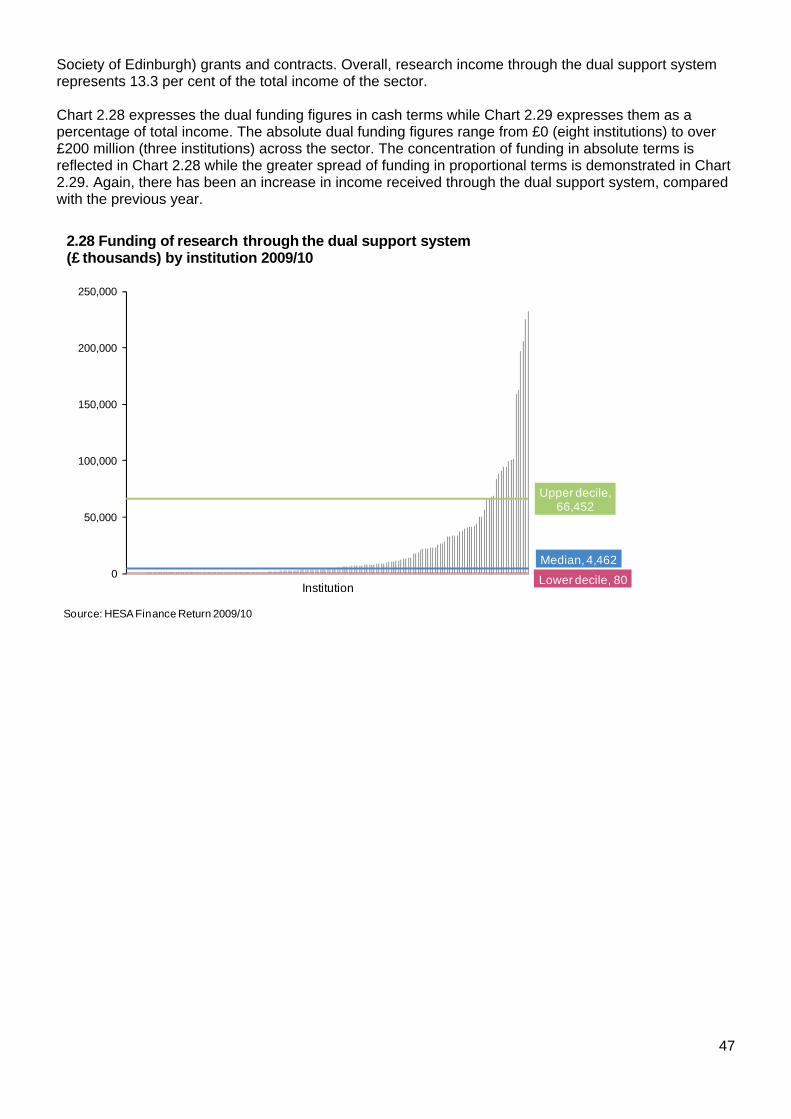
Society of Edinburgh) grants and contracts. Overall, research income through the dual support system represents 13.3 per cent of the total income of the sector. Chart 2.28 expresses the dual funding figures in cash terms while Chart 2.29 expresses them as a percentage of total income. The absolute dual funding figures range from £0 (eight institutions) to over £200 million (three institutions) across the sector. The concentration of funding in absolute terms is reflected in Chart 2.28 while the greater spread of funding in proportional terms is demonstrated in Chart 2.29. Again, there has been an increase in income received through the dual support system, compared with the previous year.
Lower decile, 80
Median, 4,462
Upper decile, 66,452
0
50,000
100,000
150,000
200,000
250,000
Institution
2.28 Funding of research through the dual support system (£ thousands) by institution 2009/10
Source: HESA Finance Return 2009/10
47
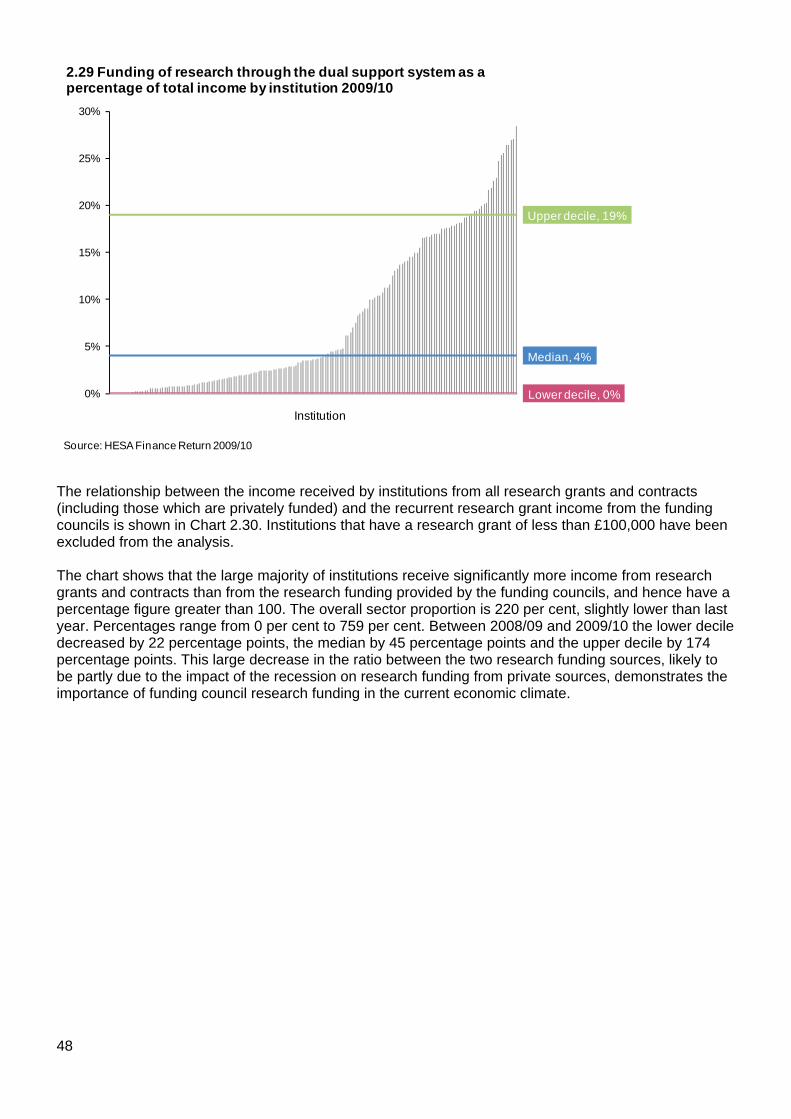
Lower decile, 0%
Median, 4%
Upper decile, 19%
0%
5%
10%
15%
20%
25%
30%
Institution
2.29 Funding of research through the dual support system as a percentage of total income by institution 2009/10
Source: HESA Finance Return 2009/10
The relationship between the income received by institutions from all research grants and contracts (including those which are privately funded) and the recurrent research grant income from the funding councils is shown in Chart 2.30. Institutions that have a research grant of less than £100,000 have been excluded from the analysis. The chart shows that the large majority of institutions receive significantly more income from research grants and contracts than from the research funding provided by the funding councils, and hence have a percentage figure greater than 100. The overall sector proportion is 220 per cent, slightly lower than last year. Percentages range from 0 per cent to 759 per cent. Between 2008/09 and 2009/10 the lower decile decreased by 22 percentage points, the median by 45 percentage points and the upper decile by 174 percentage points. This large decrease in the ratio between the two research funding sources, likely to be partly due to the impact of the recession on research funding from private sources, demonstrates the importance of funding council research funding in the current economic climate.
48
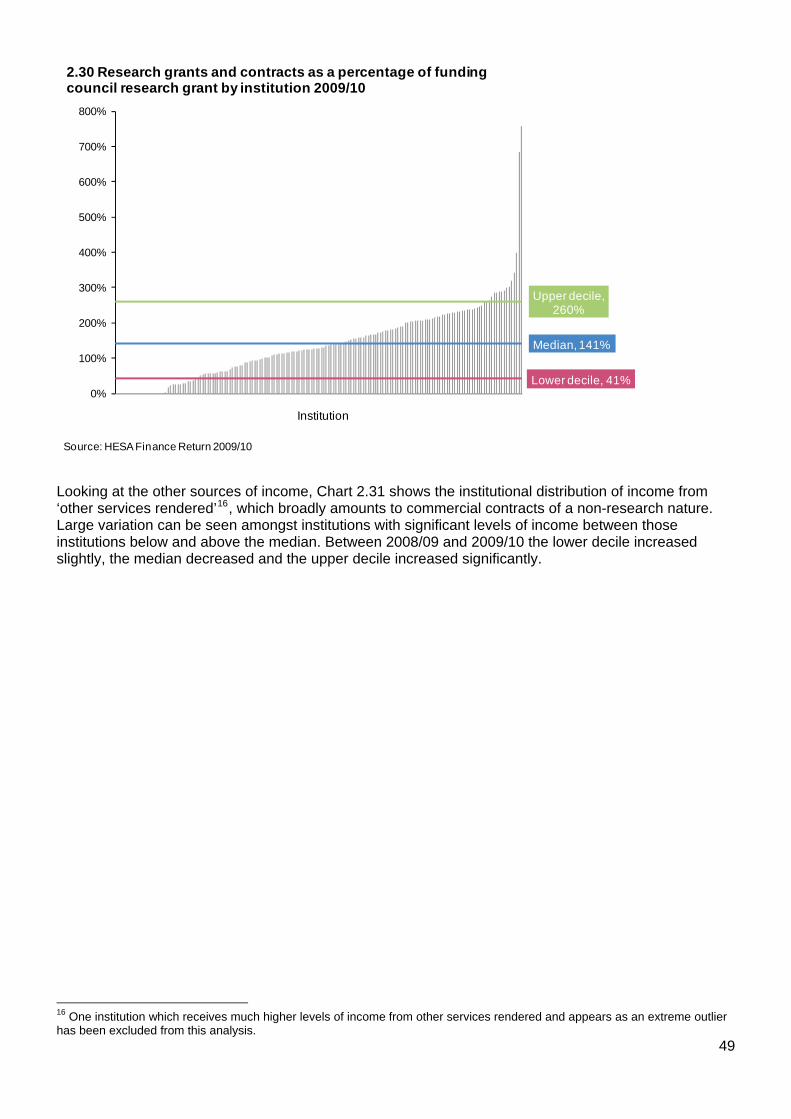
Lower decile, 41%
Median, 141%
Upper decile, 260%
0%
100%
200%
300%
400%
500%
600%
700%
800%
Institution
2.30 Research grants and contracts as a percentage of funding council research grant by institution 2009/10
Source: HESA Finance Return 2009/10
Looking at the other sources of income, Chart 2.31 shows the institutional distribution of income from ‘other services rendered’16, which broadly amounts to commercial contracts of a non-research nature. Large variation can be seen amongst institutions with significant levels of income between those institutions below and above the median. Between 2008/09 and 2009/10 the lower decile increased slightly, the median decreased and the upper decile increased significantly.
49
16 One institution which receives much higher levels of income from other services rendered and appears as an extreme outlier has been excluded from this analysis.
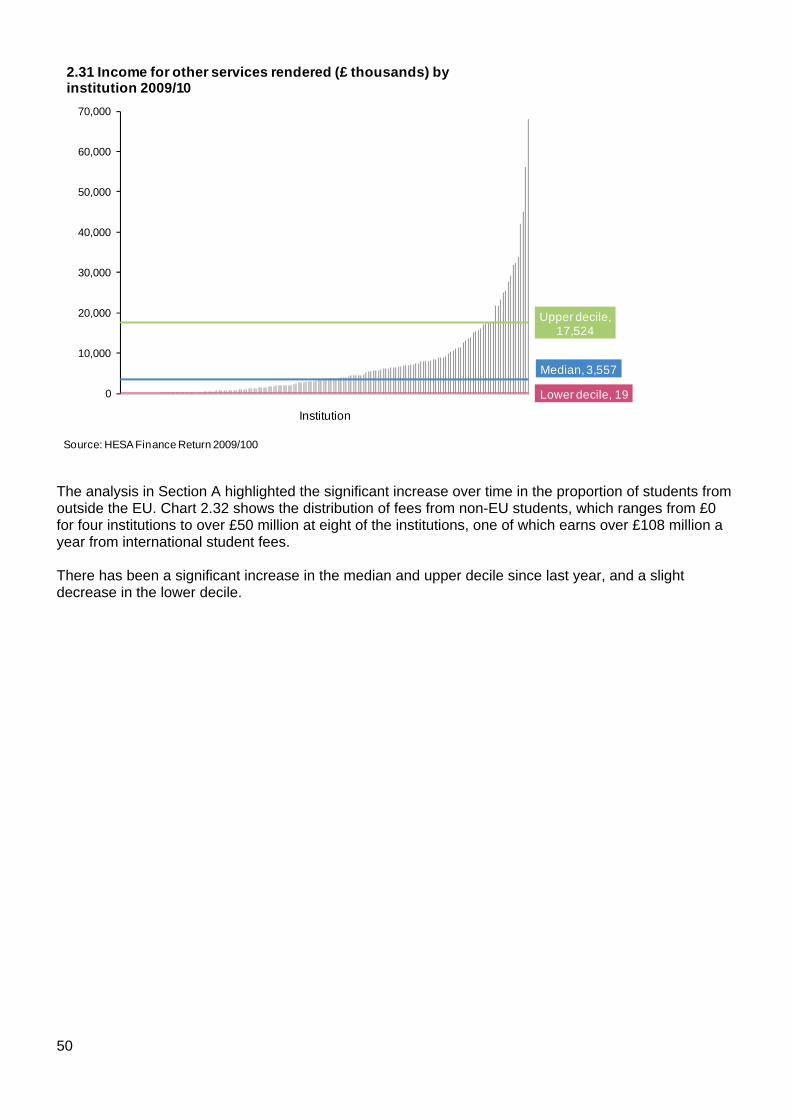
Lower decile, 19
Median, 3,557
Upper decile, 17,524
0
10,000
20,000
30,000
40,000
50,000
60,000
70,000
Institution
2.31 Income for other services rendered (£ thousands) by institution 2009/10
Source: HESA Finance Return 2009/100
The analysis in Section A highlighted the significant increase over time in the proportion of students from outside the EU. Chart 2.32 shows the distribution of fees from non-EU students, which ranges from £0 for four institutions to over £50 million at eight of the institutions, one of which earns over £108 million a year from international student fees. There has been a significant increase in the median and upper decile since last year, and a slight decrease in the lower decile.
50
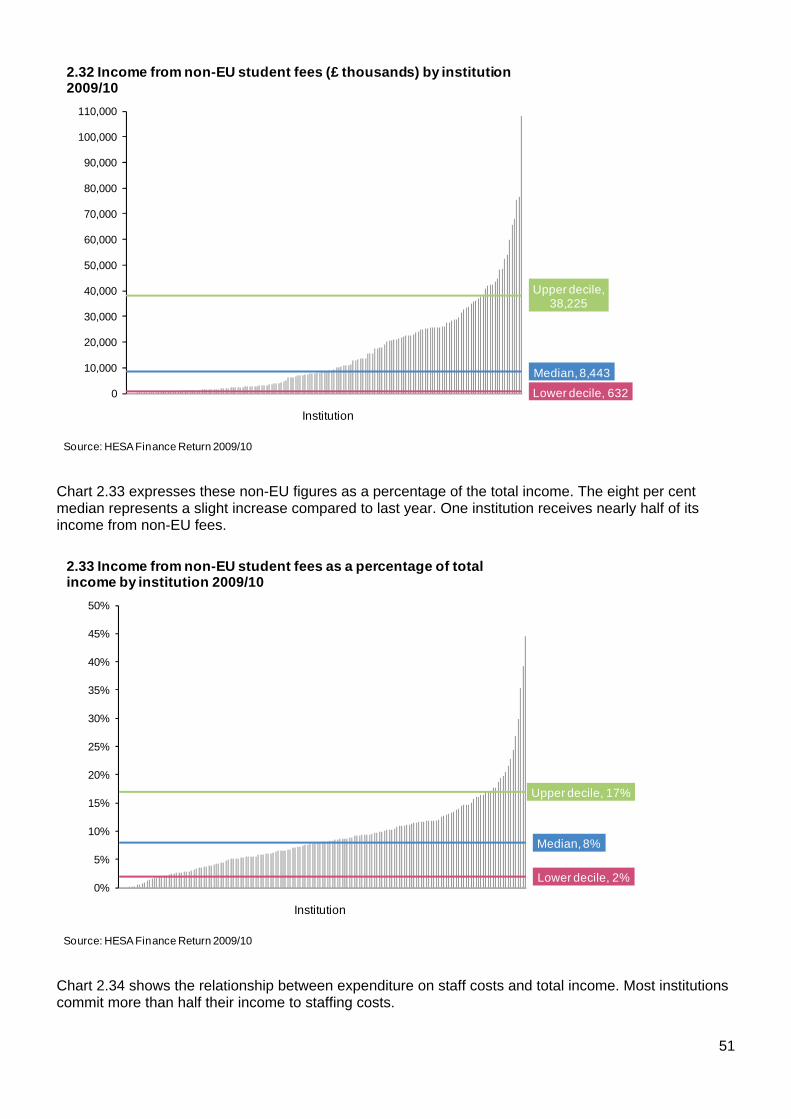
Lower decile, 632
Median, 8,443
Upper decile, 38,225
0
10,000
20,000
30,000
40,000
50,000
60,000
70,000
80,000
90,000
100,000
110,000
Institution
2.32 Income from non-EU student fees (£ thousands) by institution 2009/10
Source: HESA Finance Return 2009/10
Chart 2.33 expresses these non-EU figures as a percentage of the total income. The eight per cent median represents a slight increase compared to last year. One institution receives nearly half of its income from non-EU fees.
Lower decile, 2%
Median, 8%
Upper decile, 17%
0%
5%
10%
15%
20%
25%
30%
35%
40%
45%
50%
Institution
2.33 Income from non-EU student fees as a percentage of total income by institution 2009/10
Source: HESA Finance Return 2009/10
Chart 2.34 shows the relationship between expenditure on staff costs and total income. Most institutions commit more than half their income to staffing costs.
51
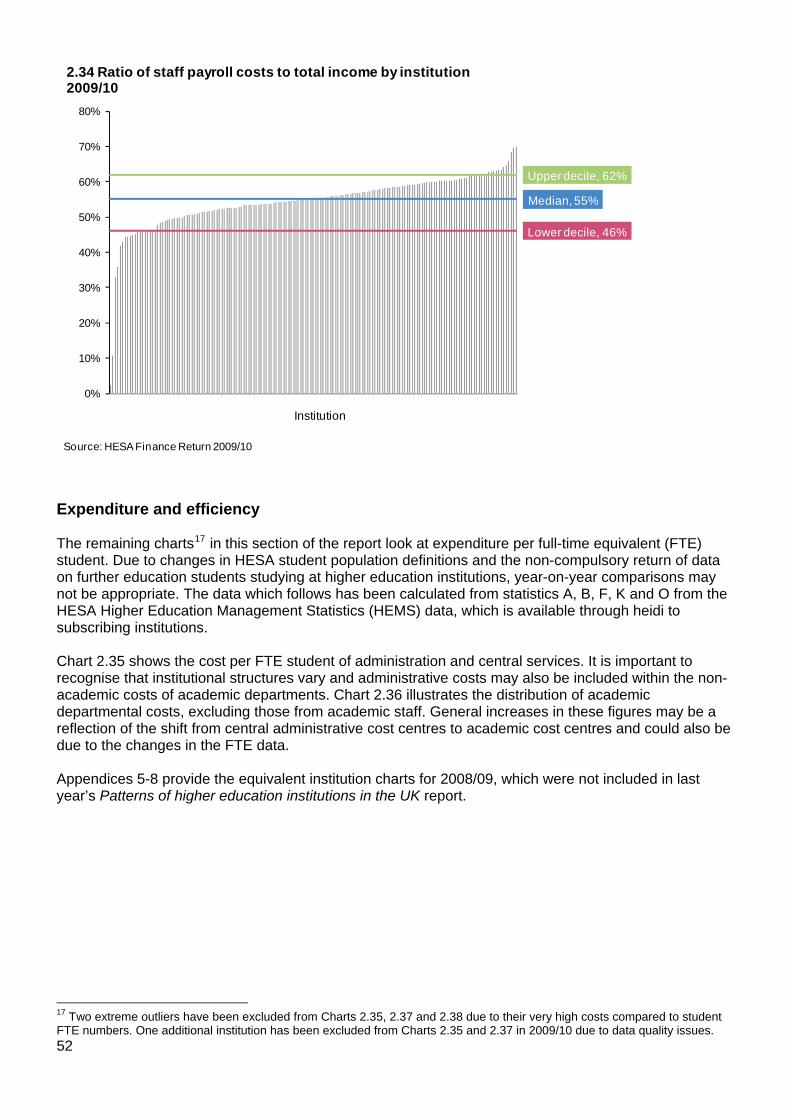
Lower decile, 46%
Median, 55%
Upper decile, 62%
0%
10%
20%
30%
40%
50%
60%
70%
80%
Institution
2.34 Ratio of staff payroll costs to total income by institution 2009/10
Source: HESA Finance Return 2009/10
Expenditure and efficiency The remaining charts17 in this section of the report look at expenditure per full-time equivalent (FTE) student. Due to changes in HESA student population definitions and the non-compulsory return of data on further education students studying at higher education institutions, year-on-year comparisons may not be appropriate. The data which follows has been calculated from statistics A, B, F, K and O from the HESA Higher Education Management Statistics (HEMS) data, which is available through heidi to subscribing institutions. Chart 2.35 shows the cost per FTE student of administration and central services. It is important to recognise that institutional structures vary and administrative costs may also be included within the non-academic costs of academic departments. Chart 2.36 illustrates the distribution of academic departmental costs, excluding those from academic staff. General increases in these figures may be a reflection of the shift from central administrative cost centres to academic cost centres and could also be due to the changes in the FTE data. Appendices 5-8 provide the equivalent institution charts for 2008/09, which were not included in last year’s Patterns of higher education institutions in the UK report.
52
17 Two extreme outliers have been excluded from Charts 2.35, 2.37 and 2.38 due to their very high costs compared to student FTE numbers. One additional institution has been excluded from Charts 2.35 and 2.37 in 2009/10 due to data quality issues.
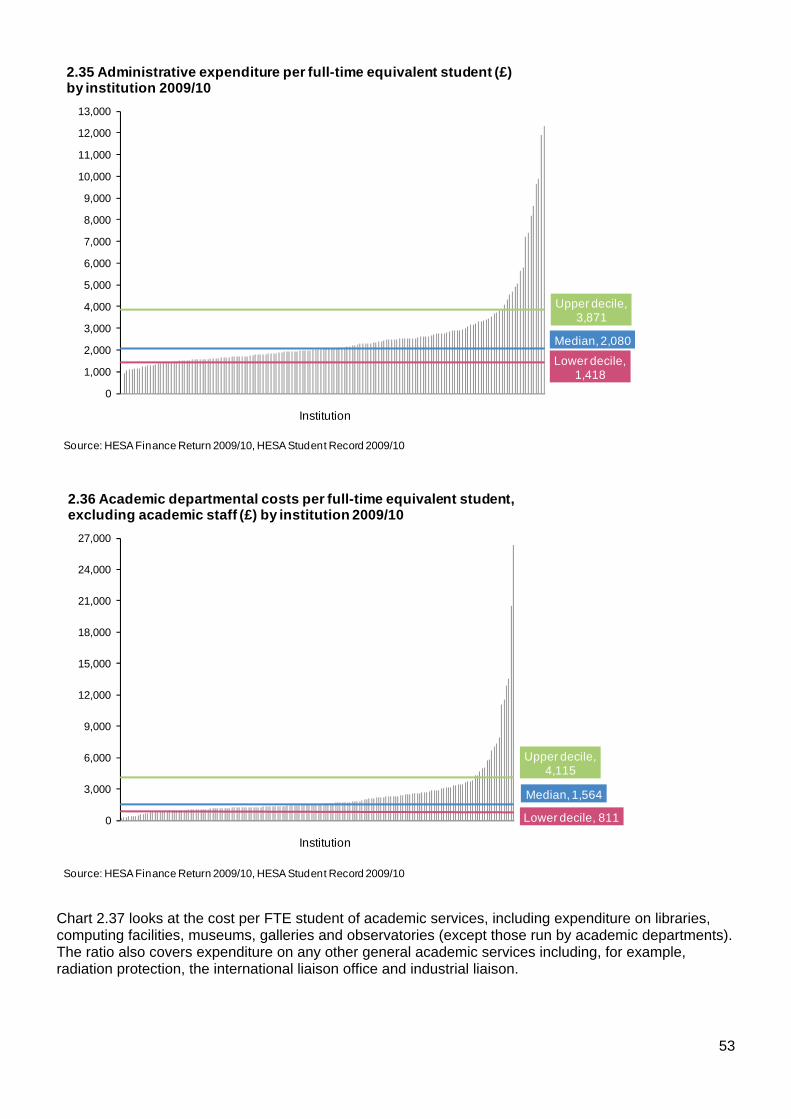
Lower decile, 1,418
Median, 2,080
Upper decile, 3,871
0
1,000
2,000
3,000
4,000
5,000
6,000
7,000
8,000
9,000
10,000
11,000
12,000
13,000
Institution
2.35 Administrative expenditure per full-time equivalent student (£) by institution 2009/10
Source: HESA Finance Return 2009/10, HESA Student Record 2009/10
Lower decile, 811
Median, 1,564
Upper decile, 4,115
0
3,000
6,000
9,000
12,000
15,000
18,000
21,000
24,000
27,000
Institution
2.36 Academic departmental costs per full-time equivalent student, excluding academic staff (£) by institution 2009/10
Source: HESA Finance Return 2009/10, HESA Student Record 2009/10
Chart 2.37 looks at the cost per FTE student of academic services, including expenditure on libraries, computing facilities, museums, galleries and observatories (except those run by academic departments). The ratio also covers expenditure on any other general academic services including, for example, radiation protection, the international liaison office and industrial liaison.
53
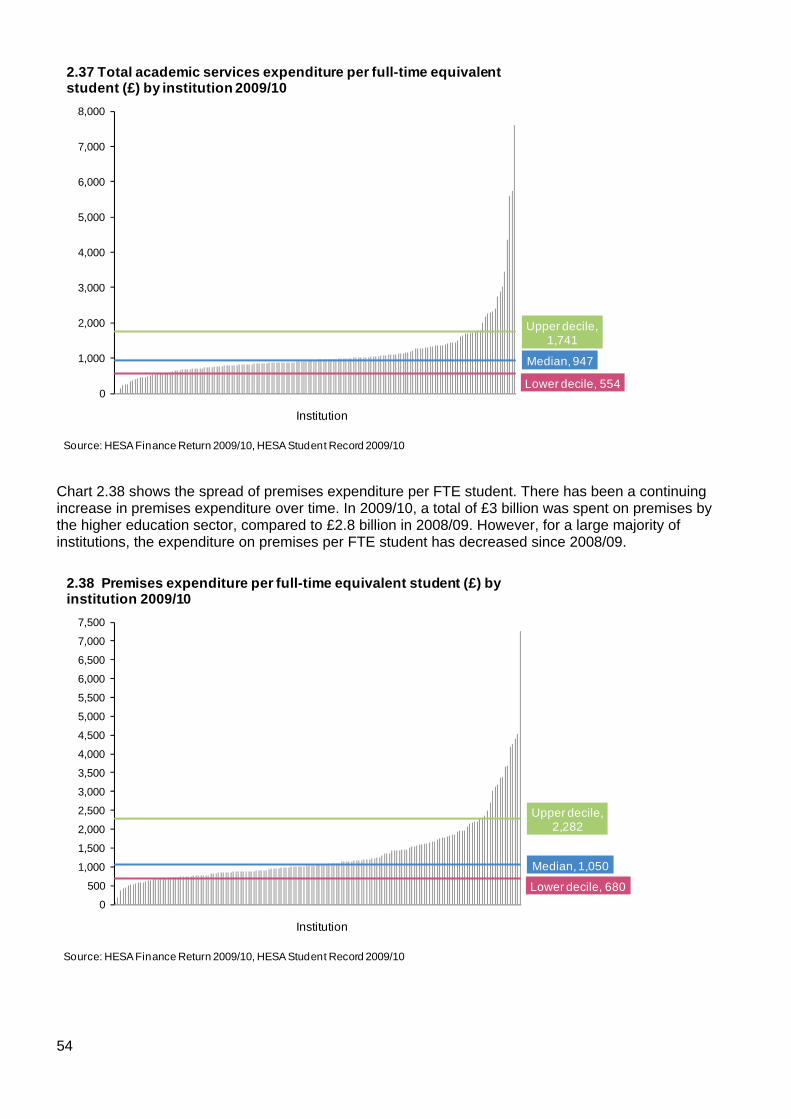
Lower decile, 554
Median, 947
Upper decile, 1,741
0
1,000
2,000
3,000
4,000
5,000
6,000
7,000
8,000
Institution
2.37 Total academic services expenditure per full-time equivalent student (£) by institution 2009/10
Source: HESA Finance Return 2009/10, HESA Student Record 2009/10
Chart 2.38 shows the spread of premises expenditure per FTE student. There has been a continuing increase in premises expenditure over time. In 2009/10, a total of £3 billion was spent on premises by the higher education sector, compared to £2.8 billion in 2008/09. However, for a large majority of institutions, the expenditure on premises per FTE student has decreased since 2008/09.
Lower decile, 680
Median, 1,050
Upper decile, 2,282
0
500
1,000
1,500
2,000
2,500
3,000
3,500
4,000
4,500
5,000
5,500
6,000
6,500
7,000
7,500
Institution
2.38 Premises expenditure per full-time equivalent student (£) by institution 2009/10
Source: HESA Finance Return 2009/10, HESA Student Record 2009/10
54
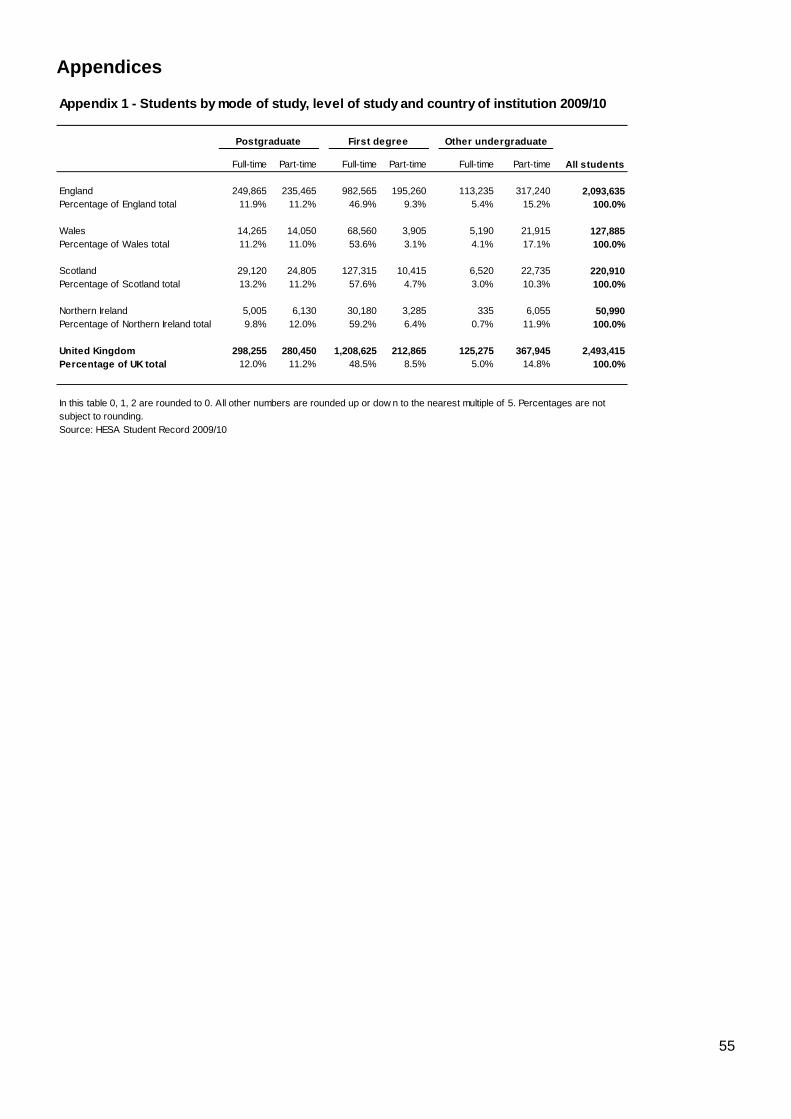
Appendices
Full-time Part-time Full-time Part-time Full-time Part-time All students
England 249,865 235,465 982,565 195,260 113,235 317,240 2,093,635Percentage of England total 11.9% 11.2% 46.9% 9.3% 5.4% 15.2% 100.0%
Wales 14,265 14,050 68,560 3,905 5,190 21,915 127,885Percentage of Wales total 11.2% 11.0% 53.6% 3.1% 4.1% 17.1% 100.0%
Scotland 29,120 24,805 127,315 10,415 6,520 22,735 220,910Percentage of Scotland total 13.2% 11.2% 57.6% 4.7% 3.0% 10.3% 100.0%
Northern Ireland 5,005 6,130 30,180 3,285 335 6,055 50,990Percentage of Northern Ireland total 9.8% 12.0% 59.2% 6.4% 0.7% 11.9% 100.0%
United Kingdom 298,255 280,450 1,208,625 212,865 125,275 367,945 2,493,415Percentage of UK total 12.0% 11.2% 48.5% 8.5% 5.0% 14.8% 100.0%
Source: HESA Student Record 2009/10
Other undergraduate
Appendix 1 - Students by mode of study, level of study and country of institution 2009/10
Postgraduate First degree
In this table 0, 1, 2 are rounded to 0. All other numbers are rounded up or dow n to the nearest multiple of 5. Percentages are not subject to rounding.
55
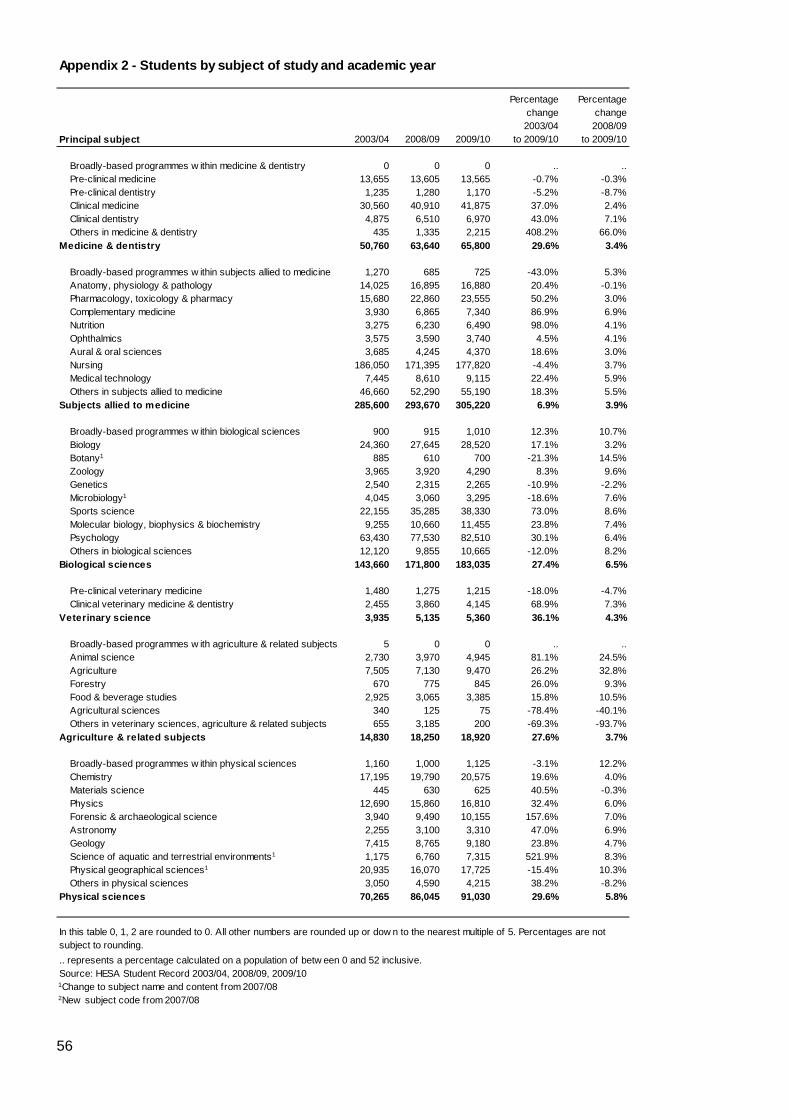
Principal subject 2003/04 2008/09 2009/10
Percentage change 2003/04
to 2009/10
Percentage change 2008/09
to 2009/10
Broadly-based programmes w ithin medicine & dentistry 0 0 0 .. ..Pre-clinical medicine 13,655 13,605 13,565 -0.7% -0.3%Pre-clinical dentistry 1,235 1,280 1,170 -5.2% -8.7%Clinical medicine 30,560 40,910 41,875 37.0% 2.4%Clinical dentistry 4,875 6,510 6,970 43.0% 7.1%Others in medicine & dentistry 435 1,335 2,215 408.2% 66.0%
Medicine & dentistry 50,760 63,640 65,800 29.6% 3.4%
Broadly-based programmes w ithin subjects allied to medicine 1,270 685 725 -43.0% 5.3%Anatomy, physiology & pathology 14,025 16,895 16,880 20.4% -0.1%Pharmacology, toxicology & pharmacy 15,680 22,860 23,555 50.2% 3.0%Complementary medicine 3,930 6,865 7,340 86.9% 6.9%Nutrition 3,275 6,230 6,490 98.0% 4.1%Ophthalmics 3,575 3,590 3,740 4.5% 4.1%Aural & oral sciences 3,685 4,245 4,370 18.6% 3.0%Nursing 186,050 171,395 177,820 -4.4% 3.7%Medical technology 7,445 8,610 9,115 22.4% 5.9%Others in subjects allied to medicine 46,660 52,290 55,190 18.3% 5.5%
Subjects allied to medicine 285,600 293,670 305,220 6.9% 3.9%
Broadly-based programmes w ithin biological sciences 900 915 1,010 12.3% 10.7%Biology 24,360 27,645 28,520 17.1% 3.2%Botany1 885 610 700 -21.3% 14.5%Zoology 3,965 3,920 4,290 8.3% 9.6%Genetics 2,540 2,315 2,265 -10.9% -2.2%Microbiology1 4,045 3,060 3,295 -18.6% 7.6%Sports science 22,155 35,285 38,330 73.0% 8.6%Molecular biology, biophysics & biochemistry 9,255 10,660 11,455 23.8% 7.4%Psychology 63,430 77,530 82,510 30.1% 6.4%Others in biological sciences 12,120 9,855 10,665 -12.0% 8.2%
Biological sciences 143,660 171,800 183,035 27.4% 6.5%
Pre-clinical veterinary medicine 1,480 1,275 1,215 -18.0% -4.7%Clinical veterinary medicine & dentistry 2,455 3,860 4,145 68.9% 7.3%
Veterinary science 3,935 5,135 5,360 36.1% 4.3%
Broadly-based programmes w ith agriculture & related subjects 5 0 0 .. ..Animal science 2,730 3,970 4,945 81.1% 24.5%Agriculture 7,505 7,130 9,470 26.2% 32.8%Forestry 670 775 845 26.0% 9.3%Food & beverage studies 2,925 3,065 3,385 15.8% 10.5%Agricultural sciences 340 125 75 -78.4% -40.1%Others in veterinary sciences, agriculture & related subjects 655 3,185 200 -69.3% -93.7%
Agriculture & related subjects 14,830 18,250 18,920 27.6% 3.7%
Broadly-based programmes w ithin physical sciences 1,160 1,000 1,125 -3.1% 12.2%Chemistry 17,195 19,790 20,575 19.6% 4.0%Materials science 445 630 625 40.5% -0.3%Physics 12,690 15,860 16,810 32.4% 6.0%Forensic & archaeological science 3,940 9,490 10,155 157.6% 7.0%Astronomy 2,255 3,100 3,310 47.0% 6.9%Geology 7,415 8,765 9,180 23.8% 4.7%Science of aquatic and terrestrial environments1 1,175 6,760 7,315 521.9% 8.3%Physical geographical sciences1 20,935 16,070 17,725 -15.4% 10.3%Others in physical sciences 3,050 4,590 4,215 38.2% -8.2%
Physical sciences 70,265 86,045 91,030 29.6% 5.8%
.. represents a percentage calculated on a population of betw een 0 and 52 inclusive.Source: HESA Student Record 2003/04, 2008/09, 2009/101Change to subject name and content from 2007/082New subject code from 2007/08
Appendix 2 - Students by subject of study and academic year
In this table 0, 1, 2 are rounded to 0. All other numbers are rounded up or dow n to the nearest multiple of 5. Percentages are not subject to rounding.
56
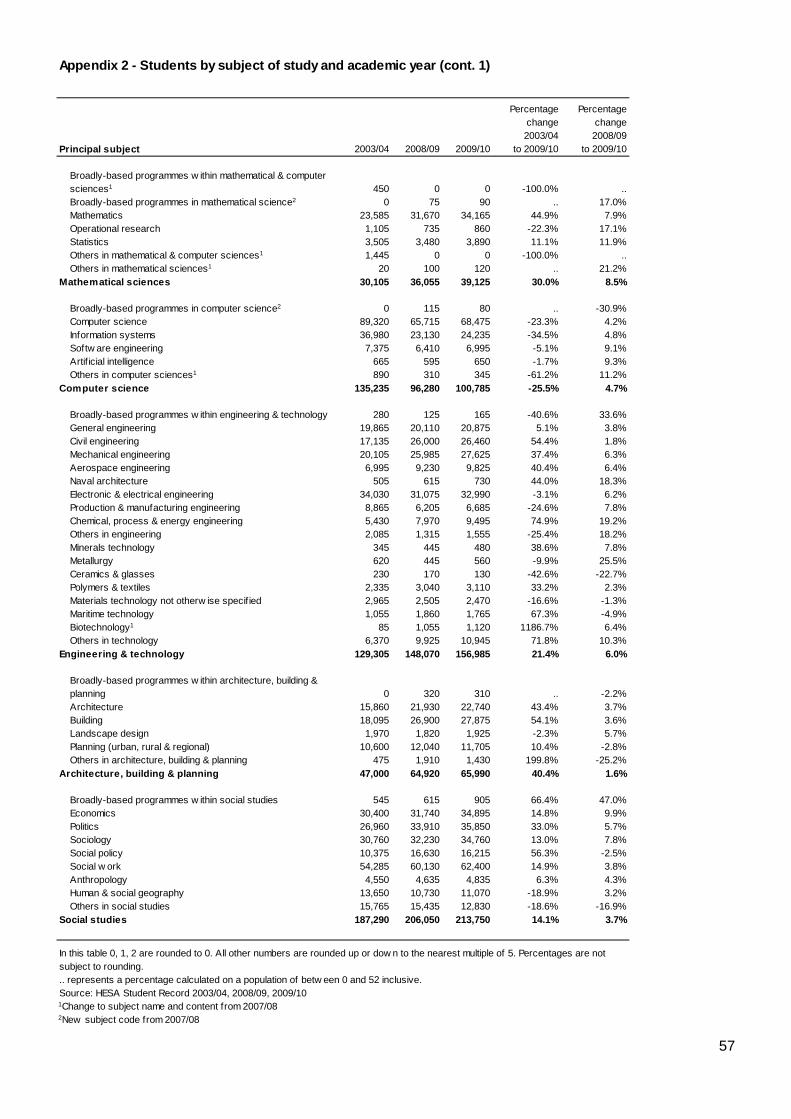
Principal subject 2003/04 2008/09 2009/10
Percentage change 2003/04
to 2009/10
Percentage change 2008/09
to 2009/10
Broadly-based programmes w ithin mathematical & computer sciences1 450 0 0 -100.0% ..Broadly-based programmes in mathematical science2 0 75 90 .. 17.0%Mathematics 23,585 31,670 34,165 44.9% 7.9%Operational research 1,105 735 860 -22.3% 17.1%Statistics 3,505 3,480 3,890 11.1% 11.9%Others in mathematical & computer sciences1 1,445 0 0 -100.0% ..Others in mathematical sciences1 20 100 120 .. 21.2%
Mathematical sciences 30,105 36,055 39,125 30.0% 8.5%
Broadly-based programmes in computer science2 0 115 80 .. -30.9%Computer science 89,320 65,715 68,475 -23.3% 4.2%Information systems 36,980 23,130 24,235 -34.5% 4.8%Softw are engineering 7,375 6,410 6,995 -5.1% 9.1%Artif icial intelligence 665 595 650 -1.7% 9.3%Others in computer sciences1 890 310 345 -61.2% 11.2%
Computer science 135,235 96,280 100,785 -25.5% 4.7%
Broadly-based programmes w ithin engineering & technology 280 125 165 -40.6% 33.6%General engineering 19,865 20,110 20,875 5.1% 3.8%Civil engineering 17,135 26,000 26,460 54.4% 1.8%Mechanical engineering 20,105 25,985 27,625 37.4% 6.3%Aerospace engineering 6,995 9,230 9,825 40.4% 6.4%Naval architecture 505 615 730 44.0% 18.3%Electronic & electrical engineering 34,030 31,075 32,990 -3.1% 6.2%Production & manufacturing engineering 8,865 6,205 6,685 -24.6% 7.8%Chemical, process & energy engineering 5,430 7,970 9,495 74.9% 19.2%Others in engineering 2,085 1,315 1,555 -25.4% 18.2%Minerals technology 345 445 480 38.6% 7.8%Metallurgy 620 445 560 -9.9% 25.5%Ceramics & glasses 230 170 130 -42.6% -22.7%Polymers & textiles 2,335 3,040 3,110 33.2% 2.3%Materials technology not otherw ise specif ied 2,965 2,505 2,470 -16.6% -1.3%Maritime technology 1,055 1,860 1,765 67.3% -4.9%Biotechnology1 85 1,055 1,120 1186.7% 6.4%Others in technology 6,370 9,925 10,945 71.8% 10.3%
Engineering & technology 129,305 148,070 156,985 21.4% 6.0%
Broadly-based programmes w ithin architecture, building & planning 0 320 310 .. -2.2%Architecture 15,860 21,930 22,740 43.4% 3.7%Building 18,095 26,900 27,875 54.1% 3.6%Landscape design 1,970 1,820 1,925 -2.3% 5.7%Planning (urban, rural & regional) 10,600 12,040 11,705 10.4% -2.8%Others in architecture, building & planning 475 1,910 1,430 199.8% -25.2%
Architecture, building & planning 47,000 64,920 65,990 40.4% 1.6%
Broadly-based programmes w ithin social studies 545 615 905 66.4% 47.0%Economics 30,400 31,740 34,895 14.8% 9.9%Politics 26,960 33,910 35,850 33.0% 5.7%Sociology 30,760 32,230 34,760 13.0% 7.8%Social policy 10,375 16,630 16,215 56.3% -2.5%Social w ork 54,285 60,130 62,400 14.9% 3.8%Anthropology 4,550 4,635 4,835 6.3% 4.3%Human & social geography 13,650 10,730 11,070 -18.9% 3.2%Others in social studies 15,765 15,435 12,830 -18.6% -16.9%
Social studies 187,290 206,050 213,750 14.1% 3.7%
.. represents a percentage calculated on a population of betw een 0 and 52 inclusive.Source: HESA Student Record 2003/04, 2008/09, 2009/101Change to subject name and content from 2007/082New subject code from 2007/08
Appendix 2 - Students by subject of study and academic year (cont. 1)
In this table 0, 1, 2 are rounded to 0. All other numbers are rounded up or dow n to the nearest multiple of 5. Percentages are not subject to rounding.
57
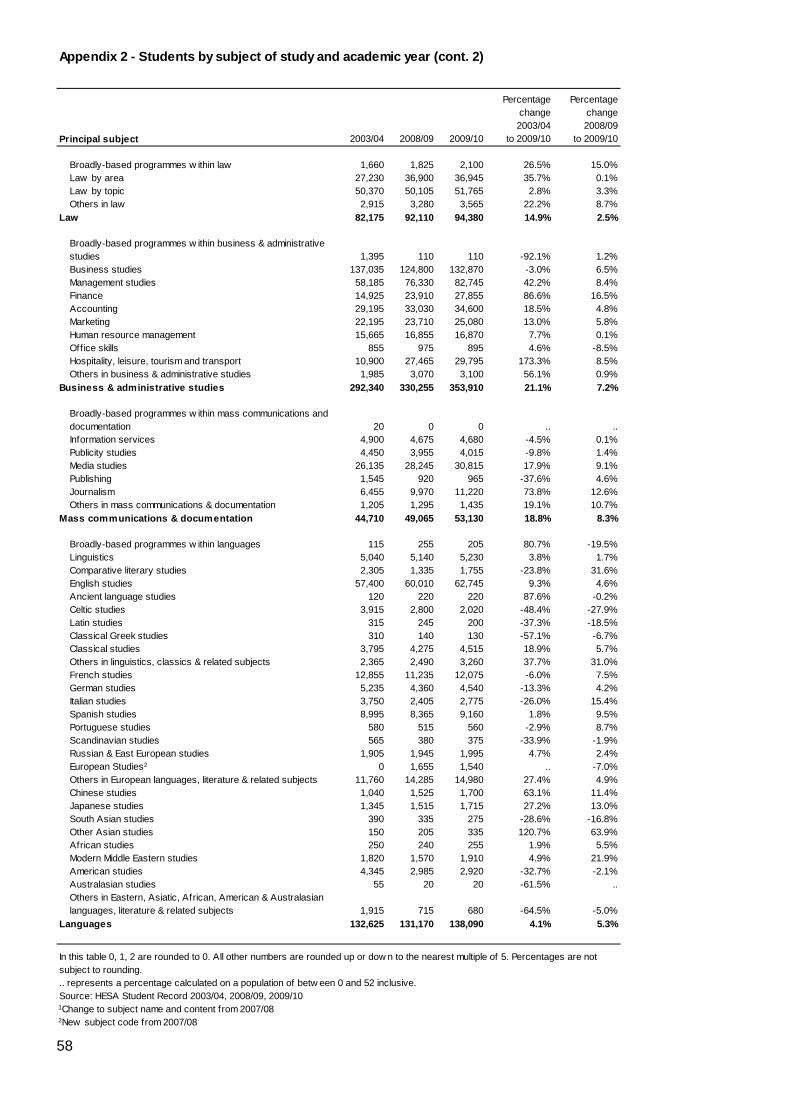
Principal subject 2003/04 2008/09 2009/10
Percentage change 2003/04
to 2009/10
Percentage change 2008/09
to 2009/10
Broadly-based programmes w ithin law 1,660 1,825 2,100 26.5% 15.0%Law by area 27,230 36,900 36,945 35.7% 0.1%Law by topic 50,370 50,105 51,765 2.8% 3.3%Others in law 2,915 3,280 3,565 22.2% 8.7%
Law 82,175 92,110 94,380 14.9% 2.5%
Broadly-based programmes w ithin business & administrative studies 1,395 110 110 -92.1% 1.2%Business studies 137,035 124,800 132,870 -3.0% 6.5%Management studies 58,185 76,330 82,745 42.2% 8.4%Finance 14,925 23,910 27,855 86.6% 16.5%Accounting 29,195 33,030 34,600 18.5% 4.8%Marketing 22,195 23,710 25,080 13.0% 5.8%Human resource management 15,665 16,855 16,870 7.7% 0.1%Office skills 855 975 895 4.6% -8.5%Hospitality, leisure, tourism and transport 10,900 27,465 29,795 173.3% 8.5%Others in business & administrative studies 1,985 3,070 3,100 56.1% 0.9%
Business & administrative studies 292,340 330,255 353,910 21.1% 7.2%
Broadly-based programmes w ithin mass communications and documentation 20 0 0 .. ..Information services 4,900 4,675 4,680 -4.5% 0.1%Publicity studies 4,450 3,955 4,015 -9.8% 1.4%Media studies 26,135 28,245 30,815 17.9% 9.1%Publishing 1,545 920 965 -37.6% 4.6%Journalism 6,455 9,970 11,220 73.8% 12.6%Others in mass communications & documentation 1,205 1,295 1,435 19.1% 10.7%
Mass communications & documentation 44,710 49,065 53,130 18.8% 8.3%
Broadly-based programmes w ithin languages 115 255 205 80.7% -19.5%Linguistics 5,040 5,140 5,230 3.8% 1.7%Comparative literary studies 2,305 1,335 1,755 -23.8% 31.6%English studies 57,400 60,010 62,745 9.3% 4.6%Ancient language studies 120 220 220 87.6% -0.2%Celtic studies 3,915 2,800 2,020 -48.4% -27.9%Latin studies 315 245 200 -37.3% -18.5%Classical Greek studies 310 140 130 -57.1% -6.7%Classical studies 3,795 4,275 4,515 18.9% 5.7%Others in linguistics, classics & related subjects 2,365 2,490 3,260 37.7% 31.0%French studies 12,855 11,235 12,075 -6.0% 7.5%German studies 5,235 4,360 4,540 -13.3% 4.2%Italian studies 3,750 2,405 2,775 -26.0% 15.4%Spanish studies 8,995 8,365 9,160 1.8% 9.5%Portuguese studies 580 515 560 -2.9% 8.7%Scandinavian studies 565 380 375 -33.9% -1.9%Russian & East European studies 1,905 1,945 1,995 4.7% 2.4%European Studies2 0 1,655 1,540 .. -7.0%Others in European languages, literature & related subjects 11,760 14,285 14,980 27.4% 4.9%Chinese studies 1,040 1,525 1,700 63.1% 11.4%Japanese studies 1,345 1,515 1,715 27.2% 13.0%South Asian studies 390 335 275 -28.6% -16.8%Other Asian studies 150 205 335 120.7% 63.9%African studies 250 240 255 1.9% 5.5%Modern Middle Eastern studies 1,820 1,570 1,910 4.9% 21.9%American studies 4,345 2,985 2,920 -32.7% -2.1%Australasian studies 55 20 20 -61.5% ..Others in Eastern, Asiatic, African, American & Australasian languages, literature & related subjects 1,915 715 680 -64.5% -5.0%
Languages 132,625 131,170 138,090 4.1% 5.3%
.. represents a percentage calculated on a population of betw een 0 and 52 inclusive.Source: HESA Student Record 2003/04, 2008/09, 2009/101Change to subject name and content from 2007/082New subject code from 2007/08
Appendix 2 - Students by subject of study and academic year (cont. 2)
In this table 0, 1, 2 are rounded to 0. All other numbers are rounded up or dow n to the nearest multiple of 5. Percentages are not subject to rounding.
58
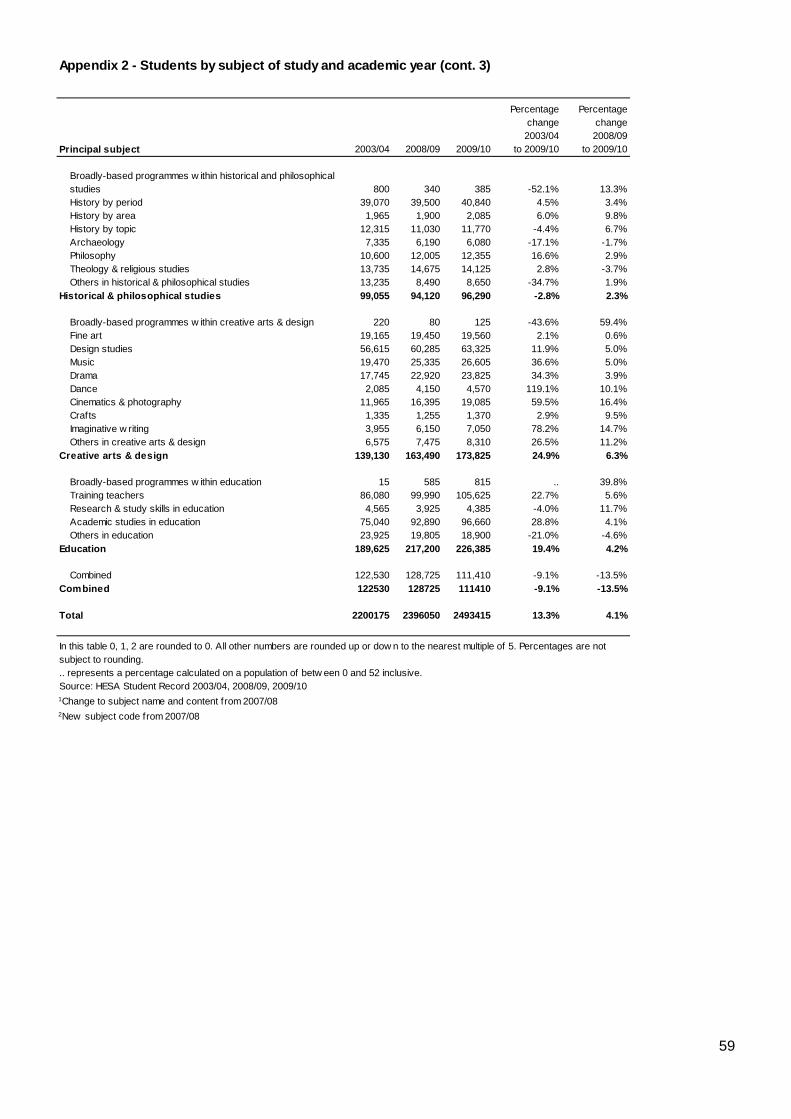
Principal subject 2003/04 2008/09 2009/10
Percentage change 2003/04
to 2009/10
Percentage change 2008/09
to 2009/10
Broadly-based programmes w ithin historical and philosophical studies 800 340 385 -52.1% 13.3%History by period 39,070 39,500 40,840 4.5% 3.4%History by area 1,965 1,900 2,085 6.0% 9.8%History by topic 12,315 11,030 11,770 -4.4% 6.7%Archaeology 7,335 6,190 6,080 -17.1% -1.7%Philosophy 10,600 12,005 12,355 16.6% 2.9%Theology & religious studies 13,735 14,675 14,125 2.8% -3.7%Others in historical & philosophical studies 13,235 8,490 8,650 -34.7% 1.9%
Historical & philosophical studies 99,055 94,120 96,290 -2.8% 2.3%
Broadly-based programmes w ithin creative arts & design 220 80 125 -43.6% 59.4%Fine art 19,165 19,450 19,560 2.1% 0.6%Design studies 56,615 60,285 63,325 11.9% 5.0%Music 19,470 25,335 26,605 36.6% 5.0%Drama 17,745 22,920 23,825 34.3% 3.9%Dance 2,085 4,150 4,570 119.1% 10.1%Cinematics & photography 11,965 16,395 19,085 59.5% 16.4%Crafts 1,335 1,255 1,370 2.9% 9.5%Imaginative w riting 3,955 6,150 7,050 78.2% 14.7%Others in creative arts & design 6,575 7,475 8,310 26.5% 11.2%
Creative arts & design 139,130 163,490 173,825 24.9% 6.3%
Broadly-based programmes w ithin education 15 585 815 .. 39.8%Training teachers 86,080 99,990 105,625 22.7% 5.6%Research & study skills in education 4,565 3,925 4,385 -4.0% 11.7%Academic studies in education 75,040 92,890 96,660 28.8% 4.1%Others in education 23,925 19,805 18,900 -21.0% -4.6%
Education 189,625 217,200 226,385 19.4% 4.2%
Combined 122,530 128,725 111,410 -9.1% -13.5%Combined 122530 128725 111410 -9.1% -13.5%
Total 2200175 2396050 2493415 13.3% 4.1%
.. represents a percentage calculated on a population of betw een 0 and 52 inclusive.Source: HESA Student Record 2003/04, 2008/09, 2009/101Change to subject name and content from 2007/082New subject code from 2007/08
In this table 0, 1, 2 are rounded to 0. All other numbers are rounded up or dow n to the nearest multiple of 5. Percentages are not subject to rounding.
Appendix 2 - Students by subject of study and academic year (cont. 3)
59
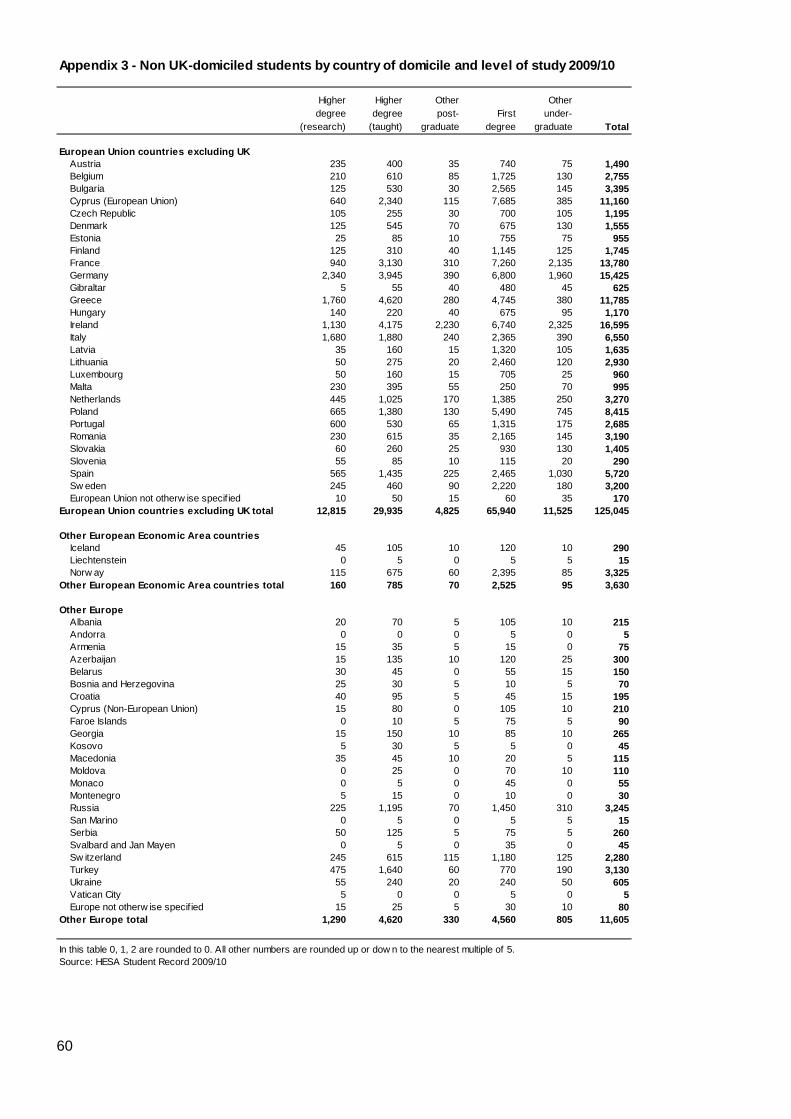
Higher degree
(research)
Higher degree
(taught)
Other post-
graduateFirst
degree
Other under-
graduate Total
European Union countries excluding UKAustria 235 400 35 740 75 1,490Belgium 210 610 85 1,725 130 2,755Bulgaria 125 530 30 2,565 145 3,395Cyprus (European Union) 640 2,340 115 7,685 385 11,160Czech Republic 105 255 30 700 105 1,195Denmark 125 545 70 675 130 1,555Estonia 25 85 10 755 75 955Finland 125 310 40 1,145 125 1,745France 940 3,130 310 7,260 2,135 13,780Germany 2,340 3,945 390 6,800 1,960 15,425Gibraltar 5 55 40 480 45 625Greece 1,760 4,620 280 4,745 380 11,785Hungary 140 220 40 675 95 1,170Ireland 1,130 4,175 2,230 6,740 2,325 16,595Italy 1,680 1,880 240 2,365 390 6,550Latvia 35 160 15 1,320 105 1,635Lithuania 50 275 20 2,460 120 2,930Luxembourg 50 160 15 705 25 960Malta 230 395 55 250 70 995Netherlands 445 1,025 170 1,385 250 3,270Poland 665 1,380 130 5,490 745 8,415Portugal 600 530 65 1,315 175 2,685Romania 230 615 35 2,165 145 3,190Slovakia 60 260 25 930 130 1,405Slovenia 55 85 10 115 20 290Spain 565 1,435 225 2,465 1,030 5,720Sw eden 245 460 90 2,220 180 3,200European Union not otherw ise specif ied 10 50 15 60 35 170
European Union countries excluding UK total 12,815 29,935 4,825 65,940 11,525 125,045
Other European Economic Area countriesIceland 45 105 10 120 10 290Liechtenstein 0 5 0 5 5 15Norw ay 115 675 60 2,395 85 3,325
Other European Economic Area countries total 160 785 70 2,525 95 3,630
Other EuropeAlbania 20 70 5 105 10 215Andorra 0 0 0 5 0 5Armenia 15 35 5 15 0 75Azerbaijan 15 135 10 120 25 300Belarus 30 45 0 55 15 150Bosnia and Herzegovina 25 30 5 10 5 70Croatia 40 95 5 45 15 195Cyprus (Non-European Union) 15 80 0 105 10 210Faroe Islands 0 10 5 75 5 90Georgia 15 150 10 85 10 265Kosovo 5 30 5 5 0 45Macedonia 35 45 10 20 5 115Moldova 0 25 0 70 10 110Monaco 0 5 0 45 0 55Montenegro 5 15 0 10 0 30Russia 225 1,195 70 1,450 310 3,245San Marino 0 5 0 5 5 15Serbia 50 125 5 75 5 260Svalbard and Jan Mayen 0 5 0 35 0 45Sw itzerland 245 615 115 1,180 125 2,280Turkey 475 1,640 60 770 190 3,130Ukraine 55 240 20 240 50 605Vatican City 5 0 0 5 0 5Europe not otherw ise specif ied 15 25 5 30 10 80
Other Europe total 1,290 4,620 330 4,560 805 11,605
In this table 0, 1, 2 are rounded to 0. All other numbers are rounded up or dow n to the nearest multiple of 5.Source: HESA Student Record 2009/10
Appendix 3 - Non UK-domiciled students by country of domicile and level of study 2009/10
60
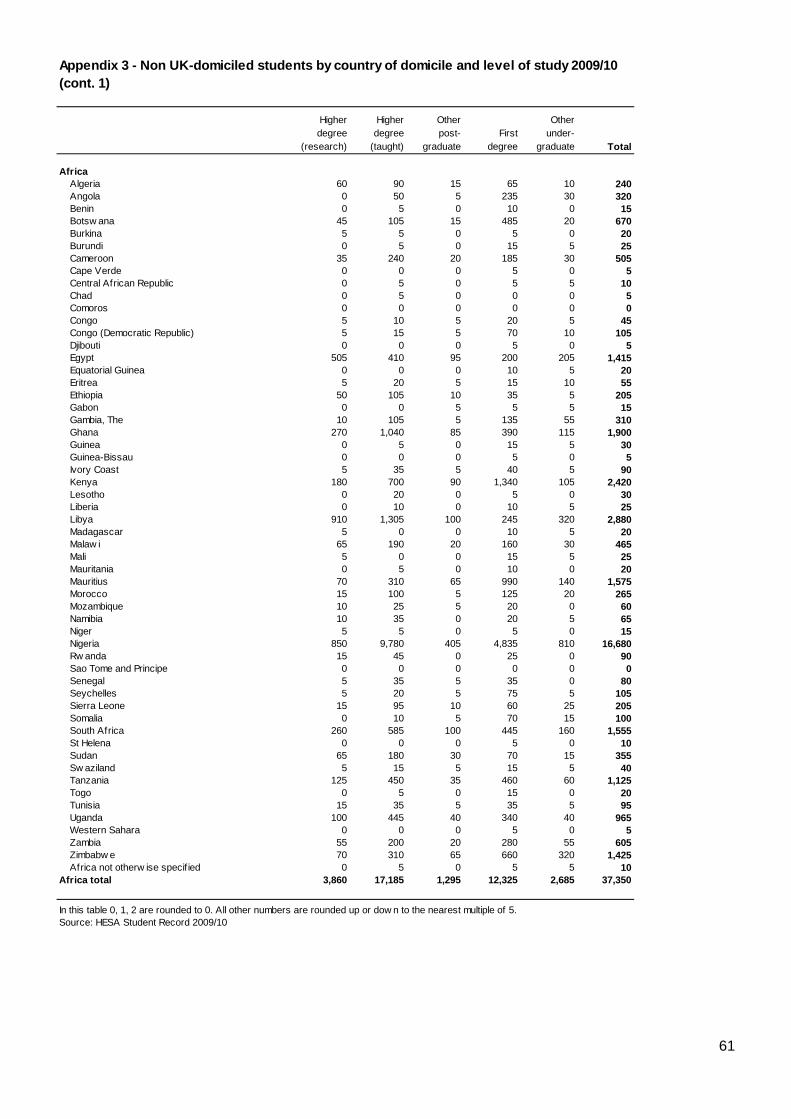
Higher degree
(research)
Higher degree
(taught)
Other post-
graduateFirst
degree
Other under-
graduate Total
AfricaAlgeria 60 90 15 65 10 240Angola 0 50 5 235 30 320Benin 0 5 0 10 0 15Botsw ana 45 105 15 485 20 670Burkina 5 5 0 5 0 20Burundi 0 5 0 15 5 25Cameroon 35 240 20 185 30 505Cape Verde 0 0 0 5 0 5Central African Republic 0 5 0 5 5 10Chad 0 5 0 0 0 5Comoros 0 0 0 0 0 0Congo 5 10 5 20 5 45Congo (Democratic Republic) 5 15 5 70 10 105Djibouti 0 0 0 5 0 5Egypt 505 410 95 200 205 1,415Equatorial Guinea 0 0 0 10 5 20Eritrea 5 20 5 15 10 55Ethiopia 50 105 10 35 5 205Gabon 0 0 5 5 5 15Gambia, The 10 105 5 135 55 310Ghana 270 1,040 85 390 115 1,900Guinea 0 5 0 15 5 30Guinea-Bissau 0 0 0 5 0 5Ivory Coast 5 35 5 40 5 90Kenya 180 700 90 1,340 105 2,420Lesotho 0 20 0 5 0 30Liberia 0 10 0 10 5 25Libya 910 1,305 100 245 320 2,880Madagascar 5 0 0 10 5 20Malaw i 65 190 20 160 30 465Mali 5 0 0 15 5 25Mauritania 0 5 0 10 0 20Mauritius 70 310 65 990 140 1,575Morocco 15 100 5 125 20 265Mozambique 10 25 5 20 0 60Namibia 10 35 0 20 5 65Niger 5 5 0 5 0 15Nigeria 850 9,780 405 4,835 810 16,680Rw anda 15 45 0 25 0 90Sao Tome and Principe 0 0 0 0 0 0Senegal 5 35 5 35 0 80Seychelles 5 20 5 75 5 105Sierra Leone 15 95 10 60 25 205Somalia 0 10 5 70 15 100South Africa 260 585 100 445 160 1,555St Helena 0 0 0 5 0 10Sudan 65 180 30 70 15 355Sw aziland 5 15 5 15 5 40Tanzania 125 450 35 460 60 1,125Togo 0 5 0 15 0 20Tunisia 15 35 5 35 5 95Uganda 100 445 40 340 40 965Western Sahara 0 0 0 5 0 5Zambia 55 200 20 280 55 605Zimbabw e 70 310 65 660 320 1,425Africa not otherw ise specif ied 0 5 0 5 5 10
Africa total 3,860 17,185 1,295 12,325 2,685 37,350
In this table 0, 1, 2 are rounded to 0. All other numbers are rounded up or dow n to the nearest multiple of 5.Source: HESA Student Record 2009/10
Appendix 3 - Non UK-domiciled students by country of domicile and level of study 2009/10 (cont. 1)
61
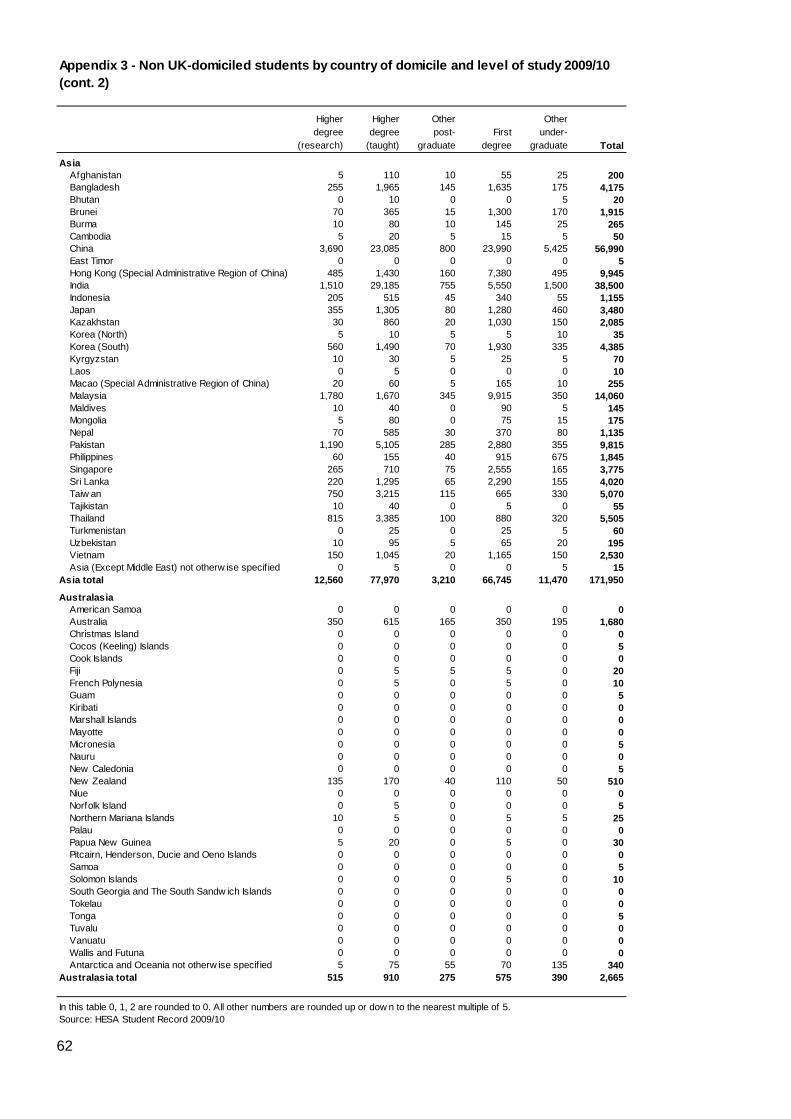
Higher degree
(research)
Higher degree
(taught)
Other post-
graduateFirst
degree
Other under-
graduate Total
AsiaAfghanistan 5 110 10 55 25 200Bangladesh 255 1,965 145 1,635 175 4,175Bhutan 0 10 0 0 5 20Brunei 70 365 15 1,300 170 1,915Burma 10 80 10 145 25 265Cambodia 5 20 5 15 5 50China 3,690 23,085 800 23,990 5,425 56,990East Timor 0 0 0 0 0 5Hong Kong (Special Administrative Region of China) 485 1,430 160 7,380 495 9,945India 1,510 29,185 755 5,550 1,500 38,500Indonesia 205 515 45 340 55 1,155Japan 355 1,305 80 1,280 460 3,480Kazakhstan 30 860 20 1,030 150 2,085Korea (North) 5 10 5 5 10 35Korea (South) 560 1,490 70 1,930 335 4,385Kyrgyzstan 10 30 5 25 5 70Laos 0 5 0 0 0 10Macao (Special Administrative Region of China) 20 60 5 165 10 255Malaysia 1,780 1,670 345 9,915 350 14,060Maldives 10 40 0 90 5 145Mongolia 5 80 0 75 15 175Nepal 70 585 30 370 80 1,135Pakistan 1,190 5,105 285 2,880 355 9,815Philippines 60 155 40 915 675 1,845Singapore 265 710 75 2,555 165 3,775Sri Lanka 220 1,295 65 2,290 155 4,020Taiw an 750 3,215 115 665 330 5,070Tajikistan 10 40 0 5 0 55Thailand 815 3,385 100 880 320 5,505Turkmenistan 0 25 0 25 5 60Uzbekistan 10 95 5 65 20 195Vietnam 150 1,045 20 1,165 150 2,530Asia (Except Middle East) not otherw ise specif ied 0 5 0 0 5 15
Asia total 12,560 77,970 3,210 66,745 11,470 171,950
AustralasiaAmerican Samoa 0 0 0 0 0 0Australia 350 615 165 350 195 1,680Christmas Island 0 0 0 0 0 0Cocos (Keeling) Islands 0 0 0 0 0 5Cook Islands 0 0 0 0 0 0Fiji 0 5 5 5 0 20French Polynesia 0 5 0 5 0 10Guam 0 0 0 0 0 5Kiribati 0 0 0 0 0 0Marshall Islands 0 0 0 0 0 0Mayotte 0 0 0 0 0 0Micronesia 0 0 0 0 0 5Nauru 0 0 0 0 0 0New Caledonia 0 0 0 0 0 5New Zealand 135 170 40 110 50 510Niue 0 0 0 0 0 0Norfolk Island 0 5 0 0 0 5Northern Mariana Islands 10 5 0 5 5 25Palau 0 0 0 0 0 0Papua New Guinea 5 20 0 5 0 30Pitcairn, Henderson, Ducie and Oeno Islands 0 0 0 0 0 0Samoa 0 0 0 0 0 5Solomon Islands 0 0 0 5 0 10South Georgia and The South Sandw ich Islands 0 0 0 0 0 0Tokelau 0 0 0 0 0 0Tonga 0 0 0 0 0 5Tuvalu 0 0 0 0 0 0Vanuatu 0 0 0 0 0 0Wallis and Futuna 0 0 0 0 0 0Antarctica and Oceania not otherw ise specif ied 5 75 55 70 135 340
Australasia total 515 910 275 575 390 2,665
In this table 0, 1, 2 are rounded to 0. All other numbers are rounded up or dow n to the nearest multiple of 5.Source: HESA Student Record 2009/10
Appendix 3 - Non UK-domiciled students by country of domicile and level of study 2009/10 (cont. 2)
62
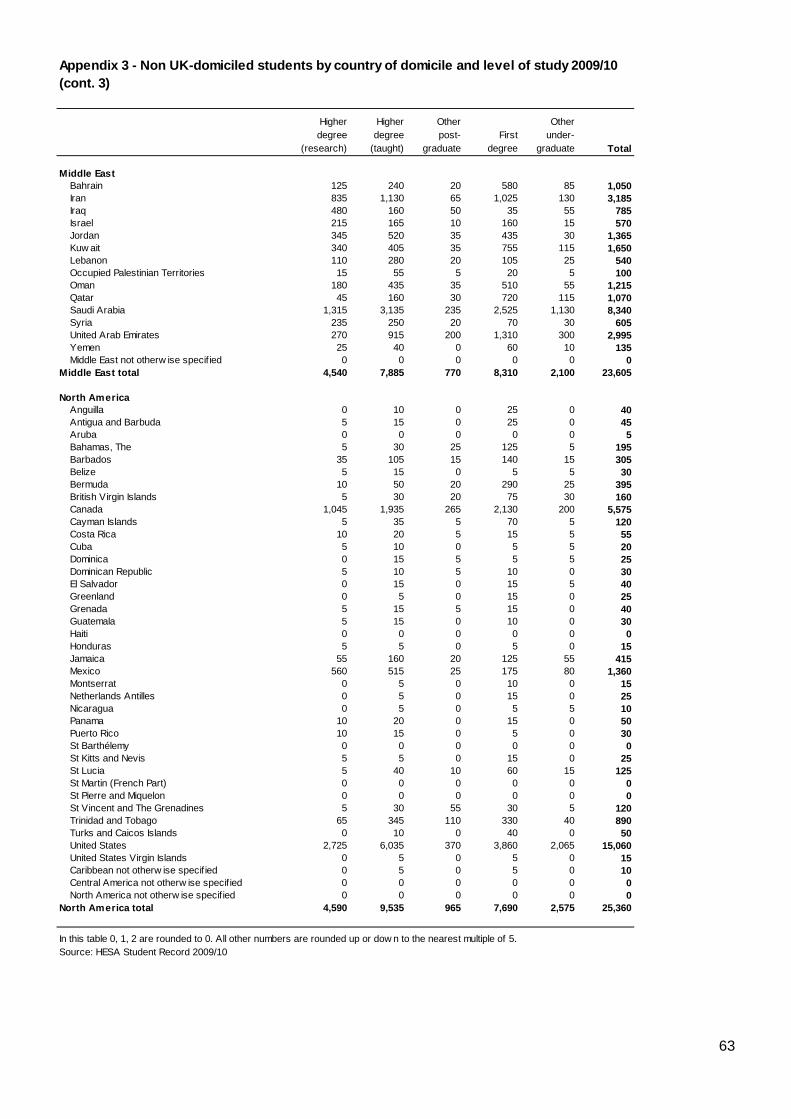
Higher degree
(research)
Higher degree
(taught)
Other post-
graduateFirst
degree
Other under-
graduate Total
Middle EastBahrain 125 240 20 580 85 1,050Iran 835 1,130 65 1,025 130 3,185Iraq 480 160 50 35 55 785Israel 215 165 10 160 15 570Jordan 345 520 35 435 30 1,365Kuw ait 340 405 35 755 115 1,650Lebanon 110 280 20 105 25 540Occupied Palestinian Territories 15 55 5 20 5 100Oman 180 435 35 510 55 1,215Qatar 45 160 30 720 115 1,070Saudi Arabia 1,315 3,135 235 2,525 1,130 8,340Syria 235 250 20 70 30 605United Arab Emirates 270 915 200 1,310 300 2,995Yemen 25 40 0 60 10 135Middle East not otherw ise specified 0 0 0 0 0 0
Middle East total 4,540 7,885 770 8,310 2,100 23,605
North AmericaAnguilla 0 10 0 25 0 40Antigua and Barbuda 5 15 0 25 0 45Aruba 0 0 0 0 0 5Bahamas, The 5 30 25 125 5 195Barbados 35 105 15 140 15 305Belize 5 15 0 5 5 30Bermuda 10 50 20 290 25 395British Virgin Islands 5 30 20 75 30 160Canada 1,045 1,935 265 2,130 200 5,575Cayman Islands 5 35 5 70 5 120Costa Rica 10 20 5 15 5 55Cuba 5 10 0 5 5 20Dominica 0 15 5 5 5 25Dominican Republic 5 10 5 10 0 30El Salvador 0 15 0 15 5 40Greenland 0 5 0 15 0 25Grenada 5 15 5 15 0 40Guatemala 5 15 0 10 0 30Haiti 0 0 0 0 0 0Honduras 5 5 0 5 0 15Jamaica 55 160 20 125 55 415Mexico 560 515 25 175 80 1,360Montserrat 0 5 0 10 0 15Netherlands Antilles 0 5 0 15 0 25Nicaragua 0 5 0 5 5 10Panama 10 20 0 15 0 50Puerto Rico 10 15 0 5 0 30St Barthélemy 0 0 0 0 0 0St Kitts and Nevis 5 5 0 15 0 25St Lucia 5 40 10 60 15 125St Martin (French Part) 0 0 0 0 0 0St Pierre and Miquelon 0 0 0 0 0 0St Vincent and The Grenadines 5 30 55 30 5 120Trinidad and Tobago 65 345 110 330 40 890Turks and Caicos Islands 0 10 0 40 0 50United States 2,725 6,035 370 3,860 2,065 15,060United States Virgin Islands 0 5 0 5 0 15Caribbean not otherw ise specif ied 0 5 0 5 0 10Central America not otherw ise specified 0 0 0 0 0 0North America not otherw ise specified 0 0 0 0 0 0
North America total 4,590 9,535 965 7,690 2,575 25,360
In this table 0, 1, 2 are rounded to 0. All other numbers are rounded up or dow n to the nearest multiple of 5.Source: HESA Student Record 2009/10
Appendix 3 - Non UK-domiciled students by country of domicile and level of study 2009/10 (cont. 3)
63
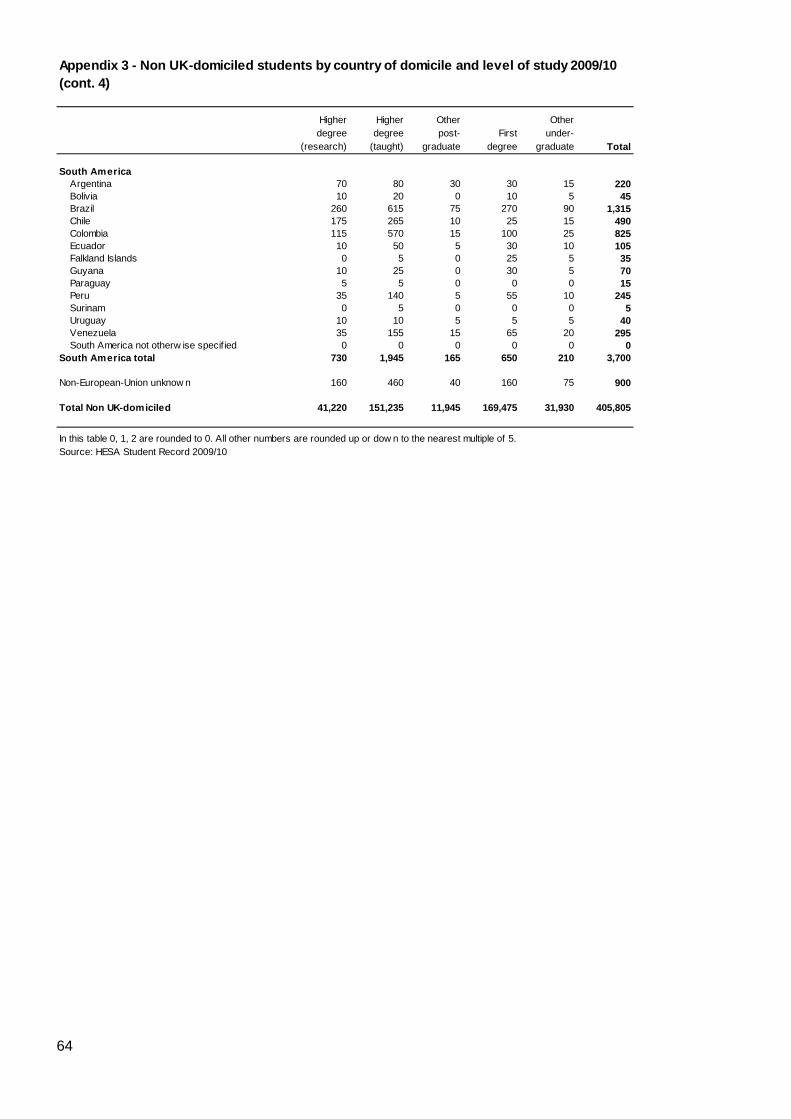
Higher degree
(research)
Higher degree
(taught)
Other post-
graduateFirst
degree
Other under-
graduate Total
South AmericaArgentina 70 80 30 30 15 220Bolivia 10 20 0 10 5 45Brazil 260 615 75 270 90 1,315Chile 175 265 10 25 15 490Colombia 115 570 15 100 25 825Ecuador 10 50 5 30 10 105Falkland Islands 0 5 0 25 5 35Guyana 10 25 0 30 5 70Paraguay 5 5 0 0 0 15Peru 35 140 5 55 10 245Surinam 0 5 0 0 0 5Uruguay 10 10 5 5 5 40Venezuela 35 155 15 65 20 295South America not otherw ise specif ied 0 0 0 0 0 0
South America total 730 1,945 165 650 210 3,700
Non-European-Union unknow n 160 460 40 160 75 900
Total Non UK-domiciled 41,220 151,235 11,945 169,475 31,930 405,805
In this table 0, 1, 2 are rounded to 0. All other numbers are rounded up or dow n to the nearest multiple of 5.Source: HESA Student Record 2009/10
Appendix 3 - Non UK-domiciled students by country of domicile and level of study 2009/10 (cont. 4)
64
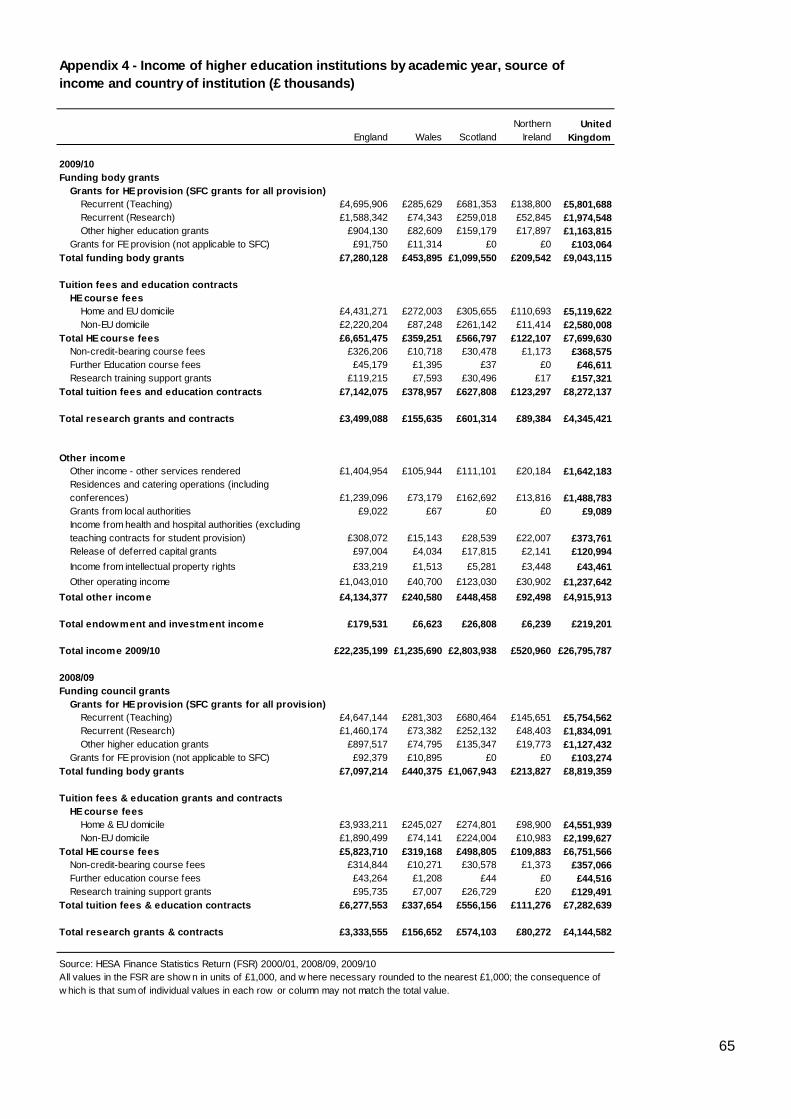
England Wales ScotlandNorthern
IrelandUnited
Kingdom
2009/10Funding body grants
Grants for HE provision (SFC grants for all provision)Recurrent (Teaching) £4,695,906 £285,629 £681,353 £138,800 £5,801,688Recurrent (Research) £1,588,342 £74,343 £259,018 £52,845 £1,974,548Other higher education grants £904,130 £82,609 £159,179 £17,897 £1,163,815
Grants for FE provision (not applicable to SFC) £91,750 £11,314 £0 £0 £103,064Total funding body grants £7,280,128 £453,895 £1,099,550 £209,542 £9,043,115
Tuition fees and education contractsHE course fees
Home and EU domicile £4,431,271 £272,003 £305,655 £110,693 £5,119,622Non-EU domicile £2,220,204 £87,248 £261,142 £11,414 £2,580,008
Total HE course fees £6,651,475 £359,251 £566,797 £122,107 £7,699,630Non-credit-bearing course fees £326,206 £10,718 £30,478 £1,173 £368,575Further Education course fees £45,179 £1,395 £37 £0 £46,611Research training support grants £119,215 £7,593 £30,496 £17 £157,321
Total tuition fees and education contracts £7,142,075 £378,957 £627,808 £123,297 £8,272,137
Total research grants and contracts £3,499,088 £155,635 £601,314 £89,384 £4,345,421
Other incomeOther income - other services rendered £1,404,954 £105,944 £111,101 £20,184 £1,642,183Residences and catering operations (including conferences) £1,239,096 £73,179 £162,692 £13,816 £1,488,783Grants from local authorities £9,022 £67 £0 £0 £9,089Income from health and hospital authorities (excluding teaching contracts for student provision) £308,072 £15,143 £28,539 £22,007 £373,761Release of deferred capital grants £97,004 £4,034 £17,815 £2,141 £120,994Income from intellectual property rights £33,219 £1,513 £5,281 £3,448 £43,461Other operating income £1,043,010 £40,700 £123,030 £30,902 £1,237,642
Total other income £4,134,377 £240,580 £448,458 £92,498 £4,915,913
Total endowment and investment income £179,531 £6,623 £26,808 £6,239 £219,201
Total income 2009/10 £22,235,199 £1,235,690 £2,803,938 £520,960 £26,795,787
2008/09Funding council grants
Grants for HE provision (SFC grants for all provision)Recurrent (Teaching) £4,647,144 £281,303 £680,464 £145,651 £5,754,562Recurrent (Research) £1,460,174 £73,382 £252,132 £48,403 £1,834,091Other higher education grants £897,517 £74,795 £135,347 £19,773 £1,127,432
Grants for FE provision (not applicable to SFC) £92,379 £10,895 £0 £0 £103,274Total funding body grants £7,097,214 £440,375 £1,067,943 £213,827 £8,819,359
Tuition fees & education grants and contractsHE course fees
Home & EU domicile £3,933,211 £245,027 £274,801 £98,900 £4,551,939Non-EU domicile £1,890,499 £74,141 £224,004 £10,983 £2,199,627
Total HE course fees £5,823,710 £319,168 £498,805 £109,883 £6,751,566Non-credit-bearing course fees £314,844 £10,271 £30,578 £1,373 £357,066Further education course fees £43,264 £1,208 £44 £0 £44,516Research training support grants £95,735 £7,007 £26,729 £20 £129,491
Total tuition fees & education contracts £6,277,553 £337,654 £556,156 £111,276 £7,282,639
Total research grants & contracts £3,333,555 £156,652 £574,103 £80,272 £4,144,582
Source: HESA Finance Statistics Return (FSR) 2000/01, 2008/09, 2009/10
Appendix 4 - Income of higher education institutions by academic year, source of income and country of institution (£ thousands)
All values in the FSR are show n in units of £1,000, and w here necessary rounded to the nearest £1,000; the consequence of w hich is that sum of individual values in each row or column may not match the total value.
65
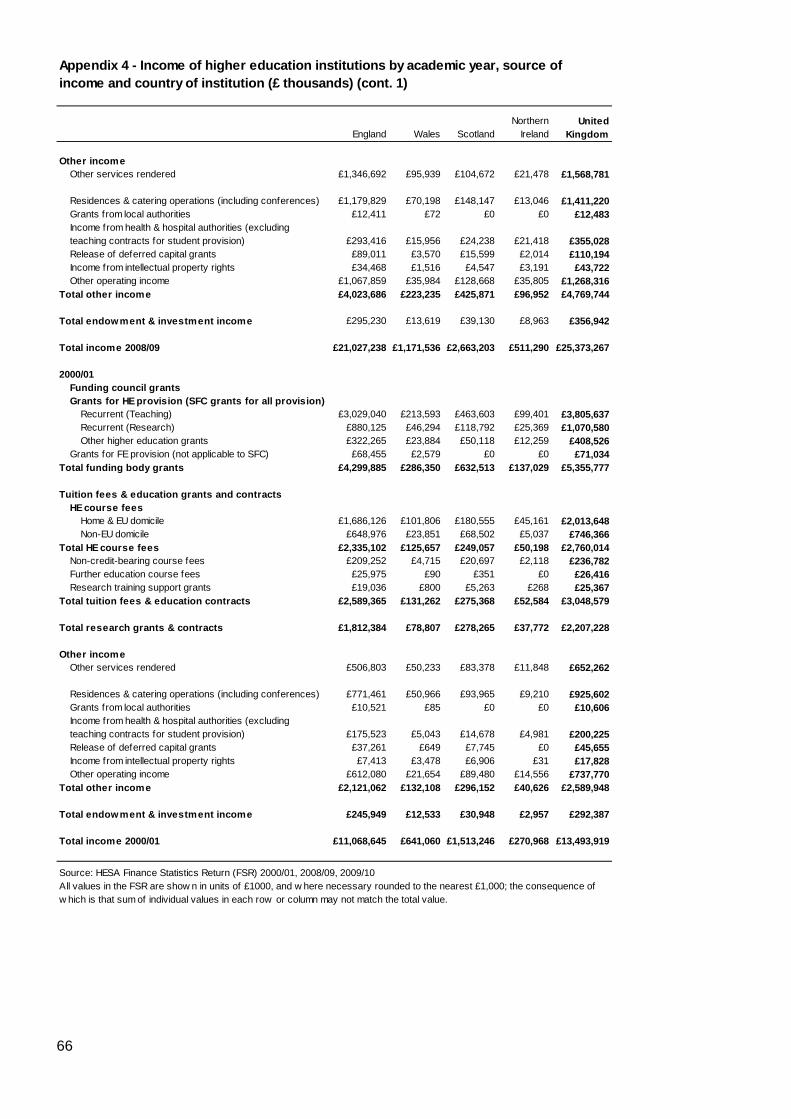
England Wales ScotlandNorthern
IrelandUnited
Kingdom
Other incomeOther services rendered £1,346,692 £95,939 £104,672 £21,478 £1,568,781
Residences & catering operations (including conferences) £1,179,829 £70,198 £148,147 £13,046 £1,411,220Grants from local authorities £12,411 £72 £0 £0 £12,483Income from health & hospital authorities (excluding teaching contracts for student provision) £293,416 £15,956 £24,238 £21,418 £355,028Release of deferred capital grants £89,011 £3,570 £15,599 £2,014 £110,194Income from intellectual property rights £34,468 £1,516 £4,547 £3,191 £43,722Other operating income £1,067,859 £35,984 £128,668 £35,805 £1,268,316
Total other income £4,023,686 £223,235 £425,871 £96,952 £4,769,744
Total endowment & investment income £295,230 £13,619 £39,130 £8,963 £356,942
Total income 2008/09 £21,027,238 £1,171,536 £2,663,203 £511,290 £25,373,267
2000/01Funding council grantsGrants for HE provision (SFC grants for all provision)
Recurrent (Teaching) £3,029,040 £213,593 £463,603 £99,401 £3,805,637Recurrent (Research) £880,125 £46,294 £118,792 £25,369 £1,070,580Other higher education grants £322,265 £23,884 £50,118 £12,259 £408,526
Grants for FE provision (not applicable to SFC) £68,455 £2,579 £0 £0 £71,034Total funding body grants £4,299,885 £286,350 £632,513 £137,029 £5,355,777
Tuition fees & education grants and contractsHE course fees
Home & EU domicile £1,686,126 £101,806 £180,555 £45,161 £2,013,648Non-EU domicile £648,976 £23,851 £68,502 £5,037 £746,366
Total HE course fees £2,335,102 £125,657 £249,057 £50,198 £2,760,014Non-credit-bearing course fees £209,252 £4,715 £20,697 £2,118 £236,782Further education course fees £25,975 £90 £351 £0 £26,416Research training support grants £19,036 £800 £5,263 £268 £25,367
Total tuition fees & education contracts £2,589,365 £131,262 £275,368 £52,584 £3,048,579
Total research grants & contracts £1,812,384 £78,807 £278,265 £37,772 £2,207,228
Other incomeOther services rendered £506,803 £50,233 £83,378 £11,848 £652,262
Residences & catering operations (including conferences) £771,461 £50,966 £93,965 £9,210 £925,602Grants from local authorities £10,521 £85 £0 £0 £10,606Income from health & hospital authorities (excluding teaching contracts for student provision) £175,523 £5,043 £14,678 £4,981 £200,225Release of deferred capital grants £37,261 £649 £7,745 £0 £45,655Income from intellectual property rights £7,413 £3,478 £6,906 £31 £17,828Other operating income £612,080 £21,654 £89,480 £14,556 £737,770
Total other income £2,121,062 £132,108 £296,152 £40,626 £2,589,948
Total endowment & investment income £245,949 £12,533 £30,948 £2,957 £292,387
Total income 2000/01 £11,068,645 £641,060 £1,513,246 £270,968 £13,493,919
Source: HESA Finance Statistics Return (FSR) 2000/01, 2008/09, 2009/10All values in the FSR are show n in units of £1000, and w here necessary rounded to the nearest £1,000; the consequence of w hich is that sum of individual values in each row or column may not match the total value.
Appendix 4 - Income of higher education institutions by academic year, source of income and country of institution (£ thousands) (cont. 1)
66
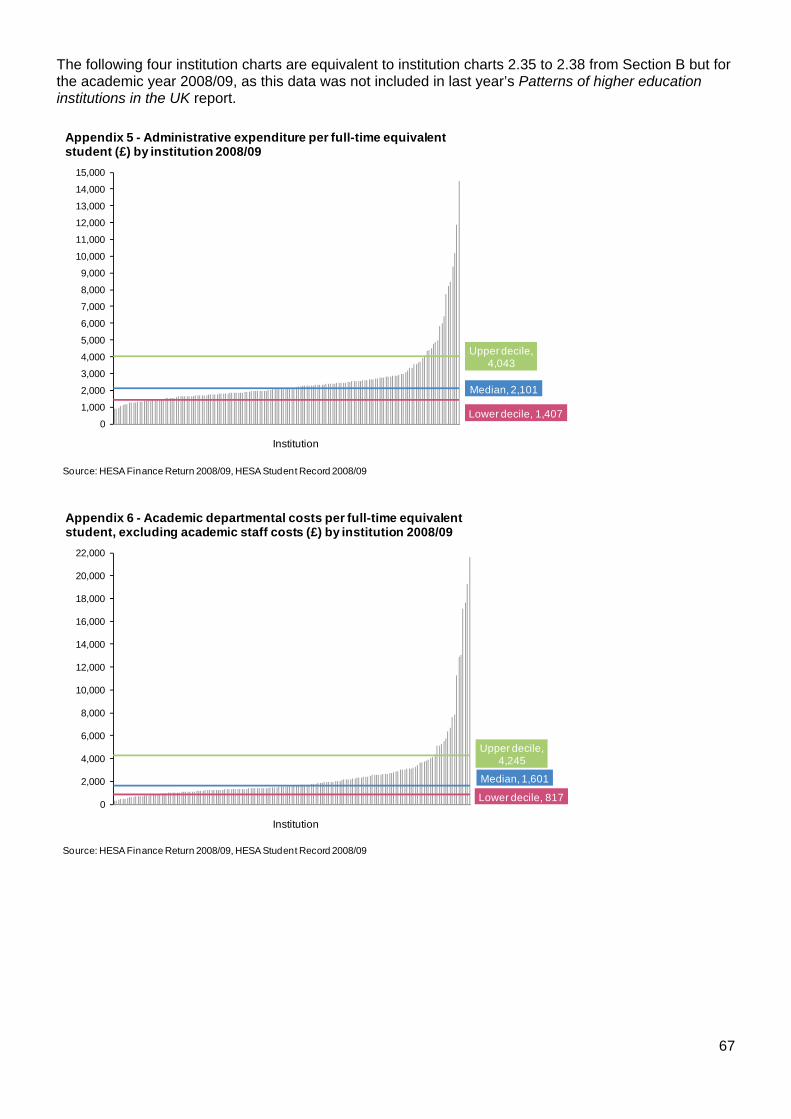
The following four institution charts are equivalent to institution charts 2.35 to 2.38 from Section B but for the academic year 2008/09, as this data was not included in last year’s Patterns of higher education institutions in the UK report.
Lower decile, 1,407
Median, 2,101
Upper decile, 4,043
0
1,000
2,000
3,000
4,000
5,000
6,000
7,000
8,000
9,000
10,000
11,000
12,000
13,000
14,000
15,000
Institution
Appendix 5 - Administrative expenditure per full-time equivalent student (£) by institution 2008/09
Source: HESA Finance Return 2008/09, HESA Student Record 2008/09
Lower decile, 817
Median, 1,601
Upper decile, 4,245
0
2,000
4,000
6,000
8,000
10,000
12,000
14,000
16,000
18,000
20,000
22,000
Institution
Appendix 6 - Academic departmental costs per full-time equivalent student, excluding academic staff costs (£) by institution 2008/09
Source: HESA Finance Return 2008/09, HESA Student Record 2008/09
67
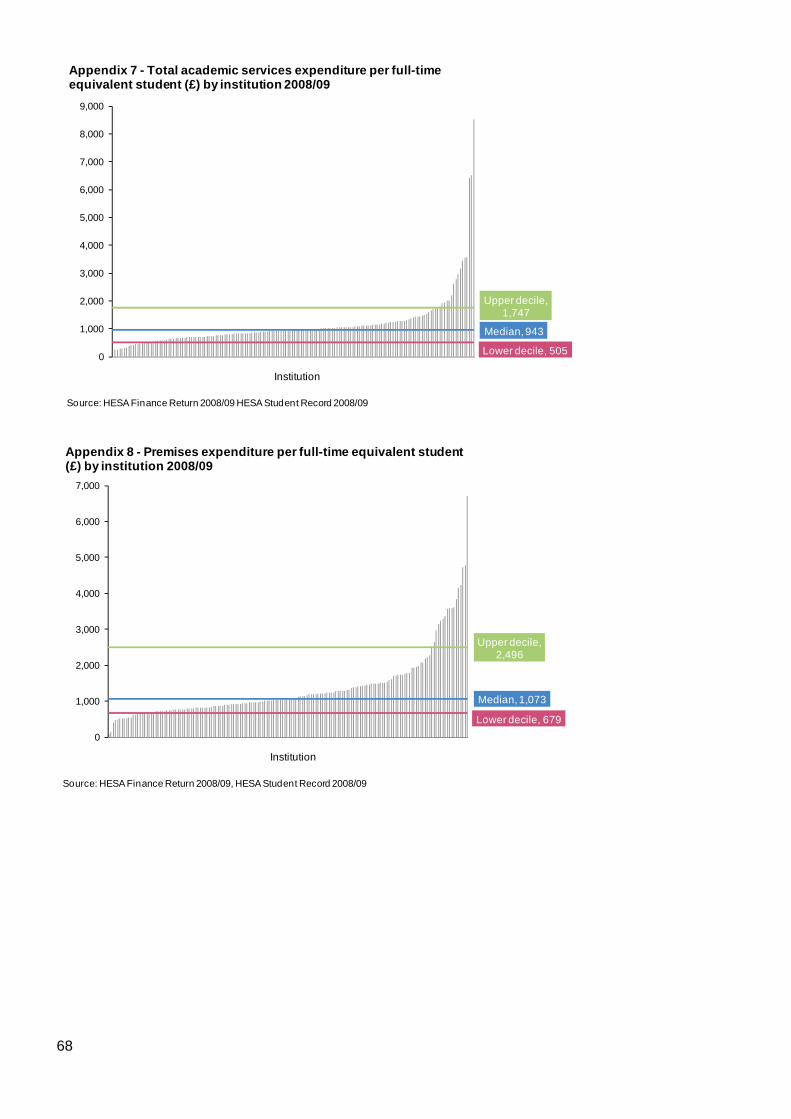
Lower decile, 505
Median, 943
Upper decile, 1,747
0
1,000
2,000
3,000
4,000
5,000
6,000
7,000
8,000
9,000
Institution
Appendix 7 - Total academic services expenditure per full-time equivalent student (£) by institution 2008/09
Source: HESA Finance Return 2008/09 HESA Student Record 2008/09
Lower decile, 679
Median, 1,073
Upper decile, 2,496
0
1,000
2,000
3,000
4,000
5,000
6,000
7,000
Institution
Appendix 8 - Premises expenditure per full-time equivalent student (£) by institution 2008/09
Source: HESA Finance Return 2008/09, HESA Student Record 2008/09
68
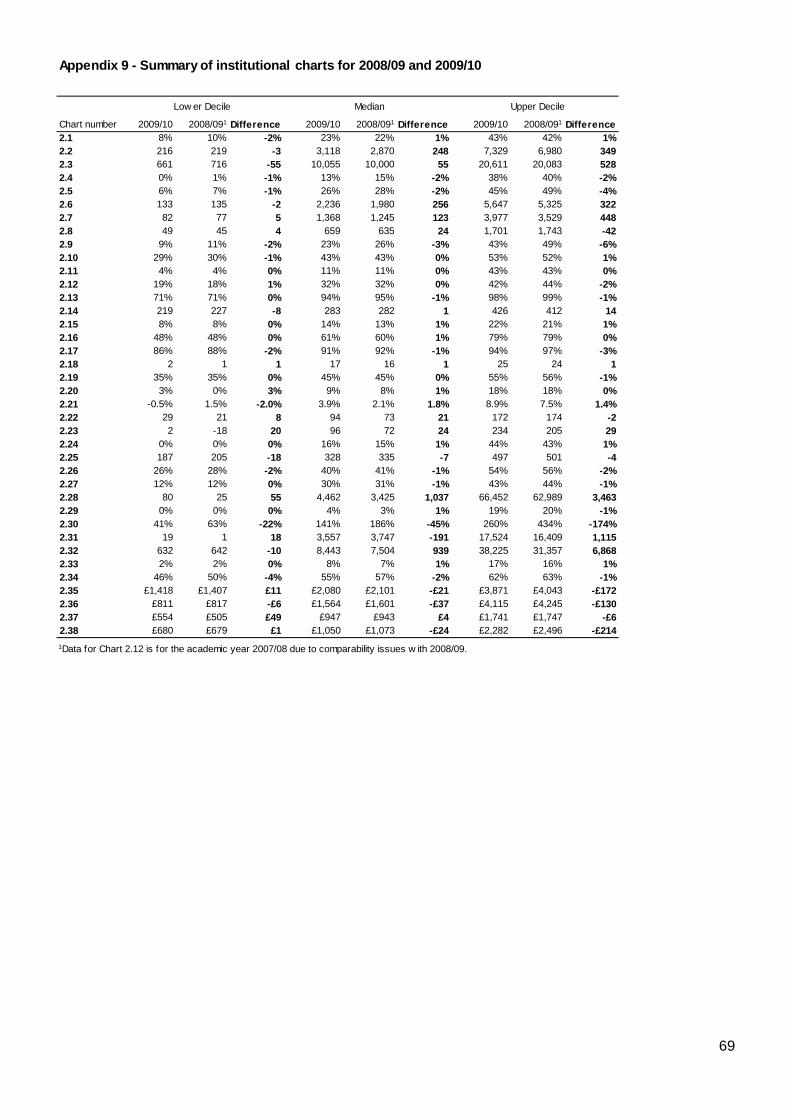
Appendix 9 - Summary of institutional charts for 2008/09 and 2009/10
Chart number 2009/10 2008/091 Difference 2009/10 2008/091 Difference 2009/10 2008/091 Difference2.1 8% 10% -2% 23% 22% 1% 43% 42% 1%2.2 216 219 -3 3,118 2,870 248 7,329 6,980 3492.3 661 716 -55 10,055 10,000 55 20,611 20,083 5282.4 0% 1% -1% 13% 15% -2% 38% 40% -2%2.5 6% 7% -1% 26% 28% -2% 45% 49% -4%2.6 133 135 -2 2,236 1,980 256 5,647 5,325 3222.7 82 77 5 1,368 1,245 123 3,977 3,529 4482.8 49 45 4 659 635 24 1,701 1,743 -422.9 9% 11% -2% 23% 26% -3% 43% 49% -6%2.10 29% 30% -1% 43% 43% 0% 53% 52% 1%2.11 4% 4% 0% 11% 11% 0% 43% 43% 0%2.12 19% 18% 1% 32% 32% 0% 42% 44% -2%2.13 71% 71% 0% 94% 95% -1% 98% 99% -1%2.14 219 227 -8 283 282 1 426 412 142.15 8% 8% 0% 14% 13% 1% 22% 21% 1%2.16 48% 48% 0% 61% 60% 1% 79% 79% 0%2.17 86% 88% -2% 91% 92% -1% 94% 97% -3%2.18 2 1 1 17 16 1 25 24 12.19 35% 35% 0% 45% 45% 0% 55% 56% -1%2.20 3% 0% 3% 9% 8% 1% 18% 18% 0%2.21 -0.5% 1.5% -2.0% 3.9% 2.1% 1.8% 8.9% 7.5% 1.4%2.22 29 21 8 94 73 21 172 174 -22.23 2 -18 20 96 72 24 234 205 292.24 0% 0% 0% 16% 15% 1% 44% 43% 1%2.25 187 205 -18 328 335 -7 497 501 -42.26 26% 28% -2% 40% 41% -1% 54% 56% -2%2.27 12% 12% 0% 30% 31% -1% 43% 44% -1%2.28 80 25 55 4,462 3,425 1,037 66,452 62,989 3,4632.29 0% 0% 0% 4% 3% 1% 19% 20% -1%2.30 41% 63% -22% 141% 186% -45% 260% 434% -174%2.31 19 1 18 3,557 3,747 -191 17,524 16,409 1,1152.32 632 642 -10 8,443 7,504 939 38,225 31,357 6,8682.33 2% 2% 0% 8% 7% 1% 17% 16% 1%2.34 46% 50% -4% 55% 57% -2% 62% 63% -1%2.35 £1,418 £1,407 £11 £2,080 £2,101 -£21 £3,871 £4,043 -£1722.36 £811 £817 -£6 £1,564 £1,601 -£37 £4,115 £4,245 -£1302.37 £554 £505 £49 £947 £943 £4 £1,741 £1,747 -£62.38 £680 £679 £1 £1,050 £1,073 -£24 £2,282 £2,496 -£2141Data for Chart 2.12 is for the academic year 2007/08 due to comparability issues w ith 2008/09.
Low er Decile Median Upper Decile
69
This publication has been produced by Universities UK which is the representative organisation for the UK’s universities. Founded in 1918, its mission is to be the definitive voice for all universities in the UK, providing high quality leadership and support to its members to promote a successful and diverse higher education sector. With 133 members and offices in London, Cardiff and Edinburgh, it promotes the strength and success of UK universities nationally and internationally.
Woburn House 20 Tavistock Square London WC1H 9HQ
Tel: +44 (0)20 7419 4111 Fax: +44 (0)20 7388 8649
Email: [email protected]: www.universitiesuk.ac.uk
ISBN 978-1-84036-261-9
© Universities UK
October 2011
To download this publication, or for the full list of Universites UK publications, see www.universitiesuk.ac.uk
This brochure is printedon 50% recycled paper
When you have finished withthis brochure please recycle it
50%Cert no. CGS-COC-2842