Embed Size (px)
Citation preview

Pathways from university to work
A graduate destination survey of the 2010 Cohort of graduates from the Western Cape universitiesA graduate destination survey of the 2010 Cohort of graduates from the Western Cape universities
A CApe HigHer eduCAtion Consortium (CHeC) study
This Graduate Destination Survey has generated an immensely important
new database for understanding how tertiary education relates to labour
market prospects. This report provides a first stab at analysing this data
and already brings to the fore some crucial insights. Further research on
this database should inform both labour market and education policies,
and it is of immediate use for university planning. CHEC’s initiative in
this regard should be greatly lauded and they should be encouraged to
undertake such tracer studies on a regular basis.
– Professor Servaas van den Berg, Professor of the Economics of Education,
Stellenbosch University
I think the methodology section is superb … The really important
consequence of this work is that it can alert the institutions to thinking
forward about complex issues.
– Professor Tim Dunne, Professor of the Statistics, University of Cape Town
5 560 responses from the total of 24 710 graduates can be seen as a
great success of the study. The response rate was 23% which is similar to
graduate surveys in Europe and Japan.
– Professor Harald Schomburg, International Centre for Higher Education Research,
University of Kassel
Cape Higher Education Consortium
CHEC
House Vincent, Wynberg Mews,
10 Ebenezer Road
Wynberg 7800
South Africa
Tel: +27 21 763 7100
Fax: +27 21 763 7117
www.chec.ac.za
“ABRIDGED OVERVIEW
CHEC Graduate Study Cover Final.indd 2 6/27/2013 10:00:55 AM

PATHWAYS FROM
UNIVERSITY TO WORKA Graduate Destination Survey of the 2010 Cohort of Graduates
from the Western Cape Universities
A Cape Higher Education Consortium (CHEC) Study
Cape Higher Education Consortium
CHEC
This report provides an overview of the key findings of CHEC Graduate Destination Survey. The full report is available from CHEC.
Abridged Overview
jUne 2013
Published by the Cape Higher Education Consortium (CHEC), House Vincent,Wynberg Mews, Ebenezer Road, Wynberg 7800Telephone: +27 21 763 7100Fax: +27 21 763 7117Website: www.chec.ac.za
© 2013 Published by the Cape Higher Education Consortium (CHEC)
Produced by COMPRESS.dsl www.compressdsl.com

iii
Acknowledgements iv
INTRODUCTION 1
International Perspectives 1
Institutional Surveys 2
The HSRC Survey 3
A SOCIO-ECONOMIC AND EDUCATIONAL PROFILE OF THE 2010 COHORT 4
Weighting of the gDS Respondent Data 4
THE SEVEN PATHWAYS FROM HIgHER EDUCATION TO WORK 10
Pathway One: The Already Employed 10
Pathway Two: First-Time Entrants into the Labour Market 10
Pathway Three: The Self-Employed 12
Pathway Four: graduates Employed in the Informal Sector 12
Pathway Five: The Unemployed 16
Pathway Six: Continuing Higher Education 19
Pathway Seven: Caregivers 20
The Seven Pathways 21
WHICH FACTORS ARE THE STRONgEST PREDICTORS OF EMPLOYMENT? 21
geographical Migrations 22
Conclusion: The Value of graduate Destination Surveys 22
BIBLIOgRAPHY 24
TABLE OF CONTENTS

iv
Many people have contributed to the success of this project. CHEC wishes to acknowledge the involvement of the following people in this work and to thank them for their contributions.
Project oversight was provided by a Reference group, which was chaired by Judy Favish (Director: Institutional Planning, UCT), on behalf of CHEC. Particular thanks go to Judy for her leadership and for keeping us on track. The institutional repre-sentatives on the Reference group – Colleen Howell (Director: Institutional Planning, UWC), André Muller (Assistant Director: Quality Assurance, Stellenbosch University), Jane Hendry (Chief Information Officer, Institutional Planning, UCT), Rob Woodward (Director: Research & Institutional Planning, CPUT) and Elizabeth Walters (Western Cape government) – provided valuable guid-ance and support for the project at their respective institutions. Marianne Bester (CPUT), Luclaire Airey (CPUT), David Casey (UCT) and Sharman Wickham (CHEC) also contributed to the work of the Reference group.
The Reference group was, in turn, supported by data specialists from the four universities, including Neil grobbelaar (Director: Institutional Information, SU), Carmelita Benjamin (HEMIS Officer, UWC), Dave Bleazard (Director: Management Information Services, CPUT) and Jane Hendry (Chief Information Officer, UCT). We thank them and their colleagues for facilitating our access to the university databases.
The South African graduate Recruiters Association (SAgRA) supported the project through the donation of two iPads which were given as prizes to survey respondents. We thank Cathy Sims, National Coordinator of SAgRA, for facilitating this donation.
SA Commercial Direct provided a range of back-office ser-vices for the implementation of the survey. We particularly wish to thank Renee Keeble and Mogamed gierdien for their flexibility in dealing with a complex project.
Tim Dunne, Servaas van den Berg and Harald Schomburg agreed to serve as critical readers of the draft report and pro-vided comments that have helped to enrich the final report.
Eileen Arnold (CHEC) provided very efficient administrative support to the project.
Finally, we would like to thank André Kraak, who led this re-search, in association with Dr Jacques du Toit, for their consum-mate professionalism and unstinting commitment to the project. They brought invaluable expertise and experience to this work. We also valued their meticulous attention to detail, which proved to be so necessary for an undertaking of this complexity.
Nasima BadshaCEO: CHEC
ACKNOWLEdgEMENTS

1
The main purpose of this Abridged Oveview is to provide a sum-mary of the results of the Cape Higher Education Consortium (CHEC) graduate Destination Survey (gDS) of the 2010 cohort of graduates from all four universities in the Western Cape. These four institutions are: the Cape Peninsula University of Technology (CPUT), University of Cape Town (UCT), Stellenbosch University (SU) and the University of the Western Cape (UWC). The cohort included graduates who received certificates and diplomas, undergraduates (3- and 4-year bachelors) and postgraduates (postgraduate diplomas, honours, master’s and doctorates). The total size of the 2010 cohort was 24 710 graduates.
The CHEC gDS survey received a total of 5 560 responses – a response rate of 22.5%. Roughly half these responses were derived online (2 873 or about 52%) while the other half were captured through telephonic interviews undertaken by a call centre based in Cape Town (2 687 or about 48%). The aggregate response rates for the four institutions were as follows: CPUT (21.8%), UCT (21.9%), SU (21.6%) and UWC (26.7%). Since we relied on voluntary responses, and since we were able to link responses to details of graduates obtained from the various institutions’ Higher Education Management Information Systems (HEMIS), all 5 560 responses were statisti-cally weighted to reflect the actual socio-demographic profile of the 2010 cohort of graduates on the basis on gender, popula-tion group, qualification type and institution.
In discussing the results of the study, the discussion will be structured as follows:
1. The first section provides an overview of the extent to which gDSs are utilised both internationally and nationally. Some of the results of these studies will be highlighted.
2. The second section provides a series of demographic, socio-economic and education background detail profil-ing aspects of the educational and work ‘life course’ of the 24 710 graduates of 2010 – as they negotiate the transition from schooling into higher education and work. Data are extracted from two sources: institutional data from the four Western Cape universities involved in the study, and data acquired through the gDS itself.
3. The primary focus of the study is then presented through an outline of the seven life-course ‘pathways’ which constituted
the transition of the 2010 cohort from higher education into work and social life. A CHAID analysis will outline which of the background factors discussed above are the strongest predictors of attaining employment.
4. The issue of ‘geographical migration’ is briefly examined – which constitutes a movement of young people across all seven life-course pathways identified in the preceding section. This migration is multi-directional as young people move from small towns, cities, provinces, countries and even continents to obtain, firstly, a higher education of choice, and secondly, a job after graduation.
5. The conclusion will emphasise the importance of institution-alising gDSs nationwide.
INTERNATIONAL PERSPECTIVES
graduate Destination Surveys (gDS) are the primary research instrument used globally to determine rates of graduate em-ployment and unemployment. Surprisingly, the literature on gDS is sparse, both in South Africa but also in most develop-ing countries. This is because the methodology used is taxing and requires very organised management information systems (MISs) regarding graduates. Such MISs are not updated with the necessary regularity in most developing country higher education systems. Acquiring accurate contact details across multiple institutions entailing large cohorts of graduates who have already left the university system are difficult to come by.
Perhaps the most consistent work in the area of gDS has been done by Schomburg and Teichler at the International Centre for Higher Education Research, Kassel University, germany. In 2006, they published a twelve-country study on graduate employment, focusing on countries located largely in Europe but also including Japan. The survey was under-taken four years after graduation with the graduates of 1995. Altogether 117 000 graduates were sent questionnaires in the post and 40 000 eventually responded – an overall response rate of 39%. Response rates varied from 50% in Norway to 15% in Spain (Schomburg and Teichler, 2006: 22-23). The key results of their research are highlighted in Table 1.
INTROdUCTION

PATHWAYS FROM UNIVERSITY TO WORK: ABRIDGED OVERVIEW
2
Table 1: Percentage distribution of ‘predominant activities’ since graduation in 1995
Further studies 21
Regular employment 61
Various temporary jobs 11
Had more than one job at a time 5
Homecare 3
Unemployed 4
Other activities 8
TOTAL 113.00
Source: Schomburg and Teichler, 2006: 77Note: Survey done in 1999 on 1995 graduate cohort; report published in 2006
Although the unemployment rate in 1999 (four years after graduation) was only 4%, there were higher rates of unemploy-ment in the southern regions of Europe. For example, in Spain it reached 13%. Another negative feature of the European la-bour market identified in the Schomburg and Teichler survey was the high levels of job ‘churn’ – 29% of graduates changed employers once, 22% of graduates changed jobs twice in the four years surveyed, and 6% changed jobs three times or more.
In Africa, Mugabushaka, Teichler and Schomburg (2003) re-ported unemployment rates varying from 5% for older cohorts (who graduated in the 1980s) to 10% for younger cohorts (who graduated in the mid-1990s) – indicating a growth in the trend towards graduate unemployment. Those respondents who in-dicated they were employed in the Africa surveys were largely taken up by public sector employment – 73% of those surveyed. This reality makes the African problem of graduate unemploy-ment distinct and highly dependent on the employment activities of the state (Mugabushaka et al., 2003: 67).
Outside of Teichler and Schomberg’s work in germany and Africa, the next most significant work on tracer studies is done in Australia. Annual surveys are commissioned by government and done by two science councils, the Australian Council for Education Research (ACER) and the National Centre for Vocational Education Research (NCVER).
In 2009, graduate Careers, a private Australian research and information agency launched the Beyond graduation Survey, which examines the outcomes and experiences of Australian graduates annually over a period of four years after completing their studies at Australian higher education institutions. A total of 6 797 graduates responded and the key results are sum-marised in Table 2.
Table 2: Percentage distribution of ‘predominant activities’ of Australian graduates in their fourth year after graduating
Further studies 12.4
Full-time employment 71.6
Part-time employment 9.1
Unemployed 1.8
Other activities 5.1
Total 100.0
Source: Graduate Careers, 2009: 9
It is clear that graduate unemployment prior to the global reces-sion of 2008 was a small problem in the countries of central and northern Europe, Japan and Australia. However, unemployment
levels for many European countries have risen dramatically as the recession worsens and drags on through 2013 into the present period. For example, Maastricht University in the Netherlands conducted a three-cohort gDS in 2012. The first cohort graduated in the academic year 2009–2010 (surveyed in 2012), the second cohort graduated in the academic year 2005–2006 (six years prior to the 2012 survey), and the third cohort graduated in the academic year 2000–2001 (eleven years prior to the 2012 survey). Table 3 shows the results and highlights the impact of the global recession clearly, particularly for the youngest cohort who are experiencing a 8% unemploy-ment rate as compared with the two older cohorts who have rates of unemployment at 3% (6 years after graduation) and 2% (eleven years after graduation). The authors of the Maastricht gDS note that a substantial part of this unemployment rate is frictional (temporary difficulties in the match between sup-ply of new graduates and the immediate availability of jobs in their fields). However, one possible exception to this rule may be Arts and Social Science graduates. Among the 2009/2010 cohort, Arts and Social Science graduates experienced a 24% unemployment rate and for the 2005–2006 cohort a 10% un-employment rate. These are very high rates suggesting more permanent difficulties in entering the labour market with qualifi-cations in this specific field (ROA, 2012: 2).
Table 3: Unemployment levels of three graduate cohorts at Maastricht University, 2012
Academic field:
% unemployed
2009–2010 cohort
2005–2006 cohort
2000–2001 cohort
Business and Economics 5 2 1
Health, Medicine and Life Sciences 3 2 1
Arts and Social Sciences 24 10 1
Psychology and Neuroscience 11 4 4
Law 9 0 6
Average: Maastricht University 8 3 2
Source: ROA Fact Sheet, 2012: 2.
Unemployment rates are also high in Latin America and Africa – even prior to the recession of 2008. In Brazil, graduate un-employment has reached a high of 16.4%, reflecting a severe mismatch between the demand and supply of skilled person power (Rodriguez et al., 2008: 208). The next section will review the use of gDSs in South Africa where graduate unemployment rates – as in Brazil – are alleged to be high.
INSTITUTIONAL SURVEYS
graduate destination research is highly underdeveloped in South Africa and there is no systematic attempt to understand graduate pathways outside of a few sporadic institutionally-based surveys. One instrument, ‘exit surveys’ of learners at their graduation ceremonies, has been used at a number of local institutions. These surveys aim to gather a quick ‘snapshot’ of job search behaviour, employment status, entry-level salaries as well as satisfaction with the higher education institution, the
3
PATHWAYS FROM UNIVERSITY TO WORK: ABRIDGED OVERVIEW
curriculum they offer and its relevance to the workplace.UCT has the longest history of doing such surveys, having
started in 1997. In 2009, for example, the return rate was 51% of all graduates (3 029 people), a relatively high achievement for surveys of this nature. This survey reported a very low inci-dence of unemployment – the status of only 3% of graduates was unknown, whereas all other graduates had either obtained employment or were entering further studies (UCT, 2009).
SU conducted exit surveys up until 2003. The survey of 2003, with 5 249 responses, indicated that 53% of graduates already had jobs by the time of graduation, a further 40% indi-cated they would study further, and only 6% were still seeking employment (SU, 2003: 1).
Exit surveys were also discontinued at CPUT in 2010. What is significant here are the higher levels of graduate unemploy-ment at CPUT at the moment of graduation – 20% in 2009 (Richter, 2009). graduate unemployment here is nearly seven times as high as the levels at UCT and three times higher than unemployment levels at SU.
UWC began administering graduate exit surveys in 2002 through their Institutional Planning Office. In 2012 UWC intro-duced an online questionnaire to replace the paper-based sur-vey of the past. The link to the questionnaire and the request for all students to complete it are included in the pre-graduation information sent to them in preparation for their ceremony. Of the graduates who completed the survey between March 2012 and March 2013 graduations, 51% are pursuing further studies, 25% are now employed fulltime and 16% indicated that they are unemployed and looking for a job.
As will be seen later in this report, these early signals of unemployment in the institutional exit surveys are validated by the results of the 2012 CHEC study of the 2010 cohort of graduates.
THE HSRC SURVEY
In 2005 the Human Sciences Research Council (HSRC) under-took a Student Retention and Graduate Destination study. The core of the study entailed a tracer survey of the 2003 cohort of tertiary ‘leavers’ (drop-outs) and graduates at seven selected public higher education institutions, namely, the University of the Witwatersrand (Wits) in Johannesburg, the former Pretoria Technikon (now Tshwane University of Technology), Stellenbosch University (SU), the former Peninsula Technikon (now part of the Cape Peninsula University of Technology), the University of the Western Cape (UWC), the University of Fort Hare (UFH), and the former University of the North (now the University of Limpopo). Between June and September 2005 a postal survey of 34 548 questionnaires was administered. The survey yielded 5 491 valid responses – a 16% response rate.
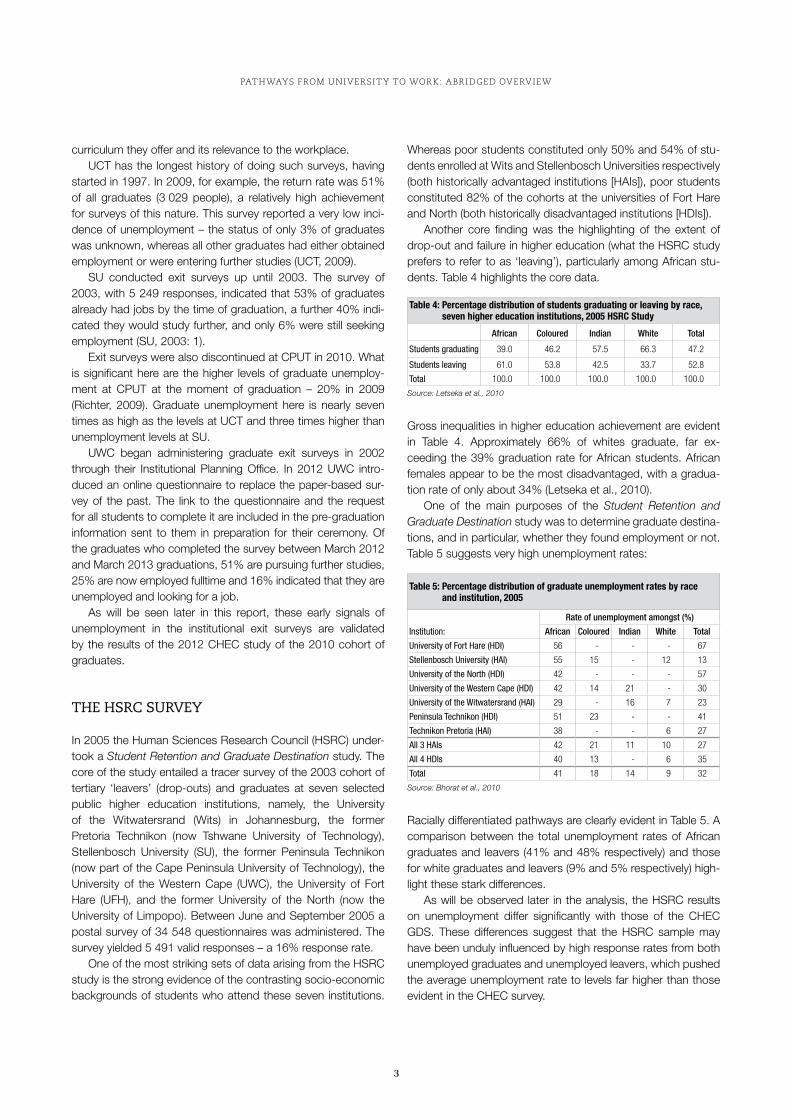
One of the most striking sets of data arising from the HSRC study is the strong evidence of the contrasting socio-economic backgrounds of students who attend these seven institutions.
Whereas poor students constituted only 50% and 54% of stu-dents enrolled at Wits and Stellenbosch Universities respectively (both historically advantaged institutions [HAIs]), poor students constituted 82% of the cohorts at the universities of Fort Hare and North (both historically disadvantaged institutions [HDIs]).
Another core finding was the highlighting of the extent of drop-out and failure in higher education (what the HSRC study prefers to refer to as ‘leaving’), particularly among African stu-dents. Table 4 highlights the core data.
Table 4: Percentage distribution of students graduating or leaving by race, seven higher education institutions, 2005 HSrC Study
African Coloured Indian White Total
Students graduating 39.0 46.2 57.5 66.3 47.2
Students leaving 61.0 53.8 42.5 33.7 52.8
Total 100.0 100.0 100.0 100.0 100.0
Source: Letseka et al., 2010
gross inequalities in higher education achievement are evident in Table 4. Approximately 66% of whites graduate, far ex-ceeding the 39% graduation rate for African students. African females appear to be the most disadvantaged, with a gradua-tion rate of only about 34% (Letseka et al., 2010).
One of the main purposes of the Student Retention and Graduate Destination study was to determine graduate destina-tions, and in particular, whether they found employment or not. Table 5 suggests very high unemployment rates:
Table 5: Percentage distribution of graduate unemployment rates by race and institution, 2005
Institution:
Rate of unemployment amongst (%)
African Coloured Indian White Total
University of Fort Hare (HDI) 56 - - - 67
Stellenbosch University (HAI) 55 15 - 12 13
University of the North (HDI) 42 - - - 57
University of the Western Cape (HDI) 42 14 21 - 30
University of the Witwatersrand (HAI) 29 - 16 7 23
Peninsula Technikon (HDI) 51 23 - - 41
Technikon Pretoria (HAI) 38 - - 6 27
All 3 HAIs 42 21 11 10 27
All 4 HDIs 40 13 - 6 35
Total 41 18 14 9 32
Source: Bhorat et al., 2010
Racially differentiated pathways are clearly evident in Table 5. A comparison between the total unemployment rates of African graduates and leavers (41% and 48% respectively) and those for white graduates and leavers (9% and 5% respectively) high-light these stark differences.
As will be observed later in the analysis, the HSRC results on unemployment differ significantly with those of the CHEC gDS. These differences suggest that the HSRC sample may have been unduly influenced by high response rates from both unemployed graduates and unemployed leavers, which pushed the average unemployment rate to levels far higher than those evident in the CHEC survey.
The discussion now shifts to examine a series of eleven socio-economic and education data which will provide a useful back-ground profile of the 2010 cohort. The four Western Cape higher education institutions involved in the gDS will also be profiled.
Data used here comes from two sources: firstly, it comes from the institutions themselves via their Higher Education Management Information Systems (HEMIS) submissions to the Department of Higher Education and Training (DHET) for the year 2010. Secondly, data comes directly from the gDS itself, which asked several socio-economic background questions. Profiling data discussed here includes the following eleven items:
▶▶ Regional data: ▷ Regional output of graduates ▷ Postgraduate production in the Western Cape ▷ Number of international students graduating from
Western Cape universities▶▶ Socio-economic and schooling data:
▷ Parental education ▷ Private schooling ▷ Financing of university studies ▷ Bursary support ▷ Achievement scores in grade 12 in mathematics
and physical science▶▶ Higher education data:
▷ Participation in extramural activities ▷ Career guidance received ▷ Internships or work placements
WEIgHTINg OF THE gdS RESPONdENT dATA
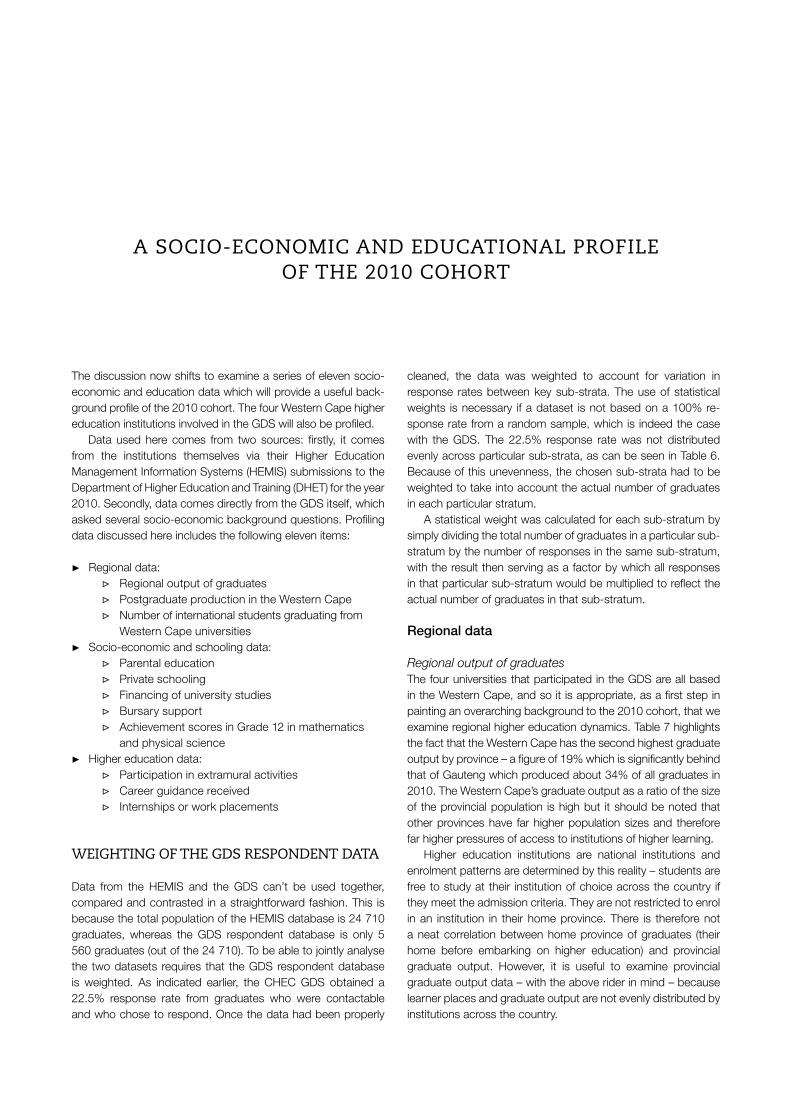
Data from the HEMIS and the gDS can’t be used together, compared and contrasted in a straightforward fashion. This is because the total population of the HEMIS database is 24 710 graduates, whereas the gDS respondent database is only 5 560 graduates (out of the 24 710). To be able to jointly analyse the two datasets requires that the gDS respondent database is weighted. As indicated earlier, the CHEC gDS obtained a 22.5% response rate from graduates who were contactable and who chose to respond. Once the data had been properly
cleaned, the data was weighted to account for variation in response rates between key sub-strata. The use of statistical weights is necessary if a dataset is not based on a 100% re-sponse rate from a random sample, which is indeed the case with the gDS. The 22.5% response rate was not distributed evenly across particular sub-strata, as can be seen in Table 6. Because of this unevenness, the chosen sub-strata had to be weighted to take into account the actual number of graduates in each particular stratum.
A statistical weight was calculated for each sub-stratum by simply dividing the total number of graduates in a particular sub-stratum by the number of responses in the same sub-stratum, with the result then serving as a factor by which all responses in that particular sub-stratum would be multiplied to reflect the actual number of graduates in that sub-stratum.
Regional data
Regional output of graduates The four universities that participated in the gDS are all based in the Western Cape, and so it is appropriate, as a first step in painting an overarching background to the 2010 cohort, that we examine regional higher education dynamics. Table 7 highlights the fact that the Western Cape has the second highest graduate output by province – a figure of 19% which is significantly behind that of gauteng which produced about 34% of all graduates in 2010. The Western Cape’s graduate output as a ratio of the size of the provincial population is high but it should be noted that other provinces have far higher population sizes and therefore far higher pressures of access to institutions of higher learning.
Higher education institutions are national institutions and enrolment patterns are determined by this reality – students are free to study at their institution of choice across the country if they meet the admission criteria. They are not restricted to enrol in an institution in their home province. There is therefore not a neat correlation between home province of graduates (their home before embarking on higher education) and provincial graduate output. However, it is useful to examine provincial graduate output data – with the above rider in mind – because learner places and graduate output are not evenly distributed by institutions across the country.
A SOCIO-ECONOMIC ANd EdUCATIONAL PROFILE OF THE 2010 COHORT
5
PATHWAYS FROM UNIVERSITY TO WORK: ABRIDGED OVERVIEW
A second observation regarding provincial output – which is evi-dent in Table 8 – is the fact that 26% of qualifications awarded nationally by higher education institutions in 2010 were post-graduate awards, but this figure is significantly higher in the Western Cape, which leads all other regions in the production of postgraduate qualifications at 35.8% of total graduate output.
Table 8: graduate output by province and qualification type, 2010Non-degree and undergraduate Postgraduate Total
Count % Count % Count %
EC 10 296 77.8 2 933 22.2 13 229 100.0
FS 5 178 65.1 2 777 34.9 7 955 100.0
GP 32 346 74.4 11 108 25.6 43 454 100.0
KZN 14 209 83.5 2 814 16.5 17 023 100.0
LP 4 785 80.6 1 151 19.4 5 936 100.0
NW 11 146 73.9 3 937 26.1 15 083 100.0
WC 15 763 64.2 8 809 35.8 24 572 100.0
UNISA 19 460 74.6 6 613 25.4 26 073 100.0
Total 113 183 73.8 40 142 26.2 153 325 100.0
Source: National HEMIS data, DHET website, 2010
Table 9 shows that SU and UCT make up the largest contribu-tion to postgraduate production – about 54% and 47% of their 2010 graduates achieved postgraduate qualifications. UWC, although held back in the period prior to 1990 by apartheid poli-cies (when higher degrees were not prioritised at HDIs), is fast catching up with 35% of its 2010 graduates attaining post-graduate qualifications.
Table 9: Number and percentage of 2010 western Cape graduates with different qualification types by institution
Undergraduate and non-graduates Postgraduate Total
Count % Count % Count %
CPUT 7 229 97.2 212 2.8 7 441 100.0
UCT 3 263 52.9 2 902 47.1 6 165 100.0
SU 3 363 45.6 4 017 54.4 7 380 100.0
UWC 2 393 64.3 1 331 35.7 3 724 100.0
Total 16 248 65.8 8 462 34.2 24 710 100.0
Source: Institutional HEMIS data for 2010
International graduatesA further observation of note regarding regional dynamics is the size of international students within the graduating 2010 cohort. UCT stands out as the institution with the greatest proportion of international students – they comprise about 19% of its total graduate population. The total number of international students who graduated in South African universities in 2010 was 11 383 (95% who originate from other African countries), and the Western Cape hosted 2 851 of these graduates (or about 25%).
Socio-economic and schooling data
Parental educationLevels of parental education serve as the most important proxy for socio-economic background, particularly if accurate details of parental income were not accessible (as was the case in this gDS). Parental education is also a key influence on whether
Table 6: response rate (%) by institution, qualification type, race and genderCPUT UCT SU UWC
TotalPD and UG PG PD and UG PG PD and UG PG PD and UG PG
AfricanFemale 24.4 6.9 20.0 21.7 30.8 25.7 28.6 27.5 24.7
Male 27.3 20.8 19.4 27.0 28.4 27.1 32.3 31.0 27.1
ColouredFemale 21.0 0.0 20.3 25.3 21.1 16.1 23.4 26.0 21.1
Male 22.0 12.5 18.6 24.1 18.0 26.8 28.7 26.4 23.4
AsianFemale 22.4 0.0 18.9 24.8 31.6 23.1 26.8 21.7 23.1
Male 18.5 0.0 15.8 20.6 11.1 25.9 15.3 13.7 17.4
WhiteFemale 12.8 6.5 21.6 22.6 18.8 23.0 25.4 25.5 20.2
Male 16.7 8.7 22.9 21.7 19.7 21.8 21.6 32.6 20.6
Other/unknownFemale N/A N/A 20.6 18.7 N/A N/A 19.0 4.3 18.2
Male N/A N/A 25.4 29.3 N/A N/A 35.3 34.8 29.1
Total 22.2 9.4 20.8 23.1 20.0 22.9 26.7 26.7 22.5
Source: CHEC, 2013Note: PD – Pre-degree qualifications such as certificates and diplomas; UG = undergraduate; PG = postgraduate
Table 7: Proportions of graduates as a percentage of provincial population and total graduate output, 2010
Total population (Census 2011)
Graduates (National HEMIS 2010)
Provincial graduates as a share of total provincial population
(as a %)
Provincial share of total graduate population of 1 27 249
(as a %)
EC 6 562 053 13 229 0.20 10.4
FS 2 745 590 7 955 0.29 6.3
GP 12 272 263 43 454 0.35 34.1
KZN 1026 7300 17 023 0.17 13.4
LP 5 404 868 5 936 0.11 4.7
NW 3 509 953 15 083 0.43 11.9
WC 5 822 734 24 569 0.42 19.3
Total 46 584 761 127 249 0.27 100.0
Source: Census 2011, National HEMIS 2010, DHET website, Table 2.13 for all institutions, 2010. Note: Data excludes UNISA.
PATHWAYS FROM UNIVERSITY TO WORK: ABRIDGED OVERVIEW
6
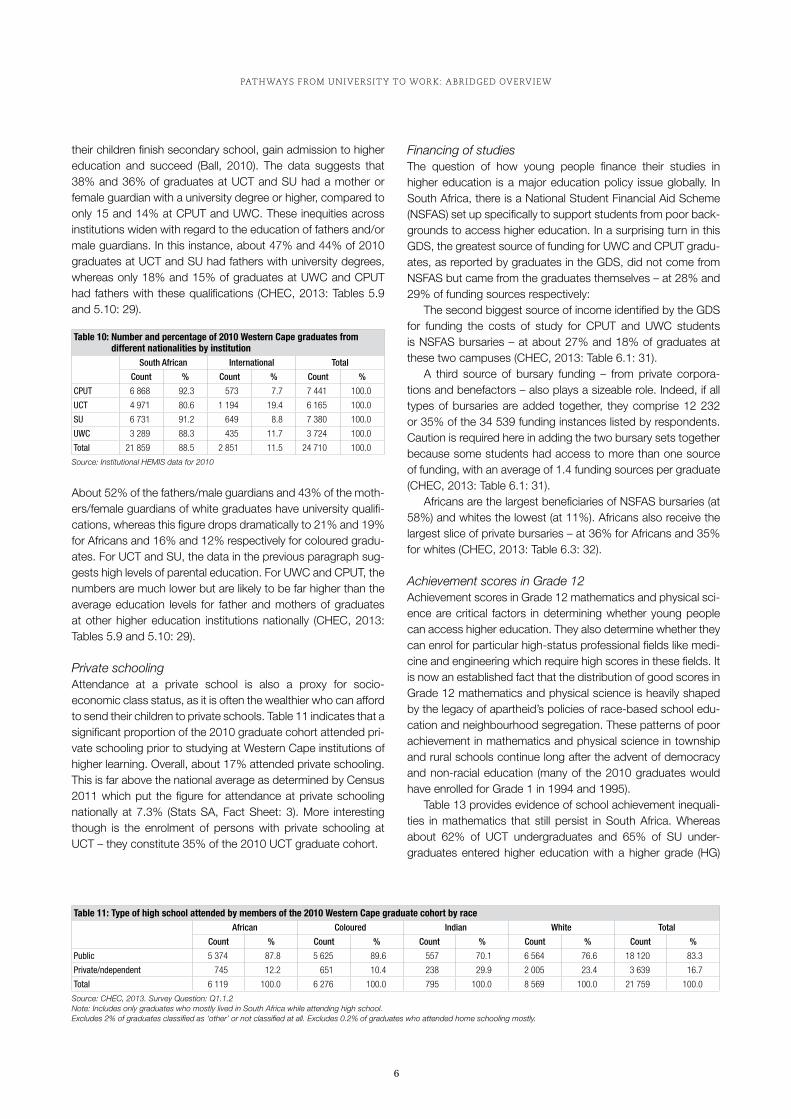
their children finish secondary school, gain admission to higher education and succeed (Ball, 2010). The data suggests that 38% and 36% of graduates at UCT and SU had a mother or female guardian with a university degree or higher, compared to only 15 and 14% at CPUT and UWC. These inequities across institutions widen with regard to the education of fathers and/or male guardians. In this instance, about 47% and 44% of 2010 graduates at UCT and SU had fathers with university degrees, whereas only 18% and 15% of graduates at UWC and CPUT had fathers with these qualifications (CHEC, 2013: Tables 5.9 and 5.10: 29).
Table 10: Number and percentage of 2010 western Cape graduates from different nationalities by institution
South African International Total
Count % Count % Count %
CPUT 6 868 92.3 573 7.7 7 441 100.0
UCT 4 971 80.6 1 194 19.4 6 165 100.0
SU 6 731 91.2 649 8.8 7 380 100.0
UWC 3 289 88.3 435 11.7 3 724 100.0
Total 21 859 88.5 2 851 11.5 24 710 100.0
Source: Institutional HEMIS data for 2010
About 52% of the fathers/male guardians and 43% of the moth-ers/female guardians of white graduates have university qualifi-cations, whereas this figure drops dramatically to 21% and 19% for Africans and 16% and 12% respectively for coloured gradu-ates. For UCT and SU, the data in the previous paragraph sug-gests high levels of parental education. For UWC and CPUT, the numbers are much lower but are likely to be far higher than the average education levels for father and mothers of graduates at other higher education institutions nationally (CHEC, 2013: Tables 5.9 and 5.10: 29).
Private schoolingAttendance at a private school is also a proxy for socio- economic class status, as it is often the wealthier who can afford to send their children to private schools. Table 11 indicates that a significant proportion of the 2010 graduate cohort attended pri-vate schooling prior to studying at Western Cape institutions of higher learning. Overall, about 17% attended private schooling. This is far above the national average as determined by Census 2011 which put the figure for attendance at private schooling nationally at 7.3% (Stats SA, Fact Sheet: 3). More interesting though is the enrolment of persons with private schooling at UCT – they constitute 35% of the 2010 UCT graduate cohort.
Financing of studiesThe question of how young people finance their studies in higher education is a major education policy issue globally. In South Africa, there is a National Student Financial Aid Scheme (NSFAS) set up specifically to support students from poor back-grounds to access higher education. In a surprising turn in this gDS, the greatest source of funding for UWC and CPUT gradu-ates, as reported by graduates in the gDS, did not come from NSFAS but came from the graduates themselves – at 28% and 29% of funding sources respectively:
The second biggest source of income identified by the gDS for funding the costs of study for CPUT and UWC students is NSFAS bursaries – at about 27% and 18% of graduates at these two campuses (CHEC, 2013: Table 6.1: 31).
A third source of bursary funding – from private corpora-tions and benefactors – also plays a sizeable role. Indeed, if all types of bursaries are added together, they comprise 12 232 or 35% of the 34 539 funding instances listed by respondents. Caution is required here in adding the two bursary sets together because some students had access to more than one source of funding, with an average of 1.4 funding sources per graduate (CHEC, 2013: Table 6.1: 31).
Africans are the largest beneficiaries of NSFAS bursaries (at 58%) and whites the lowest (at 11%). Africans also receive the largest slice of private bursaries – at 36% for Africans and 35% for whites (CHEC, 2013: Table 6.3: 32).
Achievement scores in Grade 12 Achievement scores in grade 12 mathematics and physical sci-ence are critical factors in determining whether young people can access higher education. They also determine whether they can enrol for particular high-status professional fields like medi-cine and engineering which require high scores in these fields. It is now an established fact that the distribution of good scores in grade 12 mathematics and physical science is heavily shaped by the legacy of apartheid’s policies of race-based school edu-cation and neighbourhood segregation. These patterns of poor achievement in mathematics and physical science in township and rural schools continue long after the advent of democracy and non-racial education (many of the 2010 graduates would have enrolled for grade 1 in 1994 and 1995).
Table 13 provides evidence of school achievement inequali-ties in mathematics that still persist in South Africa. Whereas about 62% of UCT undergraduates and 65% of SU under-graduates entered higher education with a higher grade (Hg)
Table 11: Type of high school attended by members of the 2010 western Cape graduate cohort by raceAfrican Coloured Indian White Total
Count % Count % Count % Count % Count %
Public 5 374 87.8 5 625 89.6 557 70.1 6 564 76.6 18 120 83.3
Private/ndependent 745 12.2 651 10.4 238 29.9 2 005 23.4 3 639 16.7
Total 6 119 100.0 6 276 100.0 795 100.0 8 569 100.0 21 759 100.0
Source: CHEC, 2013. Survey Question: Q1.1.2Note: Includes only graduates who mostly lived in South Africa while attending high school.Excludes 2% of graduates classified as ‘other’ or not classified at all. Excludes 0.2% of graduates who attended home schooling mostly.

7
PATHWAYS FROM UNIVERSITY TO WORK: ABRIDGED OVERVIEW
certificate in mathematics, only about 14% and 16% did so at CPUT and UWC respectively. Similarly, whilst about 61% of UCT’s graduates and 55 of SU’s graduates obtained either ‘A’ or ‘B’ symbols in mathematics, only about 18% of UWC and 17% CPUT graduates did so.
Higher education data
The next section discusses three specific aspects of higher education which are believed to influence and strengthen the chances of gainful employment after graduation. These factors are: participation in extra-curricula activity; provision of effective career guidance; and existence of opportunities for internships and work placements during university life. The gDS posed
questions to the respondents of the 2010 cohort in each of these areas. The results will now be discussed.
Extra-curricula activitiesTable 15 provides an account of participation in specific extra-curricular items such as student governance and cultural organisations. It is clear that sports organisations are the most popular, whereas student politics and student governance ac-tivities feature relatively low down on the list of campus priori-ties. Interestingly, UWC offers the highest proportion of places for learners to participate in university life as teaching and labo-ratory assistants – with 36% of all UWC graduates participating in these activities in 2010 – a figure far higher than what was achieved at the three other campuses.
Table 12: Sources and instances of funding the costs of acquiring a qualification (registration, tuition and book fees), 2010 western Cape graduate cohortInstitution
CPUT UCT SU UWC Total
Count % Count % Count % Count % Count %
Free provision because a parent was a member of the university staff 163 1.7 267 2.9 291 2.8 105 2.0 826 2.4
My own funds 2 805 28.7 1 529 16.6 2 432 23.5 1 456 28.1 8 223 23.8
Funds or loans from my parents/guardians 1 683 17.2 2 798 30.3 2 494 24.1 827 16.0 7 801 22.6
Funds or loans from other family members or acquaintances 119 1.2 264 2.9 246 2.4 161 3.1 790 2.3
Funds or loans from my employer 494 5.0 470 5.1 631 6.1 185 3.6 1 780 5.2
NSFAS bursary/loan 2 630 26.9 666 7.2 644 6.2 949 18.3 4 890 14.2
NRF bursary 377 3.9 469 5.1 370 3.6 302 5.8 1 517 4.4
A bursary or scholarship from my university 214 2.2 1 137 12.3 1 059 10.2 312 6.0 2 722 7.9
A private bursary or scholarship 607 6.2 993 10.8 1 007 9.7 496 9.6 3 103 9.0
A bank loan 295 3.0 395 4.3 881 8.5 130 2.5 1 701 4.9
Other 403 4.1 236 2.6 285 2.8 261 5.0 1 186 3.4
Total 9 790 100.0 9 224 100.0 10 340 100.0 5 184 100.0 34 539 100.0
Source: CHEC, 2013Survey Questions: Q2.2 and Q2.2.1Note: The total of 34 539 responses around ‘sources of funding’ will necessarily be higher than the total population of 24 710 graduates as graduates could have reported multiple sources of funding.
Table 13: Number and percentage of 2010 western Cape undergraduates with grade 12 mathematics by level and institutionCPUT UCT SU UWC Total
Count % Count % Count % Count % Count %
HG 986 13.6 2 011 61.6 2 168 64.5 376 15.7 5 541 34.1
SG 3 650 50.5 480 14.7 979 29.1 1 090 45.5 6 199 38.2
LG 111 1.5 0 .0 4 .1 39 1.6 154 .9
Other 29 .4 0 .0 0 .0 0 .0 29 .2
None 2 453 33.9 772 23.7 212 6.3 888 37.1 4 325 26.6
Total 7 229 100.0 3 263 100.0 3 363 100.0 2 393 100.0 16 248 100.0
Source: Institutional HEMIS data for 2010Note: Undergraduate only.
Table 14: Number and percentage of 2010 western Cape undergraduates with grade 12 mathematics by performance and institutionCPUT UCT SU UWC Total
Count % Count % Count % Count % Count %
A (80-100%) 340 7.8 1 037 41.7 1 098 34.8 138 9.2 2 613 22.7
B (70-79%) 388 8.9 489 19.7 642 20.4 135 9.0 1 654 14.4
C (60-69%) 731 16.8 459 18.5 599 19.0 237 15.7 2 026 17.6
D (50-59%) 962 22.1 304 12.2 515 16.3 331 22.0 2 112 18.4
E-H (0-49%) 1 927 44.3 195 7.9 297 9.4 664 44.1 3 083 26.8
Total 4 348 100.0 2 484 100.0 3 151 100.0 1 505 100.0 11 488 100.0
Source: Institutional HEMIS data for 2010 Note: Undergraduate only.

PATHWAYS FROM UNIVERSITY TO WORK: ABRIDGED OVERVIEW
8
Extra-curricular activity does not seem to be heavily stratified by race. For example, there are equally low levels of participation in student governance with 8% for Africans and 5% amongst the white graduates of 2010 (CHEC, 2013: Table 6.7: 34).
Career guidanceAnother function of tracer surveys is to determine the degree to which university learners received appropriate career guidance and opportunities for internships and work placements. About 43% of full-time learners who graduated in 2010 at Western Cape universities received some form of career guidance. Table 16 highlights specific items of career guidance most often uti-lised. The data illustrates the importance of direct access and informal talks with lecturers as the most common form utilised by the 2010 cohort followed by the more formal attendance at career expos – at about 25% and 21% respectively. Talks by pri-vate companies on campus are the third most commonly used form of career advice. Overall, these utilisation rates are low.
Internships and work placementsParticipation levels in internships and work placements at UCT,
SU and UWC are low – between 26% and 28% as is evident in Table 17. In contrast, the CPUT provided 70% of learners with opportunities to acquire first-hand experience of work whilst studying for a career-orientated qualification. This result is ap-propriate given CPUTs career-orientated institutional mission.
The low levels of participation in these key pre-employment learning opportunities are ‘warning signals’ to the four higher education institutions in the Western Cape to consider some form of intervention to improve the overall package of career guidance, internships and work placements offered to students.
This review of eleven ‘background’ factors provides con-tradictory results which display a wide diversity of human ca-pabilities. In some ways, they suggest that the Western Cape is the leading province in terms of the development of human capital, particularly with respect to the production of postgradu-ates. However, in other ways these indicators suggest that a number of inequalities and low achievement scores persist in the province and have not been attended to adequately since the advent of democracy in 1994. Further discussion of these background factors will be presented in a later section on what factors are the strongest predictors of employment.
Table 15: The 2010 western Cape graduate cohort by participation in extra-curricular activity by specific type Institution
CPUT UCT SU UWC Total
Count % Count % Count % Count % Count %
Faculty/academic societies 67 2.7 777 11.3 587 8.5 135 7.0 1 565 8.6
Sports teams 726 29.3 1 298 19.0 1 655 24.1 355 18.3 4 035 22.2
Cultural organisations 250 10.1 866 12.6 814 11.8 146 7.5 2 076 11.4
Religious organisations 248 10.0 663 9.7 623 9.1 196 10.1 1 730 9.5
Student governance 257 10.4 358 5.2 358 5.2 122 6.3 1 095 6.0
Residence committees 216 8.7 532 7.8 1 144 16.7 101 5.2 1 993 11.0
Tutor/teaching assistant 347 14.0 1 340 19.6 914 13.3 480 24.7 3 081 17.0
Research/laboratory assistant 102 4.1 405 5.9 346 5.0 213 10.9 1 066 5.9
Other 264 10.7 609 8.9 431 6.3 197 10.1 1 501 8.3
Total 2 477 100.0 6 847 100.0 6 873 100.0 1 946 100.0 18 143 100.0
Source: CHEC, 2013Survey Question: Q2.1.1.1Note: Includes only graduates who studied mostly full-time towards the qualification they obtained in 2010 and who participated in any additional activities.
Table 16: Members of the 2010 western Cape graduate cohort on specific items of career guidance most often utilised by their universitiesInstitution
CPUT UCT SU UWC Total
Count % Count % Count % Count % Count %
Aptitude tests 119 2.4 118 1.9 153 3.8 55 2.6 446 2.5
Personal discussions with a lecturer 1 536 31.2 1 203 18.9 1 040 25.8 667 30.8 4 446 25.4
Personal discussions with a career counsellor 386 7.8 796 12.5 269 6.7 179 8.3 1 631 9.3
Visits to career expos 913 18.5 1 440 22.7 866 21.4 537 24.8 3 756 21.5
Visits to or talks by private companies 699 14.2 1 209 19.0 666 16.5 323 14.9 2 897 16.6
Work experience with private companies 576 11.7 558 8.8 373 9.2 122 5.6 1 628 9.3
Information on further studies 540 11.0 905 14.3 579 14.3 243 11.2 2 267 13.0
Other 155 3.1 119 1.9 91 2.3 43 2.0 409 2.3
Total 4 925 100.0 6 348 100.0 4 037 100.0 2 169 100.0 17 479 100.0
Source: CHEC, 2013Survey Question: Q2.1.2.1Note: Includes only graduates who studied mostly full-time towards the qualification they obtained in 2010 and who received any form of career guidance.

9
PATHWAYS FROM UNIVERSITY TO WORK: ABRIDGED OVERVIEW
Table 17: Participation in internships and/or work placements that formed part of the requirements of the qualification, 2010 western Cape graduate cohortInstitution
CPUT UCT SU UWC Total
Count % Count % Count % Count % Count %
Yes 4 059 70.4 1 387 27.1 1 518 28.0 773 26.6 7 737 40.3
No 1 710 29.6 3 733 72.9 3 895 72.0 2 138 73.4 11 475 59.7
Total 5 769 100.0 5 119 100.0 5 413 100.0 2 911 100.0 19 212 100.0
Source: CHEC, 2013Survey Question: Q2.1.3Note: Includes only graduates who studied mostly full-time towards the qualification they obtained in 2010.

10
The primary task of this gDS was to determine levels of ‘gradu-ate employment and unemployment’, and to understand the differing life-course ‘pathways’ from higher education into work. Subsidiary questions examined included the value of work place-ment and internships, and the regional migration of skilled gradu-ates in and out of the Western Cape. The conceptual framework underpinning this study recognises that preparation for the world of work is not the only function of the higher education system. Other purposes such as knowledge production in fields not di-rectly relevant to the economy are equally important. The univer-sity system should also seek to equip young graduates to actively participate as informed citizens in democratic life. Nonetheless, the role of higher education in preparing young graduates for first-time employment in the labour market is a critical function of the university which requires our greater understanding.
gDSs highlight the extent of graduate unemployment in society. They need to be undertaken at regular intervals prefer-ably as part of the state’s routine data collection activities on the labour market so as to monitor the scale and persistence of the problem of graduate unemployment. Unfortunately, this does not occur with the required regularity in South Africa. It is for this rea-son that CHEC’s four member institutions decided to undertake such a study. This CHEC gDS has chosen to adopt the concept of ‘pathways’ to describe the transition of the 2010 cohort from higher education into work and social life. In this study, at least seven different life-course pathways are identified. They are:
1. Employed graduates who were employed prior to studying for the qualification achieved in 2010 (‘mature’ graduates) and who have (in most cases) continued with this employ-ment during their study years;
2. Employed graduates who have entered the labour market for the first time in 2010 and have acquired full-time employ-ment (‘young’ graduates);
3. Self-employed graduates;4. graduates employed in the informal sector (for example,
street vendors and spaza shop workers);5. Unemployed graduates; 6. Full-time students who have continued to study; and 7. Unemployed graduates not looking for work (for example,
caregivers and homemakers).
PATHWAY ONE: THE ALREAdY EMPLOYEd
The first and second pathways are derived from an important dis-tinction that was made in the survey between ‘young graduates’ who entered the labour market for the first-time after graduating in 2010, and ‘mature graduates’ who already had experience of employment prior to studying for the qualification they received in 2010. The gDS was able to capture this distinction by mea-suring employment status at three key moments in time:
1. Employment prior to embarking on the study programme that led to the qualification obtained in 2010;
2. Employment between graduating in 2010 and 1 September 2012; and
3. Employment as on 1 September 2012 – the starting date for the launch of the survey.
Question 3.3 of the gDS asked respondents whether they were employed prior to studying for the qualification they gradu-ated with in 2010. The results shown in Table 18 indicate that there were 8 344 ‘mature-age’ graduates, 7 415 of whom were employed on 1 September 2012 – 30% of the total 2010 graduate cohort. The balance of 929 ‘mature-age’ graduates in September 2012 (in Table 18) were either unemployed, studying further or were not seeking jobs because of other responsibili-ties like home care.
PATHWAY TWO: FIRST-TIME ENTRANTS INTO THE LABOUR MARKET
First-time entry into the labour market and securing the first full-time, formal sector job is considered the most important life-course transition for a young graduate from higher education into work. Failure to access the first job has the power to con-demn young people into permanent unemployment. Early suc-cess in obtaining a secure first job shapes the future trajectory up the occupational ladder. Interventions to support young people make this transition successfully are crucial, including the career
THE SEVEN PATHWAYS FROM HIgHER EdUCATION TO WORK

11
PATHWAYS FROM UNIVERSITY TO WORK: ABRIDGED OVERVIEW
guidance offered by universities and other agencies. Advice on approaches to job search will be significantly different for this group (who have never hunted for a job) as compared with the already employed ‘mature-age’ subset of the 2010 cohort.
The gDS questionnaire did not ask respondents directly whether they were first-time entrants in the labour market after graduation in 2010. However, as indicated in Table 18, it did ask respondents whether they were employed prior to studying for the qualification they graduated with in 2010. Implicit in this defini-tion of ‘mature-age’ graduates is the opposite category – gradu-ates who had no prior employment experience before studying for the 2010 qualification. These included: graduates who were still in school in that period (which would typically comprise the bulk of this category), others who were studying full-time (typically a first degree), and caregivers and gap-year students.
Table 18 provides this data. It indicates that the category of first-timers comprises 14 869 students in the period prior to
studying for the 2010 qualification, of whom 9 707 (65.3%) are employed in the public and private sectors (or self-employed) on 1 September 2012. In addition, a further 3 728 are either studying further, employed in the informal economy or not looking for work (for example, caregivers). Perhaps the most significant factor revealed in Table 18 is the differing employment ratios, with unemployment amongst mature-age graduates just under half that for first-time entrants – 4.6% versus 9.6%. Table 19 indicates that this is a significant difference, with unemployment amongst first-timers numerically much larger – at 70% of all unemployed.
Table 20 provides an analysis of first-time entrants by higher education institution. CPUT has both the largest pool of first-time entrants and the highest unemployment rate within this subset of the 2010 cohort. The burden of unemployment amongst first-time entrants is clearly among African graduates, especially at CPUT where unemployment rates reach 20.2% on 1 September 2012.
Table 18: Previously employed ‘mature-age graduates’ and ‘first-time entrants’ in the labour market, 1 September 2012
Q3.4:Employment status on 1 September 2012:
Q3.3: What was your employment status just before you started studying towards the qualification you obtained in 2010?
First time entrants (previously in school, studying fulltime or unemployed but not
looking for work)
Mature graduates (previously employed
in the formal economy)
Other (previously employed in informal
sector or unemployed and looking for work) Total
Count % Count % Count % Count %
Employed (in the public or private sector, or self-employed) 9 707 65.3 7 415 88.9 748 65.3 17 871 73.4
Unemployed and looking for work 1 434 9.6 385 4.6 252 21.9 2 071 8.5
Other (studying further, employed in informal sector, or not looking for work) 3 728 25.1 544 6.5 146 12.8 4 418 18.1
Total 14 869 100.0 8 344 100.0 1 146 100.0 24 359 100.0
Source: Q3.4 cross-tabulated with Q3.3.
Table 19: Previously employed ‘mature graduates’ and ‘first-time entrants’ employment status on 1 September 2012
Q3.4:Employment status on 1 September 2012:
Q3.3: What was your employment status just before you started studying towards the qualification you obtained in 2010?
First time entrants (previously in school, studying fulltime or unemployed but not
looking for work)
Mature graduates (previously employed
in the formal economy)
Other (previously employed in informal
sector or unemployed and looking for work) Total
Count % Count % Count % Count %
Employed (in the public or private sector, or self-employed) 9 707 54.3 7 415 41.5 748 4.2 17 871 100.0
Unemployed and looking for work 1 434 69.2 385 18.6 252 12.2 2 071 100.0
Other (studying further, employed in informal sector, or not looking for work) 3 728 84.4 544 12.3 146 3.3 4 418 100.0
Total 14 869 61.0 8 344 34.3 1 146 4.7 24 359 100.0
Source: Q3.4 cross-tabulated with Q3.3.
Table 20: ‘First-time entrants’ in the labour market by higher education institution, 1 September 2012Institution
CPUT UCT SU UWC Total
Count % Count % Count % Count % Count %
Employed in the private or public sector or self-employed in the private sector 2 948 69.3 2 578 64.9 2 879 62.5 1 302 62.4 9 707 65.1
Unemployed and looking for work 775 18.2 193 4.9 191 4.1 275 13.2 1 434 9.6
Other (studying further, employed in the informal sector, not looking for work) 534 12.5 1 198 30.2 1 537 33.4 510 24.5 3 780 25.3
Total 4 257 100.0 3 970 100.0 4 607 100.0 2 087 100.0 14 921 100.0
Source: Q3.4 cross-tabulated with Q3.3.Note: Includes only ‘new entrants’, i.e., graduates that were (1) previously in school, (2) studying fulltime or (3) unemployed but not looking for work as per Q3.3. Includes international graduates and graduates living abroad on 1 September 2012.

PATHWAYS FROM UNIVERSITY TO WORK: ABRIDGED OVERVIEW
12
PATHWAY THREE: THE SELF-EMPLOYEd
The gDS investigated the extent to which graduates opted for self-employment. Only 558 from a total of 24 710 graduates ended up in this category - 2.2% of the cohort. It must be noted that starting up your own business in less than three years after graduating is rather ambitious – hence the low participation rate.
Of those who are self-employed, 65% are white and 39% are female. The type of work undertaken by these 558 self- employed graduates varied from knowledge services as a consultant (35%) to producing goods and services for multiple clients (29%) to selling the products of other companies (10%). Just under half of the graduates from SU (46%) provided knowl-edge services, whereas a similar percentage of graduates from CPUT (46%) produced their own ‘goods and services’ – again an outcome which makes sense in terms of the institutional mis-sions of these two higher education institutions.
The self-employed component of the 2010 Western Cape graduate cohort may be small – at 2.2% or 558 individuals/firms – but it compares reasonably well internationally. For ex-ample, self-employment amongst graduates in Australia has been measured at 2.4% of a graduate cohort – but which grew over a three-year period to 3.1% (graduate Careers, 2010: 26). Schomburg and Teichler report a 3% mean for self-employment across their twelve-country study (2006: 51). What is interesting here is the country variation with Italy reaching 4% but Japan having almost no self-employment at all. Clearly, the choice of
the self-employment pathway is determined socially, influenced by the enablers and dis-enablers society places at the disposal of the recent graduate.
PATHWAY FOUR: gRAdUATES EMPLOYEd IN THE INFORMAL SECTOR
Employment in the informal sector constitutes a very small sixth pathway in this study – just under 1% of the cohort and compris-ing 191 graduates. Additional data – for example, on the kinds of informal activity engaged in – was not collected by the gDS. Informal sector employment in this instance is most likely a pro-tection against unemployment for the graduates who resorted to informal work. They might have done this because they could not find jobs in the formal sector that used their qualifications.
Employment trends
The next set of tables joins all employed groupings – Pathways 1, 2, 3 and 4 – to determine overall trends amongst the employed. Table 23 measures employment on 1 September 2012 across the private, public and self-employed and informal sectors. The table suggests that total employment is high, at 84% with a signifi-cant grouping employed by government (36%). Unemployment is measured at about 10% – noticeably lower compared to the results of the HSRC study in 2005 (32% unemployment).
Table 21: ‘First-time entrants’ in the labour market by race, 1 September 2012Population group
African Coloured Indian White Total
Count % Count % Count % Count % Count %
Employed in the private or public sector or self-employed in the private sector 2 559 60.1 2 555 70.7 412 70.1 4 068 65.5 9 594 65.4
Unemployed and looking for work 862 20.2 282 7.8 13 2.3 248 4.0 1 405 9.6
Other (studying further, employed in the informal sector, not looking for work) 840 19.7 778 21.5 162 27.6 1 894 30.5 3 674 25.0
Total 4 261 100.0 3 614 100.0 588 100.0 6 210 100.0 14 673 100.0
Note: Includes only ‘new entrants’, i.e. graduates that were (1) previously in school, (2) studying fulltime or (3) unemployed but not looking for work as per Q3.3. Includes international graduates and graduates living abroad on 1 September 2012.Excludes 2% of graduates classified as ‘other’ or not classified at all.
Table 22: reasons for opting for self-employment as at 1 September 2012Institution
CPUT UCT SU UWC Total
Count % Count % Count % Count % Count %
I preferred to be my own boss or have my own business, company or practice 43 38.4 112 60.6 134 66.2 36 61.6 325 58.3
I took over a family business 0 0.0 19 10.2 8 4.2 0 0.0 27 4.9
I wanted to work from home 15 13.7 4 2.4 18 8.8 0 0.0 38 6.7
I could make more money 13 11.5 10 5.4 19 9.4 3 6.0 45 8.1
I lost my job 0 0.0 0 0.0 0 .0 0 0.0 0 0.0
I could not find a job 16 14.3 27 14.4 5 2.6 15 25.1 63 11.2
Other 25 22.1 13 7.1 18 8.8 4 7.3 60 10.7
Total 111 100.0 185 100.0 203 100.0 59 100.0 558 100.0
Source: CHEC, 2013. Survey Question: Q3.4.7Note: Includes only graduates who were self-employed in the private sector.

13
PATHWAYS FROM UNIVERSITY TO WORK: ABRIDGED OVERVIEW
Employment by raceEmployment by race continues to reflect apartheid-era patterns of discrimination. Data from the survey shows that, whereas 61% of whites and 58% of Indians are employed in the private sector (as at 1 September 2012), only 35% of Africans and 44% of coloureds are employed in the same sector. Indeed, African and coloured unemployment would be significantly larger if it were not for the public sector, which employs 42% of African and 45% of coloured graduates.
The public sector nationally is clearly playing a critical role in human capital formation by first, employing a significant number of young graduates from the four institutions, second, by em-ploying more women than men, and third, by employing larger numbers of Africans and coloureds than the private sector.
Notwithstanding the positive impact of public sector employ-ment, African graduates still have the largest unemployment rate – at 19%, followed by coloured graduates at 7%. Indians have the lowest unemployment rate at about 3%.
Employment by sector: Serving the ‘public good’Table 25 indicates that there were 17 274 graduates employed in the private, public, self-employed and informal sectors of the national economy. The strongest finding here is the indication that 47% of all graduates are employed by the public sector (described in Table 25 as the ‘Community, social and personal services’ sector), which is comprised of a few sub-sectors. By order of size of employment, these are:
▶ Education and research 18.2% ▶ Health and social work 13.5% ▶ Provincial and municipal government 11.6% ▶ Arts and culture, sport 4.1% ▶ TOTAL 47.4%
This ‘public good’ aspect of graduate output is an interesting and unexpected finding. For example, 64% of UWC and 56% of SU graduates from the 2010 cohort work in the ‘public econ-omy’. UCT and CPUT also have high numbers of graduates working here (42% and 41%) (CHEC, 2013: Table 7.20: 44).
The second largest employer is the ‘services sector’, a major part of the private sector (at 25.3%) which includes: finances, insurance, real estate, IT and business services. Participation in this sector is noticeably higher for UCT with 34% of their gradu-ates working here – a 10% lead over graduates from the three other institutions (CHEC, 2013: Table 7.20: 44).
Table 25 highlights the central contribution of three universi-ties to the production of teachers – SU (996 graduates), UCT (838 graduates) and CPUT (761 graduates) and UWC (541 graduates).
Similarly, the contribution of SU and UWC to the production of professionals employed in the public health sector – 19.9% and 19.4% of their 2010 graduate cohorts. UWC and CPUT lead in terms of their contribution to the production of public sector officials employed by government and municipalities CHEC, 2013: Table 7.20: 44).
Table 23: Total employment as at 1 September 2012, by institution Institution
CPUT UCT SU UWC Total
Count % Count % Count % Count % Count %
Employed (part- or full-time) in the private sector 3 129 45.8 2 819 57.6 2 670 46.4 1 187 38.1 9 806 47.6
Employed (part- or full-time) in the public sector 2 351 34.4 1 359 27.8 2 428 42.2 1 356 43.5 7 493 36.4
Self-employed in the private sector 130 1.9 195 4.0 222 3.9 80 2.6 627 3.0
Employed in the informal sector 63 .9 79 1.6 32 .6 17 .6 191 .9
Unemployed and looking for work 1 076 15.8 311 6.4 276 4.8 419 13.4 2 082 10.1
Unemployed but not looking for work 85 1.2 129 2.6 124 2.2 56 1.8 393 1.9
Total 6 834 100.0 4 891 100.0 5 752 100.0 3 115 100.0 20 592 100.0
Source: CHEC, 2013. Survey Question: Q3.4Note: Excludes graduates who were studying fulltime.
Table 24: Total employment as at 1 September 2012, by raceAfrican Coloured Indian White Total
Count % Count % Count % Count % Count %
Employed (part- or full-time) in the private sector 2 288 35.0 2 523 44.0 414 57.7 4 451 61.4 9 676 47.8
Employed (part- or full-time) in the public sector 2 762 42.2 2 599 45.3 238 33.2 1 751 24.2 7 350 36.3
Self-employed in the private sector 97 1.5 125 2.2 16 2.3 375 5.2 613 3.0
Employed in the informal sector 54 .8 21 .4 7 .9 104 1.4 187 0.9
Unemployed and looking for work 1 248 19.1 404 7.0 23 3.2 362 5.0 2 036 10.1
Unemployed but not looking for work 90 1.4 68 1.2 20 2.8 205 2.8 384 1.9
Total 6 539 100.0 5 740 100.0 717 100.0 7 249 100.0 20 246 100.0
Source: CHEC, 2013. Survey Question: Q3.4Note: Excludes graduates who were studying fulltime. Excludes 2% of graduates classified as “other” or not classified at all.

PATHWAYS FROM UNIVERSITY TO WORK: ABRIDGED OVERVIEW
14
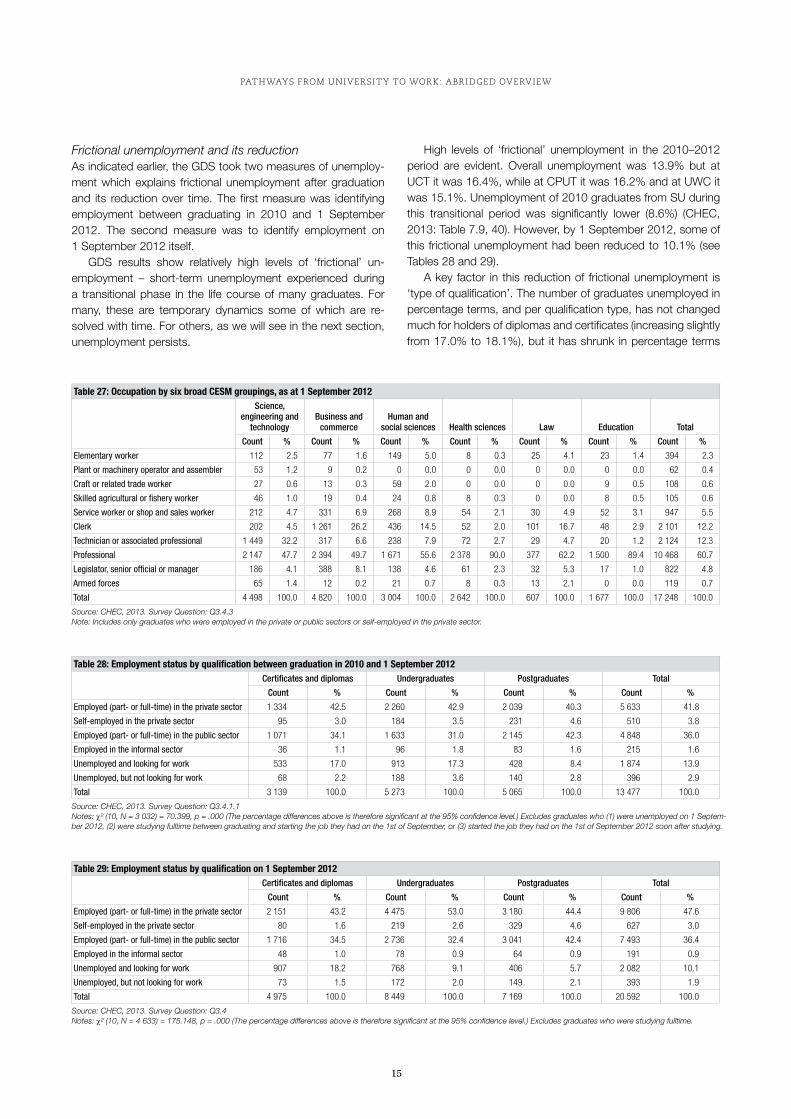
Employment by occupation The majority of the 2010 graduates were employed as profes-sionals – about 61%. The number of ‘professionals’ produced was higher at UCT and SU – 73% and 71% respectively. CPUT had the highest number of graduates employed as technicians, associated professionals, clerical, sales and craft workers – which again are all mission-appropriate employment outcomes. In contrast to the above success, it is disturbing that 394 gradu-ates see themselves as working as ‘elementary labourers’. This may be a respondent misinterpretation of the question, but it may also reflect a certain level of under-employment in the economy.
Women form the majority of professionals – 57% (CHEC, 2013: Table 7.26, 47). This statistic, plus the higher levels of female employment in professional posts in the government sector reported earlier in the text, have had a major impact on the structure of the labour market for women professionals.
Table 27 cross-tabulates ‘occupational employment’ with
‘field of study’. The data indicates which fields of study feed par-ticular occupational categories more than other academic fields. For example, the academic field which produces the most gradu-ates as ‘professionals’ is ‘education’ – at 89%. This is probably because entry into the profession requires a professional univer-sity qualification. SET follows in second place at 63.4%.
The ‘Business and Commerce’ field of study stands out as being associated with the highest number of clerical workers employed – at 26.2%. Many of these will be low-skill jobs in the services sector.
Similarly, although 56.7% of graduates with humanities and social science degree specialisations are employed as professionals, 14.9% are employed at para-professional level and 8.2% at clerical level. Only 4.7% are appointed at mana-gerial level. This allocation of humanities graduates across the occupational spectrum reflects the problems faced by many humanities degree holders with regard to the labour market.
Table 25: Total employment by sector, as at 1 September 2012 Institution
CPUT UCT SU UWC Total
Count % Count % Count % Count % Count %
Agriculture, hunting, forestry and fishing 75 1.4 36 0.8 161 3.2 42 1.7 313 1.8
Mining and quarrying 53 1.0 125 2.9 137 2.7 14 0.6 330 1.9
Manufacturing 385 7.1 136 3.2 114 2.2 37 1.5 671 3.9
Electricity, gas and water supply 188 3.5 113 2.7 87 1.7 31 1.2 419 2.4
Construction (including building and design) 570 10.5 244 5.7 132 2.6 18 0.7 964 5.6
Wholesale and retail trade (including sale of products, tourism, hotels and restaurants, vehicle repairs) 475 8.8 229 5.4 235 4.6 116 4.6 1 055 6.1
Transport, storage and communication, tele-communications 230 4.2 103 2.4 252 5.0 55 2.2 640 3.7
Finance, insurance, real estate, IT, and business services 1 198 22.1 1 462 34.4 1 105 21.7 601 23.9 4 367 25.3
Community, social and personal services: Health and social work 474 8.7 361 8.5 1 014 19.9 490 19.4 2 338 13.5
Community, social and personal services: Education and research 761 14.1 838 19.7 996 19.6 541 21.5 3 136 18.2
Community, social and personal services: Government and municipalities 775 14.3 181 4.3 570 11.2 470 18.7 1 997 11.6
Community, social and personal services: NGOs 39 0.7 151 3.5 113 2.2 37 1.5 340 2.0
Community, social and personal services: Entertainment, arts and culture, sport and the media 191 3.5 275 6.5 170 3.3 66 2.6 702 4.1
Total 5 416 100.0 4253 100.0 5 085 100.0 2 519 100.0 17 274 100.0
Source: CHEC, 2013. Survey Question: Q3.4.2Note: Includes only graduates who were employed in the private or public sectors or self-employed in the private sector.
Table 26: Total employment by occupation, as at 1 September 2012Institution
CPUT UCT SU UWC Total
Count % Count % Count % Count % Count %
Elementary worker 113 2.1 139 3.3 91 1.8 50 2.0 394 2.3
Plant or machinery operator and assembler 39 0.7 5 0.1 14 0.3 4 0.1 62 0.4
Craft or related trade worker 52 1.0 32 0.8 17 0.3 7 0.3 108 0.6
Skilled agricultural or fishery worker 42 0.8 0 0.0 56 1.1 7 0.3 105 0.6
Service worker or shop and sales worker 405 7.5 135 3.2 183 3.6 224 8.9 947 5.5
Clerk 1 003 18.5 291 7.0 444 8.6 363 14.5 2 101 12.2
Technician or associated professional 1 218 22.5 358 8.6 360 7.0 186 7.4 2 124 12.3
Professional 2 213 40.8 3 065 73.3 3 667 71.3 1 523 60.8 10 468 60.7
Legislator, senior official or manager 309 5.7 153 3.7 250 4.9 110 4.4 822 4.8
Armed forces 31 0.6 0 0.0 57 1.1 30 1.2 119 0.7
Total 5 427 100.0 4 179 100.0 5 139 100.0 2 504 100.0 17 248 100.0
Source: CHEC, 2013. Survey Question: Q3.4.3Note: Includes only graduates who were employed in the private or public sectors or self-employed in the private sector.
15
PATHWAYS FROM UNIVERSITY TO WORK: ABRIDGED OVERVIEW
Frictional unemployment and its reductionAs indicated earlier, the gDS took two measures of unemploy-ment which explains frictional unemployment after graduation and its reduction over time. The first measure was identifying employment between graduating in 2010 and 1 September 2012. The second measure was to identify employment on 1 September 2012 itself.
gDS results show relatively high levels of ‘frictional’ un-employment – short-term unemployment experienced during a transitional phase in the life course of many graduates. For many, these are temporary dynamics some of which are re-solved with time. For others, as we will see in the next section, unemployment persists.
High levels of ‘frictional’ unemployment in the 2010–2012 period are evident. Overall unemployment was 13.9% but at UCT it was 16.4%, while at CPUT it was 16.2% and at UWC it was 15.1%. Unemployment of 2010 graduates from SU during this transitional period was significantly lower (8.6%) (CHEC, 2013: Table 7.9, 40). However, by 1 September 2012, some of this frictional unemployment had been reduced to 10.1% (see Tables 28 and 29).
A key factor in this reduction of frictional unemployment is ‘type of qualification’. The number of graduates unemployed in percentage terms, and per qualification type, has not changed much for holders of diplomas and certificates (increasing slightly from 17.0% to 18.1%), but it has shrunk in percentage terms
Table 27: Occupation by six broad CeSM groupings, as at 1 September 2012Science,
engineering and technology
Business and commerce
Human and social sciences Health sciences Law Education Total
Count % Count % Count % Count % Count % Count % Count %
Elementary worker 112 2.5 77 1.6 149 5.0 8 0.3 25 4.1 23 1.4 394 2.3
Plant or machinery operator and assembler 53 1.2 9 0.2 0 0.0 0 0.0 0 0.0 0 0.0 62 0.4
Craft or related trade worker 27 0.6 13 0.3 59 2.0 0 0.0 0 0.0 9 0.5 108 0.6
Skilled agricultural or fishery worker 46 1.0 19 0.4 24 0.8 8 0.3 0 0.0 8 0.5 105 0.6
Service worker or shop and sales worker 212 4.7 331 6.9 268 8.9 54 2.1 30 4.9 52 3.1 947 5.5
Clerk 202 4.5 1 261 26.2 436 14.5 52 2.0 101 16.7 48 2.9 2 101 12.2
Technician or associated professional 1 449 32.2 317 6.6 238 7.9 72 2.7 29 4.7 20 1.2 2 124 12.3
Professional 2 147 47.7 2 394 49.7 1 671 55.6 2 378 90.0 377 62.2 1 500 89.4 10 468 60.7
Legislator, senior official or manager 186 4.1 388 8.1 138 4.6 61 2.3 32 5.3 17 1.0 822 4.8
Armed forces 65 1.4 12 0.2 21 0.7 8 0.3 13 2.1 0 0.0 119 0.7
Total 4 498 100.0 4 820 100.0 3 004 100.0 2 642 100.0 607 100.0 1 677 100.0 17 248 100.0
Source: CHEC, 2013. Survey Question: Q3.4.3 Note: Includes only graduates who were employed in the private or public sectors or self-employed in the private sector.
Table 28: employment status by qualification between graduation in 2010 and 1 September 2012Certificates and diplomas Undergraduates Postgraduates Total
Count % Count % Count % Count %
Employed (part- or full-time) in the private sector 1 334 42.5 2 260 42.9 2 039 40.3 5 633 41.8
Self-employed in the private sector 95 3.0 184 3.5 231 4.6 510 3.8
Employed (part- or full-time) in the public sector 1 071 34.1 1 633 31.0 2 145 42.3 4 848 36.0
Employed in the informal sector 36 1.1 96 1.8 83 1.6 215 1.6
Unemployed and looking for work 533 17.0 913 17.3 428 8.4 1 874 13.9
Unemployed, but not looking for work 68 2.2 188 3.6 140 2.8 396 2.9
Total 3 139 100.0 5 273 100.0 5 065 100.0 13 477 100.0
Source: CHEC, 2013. Survey Question: Q3.4.1.1 Notes: χ² (10, N = 3 032) = 70.399, p = .000 (The percentage differences above is therefore significant at the 95% confidence level.) Excludes graduates who (1) were unemployed on 1 Septem-ber 2012, (2) were studying fulltime between graduating and starting the job they had on the 1st of September, or (3) started the job they had on the 1st of September 2012 soon after studying.
Table 29: employment status by qualification on 1 September 2012Certificates and diplomas Undergraduates Postgraduates Total
Count % Count % Count % Count %
Employed (part- or full-time) in the private sector 2 151 43.2 4 475 53.0 3 180 44.4 9 806 47.6
Self-employed in the private sector 80 1.6 219 2.6 329 4.6 627 3.0
Employed (part- or full-time) in the public sector 1 716 34.5 2 736 32.4 3 041 42.4 7 493 36.4
Employed in the informal sector 48 1.0 78 0.9 64 0.9 191 0.9
Unemployed and looking for work 907 18.2 768 9.1 406 5.7 2 082 10.1
Unemployed, but not looking for work 73 1.5 172 2.0 149 2.1 393 1.9
Total 4 975 100.0 8 449 100.0 7 169 100.0 20 592 100.0
Source: CHEC, 2013. Survey Question: Q3.4Notes: χ² (10, N = 4 633) = 175.148, p = .000 (The percentage differences above is therefore significant at the 95% confidence level.) Excludes graduates who were studying fulltime.

PATHWAYS FROM UNIVERSITY TO WORK: ABRIDGED OVERVIEW
16
for holders of degrees – from 17.3% to 9.1% – a significant reduction in graduate unemployment. One of the reasons for this reduction in the unemployment of graduates with degrees is the increased role of the private economy in employing more graduates with degrees – up from 41.8% to 47.6% in a period of less than two years.
Causal factors behind these frictional dynamics are not re-vealed by the gDS. In the mix of possible reasons could be the timing of graduation ceremonies. Both UCT and SU had December graduations in year 2010, whereas UWC and CPUT had March 2011 graduations (for the 2010 cohort). This ‘timing of graduation’ factor may be part of the reason why UCT fric-tional unemployment is temporarily high – their graduates were in the labour market three months earlier than CPUT and UWC graduates.
Job search behaviourInvestigating the different techniques of ‘job search’ forms a critical part of gDSs. In this CHEC survey, sending CVs to pro-spective employers (18% of graduates) seems to have been the main job search technique used, followed by responding to a job advertisement in the print media (13%). However, if two techniques are grouped together – finding a job through family and friends, as well as through being asked to apply by the firm – they constitute the most commonly used search methods used by graduates. Both referrals – either through ‘family and friends’ or ‘being asked to apply for a job’ – signify prior knowl-edge of where to secure employment, qualities which derive from one’s social connections or ‘social capital’.
The concept ‘social capital’ signifies those social networks and family know-how that enable young family members to
successfully navigate their way through the modern-day labour market into rewarding jobs and careers. Working class families, who generally have limited ‘social capital’ (poor social networks and access to information about educational and employment opportunities), are therefore unable to support the decisions of their graduated young with regard to employment options. In contrast, middle-class families have access to information, and are often friends or family of the managers and owners of firms, and they are more likely to influence the employment choices made by their offspring (Ball, 2010).
The influence of social capital is more telling when decom-posed by race. The data suggests that those social networks structured around white students are very influential in helping find employment – 28% of white graduates used and benefited from this form of job search, whereas only 11% of Africans did (CHEC, 2013: Tables 7.32: 50). When reading the rows horizon-tally, as is done in Table 28, with a specific focus on the two job search techniques discussed above under the concept ‘social capital’, the data in Table 30 suggest that white students are able to successfully tap into those social networks that help them to find employment – 54% of such beneficiaries were White graduates, whereas only 18% of ‘social capital’ benefi-ciaries were Africans.
PATHWAY FIVE: THE UNEMPLOYEd
Discussion can now shift from the four pathways comprising employment and focus on the fifth pathway which includes all unemployed graduates. A key concern at the heart of the CHEC gDS is to determine the extent of graduate unemployment.
Table 30: Primary ‘job search’ method of finding the job held on 1 September 2012Institution
CPUT UCT SU UWC Total
Count % Count % Count % Count % Count %
A holiday job or internship gave me access to this job 541 11.1 266 6.8 222 4.9 204 8.8 1 233 7.9
Through help of a lecturer 137 2.8 161 4.1 239 5.3 108 4.6 645 4.1
Through my university’s career office 208 4.3 306 7.9 226 5.0 106 4.5 847 5.4
I initially offered to work for free 23 0.5 33 0.8 48 1.1 14 0.6 118 0.8
I had to work off a bursary I got from my employer 184 3.8 285 7.3 289 6.4 91 3.9 849 5.4
I simply sent in my CV or asked for work 876 17.9 691 17.8 753 16.7 444 19.1 2 763 17.7
I responded to a job ad in the printed media 717 14.7 306 7.9 714 15.9 314 13.5 2 050 13.1
I responded to a job ad on an employment website 437 8.9 348 9.0 385 8.6 219 9.4 1 389 8.9
I responded to a job ad on a company website 351 7.2 276 7.1 198 4.4 177 7.6 1 001 6.4
I responded to a job ad in the Government Gazette 245 5.0 66 1.7 239 5.3 165 7.1 715 4.6
I placed ads or flyers advertising my services on notice boards or in post-boxes 16 0.3 0 0.0 4 0.1 7 0.3 27 0.2
I walked from door-to-door 74 1.5 13 0.3 20 0.4 37 1.6 145 0.9
Through one of the Department of Labour’s employment centres 41 0.8 5 0.1 31 0.7 35 1.5 112 0.7
Through a recruitment agency or labour broker 185 3.8 181 4.7 145 3.2 76 3.3 587 3.8
Through a social network 41 0.8 70 1.8 37 0.8 15 0.7 164 1.0
Through family or friends 629 12.9 503 12.9 636 14.1 223 9.6 1992 12.8
I was headhunted or asked to apply for the job 184 3.8 378 9.7 313 7.0 93 4.0 968 6.2
Sub-total – social capital 813 16.7 881 22.6 949 21.1 316 13.6 2 960 19.0
Total 4 890 100.0 3 888 100.0 4 498 100.0 2 328 100.0 15 605 100.0
Source: CHEC, 2013. Survey Question: Q3.4.6Note: Includes only graduates who were employed in the private or public sectors. Excludes graduates who were already in the company and did not approach or contact the company like all other job seekers. The total of 15 605 methods of ‘job search’ is necessarily higher than the actual number of graduates as graduates could have indicated multiple methods.

17
PATHWAYS FROM UNIVERSITY TO WORK: ABRIDGED OVERVIEW
Table 32 highlights the core employment and unemployment details of the 2010 graduate cohort on 1 September 2012. The most critical piece of information here is the fact that 10% of graduates were unemployed two years after graduating – with unemployment peaking amongst CPUT graduates at 16%. Unemployment rates amongst SU and UCT graduates are rela-tively low – at about 5% and 6% respectively.
Respondents were also asked to outline the length of time they have been looking for a job and have been unemployed. Of those unemployed, 44% had been unemployed during 2012 (a maximum of 9 months with 1 September 2012 the key cut-off date), 38% since 2011, and 18% since 2010 (CHEC, 2013: Table 9.2, 56).
Data from the gDS shows the patterns of graduate unem-ployment by race. White graduate unemployment is relatively small, experienced primarily in the first year after graduation. Of those white graduates unemployed, 63% experienced un-employment only in the first year after graduation, 28% expe-rienced unemployment over two years, and only 9% of white unemployed graduates experienced unemployment for just under three years. This is in stark contrast to African graduate unemployment: 34% of African graduates were unemployed for under a year, 43% were unemployed for under two years, and 23% for just under three years. The rate of exit out of unem-ployment is much more rapid for White graduates than it is for Africans where a large grouping (229 graduates) appear to be ‘stuck’ in unemployment for nearly three years (CHEC, 2013: Table 9.3: 56).
These patterns of unemployment over time are not that dif-ferent from Schomburg and Teichler’s findings in their gDS study of several European countries. For example, in three countries – Italy, Spain and France – 36%, 38% and 68% of graduates took more than 13 months to find their first job (Schomburg and Teichler, 2006: 77).
Job search behaviour of the unemployedIn the earlier discussion on ‘social capital’, the concept was seen as a powerful device for 25% of white graduates who benefited from family and friends who on an informed basis could advise and steer them towards employment. For the unemployed, ‘social capital’ as a resource was significantly weaker, varying from between about 6% for CPUT and UWC graduates to 8% for UCT and 9% for SU graduates (CHEC 2013, Table 9.8: 95). However, when examining the usage patterns of each job search item by race (see Table 33), the numbers become more revealing. Two specific activities of job search stand out that are highly racialised – ‘Walking from door-to-door’ (with 75% of those doing this being Africans compared to only 9% for white unemployed graduates), and ‘Approaching the Department of Labour Employment Centres’ (with 83% of those doing this being African as compared with only 8% for whites). The same applies to putting notices in post-boxes or on notice boards. These statistics suggest that African graduates are more in-clined to use government employment services and agencies to find work, and are more desperate to find work (being more prepared to walk door-to-door looking for work) than is the case for unemployed white graduates.
Causal factors impacting on graduate unemploymentThis section briefly examines which background factors are associated with unemployment. The first correlation to be inves-tigated is that between level of unemployment and matriculation symbol attained in grade 12 mathematics and physical science. As is evident in Table 34, unemployment increases as matricula-tion symbol in both mathematics and physical science declines from ‘A’ to ‘H’. This trend is also evident in terms of employment – very high levels of employment (95%) are obtained for those with A or B symbols in mathematics. However, employment decreases to 84% and 88% for those with E to H symbols in mathematics and physical science. There is a clear correlation
Table 31: beneficiaries of social capital as primary ‘job search’ method in finding a job, 1 September 2012, by raceAfrican Coloured Indian White Total
Count % Count % Count % Count % Count %
Beneficiaries of social capital: i.e., those who acquired a job through referrals from family and friends or through being asked to apply for the post 521 17.8 714 24.4 110 3.8 1 579 54.0 2 923 100.0
Source: CHEC, 2013
Table 32: Total employment as at 1 September 2012 Institution
CPUT UCT SU UWC Total
Count % Count % Count % Count % Count %
Employed (part- or full-time) in the private sector 3 129 45.8 2 819 57.6 2 670 46.4 1 187 38.1 9 806 47.6
Employed (part- or full-time) in the public sector 2 351 34.4 1 359 27.8 2 428 42.2 1 356 43.5 7 493 36.4
Self-employed in the private sector 130 1.9 195 4.0 222 3.9 80 2.6 627 3.0
Employed in the informal sector 63 0.9 79 1.6 32 0.6 17 0.6 191 0.9
Unemployed and looking for work 1 076 15.8 311 6.4 276 4.8 419 13.4 2 082 10.1
Unemployed, but not looking for work 85 1.2 129 2.6 124 2.2 56 1.8 393 1.9
Total 6 834 100.0 4 891 100.0 5 752 100.0 3 115 100.0 20 592 100.0
Source: CHEC, 2013. Survey Question: Q3.4Note: Excludes graduates who were studying fulltime.

PATHWAYS FROM UNIVERSITY TO WORK: ABRIDGED OVERVIEW
18
here, but it is not hugely punitive in terms of unemployment because graduates with poor maths and science grades are still attaining employment in large numbers.
Unemployment and home provinceThe home province during schooling is also a significant factor in the employment outcome for many graduates in the 2010 cohort. Table 35 shows that very high levels of unemployment exist among graduates who came from Limpopo Province (19% unemployment), North West (17%), Eastern Cape (15%) and Mpumalanga (15%). Unemployment amongst graduates who completed secondary schooling in KwaZulu-Natal and Free State is 4.1% and 6.5% – both significantly lower than the first category of provinces listed above. The sub-cohort who schooled in the Western Cape is close to the mid-point with unemployment rates at 8.5%. The very high percentages of unemployment listed here are reflections of wider inequalities in
the schooling system that exists across the country. Poor grade 12 mathematics and physical science pass rates are an annual occurrence in provinces such as Limpopo, North West, Eastern Cape and Mpumalanga. Even though all members of the 2010 cohort are by definition graduates – which means they passed the minimum requirements for the award of the higher education qualification they achieved – employers may still refer to their school grades before making decisions about employment.
Unemployment and location of childhood school A key socio-economic indicator for poverty and wealth in South Africa is the location of the secondary school attended by those graduates who are now unemployed. The CHEC gDS asked respondents about the type of neighbourhood they grew up in whilst at senior secondary school. The vast majority of employed graduates (93%) went to school in the suburbs of the major cities and towns of South Africa. With regard to
Table 33: Methods of job search, unemployed graduates, by race, 2010 graduate cohort
African Coloured Indian White Total
Count % Count % Count % Count % Count %
I approached a lecturer 120 48.2 42 16.9 14 5.6 72 28.9 249 100.0
I approached my university’s career office 177 60.6 37 12.7 10 3.4 68 23.3 292 100.0
I have offered to work for free 161 53.5 54 17.9 14 4.7 73 24.3 301 100.0
I sent my CV or asked for jobs directly 665 58.6 213 18.8 10 0.9 247 21.8 1 135 100.0
I responded to job ads in the printed media 686 62.8 236 21.6 10 0.9 160 14.7 1 092 100.0
I responded to job ads on employment websites 839 61.2 277 20.2 15 1.1 240 17.5 1 371 100.0
I responded to job ads on company websites 650 60.5 223 20.7 18 1.7 184 17.1 1 075 100.0
I responded to job ads in the Government Gazette 321 66.3 83 17.1 5 1.0 74 15.3 484 100.0
I placed ads or flyers advertising my services on notice boards or in post-boxes 63 76.8 0 0.0 5 6.1 14 17.1 82 100.0
I walked from door-to-door asking for work 183 75.0 35 14.3 5 2.0 21 8.6 244 100.0
I approached one of the Department of Labour’s employment centres 141 83.4 9 5.3 5 3.0 13 7.7 169 100.0
I approached recruitment agencies or labour brokers 309 62.0 80 16.1 10 2.0 100 20.1 498 100.0
I approached family or friends personally 284 52.2 118 21.7 10 1.8 132 24.3 544 100.0
I used social networks 224 48.3 86 18.5 10 2.2 143 30.8 464 100.0
Other 27 32.5 17 20.5 5 6.0 34 41.0 83 100.0
Total 4 853 60.0 1 510 18.7 143 1.8 1 577 19.5 8 083 100.0
Source: CHEC, 2013. Survey Question: Q3.4.13Note: Includes only graduates who were unemployed and looking for work on 1 September 2012. Excludes 2% of graduates classified as ‘other’ or not classified at all.
Table 34: graduate unemployment by matriculation symbol in Mathematics and Physical Science (employment/unemployment as measured on 1 September 2012)
Employed in the private or public sector or self-employed in the private sector
Unemployed and looking for work Total
GRADE 12 MATHEMATICS SyMBOL
Count % Count % Count %
Maths symbol
A – B 4 190 94.8 230 5.2 4 421 100.0
C – D 3 918 90.8 396 9.2 4 315 100.0
E – H 2 820 84.5 519 15.5 3 339 100.0
Total 10 928 90.5 1146 9.5 12 075 100.0
GRADE 12 PHySICAL SCIENCE SyMBOL
Physical science symbol
A – B 2 472 96.3 95 3.7 2 567 100.0
C – D 3 185 92.6 255 7.4 3 440 100.0
E – H 2 040 84.8 366 15.2 2 407 100.0
Total 7 698 91.5 716 8.5 8 413 100.0
Source: CHEC, 2013. Survey Question: Q3.4Note: Includes only South African graduates living in South Africa on 1 September 2012. Includes undergraduates only. Maths and science results not available for postgraduates.

19
PATHWAYS FROM UNIVERSITY TO WORK: ABRIDGED OVERVIEW
unemployment, the gDS data suggests that there is a correla-tion between unemployment and schooling in a township (19% are unemployed) and rural village setting (14% unemployment). Unemployment is significantly lower for those who attended secondary schooling in the suburbs (only 7%).
PATHWAY SIX: CONTINUINg HIgHER EdUCATION
Results from the gDS indicate that 31% of the 2010 cohort were registered for further studies on 1 September 2012 – with the highest registration amongst SU graduates at 33% (CHEC, 2013: Tables 11.13: 74). The bulk of these graduates (94%) were reg-istered for continuing higher education at South African universi-ties, and only a small number (6%) pursued further degrees at international universities (CHEC, 2013: Tables 11.10: 73).
Data in Tables 37 and 38 highlight the number of graduates who returned to the national higher education system to continue with higher education after graduation in 2010. The data mea-sures the contribution of the four Western Cape universities to the national pool of (largely postgraduate) continuing higher educa-tion. It cannot be assumed that because a continuing student graduated at a specific Western Cape institution in 2010, they will
return to that institution to continue with their higher studies after 2010. They may have enrolled at any of the other 20 universities in the national higher education system in South Africa.1
Table 37 confirms that a high proportion of graduates study-ing further on 1 September 2012 were registered for a master’s degree on the 1 September 2012 – 42%. This suggests a logical sequence of studying for those graduates pursuing continuing higher education – first acquiring a bachelors degree in 2010, a honours degree between 2010 and 2012, and registering for a master’s degree in the current period (September 2012). Some students have in fact progressed to a doctoral degree in this time period as well – 9% of those studying further.
Table 38 shows that former SU graduates constitute the largest grouping of continuing higher education students in the national system, at 33% of the returning national cohort, followed by CPUT at 26%, UCT at 23% and UWC 17%. Stellenbosch graduates dominate two categories of on-going higher learning in the national system – honours and master’s degrees (at 38% and 41% respectively). UCT contributes the largest number of continuing learners registered for a doctoral degree (at 36.9%) but with a short lead over Stellenbosch (36.6). And as mentioned earlier, CPUT contributes the highest number of enrolments at the lower qualifications – certificates/diplomas and bachelors programmes – at 39% and 70%.
Table 35: Unemployment by home province during secondary schooling (employment/unemployment as measured on 1 September 2012)Employed in the private or public sector or self-employed in the private sector
Unemployed and looking for work Total
Count % Count % Count %
EC 2 002 84.5 368 15.5 2 370 100.0
FS 235 93.5 16 6.5 251 100.0
GP 1 202 91.7 109 8.3 1 311 100.0
KZN 1 046 95.9 45 4.1 1 091 100.0
LP 369 80.7 88 19.3 457 100.0
MP 213 84.8 38 15.2 251 100.0
NC 358 93.3 26 6.7 384 100.0
NW 231 82.8 48 17.2 279 100.0
WC 10 003 91.5 929 8.5 10 932 100.0
Total 15 659 90.4 1 666 9.6 17 326 100.0
Source: CHEC, 2013. Survey Questions: Q1.1.1 and Q3.4Note: Includes only South African graduates living in South Africa on 1 September 2012.
Table 36: Unemployment by location of Secondary School (employment/unemployment as measured on 1 September 2012)Employed in the private or public sector or self-employed in the private sector Unemployed and looking for work Total
Count % Count % Count %
In a suburb of a town or city 12 393 92.6 992 7.4 13 385 100.0
In a township or informal settlement of a town or city 1 782 81.1 414 18.9 2 196 100.0
In a village or on a farm in a rural area 1 376 85.5 233 14.5 1 609 100.0
Total 15 552 90.5 1 639 9.5 17 191 100.0
Source: CHEC, 2013. Survey Questions: Q1.1.1 and Q3.4Note: Includes only South African graduates living in South Africa on the 1st of September 2012.
1 A small component of this contribution to the South African ‘national pool’ of highly educated continuing students registered for their continuing qualification overseas – 3.5% of continuing learners in the period from graduation to September 2012 and 6% as measured on 1 September 2012. This rider to the concept of ‘national pool’ applies to all the tables from Table 11.1 to Table 11.21. Some of the learners registered for overseas degrees will return to South Africa and form part of the ‘national pool’ after graduation (and perhaps after some work experience) but the extent of this ‘brain gain’ and ‘brain loss’ is not known.
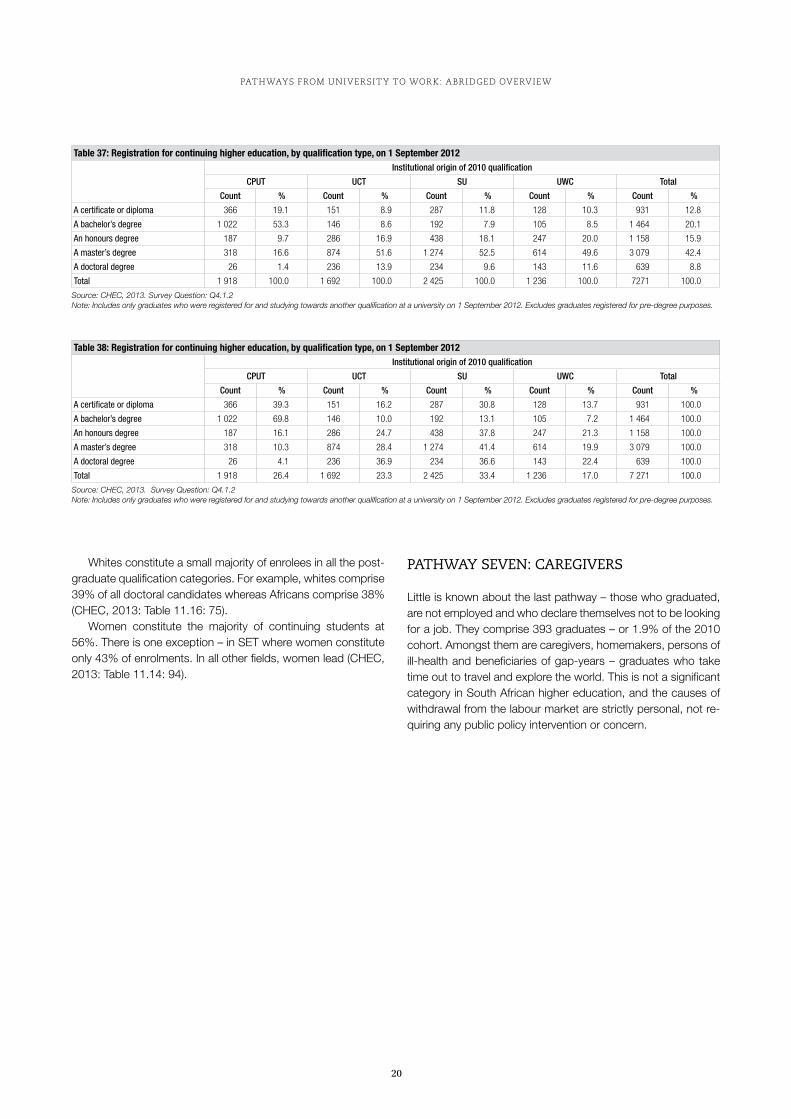
PATHWAYS FROM UNIVERSITY TO WORK: ABRIDGED OVERVIEW
20
Whites constitute a small majority of enrolees in all the post-graduate qualification categories. For example, whites comprise 39% of all doctoral candidates whereas Africans comprise 38% (CHEC, 2013: Table 11.16: 75).
Women constitute the majority of continuing students at 56%. There is one exception – in SET where women constitute only 43% of enrolments. In all other fields, women lead (CHEC, 2013: Table 11.14: 94).
PATHWAY SEVEN: CAREgIVERS
Little is known about the last pathway – those who graduated, are not employed and who declare themselves not to be looking for a job. They comprise 393 graduates – or 1.9% of the 2010 cohort. Amongst them are caregivers, homemakers, persons of ill-health and beneficiaries of gap-years – graduates who take time out to travel and explore the world. This is not a significant category in South African higher education, and the causes of withdrawal from the labour market are strictly personal, not re-quiring any public policy intervention or concern.
Table 37: registration for continuing higher education, by qualification type, on 1 September 2012Institutional origin of 2010 qualification
CPUT UCT SU UWC Total
Count % Count % Count % Count % Count %
A certificate or diploma 366 19.1 151 8.9 287 11.8 128 10.3 931 12.8
A bachelor’s degree 1 022 53.3 146 8.6 192 7.9 105 8.5 1 464 20.1
An honours degree 187 9.7 286 16.9 438 18.1 247 20.0 1 158 15.9
A master’s degree 318 16.6 874 51.6 1 274 52.5 614 49.6 3 079 42.4
A doctoral degree 26 1.4 236 13.9 234 9.6 143 11.6 639 8.8
Total 1 918 100.0 1 692 100.0 2 425 100.0 1 236 100.0 7271 100.0
Source: CHEC, 2013. Survey Question: Q4.1.2Note: Includes only graduates who were registered for and studying towards another qualification at a university on 1 September 2012. Excludes graduates registered for pre-degree purposes.
Table 38: registration for continuing higher education, by qualification type, on 1 September 2012Institutional origin of 2010 qualification
CPUT UCT SU UWC Total
Count % Count % Count % Count % Count %
A certificate or diploma 366 39.3 151 16.2 287 30.8 128 13.7 931 100.0
A bachelor’s degree 1 022 69.8 146 10.0 192 13.1 105 7.2 1 464 100.0
An honours degree 187 16.1 286 24.7 438 37.8 247 21.3 1 158 100.0
A master’s degree 318 10.3 874 28.4 1 274 41.4 614 19.9 3 079 100.0
A doctoral degree 26 4.1 236 36.9 234 36.6 143 22.4 639 100.0
Total 1 918 26.4 1 692 23.3 2 425 33.4 1 236 17.0 7 271 100.0
Source: CHEC, 2013. Survey Question: Q4.1.2Note: Includes only graduates who were registered for and studying towards another qualification at a university on 1 September 2012. Excludes graduates registered for pre-degree purposes.

21
This section seeks to identify, using specific statistical methods, which background factors are the strongest predictors of em-ployment. The analysis here examines only those who gradu-ated with certificates, diplomas and undergraduate degrees. To do this, a number of CHAID (Chi-square Automatic Interaction Detection) analyses were conducted to determine which of several ‘background’ factors were statistically the strongest predictors of ‘employment’ and ‘further study’. The discussion here relates only to non-degree and undergraduate members of the 2010 cohort.
Of all five socio-demographic variables prioritised in the gDS, namely (1) gender, (2) age, (3) population group, (4) home province, and (5) type of area in which the high school was lo-cated, ‘population group’ emerged as statistically the strongest ‘socio-demographic’ predictor of employment amongst these graduates. A significantly larger percentage of white and Indian undergraduates (about 96%) were employed as opposed to Coloured (about 91%) and African (about 77%) undergradu-ates. When ‘race’ was removed from the CHAID, ‘type of area in which the high school was located’ emerged as the next strongest predictor, with a significantly larger percentage of graduates who attended a suburban school (about 90%) find-ing themselves employed as opposed to those who attended a rural or township school (about 79%).
Six ‘schooling and family background’ variables were priori-tised in the gDS, namely: (1) level of education of the mother/female guardian; (2) level of education of the father/male guardian; (3) type of high school attended (public or private; (4) matric maths symbol; (5) matric physical science symbol; and (6) whether a sibling obtained a higher education qualifica-tion prior to or in 2010. Of these six factors, ‘matric physical science symbol’ emerged as statistically the strongest predictor of employment amongst undergraduates. A significantly larger percentage of undergraduates who obtained a ‘B’ or higher for physical science in matric (about 96%) were employed as op-posed to those who obtained a ‘C’ or ‘D’ (about 91%) and in particular those who obtained an ‘E’ or lower (only about 84%). When ‘physical science symbol’ was removed from the CHAID, ‘matric maths symbol’ emerged as the strongest predictor, yielding a relatively similar percentage distribution to that of physical science. Academic performance in matric, particularly
in maths and physical science, therefore seem strongly related to undergraduates’ ability to find employment, more so than other schooling and family background factors such as parental education, type of schooling or siblings having succeeded at higher education. Yet it does not mean that these are not im-portant influences, it simply means that maths and science are more strongly related to success in getting a job.
Four ‘university background’ variables were also tested as part of the CHAID analysis, namely: (1) participation in extra-mural activities; (2) career guidance received; (3) internships or work placements undertaken; (4) and field of study. Of the four variables, ‘field of study’ (as classified in terms of the four main CESMs used by the Department of Higher Education and Training [DHET]), emerged as statistically the strongest predictor of undergraduate employment. A significantly larger percentage of those who studied ‘education’ (about 95%) found themselves employed as opposed to those who studied ‘science, engineer-ing and technology’ (about 87%) and ‘humanities’ or ‘business and commerce’ (only 83%). When ‘field of study’ was removed from the CHAID, ‘participation in extramural activities’ emerged as the strongest predictor of undergraduate employment, with a significantly larger percentage of those who participated in any extramural activities (88%) finding themselves employed as opposed to those who did not (about 84%). Thus, neither ca-reer guidance nor internships or work placements emerged as a statistically significant predictor of undergraduate employment.
THE SEVEN PATHWAYS
We now have a clearer quantitative picture of the pathways the Western Cape graduate cohort traversed after completing their qualification in 2010. The seven pathways, as described in dif-ferent parts of this report, are as follows:
1 ‘Mature’ graduates who have had prior work experience 7 415
2 Young first-time entrants into the labour market 9 707
3 Self-employed graduates working in the private sector 558
4 Employed in the informal sector 191
5 Unemployed graduates looking for work 2 082
6 Continuing to study full-time 7 586
7 Care-givers: unemployed, but not looking for work 393
WHICH FACTORS ARE THE STRONgEST PREdICTORS OF EMPLOYMENT?

PATHWAYS FROM UNIVERSITY TO WORK: ABRIDGED OVERVIEW
22
gEOgRAPHICAL MIgRATIONS
The seven pathways described above represent the most known-about routes out of higher education into work. But there are other transitions which the graduates of 2010 have traversed which are not reflected in the seven pathways – but which cut across all seven categories. International migration is the most important of these and it recruits candidates from all four employment pathways described above as well as from full-time students. This pathway is beneficial to the region and country if migrants who leave the province and who go over-seas come back to South Africa and share their newly acquired expertise. It is wasteful if they do not return. The gDS indicated that there are already 1 381 graduates (5.7%) from the 2010 cohort living outside the country (CHEC, 2013: Table 12.4: 82), with another 5.2% indicating they would like to leave South Africa some time in the future (CHEC, 2013: Table 12.17: 86), This constitutes a brain drain of 10.9% of the original 24 710 graduates – a significant loss.
A second geographical migration process has occurred within the 2010 cohort, but this one is based nationally, en-tailing graduates moving from the Western Cape to the other eight provinces. The data in Table 39 illustrates the ‘pull’ of the gauteng economy with 20% of UCT’s graduation segment finding employment in that province. The gauteng ‘pull’ has impacted on SU as well, with 12% of its 2010 graduates finding employment in that province. However, these could also include graduates originally from these provinces returning ‘home’ or returning to previously held jobs.
Table 40 is an amalgam of data which joins together the pro-vincial location of the graduates’ secondary schooling and the provincial location of their employment on 1 September 2012. Data from this table suggests that the Western Cape is in a ‘win-win’ situation regarding the complex relationship between migration, education and employment. It is what Brown and Lauder (2012) call a ‘magnet economy’. This is because the Western Cape attracts both high levels of grade 12 students into the province from other regions to study in its higher edu-cation institutions, and several years later, the province retains
the bulk of these graduates as skilled workers in the provincial economy.
Table 40 indicates that the Western Cape acquired an ad-ditional 8 085 grade 12 students enrolled for qualifications in its four higher education institutions. It also shows that of the total cohort (excluding international students), 4 859 graduat-ing students sought employment in other provinces (especially gauteng), resulting in a net gain for the Western Cape of 3 226 graduates who were from provinces other than the Western Cape, but who sought employment in the Western Cape after graduation. This is a 15% gain in high-skill personnel for the province.
The significance of understanding these seven life-course ‘pathways’ from higher education into work and civic life, and the two associated geographical migrations – one international, the other national – is that we now have a clearer picture of the multiple life-course phases and actual geographical movements young people undergo in pursuit of a good education and job – from school, through university into work, society and further study.
We are also more aware of exactly where unemployed gradu-ates are located – we can identify them by institution, race and gender, field of study, level of qualification, and by their home province. For those unfortunate enough to fall into a punitive com-bination of these variables, unemployment levels can approach 20% two years after graduation. This dataset, therefore, gives the four institutions of higher education in the Western Cape a very useful ‘strategic intelligence’ tool with which to plan remedial action and support for unemployed graduates in the future.
CONCLUSION: THE VALUE OF gRAdUATE dESTINATION SURVEYS
The value of this gDS is not merely in its detailed depiction of the Western Cape graduate labour market. It is also about the value of the gDS to institutional planning and state higher education policy reform. gDSs are dynamic tools for university managers and government higher education planners to generate a range
Table 39: Provincial Location of employment/home on 1 September 2012 (western Cape 2010 graduate cohort )Institution
CPUT UCT SU UWC Total
Count % Count % Count % Count % Count %
EC 273 3.8 94 1.7 310 4.5 119 3.4 795 3.5
FS 19 0.3 9 0.2 102 1.5 18 0.5 148 0.6
GP 309 4.3 1 071 19.8 790 11.6 241 6.8 2 411 10.5
KZN 77 1.1 197 3.6 214 3.1 99 2.8 587 2.6
LP 43 0.6 18 0.3 51 0.7 42 1.2 154 0.7
MP 43 0.6 14 0.3 156 2.3 32 0.9 244 1.1
NC 72 1.0 25 0.5 106 1.6 49 1.4 253 1.1
NW 92 1.3 53 1.0 73 1.1 50 1.4 267 1.2
WC 6 301 87.2 3 918 72.6 5 038 73.7 2 881 81.6 18 138 78.9
Total 7 229 100.0 5 398 100.0 6 841 100.0 3 531 100.0 22 998 100.0
Source: CHEC, 2013. Survey Question: Q5.2.1Note: Includes only graduates who were living in South Africa on 1 September 2012.
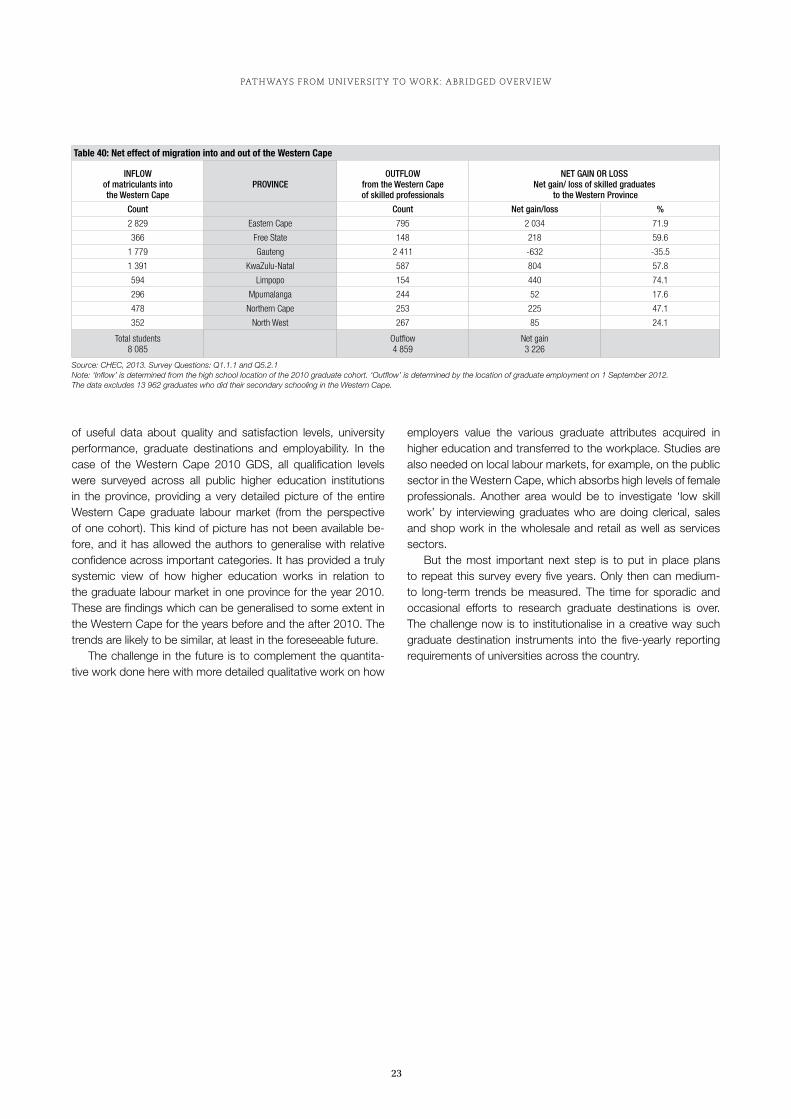
23
PATHWAYS FROM UNIVERSITY TO WORK: ABRIDGED OVERVIEW
of useful data about quality and satisfaction levels, university performance, graduate destinations and employability. In the case of the Western Cape 2010 gDS, all qualification levels were surveyed across all public higher education institutions in the province, providing a very detailed picture of the entire Western Cape graduate labour market (from the perspective of one cohort). This kind of picture has not been available be-fore, and it has allowed the authors to generalise with relative confidence across important categories. It has provided a truly systemic view of how higher education works in relation to the graduate labour market in one province for the year 2010. These are findings which can be generalised to some extent in the Western Cape for the years before and the after 2010. The trends are likely to be similar, at least in the foreseeable future.
The challenge in the future is to complement the quantita-tive work done here with more detailed qualitative work on how
employers value the various graduate attributes acquired in higher education and transferred to the workplace. Studies are also needed on local labour markets, for example, on the public sector in the Western Cape, which absorbs high levels of female professionals. Another area would be to investigate ‘low skill work’ by interviewing graduates who are doing clerical, sales and shop work in the wholesale and retail as well as services sectors.
But the most important next step is to put in place plans to repeat this survey every five years. Only then can medium- to long-term trends be measured. The time for sporadic and occasional efforts to research graduate destinations is over. The challenge now is to institutionalise in a creative way such graduate destination instruments into the five-yearly reporting requirements of universities across the country.
Table 40: Net effect of migration into and out of the western Cape
INFLOW of matriculants into the Western Cape
PROVINCEOUTFLOW
from the Western Cape of skilled professionals
NET GAIN OR LOSSNet gain/ loss of skilled graduates
to the Western Province
Count Count Net gain/loss %
2 829 Eastern Cape 795 2 034 71.9
366 Free State 148 218 59.6
1 779 Gauteng 2 411 -632 -35.5
1 391 KwaZulu-Natal 587 804 57.8
594 Limpopo 154 440 74.1
296 Mpumalanga 244 52 17.6
478 Northern Cape 253 225 47.1
352 North West 267 85 24.1
Total students 8 085
Outflow4 859
Net gain 3 226
Source: CHEC, 2013. Survey Questions: Q1.1.1 and Q5.2.1 Note: ‘Inflow’ is determined from the high school location of the 2010 graduate cohort. ‘Outflow’ is determined by the location of graduate employment on 1 September 2012.The data excludes 13 962 graduates who did their secondary schooling in the Western Cape.

PATHWAYS FROM UNIVERSITY TO WORK: ABRIDGED OVERVIEW
24
BIBLIOgRAPHY
Ball SJ (2010) New class inequalities in education: Why education policy may be looking in the wrong place! Education policy, civil society and social class, International Journal of Sociology and Social Policy, 30(3/4): 155–166.
Bhorat H, Visser M and Mayet N (2010) Student graduation, labour market destinations and employment earnings. In: Letseka M, Cosser M, Brier M, & Visser M. Student Retention and Graduate Destination: Higher Education and Labour Market Access. Pretoria: Human Sciences Research Council.
Bhorat H, Mayet N and Visser M (2012) Student graduation, labour market destinations and employment earnings. Development Policy Research Unit Working Paper 12/153, University of Cape Town.
Brown P and Lauder H (2012) globalization, knowledge, and the myth of the magnet economy. In: Livingstone DL & guile D (eds) The Knowledge Economy and Lifelong Learning. London: Sense.
Cape Higher Education Consortium (CHEC) (2013) Pathways from University to Work: A graduate Destination Survey of the 2010 Cohort of graduates from the Western Cape: A Cape Higher Education Consortium (CHEC) Study, April 2013. Cape Town: CHEC.
graduate Careers (2009) Beyond Graduation 2009: The Report of the Beyond Graduation Survey. Melbourne: graduate Careers.
Letseka M, Cosser M, Brier M and Visser M (2010) Introduction. In: Letseka M, Cosser M, Brier M and Visser M (eds) Student Retention and Graduate Destination: Higher Education and Labour Market Access. Pretoria. Human Sciences Research Council.
Mugabushaka AM, Teichler U & Schomburg H (2003) Failed or Self-Hindering Prophecies? Employment Experiences of African graduates in the 1990s. Journal of Higher Education in Africa 1(1): 57–77.
Richter D (2009) graduating Student Survey Final Report. Department of Institutional Research and Planning, Cape Peninsula University of Technology.
ROA (2012) Maastricht University Graduate Surveys 2012. Research Centre for Education and the Labour Market (Research Centrum voor Onderwijs en Arbeidsmarkt – ROA), School of Business and Economics, Maastricht University, Netherlands.
Rodríguez A, Dahlman C and Salmi J (2008) Knowledge and Innovation for Competitiveness in Brazil. Washington DC: The International Bank for Reconstruction and Development/World Bank.
Schomburg H and Teichler U (2006) Higher Education and Graduate Employment in Europe: Results from Graduate Surveys from Twelve Countries. Higher Education Dynamics 15. Dordrecht: Springer.
Stellenbosch University (2003) Bestemmingsopname van Afstuderende Studente, Sentrum vir Studentevoorligting en Ontwikkeling. December 2002 and April 2003.
University of Cape Town (2009) December 2009 graduate Exit Survey: Findings. UCT Institutional Planning Office.

Pathways from university to work
A CApe HigHer eduCAtion Consortium (CHeC) study
This Graduate Destination Survey has generated an immensely important
new database for understanding how tertiary education relates to labour
market prospects. This report provides a first stab at analysing this data
and already brings to the fore some crucial insights. Further research on
this database should inform both labour market and education policies,
and it is of immediate use for university planning. CHEC’s initiative in
this regard should be greatly lauded and they should be encouraged to
undertake such tracer studies on a regular basis.
– Professor Servaas van den Berg, Professor of the Economics of Education,
Stellenbosch University
I think the methodology section is superb … The really important
consequence of this work is that it can alert the institutions to thinking
forward about complex issues.
– Professor Tim Dunne, Professor of the Statistics, University of Cape Town
5 560 responses from the total of 24 710 graduates can be seen as a
great success of the study. The response rate was 23% which is similar to
graduate surveys in Europe and Japan.
– Professor Harald Schomburg, International Centre for Higher Education Research,
University of Kassel
Pat
hw
ay
s fr
om
un
iver
sit
y t
o w
or
k
Cape Higher Education Consortium
CHEC
CA
pe
Hig
He
r e
du
CA
tio
n C
on
so
rt
ium
House Vincent, Wynberg Mews,
10 Ebenezer Road
Wynberg 7800
South Africa
Tel: +27 21 763 7100
Fax: +27 21 763 7117
www.chec.ac.za
“
A graduate destination survey of the 2010 Cohort of graduates from the Western Cape universitiesA graduate destination survey of the 2010 Cohort of graduates from the Western Cape universities