Embed Size (px)
Citation preview

Alma Mater Studiorum – Università di Bologna
DOTTORATO DI RICERCA
Biologia e fisiologia cellulare Ciclo XXIII
Settori scientifico-disciplinari di afferenza: BIO10, MED03
Pathogenetic mechanisms in mitochondrial optic
neuropathies
Presentata da: Alessandra Maresca
Coordinatore Dottorato Relatore
Prof.ssa Michela Rugolo Prof.ssa Michela Rugolo
Correlatore
Dott. Valerio Carelli
Esame finale anno 2011

Summary
Abstract ....................................................................................................................................... 4
Introduction ................................................................................................................................ 7
Mitochondria............................................................................................................................ 8
Mitochondrial structure........................................................................................................ 8
The oxidative phosphorylation ............................................................................................ 9
Reactive Oxygen Species (ROS) production..................................................................... 11
Mitochondrial pathways of apoptosis ................................................................................ 12
The mitochondrial genome ................................................................................................ 14
Mitochondrial biogenesis................................................................................................... 19
Mitochondrial network morphology and dynamics........................................................... 23
Mitochondrial disorders ......................................................................................................... 31
Inherited mitochondrial optic neuropathies ........................................................................... 34
Leber’s hereditary optic neuropathy (LHON) ................................................................... 34
Autosomal Dominant Optic Atrophy (ADOA).................................................................. 39
Aims........................................................................................................................................... 44
Materials and methods............................................................................................................ 47
Cell culture............................................................................................................................. 48
Transfection of HeLa cells..................................................................................................... 48
Mitochondrial network morphology ...................................................................................... 48
Mitochondrial membrane potential........................................................................................ 48
Apoptosis assay on fixed cells ............................................................................................... 49
Immunofluorescence on fixed cells or tissues ....................................................................... 49
Total cellular lysates preparation ........................................................................................... 49
Mitochondria isolation from cultures cells ............................................................................ 49
Coimmunoprecipitation (CoIP)............................................................................................. 50
SDS-PAGE and Immunoblotting........................................................................................... 50
Nucleic acid extraction........................................................................................................... 51
Identification of LHON common mutations.......................................................................... 51
Restriction fragment length polymorphism (RFLP) assay for nuclear genes polymorphisms52
Mitochondrial DNA copy number evaluation ....................................................................... 52
Reverse transcription and quantitative assay for gene expression......................................... 52
Statistical analysis .................................................................................................................. 52
Results....................................................................................................................................... 54

Part 1 – Modifying factors of penetrance in LHON .............................................................. 55
Molecular characterization of LHON mutations .............................................................. 55
Screening of polymorphisms in nuclear genes involved in the regulation of mitochondrial
biogenesis........................................................................................................................... 59
Screening of polymorphisms in nuclear genes involved in the antioxidant machinery..... 61
Part 2 – Elucidating the mitochondrial function of OPA3 and its role in ADOAC pathogenesis
................................................................................................................................................ 64
OPA3 isoforms expression in different mouse tissues and in Hela cells........................... 64
OPA3V1, OPA3V2 and OPA3V1-G93S over-expression in HeLa cells.......................... 65
OPA3 isoforms silencing in HeLa cells............................................................................. 70
Coimmunoprecipitation of OPA3V1 on isolated mitochondria from HEK cells .............. 74
Discussion.................................................................................................................................. 76
Part 1 – Modifying factors of penetrance in LHON .............................................................. 77
Mitochondrial DNA content as a biomarker to distinguish LHON affected individuals from
carriers................................................................................................................................ 77
Seven selected SNPs in nuclear regulators of mitochondrial biogenesis do not influence LHON
penetrance .......................................................................................................................... 78
Ala16Val variant in MnSOD modify the LHON penetrance ............................................ 80
Part 2 – Elucidating the mitochondrial function of OPA3 and its role in ADOAC pathogenesis
................................................................................................................................................ 83
OPA3 variants are ubiquitously expressed and OPA3V1 is the most abundant................ 83
OPA3 may be involved in the regulation of mitochondrial fission ................................... 83
OPA3 affects mitochondrial membrane potential.............................................................. 84
OPA3 increases sensitivity to apoptotic signals ................................................................ 84
OPA3 does not influence mtDNA content......................................................................... 85
OPA3 is not an interactor of OPA1, MFN2, POLG and cyt c........................................... 85
Conclusions............................................................................................................................... 86
References................................................................................................................................. 89
Appendix ................................................................................................................................. 111
Acknowledgements................................................................................................................. 115

Abstract

Leber’s hereditary optic neuropathy (LHON) and Autosomal Dominant Optic Atrophy (ADOA) are
the two most common inherited optic neuropathies and both are the result of mitochondrial
dysfunctions. Despite the primary mutations causing these disorders are different, being an mtDNA
mutation in subunits of complex I in LHON and defects in the nuclear gene encoding the
mitochondrial protein OPA1 in ADOA, both pathologies share some peculiar features, such a
variable penetrance and tissue-specificity of the pathological processes.
Probably, one of the most interesting and unclear aspect of LHON is the variable penetrance. This
phenomenon is common in LHON families, most of them being homoplasmic mutant. Inter-family
variability of penetrance may be caused by nuclear or mitochondrial ‘secondary’ genetic
determinants or other predisposing triggering factors.
We identified a compensatory mechanism in LHON patients, able to distinguish affected
individuals from unaffected mutation carriers. In fact, carrier individuals resulted more efficient
than affected subjects in increasing the mitochondrial biogenesis to compensate for the energetic
defect. Thus, the activation of the mitochondrial biogenesis may be a crucial factor in modulating
penetrance, determining the fate of subjects harbouring LHON mutations. Furthermore, mtDNA
content can be used as a molecular biomarker which, for the first time, clearly differentiates LHON
affected from LHON carrier individuals, providing a valid mechanism that may be exploited for
development of therapeutic strategies. Although the mitochondrial biogenesis gained a relevant role
in LHON pathogenesis, we failed to identify a genetic modifying factor for the variable penetrance
in a set of candidate genes involved in the regulation of this process. A more systematic high-
throughput approach will be necessary to select the genetic variants responsible for the different
efficiency in activating mitochondrial biogenesis. A genetic modifying factor was instead identified
in the MnSOD gene. The SNP Ala16Val in this gene seems to modulate LHON penetrance, since
the Ala allele in this position significantly predisposes to be affected. Thus, we propose that high
MnSOD activity in mitochondria of LHON subjects may produce an overload of H2O2 for the
antioxidant machinery, leading to release from mitochondria of this radical and promoting a severe
cell damage and death
ADOA is due to mutation in the OPA1 gene in the large majority of cases. The causative nuclear
defects in the remaining families with DOA have not been identified yet, but a small number of
families have been mapped to other chromosomal loci (OPA3, OPA4, OPA5, OPA7, OPA8).
Recently, a form of DOA and premature cataract (ADOAC) has been associated to pathogenic
mutations of the OPA3 gene, encoding a mitochondrial protein. In the last year OPA3 has been
investigated by two different groups, but a clear function for this protein and the pathogenic
mechanism leading to ADOAC are still unclear.

Our study on OPA3 provides new information about the pattern of expression of the two isoforms
OPA3V1 and OPA3V2, and, moreover, suggests that OPA3 may have a different function in
mitochondria from OPA1, the major site for ADOA mutations. In fact, based on our results, we
propose that OPA3 is not involved in the mitochondrial fusion process, but, on the contrary, it may
regulate mitochondrial fission. Furthermore, at difference from OPA1, we excluded a role for OPA3
in mtDNA maintenance and we failed to identify a direct interaction between OPA3 and OPA1.
Considering the results from overexpression and silencing of OPA3, we can conclude that the
overexpression has more drastic consequences on the cells than silencing, suggesting that OPA3
may cause optic atrophy via a gain-of-function mechanism. These data provide a new starting point
for future investigations aimed at identifying the exact function of OPA3 and the pathogenic
mechanism causing ADOAC.

Introduction

Mitochondria
Mitochondria are key organelles in life and death of eukaryotic cells, since they are the main
players in many cellular processes such as energy production, apoptosis, reactive species of oxygen
(ROS) production, thermogenesis and calcium homeostasis.
According to the endosymbiontic theory, these organelles originated from aerobic bacteria,
incorporated into an eukaryotic cell ancestor and maintained during the evolution (Margulis, 1975).
Mitochondria are the only cytoplasmic organelles containing their own DNA, in multiple copies,
which encodes a small number of proteins, essential for functioning of oxidative phosphorylation
(OXPHOS) (Anderson et al., 1981).
In the last 20 years several human disorders including neurodegenerative diseases, cancer and
diabetes, have been shown to be due to mitochondrial dysfunctions. Furthermore, the mitochondrial
dysfunction may be involved also in the natural process of aging (DiMauro and Schon, 2003;
Wallace, 2005).
Mitochondrial structure
Mitochondria are double-membrane organelles. This complex double membrane system is
composed by the outer membrane (OM) and the inner membrane (IM), which separates the inner
membrane space (IMS) from the matrix space. The OM is highly permeable, containing many pores
for small molecules transit, whereas the IM is impermeable to most small molecules and ions, being
responsible for the maintenance of the electrochemical gradient between the matrix and the IMS
(Nicholls 2002 ???). The IM is organized in different compartments, the peripheral inner membrane
and lamellar double-membrane interdigitations called cristae . These compartments are joined by a
limited number of discrete sites called cristae junctions (Frey and Mannella, 2000; Perkins et al.,
2001) (Fig. 1). Since the IM is the site of OXPHOS, the morphology of cristae and cristae junctions
can have profound implications in the rate of ATP production (Perotti et al., 1983; D’Herde et al.,
2001). Moreover, the number and shape of these structures can also limit the diffusion of
cytochrome c by compartmentalization and consequently regulate the propensity to cell death
(Bernardi and Azzone, 1981; Scorrano, 2002).

Figure 1 - Mitochondrial ultrastructure (Westermann, Nat Rev Moll Cell Bio 2010) The schematic shows the structure of mitochondria. A transmission electron microscopy image of mitochondria in ultrathin sections of human fibroblast cells is also shown. The oxidative phosphorylation
Mitochondria are commonly referred as “the energy powerhouse” of the cell, since they produce
most of the energy required from the cell in the form of ATP. In fact, they are the site of the
electron transport chain and the OXPHOS system and through this they oxidizes hydrogen derived
from our dietary carbohydrates (TCA cycle) and fats (β-oxidation) with oxygen to generate heat and
ATP.
The OXPHOS system is composed of five multimeric enzymatic complexes (I-V) and consists of
approximately 90 subunits, 13 encoded by the mitochondrial DNA (mtDNA). All the complexes are
integrated in the lipid bilayer of the mitochondrial IM and together with two mobile electron
carriers, ubiquinone (CoQ) and cytochrome c (cyt c), they make up the electron transport chain
(Fig. 2) . The electron transport is coupled to the generation of a proton gradient across the IM,
which is used by Complex V to synthesize ATP from ADP and inorganic phosphate (Saraste 1999).
Complex I (NADH dehydrogenase) is the largest of the respiratory complexes and is composed
approximately of 45 subunits, 7 encoded by mtDNA (Carroll et al., 2002). The enzyme transfers
electrons from nicotinamide adenine dinucleotide (NADH) to CoQ generating ubiquinol (CoQH2),
with the simultaneous translocation of four protons across the IM into the inner membrane space
(Nicholls and Ferguson, 2002).
Complex II (succinate dehydrogenase) is the only respiratory enzyme completely encoded by
nuclear DNA (nDNA) and it is composed of 4 subunits. Complex II is an alternative source of
CoQH2, which is produced by the electrons transfer from flavin adenine dinucleotide (FADH2) to

CoQ (Rustin et al., 2002). A third further source that transfers electrons to CoQ to generate
ubiquinol is glycerol 3-phosphate dehydrogenase.
Complex III (ubiquinol cytochrome c oxidoreductase) has only one mtDNA-encoded subunit,
cytochrome b and 10 nDNA-encoded subunits (Berry et al., 2000).
This complex transfers two electrons from CoQH2 to cyt c, which then shuttles the electrons to
Complex IV (cytochrome c oxidase, COX). Complex III couples electron transfer to the
translocation of two protons across the IM.
Complex IV is the terminal component of the respiratory chain, composed of 13 subunits, three of
them encoded by mtDNA. Through Complex IV four electrons are transferred to two molecules of
oxygen, the final acceptor, producing water. During this reaction four protons are translocated from
the matrix side to the inner membrane space (Schultz and Chan, 2001). The electrochemical
gradient, due to the flow of the electrons through the respiratory chain, is finally used by Complex
V (ATP synthase) to generate ATP (Mitchell, 1961 ).
Figure 2 – Mitochondrial respiratory chain (Bellance et al., Front. Biosc. 2009)
Complex V is composed of a membrane-bound portion (F0) and a large extra-membranous portion
(F1), exposed to the matrix space. Of 17 subunits, only two subunits of this complex are encoded by
the mtDNA and they take part to the F0 (Abrahams et al., 1994). The ATP synthesized is exported
across the inner mitochondrial membrane by an exchange mechanism, importing cytosolic ADP by
the adenine nucleotide translocator (ANT).

Reactive Oxygen Species (ROS) production
Mitochondria are the major source of ROS under normal physiological conditions, with superoxide
radicals being the primary ROS produced by these organelles. Complex I and complex III are the
major superoxide (O2.-)-producing sites in mitochondria (Lenaz, 1998). The O2
.- is rapidly
converted into hydrogen peroxide (H2O2) by manganese superoxide dismutase (MnSOD) and is
further metabolized by glutathione peroxidise (GPX) to H2O. In the presence of transition metals,
the H2O2 can also form the hydroxyl radical (OH.) through the Fenton reaction. Moreover, O2.- may
produce peroxynitrite (ONOO.) reacting with nitric oxide (NO.).
ROS play an important role in regulating several cellular processes, including apoptosis and
immune response, and act as second messengers in cellular signaling. ROS affect these normal
cellular functions by altering the activities of various tyrosine and serine/threonine kinases, mitogen
activated protein kinases, and transcription factors (Halliwell and Gutteridge, 1992; Rhee, 2006).
Oxidative damage to DNA causes potentially mutagenic modifications, possibly contributing to
cancer, premature ageing and neurodegenerative diseases. In particular, due to the peculiar
structure, mtDNA is very susceptible to ROS attack and the oxidative damage is much higher than
that in the nuclear DNA. Therefore, ROS induced damage is the principal cause of mitochondrial
genomic instability leading to respiratory dysfunctions (Bohr, 2002).
Excessive ROS production may cause local damage to the Fe-S clusters of respiratory enzymes
(complexes I, II and III), as well as to tricarboxylic acid cycle enzymes (aconitase). Moreover,
peroxynitrite can nitrate tyrosine residues or thiolic groups of nearby proteins and both complex I
and MnSOD have been reported to be damaged by this process (Rotig et al., 1997; Melov et al.,
1999). Oxidized proteins are recognized by proteases and degraded.
Lastly, another important damaging process is lipid peroxidation; this affects vital mitochondrial
functions, such as respiration and oxidative phosphorylation, inner membrane barrier properties,
maintenance of mitochondrial membrane potential (∆ψm), and mitochondrial Ca2+ buffering
capacity (Zhang et al., 1990; Albano et al., 1991; Bacon et al., 1993). In particular, cardiolipin
(CL), a phospholipid located at the level of the IMM and known to be involved in mitochondrial-
dependent apoptosis and mitochondrial stability and dynamics (Perier et al., 2005; Ban et al., 2010;
Paradies et al., 2010), is particularly prone to peroxidative attack by ROS. CL peroxidation has
been shown to play a critical role in several physio-pathological situations (Paradies et al., 2010).
Many enzyme systems exist in the cell to detoxify ROS. Superoxide dismutases (SODs) are the
primary ROS scavenging enzymes of the cell and catalyze the dismutation of superoxide radicals to
hydrogen peroxide and molecular oxygen. Three forms of SOD, encoded by different genes, exist in
cells. Homodimeric copper- and zinc-containing SOD (CuZnSOD, SOD1) is localized primarily in

the cytoplasm, but a portion of it is also found in mitochondria, concentrated in the IMS (Kawamata
and Manfredi, 2010). Extracellular SOD (ECSOD, SOD3), which shares 40–60% amino acid
homology with CuZnSOD and has copper and zinc in its active site, is found in the extracellular
region of the cell. Manganese-containing SOD (MnSOD, SOD2) is a homotetramer located in the
mitochondrial matrix (Holley at al., 2010).
Mitochondria use two major enzyme systems to decompose hydrogen peroxide into water and
molecular oxygen. Glutathione peroxidase (GPx) exists in two forms in mitochondria: GPX1 and
phospholipid-hydroperoxide GPX (PHGPx). GPX1 is localized mainly in the mitochondrial matrix,
whereas PHGPx is found primarily in the inner membrane of mitochondria. These enzymes use
reduced glutathione (GSH) to reduce hydrogen peroxide to water with simultaneous formation of
glutathione disulfide (GSSG).
The inactivation of hydrogen peroxide through the production of water and molecular oxygen is
also catalyzed by catalase (CAT), an enzyme located in peroxisomes or in cytoplasm (Forsberg et
al., 2001a).
Peroxiredoxin (PRX) also detoxifies hydrogen peroxide to water using thioredoxin as a reducing
agent. Two forms of PRX are found in mitochondria (PRX III and PRX V), and both reside in the
mitochondrial matrix (Holley at al., 2010).
Mitochondrial pathways of apoptosis
Apoptosis is a form of programmed cell death essential for homeostasis, which is frequently
dysregulated in human pathologies such as cancer, neudegenaritive diseases or viral infections
(Meier et al., 2000; Vaux and Korsmeyer, 1999). The defining morphological characteristics of
apoptosis include cell shrinkage, nuclear fragmentation, chromatin condensation and membrane
blebbing, all of which are due to the proteolytic activity of the caspase proteases. Caspases
orchestrate apoptosis through the cleavage of numerous proteins, ultimately leading to the
phagocytosis of the apoptotic cell, without any release of cytoplasmic content into the extracellular
matrix or inflammatory response induction (Kerr et al., 1972; Taylor et al., 2008).
In eukaryotic cells, two major pathways of apoptosis are distinguished. The “extrinsic” pathway is
triggered by the activation of death receptors of the TNF/Fas family, whereas the “intrinsic”
pathway involves mitochondria and is activated by many stimuli as cytotoxic stress, DNA damage
and growth factor deprivation (Jourdain and Martinou, 2009). The mitochondrial pathway is a
complex signalling cascade, regulated by the Bcl-2 family proteins, which needs the release of
apoptogenic factors from mitochondria to switch on the caspase activation.

The intrinsic pathway can be divided in three well defined phases: induction, mitochondrial and
execution phases.
During the induction phase external and internal stimuli activate different signalling pathways an
this signal is transduced to mitochondria by Bcl-2 family proteins. This family includes more than
30 members, which share a high degree of homology although they have different functions, being
either pro-apoptotic or anti-apoptotic (Jourdain and Martinou, 2009). Anti-apoptotic proteins have
usually four Bcl-2 homology (BH) domains (Bcl-2, Bcl-xL, Bcl-W and Mcl-1), whereas pro-
apoptotic proteins display either three BH domains (BH1,2,3 : Bax and Bak) or only one (BH3-
only: Bid, Bad, Bim, Noxa and Puma), corresponding to the most numerous proteins (Adams and
Cory, 1998; Kroemer et al., 2007; Youle and Strasser, 2008).
The second apoptotic step is characterized by an alteration of the OM and a release of apoptogenic
factors in the cytosol. This process is still debated and currently there are at least two hypothesis put
forward to explain this phenomenon, involving two different channels. These channels are the
permeability transition pore (PTP) in the IM and the mitochondrial apoptosis-induced channel
(MAC) in the OM. Whatever is the mechanism of the mitochondrial permeabilization, the final
result is the release of apoptogenic factors (cytochrome c, AIF, endonuclease G, Smac/DIABLO
and Omi/HtrA2) (Eskes et al., 2000; Suzuki et al., 2000; van Gurp et al., 2003; Zamzami and
Kroemer, 2001) (Fig. 3).
The last step in apoptosis is the executive phase and the major players are specific proteases called
caspases (cysteine aspartyl-specific proteases) that cleave their substrates at aspartic acid (Asp)
residues (Thornberry et al., 1998; Cryns and Yuan, 1999). This family of intracellular proteases is
composed in humans at least of 12 members, even if not all directly involved in apoptosis, sharing
an high sequence homology and substrates specificity. Caspases are produced as inactive zymogens
with three domains: a regulatory N-term, and two highly conserved catalytic domains. They can be
activated by proteolytic cleavage at conserved Asp residues and can cooperate in proteolytic
cascades, where caspases activate themselves and each other, and finally cleave their substrates.
Caspases have as substrates several proteins with structural and enzymatic functions that need to be
cleaved to continue and conclude the apoptotic process (Taylor et al., 2008).

Figure 3 – Apoptogenic factors released from mitochondria during apoptosis. (Vila and Przedborski, Nat Rev
Neurosci., 2003)
The mitochondrial genome
Human mtDNA is a double-stranded, circular molecule of 16569 bp, present in multiple copies
within the cell. The two strands of mtDNA, based on their nucleotide composition, can be separated
in a cesium chloride gradient and are therefore called the “heavy strand” (H-strand), rich in guanine,
and the “light strand” (L-strand), rich in cytosine (Fernández-Silva et al., 2003). The mtDNA
sequence is completely elucidated and contains 37 genes: 13 genes encoding for subunits of the
respiratory chain, 22 tRNA and 2 rRNA necessary for translation of these proteins (Anderson et al.,
1981) (Fig. 4).

Figure 4 - The mitochondrial genome (Strachan and Read, Human Molecular Genetics, 2nd edition, 1999).
In spite of the nuclear genome, the mtDNA has no repetitive sequences, introns or intergenic
regions. Only two non-coding regions exist in this genome, and they contain most of the known
regulatory functions. The major one is the D-loop (displacement loop), characterized by the
presence of a triple strand structure due to the association of the new H- strand in this region
(Fernández-Silva et al., 2003). The D-loop contains the origin of H-strand DNA replication (OH)
and is also the site of transcription from opposing heavy and light strand promoters (Clayton, 2000;
Scarpulla, 2008). The second non-coding region is located in a cluster of five tRNA genes around
two thirds of the mtDNA length from the OH (Anderson et al., 1981; Fernández-Silva et al., 2003).
Within mitochondria, the mtDNA molecules are packaged in DNA-protein complexes called
nucleoids (Legros et al., 2004; Wang and Bogenhagen, 2006), which provide a submitochondrial
organization of mtDNA, allowing for efficient maintenance of mtDNA in discrete segregating units
(Gilkerson, 2009).
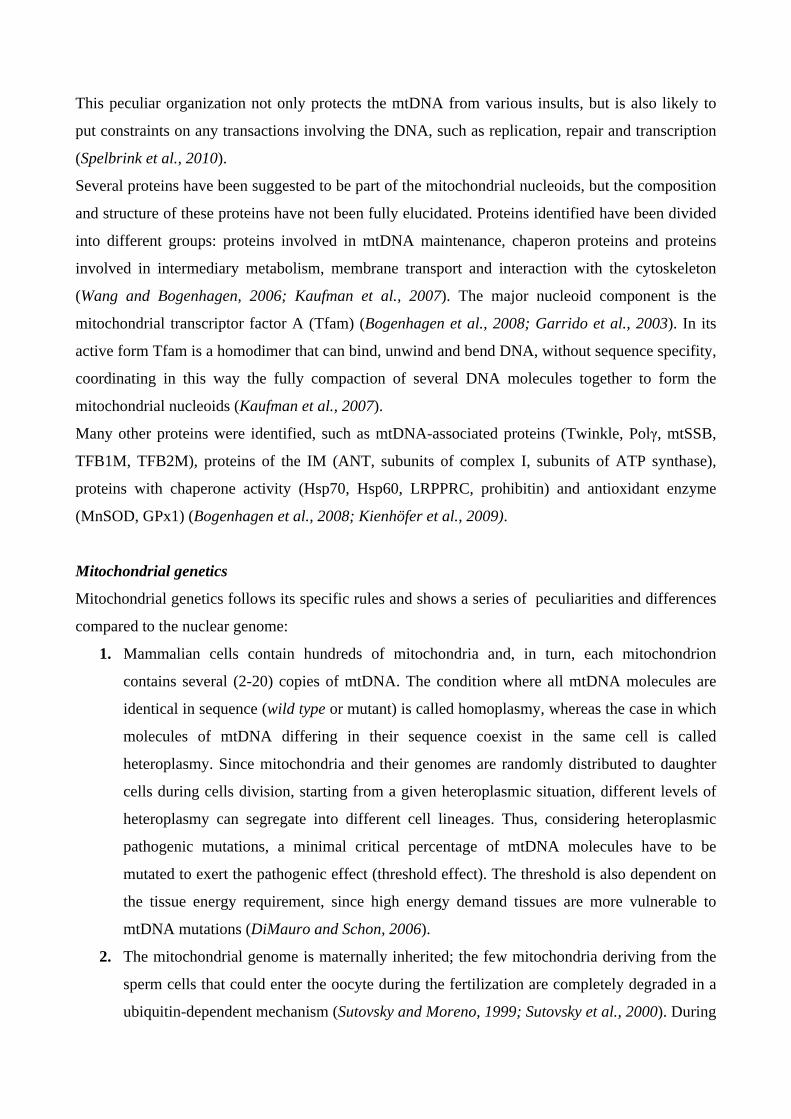
This peculiar organization not only protects the mtDNA from various insults, but is also likely to
put constraints on any transactions involving the DNA, such as replication, repair and transcription
(Spelbrink et al., 2010).
Several proteins have been suggested to be part of the mitochondrial nucleoids, but the composition
and structure of these proteins have not been fully elucidated. Proteins identified have been divided
into different groups: proteins involved in mtDNA maintenance, chaperon proteins and proteins
involved in intermediary metabolism, membrane transport and interaction with the cytoskeleton
(Wang and Bogenhagen, 2006; Kaufman et al., 2007). The major nucleoid component is the
mitochondrial transcriptor factor A (Tfam) (Bogenhagen et al., 2008; Garrido et al., 2003). In its
active form Tfam is a homodimer that can bind, unwind and bend DNA, without sequence specifity,
coordinating in this way the fully compaction of several DNA molecules together to form the
mitochondrial nucleoids (Kaufman et al., 2007).
Many other proteins were identified, such as mtDNA-associated proteins (Twinkle, Polγ, mtSSB,
TFB1M, TFB2M), proteins of the IM (ANT, subunits of complex I, subunits of ATP synthase),
proteins with chaperone activity (Hsp70, Hsp60, LRPPRC, prohibitin) and antioxidant enzyme
(MnSOD, GPx1) (Bogenhagen et al., 2008; Kienhöfer et al., 2009).
Mitochondrial genetics
Mitochondrial genetics follows its specific rules and shows a series of peculiarities and differences
compared to the nuclear genome:
1. Mammalian cells contain hundreds of mitochondria and, in turn, each mitochondrion
contains several (2-20) copies of mtDNA. The condition where all mtDNA molecules are
identical in sequence (wild type or mutant) is called homoplasmy, whereas the case in which
molecules of mtDNA differing in their sequence coexist in the same cell is called
heteroplasmy. Since mitochondria and their genomes are randomly distributed to daughter
cells during cells division, starting from a given heteroplasmic situation, different levels of
heteroplasmy can segregate into different cell lineages. Thus, considering heteroplasmic
pathogenic mutations, a minimal critical percentage of mtDNA molecules have to be
mutated to exert the pathogenic effect (threshold effect). The threshold is also dependent on
the tissue energy requirement, since high energy demand tissues are more vulnerable to
mtDNA mutations (DiMauro and Schon, 2006).
2. The mitochondrial genome is maternally inherited; the few mitochondria deriving from the
sperm cells that could enter the oocyte during the fertilization are completely degraded in a
ubiquitin-dependent mechanism (Sutovsky and Moreno, 1999; Sutovsky et al., 2000). During

the oogenesis only a small subset of mtDNA molecules are amplified and transmitted to the
offspring; this phenomenon is known as “bottleneck” and can explain the rapid shift of some
heteroplasmic mutation to homoplasmy in few generations (Marchington et al., 1998).
3. The evolution rate of mtDNA is much faster than that of the nuclear DNA (Brown et al.,
1979). This high mutation rate and the maternal inheritance have made the study of mtDNA
sequence interesting for human population genetics and evolutionary studies (Stoneking,
1994). A great number of mtDNA variants have been fixed and accumulated characterizing
different maternal lineages. The mitochondrial haplogroup is defined by different clusters of
population-specific polymorphisms, present both in coding and control regions. The
mitochondrial haplogroups usually tend to be restricted to particular geographic areas and
populations. The most of European population (95%) belongs to haplogroup H, I, J, K, M,
T, U, V, W or X (Torroni et al., 1996). The mitochondrial haplogroups have been often
investigated for the possible association with multifactorial disease and aging, based on the
assumption that any non-synonymous variant may have functional relevance.
4. Mitochondrial genes are translated using a specific genetic code, different from the universal
genetic code. Thus, in mammals, UGA specifies tryptophan instead of a termination codon,
AUA, AUC and AUU are used as translation and integration initiation codons and AGA and
AGG are termination codons instead of encoding arginine. In addition, a simplified codon–
anticodon pairing system allows translation to proceed with only 22 tRNAs (Attardi and
Schatz, 1988).
Mitochondrial DNA replication, transcription and translation
Mitochondrial DNA replication takes place in the mitochondrial matrix and, differing from nuclear
DNA replication, is independent from cell cycle (relaxed replication) and some mtDNA molecules
are preferentially replicated while others do not replicate at all (Clayton, 2003). Mitochondrial
genome copy number per cell is kept at a relatively constant level in a proliferating cell culture for a
given cell type; however, depending on the tissue/cell-type, mtDNA copy number has been shown
to vary, with highest levels being present in the most energy demanding tissues such as muscle,
liver, brain and pancreatic islets and in the ovum (Moraes, 2001; Shoubridge, 2000; Mao and Holt,
2009).
The mtDNA replication system requires at least three proteins: the polymerase γ (POLγ), the
helicase TWINKLE and the mitochondrial single-stranded DNA-binding protein (mtSSB). These
three proteins together form a processive replisome, able to replicate the entire mtDNA (Falkenberg
and Larsson, 2007). POLγ is an RNA dependent DNA polymerase and in human is a heterotrimer
composed by a catalytic subunit (POLγA, 140kDa), with polymerase, 3’-5’exonuclease, and 5’-
deoxyribose phosphate lyase activities, and two smaller accessory subunits (POLγB, 55kDa), able
to increase the catalytic activity of POLγA (Gray and Wong, 1992; Pinz and Bogenhagen, 1998;
Kaguni, 2004; Pinz and Bogenhagen, 2000).
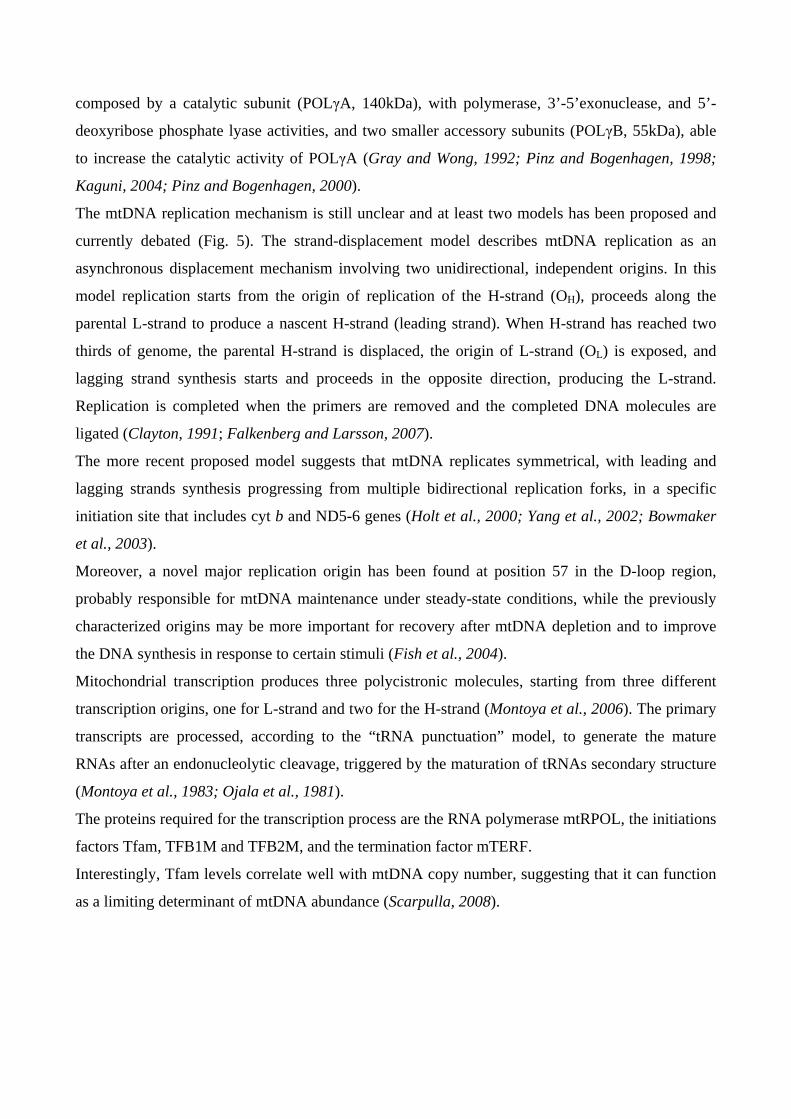
The mtDNA replication mechanism is still unclear and at least two models has been proposed and
currently debated (Fig. 5). The strand-displacement model describes mtDNA replication as an
asynchronous displacement mechanism involving two unidirectional, independent origins. In this
model replication starts from the origin of replication of the H-strand (OH), proceeds along the
parental L-strand to produce a nascent H-strand (leading strand). When H-strand has reached two
thirds of genome, the parental H-strand is displaced, the origin of L-strand (OL) is exposed, and
lagging strand synthesis starts and proceeds in the opposite direction, producing the L-strand.
Replication is completed when the primers are removed and the completed DNA molecules are
ligated (Clayton, 1991; Falkenberg and Larsson, 2007).
The more recent proposed model suggests that mtDNA replicates symmetrical, with leading and
lagging strands synthesis progressing from multiple bidirectional replication forks, in a specific
initiation site that includes cyt b and ND5-6 genes (Holt et al., 2000; Yang et al., 2002; Bowmaker
et al., 2003).
Moreover, a novel major replication origin has been found at position 57 in the D-loop region,
probably responsible for mtDNA maintenance under steady-state conditions, while the previously
characterized origins may be more important for recovery after mtDNA depletion and to improve
the DNA synthesis in response to certain stimuli (Fish et al., 2004).
Mitochondrial transcription produces three polycistronic molecules, starting from three different
transcription origins, one for L-strand and two for the H-strand (Montoya et al., 2006). The primary
transcripts are processed, according to the “tRNA punctuation” model, to generate the mature
RNAs after an endonucleolytic cleavage, triggered by the maturation of tRNAs secondary structure
(Montoya et al., 1983; Ojala et al., 1981).
The proteins required for the transcription process are the RNA polymerase mtRPOL, the initiations
factors Tfam, TFB1M and TFB2M, and the termination factor mTERF.
Interestingly, Tfam levels correlate well with mtDNA copy number, suggesting that it can function
as a limiting determinant of mtDNA abundance (Scarpulla, 2008).

Figure 5 – The two models for mtDNA replication (DNA Replication and Human Disease 2006, Cold Spring Harbor Laboratory Press)
The mitochondrial mRNAs are translated in the matrix with a specific translational machinery, the
mitoribosomes, and using the mitochondrial genetic code. The mitoribosomes are composed by two
mitochondrial rRNAs (12s and 16s) and nuclear encoded proteins (Fernández-Silva et al., 2003).
Mitochondrial biogenesis
Mitochondrial biogenesis is a complex process involving the coordinated expression of both nuclear
and mitochondrial genes. Since the protein coding capacity of mtDNA is restricted to the expression
of 13 respiratory subunits, nuclear genes play a predominant role in the biosynthesis of the
respiratory chain and in the expression of the mitochondrial genome. Although the complete
pathways controlling mitochondrial biogenesis has not been elucidated, in the last few years our

understanding about this process is much improved. The expression of mitochondrial proteins
encoded by nuclear genome participating in oxidative phosphorylation, heme biosynthesis,
mitochondrial protein import, and mtDNA transcription and replication, is regulated by
transcription factors and transcriptional coactivators (Diaz and Moraes, 2008; Scarpulla, 2006).
The most important transcription factors involved in the mitochondrial-nucleus communication are
the nuclear respiratory factors 1 and 2 (NRF-1, NRF-2) (Virbasius et al., 1993) and the estrogen-
related receptor (ERRα) that cooperate with the transcriptional coactivators belonging to the
peroxisome proliferator-activated receptor γ-coactivator 1 (PGC-1) family (PGC-1α, PGC-1β, PRC)
(Scarpulla, 2002).
The PGC-1 coactivators family
This family is composed by three members sharing a sequence homology and regulating several
metabolic pathways such as cellular respiration, thermogenesis and hepatic glucose metabolism
(Scarpulla, 2006; Kelly and Scarpulla 2004). Although all these factors can stimulate mitochondrial
biogenesis, PGC-1α is mainly involved in the regulation of gluconeogenesis and PGC-1β in the
regulation of β-oxidation of fatty acids, and PRC in the coordination of nuclear and mtDNA
replication during the cell cycle progression (Lin et al., 2003; Ling et al., 2004; Diaz and Moraes,
2008).
The three proteins show conserved domains with well characterized features, such as a
transcriptional activation domain with the major nuclear hormone receptor-interacting (LXXLL) in
the N-terminus and an RNA-binding motif, able to enhance the RNA splicing, and a serine-
arginine-rich (RS) domain in the C-terminus (Fig. 6).
PGC-1α exhibits a tissue-enriched expression pattern and is highly inducible. This coactivator is
enriched in tissues with high-capacity mitochondrial system, as brown fat, heart, oxidative skeletal
muscle fibres; moreover PGC-1α is rapidly induced by cold exposure, short-term exercise and
fasting, conditions known to increase the demand of ATP and heat from mitochondria. All these
observations suggest a prominent role of PGC-1α in the physiologic control of mitochondrial
function (Kelly and Scarpulla, 2004).

Figure 6 - Schematic representation of the primary structures of PGC-1α, PRC, and PGC-1β (Kelly and Scarpulla, Genes Dev. 2004)
In the last few years several lines of evidence proved the key role of PGC-1α in regulating
mitochondrial biogenesis in mammals: the activation of mitochondrial uncoupling protein-1 (UCP-
1) (Puigserver et al., 1998), the induced expression of NRF-1, NRF-2, Tfam (Wu et al., 1999) and
the mitochondrial proliferation in skeletal muscle accompanied by the switch in fibre type
composition (from glycolytic type to oxidative type) in transgenic mice overexpressing PGC-1α (
Lin et al., 2002b).
Multiple PGC-1α targets have now been identified such as PPARα (Vega et al., 2000), thyroid
hormone receptor, retinoid receptors, glucocorticoid receptors, estrogen receptor, estrogen-related
receptors (ERRs) and several non-nuclear partners including myocyte-enhancing factor 2 (MEF-2)
and FOX-01 (Kelly and Scarpulla, 2004).
PGC-1α gene expression can be modulated by several pathways in response to different stimuli
(Fig. 7):
• In adipocyte, in response to cold exposure, β-adrenergic receptors are activated. This causes
the signal transduction via protein G and adenylate cyclise, associated with an increase of
cAMP concentration. The subsequently PKA (Protein kinase A) activation induces the
phosphorylation of CREB or ATF2 (Activating Transcription Factor 2) and PGC-1α
transcription.

• During fasting, the activation of CREB and subsequent PGC-1α increase can induce the
gluconeogenetic pathway in mouse liver (Yoon et al., 2001).
• Prolonged exercise in vivo or an increase of Ca2+ levels in myotubes can promote a strong
activation of PGC-1α by activation of AMPK (AMP-activated protein kinase) and CaMK
(calcium/calmodulin-dependent protein kinase). MEF-2 induction via calcineurin A is also
involved in PGC-1α activation in skeletal muscle (Zong et al., 2002; Handschin et al.,
2003).
• Nitric oxide (NO) generation can also activate PGC-1α transcription through the pathway of
cGMP signaling (Nisoli et al., 2003; Nisoli and Carruba, 2006).
Figure 7 – Different signaling pathways regulated by PGC-1α (Scarpulla, Physiol. Rev. 2008).
PGC-1α can be stabilized through phosphorylation in three sites (Thr262, Ser265, Thr298) by p38
mitogen-activated protein kinase (p38 MAPK) (Puigserver et al., 2001) and repressed by
interaction with p160 myb-binding protein (Fan et al., 2004); lastly, it can be activated through
deacetylation operated by Sirt1 (Rodgers et al., 2005).
PRC (PGC-1-related coactivator) was the first PGC-1α relative identified through a database search.
PRC has several domains homologous to PGC-1α (Fig. 6) and functional studies indicated that it is
able to regulate mitochondrial function in a manner similar to PGC-1α. PRC interacts directly with
NRF-1, promoting its activation, and furthermore it can activates the transcription of cyt c, a NRF-1

target, through the cooperation with others factors including CREB. Although PRC shares similar
features with PGC-1α, it presents also some differences: it is ubiquitously expressed, is only slightly
induced in response to cold exposure and is cell-cycle-regulated (Andersson and Scarpulla, 2001).
The third member of the family, PGC-1β, was also identified through database searching and it
shows a greater degree of homology to PGC-1α than PRC (Fig. 6). The expression pattern of PGC-
1β is very similar to that of PGC-1α, being enriched in heart and brown adipose tissue. This
coactivator is induced by fasting, but not in response to cold exposure and is able to coordinate
mitochondrial biogenesis inducing NRF-1 target genes (Kressler et al., 2002; Lin et al., 2002a).
Nuclear respiratory factors (NRF-1 and NRF-2)
NRF-1 is a transcription factor that recognizes directly a palindromic sequence (5’-
YGCGCAYGCGCR-3’) in the promoter of several nuclear encoded mitochondrial genes (Chau et
al., 1992; Evans and Scarpulla, 1990). This transcription factor binds the recognition site as an
homodimer and is a protein of 503 amino acids, with a N-terminal Ser-phosphorylation domain, a
central DNA binding domain and a C-terminal transactivation domain (Scarpulla, 2008).
NRF-1 has been associated with the expression of many genes required for mitochondrial
respiratory function, including the vast majority of nuclear genes that encode subunits of the five
OXPHOS complexes. Moreover, there are several evidences supporting the idea that NRF-1 could
be an integrative factor that coordinates respiratory subunit expression with the mitochondrial
transcriptional machinery. NRF-1 binds and activates not only the promoters of Tfam and TFB, but
also genes of the respiratory chain complexes, heme biosynthesis, and mitochondrial
transmembrane transporters (Scarpulla, 2008).
Human NRF-2 is composed of five subunits, a DNA-binding α subunit and four others accessory
subunits (β1, β2, γ1 and γ2) that form a complex with α subunit do not bind DNA alone. All the
accessory subunits contain a transcriptional activation domain. NRF-2 binding sites contain the
GGAA core motif, found in many mitochondrial genes promoters, such as all 10 nuclear encoded
cytochrome oxidase subunits, Tfam, the two isoforms of TFB and three subunits of SDH
(Scarpulla, 2008; Larsson et al., 1998; Rantanen et al., 2001; Falkenberg et al., 2002).
Mitochondrial network morphology and dynamics
Mitochondria are dynamic organelles able to change number and shape in living cells during
development, mitosis, and in response to physiological or toxic conditions (Johnson and Asbury,
1980; Catlett and Weisman, 2000; Malka et al., 2005). In many eukaryotic cell types, mitochondria

continuously move along cytoskeletal tracks and frequently fuse and divide. The antagonistic and
balanced activities of the fusion and fission machineries shape the mitochondrial compartment,
allowing the cell to respond to its ever-changing physiological conditions (Westermann, 2010).
A shift toward fusion enables the cell to build an extended and interconnected mitochondrial
network, whereas a shift toward fission generates many distinct organelles (Fig. 8). The large
mitochondrial network generated by fusion is beneficial in metabolically active cells, in which it
avoids the dissipation of energy (Skulachev, 2001). Furthermore, the connectivity of the
mitochondrial network is an important factor that determines the cellular response to calcium
signals (Szabadkai et al., 2006), and fusion of mitochondria is an essential step in certain
developmental processes such as embryonic development (Chen et al., 2003) and spermatogenesis
(Hales and Fuller, 1997). Loss of fusion has been linked to reduced respiratory activity, embryonic
lethality, apoptosis and neurodegeneration (Okamoto and Shaw, 2005; Detmer and Chan, 2007;
Suen et al., 2008).
Moreover fusion is postulated to promote a protective biological function by allowing the exchange
of mitochondrial contents, an activity that is thought to be a defence mechanism against aging
(Chen and Chan, 2006; Chan, 2007).
In quiescent cells mitochondria are usually present like numerous small spheres or short rods
(Collins et al., 2002). Mitochondrial fission also plays a key role in cell life and death. Since growth
and division of pre-existing organelles propagate mitochondria, mitochondrial inheritance depends
on mitochondrial fission during cytokinesis. The mitochondrial fission machinery actively
participates in the programmed cell death pathway (apoptosis) by inducing fragmentation of the
mitochondrial network before the release of cyt c and caspase activation (Youle and Karbowski,
2008).

Figure 8 – Mitochondrial network morphology. (Chen and Chan, Hum. Molec. Gen., 2005) Wild-type (Wt) mouse fibroblasts have tubular mitochondria. Inhibition of fusion (left panels) by deletion of both Mfn1 and Mfn2 (Mfn null) or knock-down of OPA1 (OPA1-RNAi) causes mitochondrial fragmentation. Inhibition of fission (right panels) by knock-down of Drp1 (Drp–RNAi) causes excessively elongated and interconnected mitochondria that often collapse into perinuclear aggregates (bottom right). Furthermore, fission following selective fusion generates a subpopulation of non-fusing
mitochondria with reduced membrane potential, to facilitate their removal by autophagy (Twig et
al., 2008).
Although most of the evolutionarily conserved core components of the mitochondrial fusion and
fission systems have been described in the past 15 years (Fig. 9), the number of regulatory proteins
of these processes is steadily increasing.

Figure 9 – Structures of mitochondrial fusion and fission components in yeast and human (Westermann, . Nat Rev Mol Cell Biol. 2010).
Mitochondrial fusion machinery
The first step in cellular membrane fusion events is the formation of trans complexes involving
proteins on the surface of both fusion partners. The first mediator of mitochondrial fusion identified
was the Drosophila Melanogaster Fuzzy onions protein (Fzo 1), an evolutionarily conserved, large
transmembrane GTPase localized in the mitochondrial OM (Hales and Fuller, 1997). This protein
is the founding member of a conserved protein family, the mitofusins, that has members in yeast,
worms and mammals (Rapaport et al., 1998; Hermann et al., 1998; Kanazawa et al., 2008; Santel
and Fuller, 2001). Mammals have two mitofusin isoforms, MFN1 and MFN2, showing high
homology (81%) and similar topologies, both residing in the OM (Santel and Fuller, 2001; Rojo et
al., 2002; Chen et al., 2003). These proteins contain two transmembrane regions in the OM, with a
short loop in the intermembrane space and the major parts of the protein facing the cytosol (Rojo et
al., 2002; Fritz et al., 2001) (Fig. 9). Recent results provide clear evidences that mitofusins act
early, in the initial step of fusion and are essential for OM fusion (Song et al., 2009). Deletions of
either Mfn1 or Mfn2 results in mitochondrial fragmentation and poor mitochondrial function (Chen

et al., 2005). However, MFN2 seems to have a different role from MFN1. First, it has been shown
that MFN1 has a higher GTPase activity than MFN2, although its affinity for GTP is lower; thus,
MFN1 exhibits a higher capacity to induce fusion (Ishihara et al., 2004). Moreover, MFN2 has also
other functions, such as control of mitochondrial metabolism (Bach et al., 2003) and tethering of
mitochondria to the ER (de Brito and Scorrano, 2008).
Mgm1 is a dynamin-related large GTPase that is essential for IM fusion in yeast (Meeusen et al.,
2006). The mammalian orthologue, optic atrophy protein 1 (OPA1), and related proteins in worms
and flies have also been shown to be required for mitochondrial fusion (Cipolat, 2004; Yaroshi,
2008). Mgm1 and OPA1 display a sequence identity of approximately 20% and maintain a highly
conserve secondary structure , consisting of a N-terminal mitochondrial target sequence (MTS)
composed of positively charged amino acids resuides, two consecutive hydrophobic segments, a
GTPase domain, a middle domain, and a C-terminal coiled-coil domain, corresponding to GTPase
effector domain (GED) (Fig. 9) (Satoh et al., 2003).
OPA1 is present in eight isoforms that are generated by alternative splicing of exons 4, 4b and 5b,
that might be present or absent (Olichon et al., 2007a). Precursors translated from the OPA1
mRNAs are targeted to mitochondria via their MTS, which is removed upon import by the
mitochondrial processing peptidase (MPP) to give rise to long isoforms (l-OPA1) (Olichon et al.,
2002; Satoh et al., 2003). Each l-OPA1 isoform is then subjected to a limited proteolysis
generating one or two short isoforms (s-OPA1) (Ishihara et al., 2006; Song et al., 2007). Both short
and long isoforms of OPA1are associated to mitochondrial membranes, and it is proposed that l-
OPA1 is anchored to the IM while s-OPA1 is peripherally attached to the IM, a fraction of it having
the possibility to diffuse in the IMS and to associate to OM (Olichon et al., 2002; Griparic et al.,
2004; Satoh et al., 2003; Cipolat et al., 2006). To date, two cleavage sites have been identified in
the primary sequence of OPA1, S1 and S2, located respectively in exon 5 and 5b (Ishihara et al.,
2006; Song et al., 2007). Isoforms containing exon 4b are totally processed in s-OPA1 (Song et al.,
2007), but the cleveage site has not been identified yet.
Several proteases have been implicated in processing of mammalian OPA1, including the
rhomboid-related protease presenilins-associated rhomboid-like (PARL) (Cipolat et at, 2006), AAA
proteases in the matrix and in the inner membrane space (Griparic et al, 2007; Ishihara et al., 2006;
Song et al., 2007; Ehses et al., 2009) and the inner membrane peptidase OMA1 (Ehses et al., 2009;
Head et al., 2009).
Loss of function of OPA1 by RNAi or gene knockout causes fragmentation of the tubular
mitochondrial reticulum (Griparic et al., 2004; Olichon et al., 2003; Song et al., 2009). Conversely,
overproduction of this protein promotes mitochondrial elongation in cells where mitochondria are

punctuated (Olichon et al., 2002; Cipolat et al., 2004). Surprisingly, over-expression of the
dynamin in cells with tubular mitochondria causes mitochondrial fragmentation (Griparic et al.,
2004). The profusion activity of OPA1 is further confirmed by experiments showing that
mitochondrial fusion is impaired in OPA1-depleted or Opa1−/− cells (Song et al., 2007; Song et al.,
2009; Cipolat et al., 2004). Interestingly, the levels of OPA1 can differentially influence two types
of fusion: a “transient fusion”, also called “kiss and run” events, that result in rapid exchange of
soluble components without affecting the morphology of mitochondria, and a “complete fusion”
that permits the exchange of all mitochondrial components and affect mitochondrial morphology
(Liu et al., 2009).
In addition to its role in mitochondrial fusion, OPA1 is also important for maintaining normal
cristae structure; this was proved by the fact that cultured mammalian cells lacking OPA1 have
highly disorganized IM structures (Grisparic et al., 2004; Olichon et al., 2002).
OPA1 has been proposed to protect cells from apoptosis by restricting the diameter of cristae
junctions and thereby preventing cytochrome c release. This protective effect of OPA1 expression
occurs even in Mfn1 and Mfn2 double-null cells, suggesting that it is independent of mitochondrial
fusion (Frezza et al., 2006). The anti-apoptotic effect of OPA1 has also been linked to the
proteolytic activity of PARL. The s-OPA1 soluble form present in the IMS is reduced in PARL-
deficient cells. Oligomers of OPA1 include this soluble form, and such oligomers have been
proposed to act with membrane-bound OPA1 to close cristae junctions (Cipolat et al., 2006).
Since mitochondrial fusion is thought to be important for mitochondrial function by allowing the
exchange of intra-mitochondrial content, and considering that OPA1 is the fifth gene associated
with mtDNA “breakage syndrome” together with ANT1, Twinkle, PolG1-2, and TYMP
(Spinazzola and Zeviani, 2009), a role of OPA1 in mtDNA stability has been proposed. This
hypothesis has been recently confirmed in a study that associates OPA1-containing exon 4b
isoforms with the mtDNA maintenance, regulating replication and distribution of the genome
(Elachouri et al., 2011).
Thus, OPA1 functions are schematically summerized in figure 10.

Figure 10 – Mitochondrial functions of OPA1 (Landes et al., Semin Cell Dev Biol. 2010) Mitochondrial fission machinery
A dynamin-related protein, termed Dnm1 in yeast and dynamin-related protein 1 (DRP1) in
mammals, is the master regulator of mitochondrial division in most eukaryotic organisms
(Westermann et al., 2010). DRP1 is a soluble protein containing a dynamin-like central domain, a
C-terminal GED domain involved in self-assembly and a N-terminal GTPase domain; an additional
alternative splicing site is present between the middle domain and the GED domain, producing a
brain-specific DRP1 isoform (Fig. 9) (Smirnova et al., 1998). DRP1 is mostly located in the
cytosol, but a part is visible as spots on mitochondrial tubules and a subset of these spots mark a
future site of fission (Labrousse et al., 1999; Smirnova et al., 2001). It has been proposed that
DRP1 couples GTP hydrolysis with mitochondrial membrane constriction and fission (Zhang and
Hinshaw, 2001; Smirnova et al., 2001). Cells lacking DRP1 contain highly interconnected
mitochondrial nets that are formed by ongoing fusion in the absence of fission activity (Smirnova et
al., 1998).
FIS1, the second component required for mitochondrial fission, is a small tail-anchored protein in
the OM. Its N-terminal domain faces the cytosol, where it forms a six-helix bundle with tandem
tetratricopeptide repeat motifs (TPR) that, in yeast, provide an interface for interaction with the
adaptor protein Mdv1 (mitochondrial division protein 1) (Fig. 9) (Zhang and Chan, 2007). The C-
terminal of FIS1 has a predicted TM domain and a short stretch of aminoacids facing the IMS. FIS1
is predicted to recruit DRP1 to punctuate structures on mitochondria during mitochondrial fission
(Yoon et al., 2003). Overexpression of FIS1 leads to mitochondrial fragmentation that is dependent
on DRP1 (James et al., 2003; Yoon et al., 2003). Knockdown of FIS1 cause elongation of
mitochondrial tubules (Lee et al., 2004).
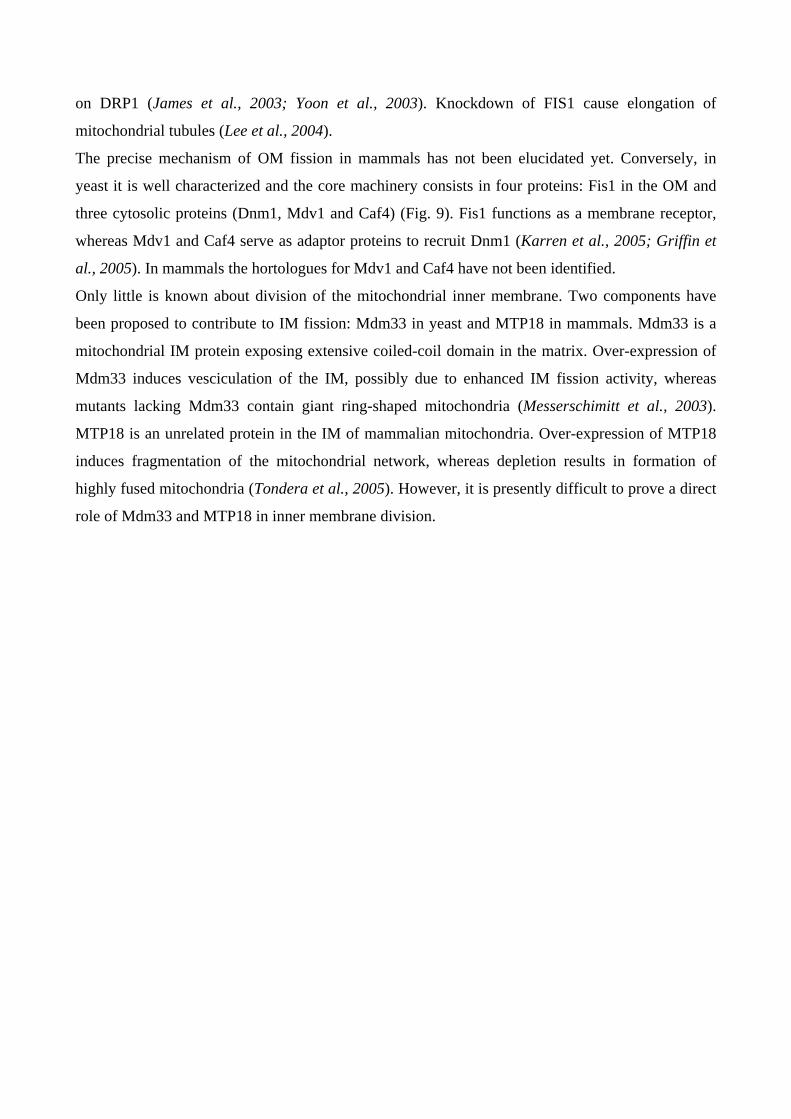
The precise mechanism of OM fission in mammals has not been elucidated yet. Conversely, in
yeast it is well characterized and the core machinery consists in four proteins: Fis1 in the OM and
three cytosolic proteins (Dnm1, Mdv1 and Caf4) (Fig. 9). Fis1 functions as a membrane receptor,
whereas Mdv1 and Caf4 serve as adaptor proteins to recruit Dnm1 (Karren et al., 2005; Griffin et
al., 2005). In mammals the hortologues for Mdv1 and Caf4 have not been identified.
Only little is known about division of the mitochondrial inner membrane. Two components have
been proposed to contribute to IM fission: Mdm33 in yeast and MTP18 in mammals. Mdm33 is a
mitochondrial IM protein exposing extensive coiled-coil domain in the matrix. Over-expression of
Mdm33 induces vesciculation of the IM, possibly due to enhanced IM fission activity, whereas
mutants lacking Mdm33 contain giant ring-shaped mitochondria (Messerschimitt et al., 2003).
MTP18 is an unrelated protein in the IM of mammalian mitochondria. Over-expression of MTP18
induces fragmentation of the mitochondrial network, whereas depletion results in formation of
highly fused mitochondria (Tondera et al., 2005). However, it is presently difficult to prove a direct
role of Mdm33 and MTP18 in inner membrane division.
Mitochondrial disorders
The first pathogenic mtDNA point mutation was discovered in 1988 in association with Leber’s
hereditary optic neuropathy (LHON) (Wallace, 1988); in the same year mtDNA deletions were
found in patients affected by mitochondrial myopathies (Holt et al., 1988). After these reports,
numerous mtDNA mutations were associated with several maternally inherited and sporadic
disorders, most of them affecting the central and peripheral nervous system, as well as skeletal and
cardiac muscle (Fig. 11).
The genetic classification of the primary mitochondrial diseases distinguishes disorders due to
defects of mtDNA, inherited according to the rules of mitochondrial genetic, from those due to
nDNA mutations or rearrangements in genes encoding mitochondrial proteins and transmitted by
mendelian inheritance (DiMauro and Schon, 2003). Moreover, mitochondrial diseases can also be
divided in those affecting the OXPHOS function (mitochondrial encephalomyopathies) and those
affecting mitochondrial dynamics. In the last years, a mitochondrial involvement has also been
proposed for some neurodegenerative disease, such as Parkinson and Alzheimer disease (DiMauro
and Schon, 2008).
Mitochondrial disorders due to mtDNA defects show peculiar characteristics, such as genetic and
phenotypic heterogeneity (Filosto and Mancuso, 2007), the maternal inheritance, the threshold
effect, variable penetrance and different clinical expression and severity also within the same
family. Moreover, it has been shown that mitochondrial haplogroups may modulate the OXPHOS
and the complex I assembly, being predisposing or protective to or from certain disorders (Hudson
et al., 2007; Pello et al., 2008).
The most frequent rearrangements of mtDNA are deletions, even if duplications can also occur.
Multiple deletions are caused by defects in nuclear genes encoding enzymes involved in mtDNA
maintenance and nucleotide metabolism, whereas single deletions are usually sporadic (DiMauro
and Schon, 2008). The main syndromes associated with single sporadic deletions are Kearns-Sayre
Syndrome (KSS), Pearson marrow-pancreas Syndrome (PS) and some forms of Chronic
Progressive External Opthalmoplegia (CPEO).
Mitochondrial depletion syndromes are recessive diseases with various phenotypical expression,
caused by mutations in several nuclear genes (DiMauro and Schon, 2008) The two major
syndromes are hepatocerebral syndrome (mutations in POLG1, DGUOK, MPV17) (Spinazzola and
Zeviani, 2008; Spinazzola et al., 2006) and pure myopathic syndromes (mutations in TK2,
SUCLA2 and RRM2B) (Elpeleg et al., 2005; Bourdon et al., 2007).
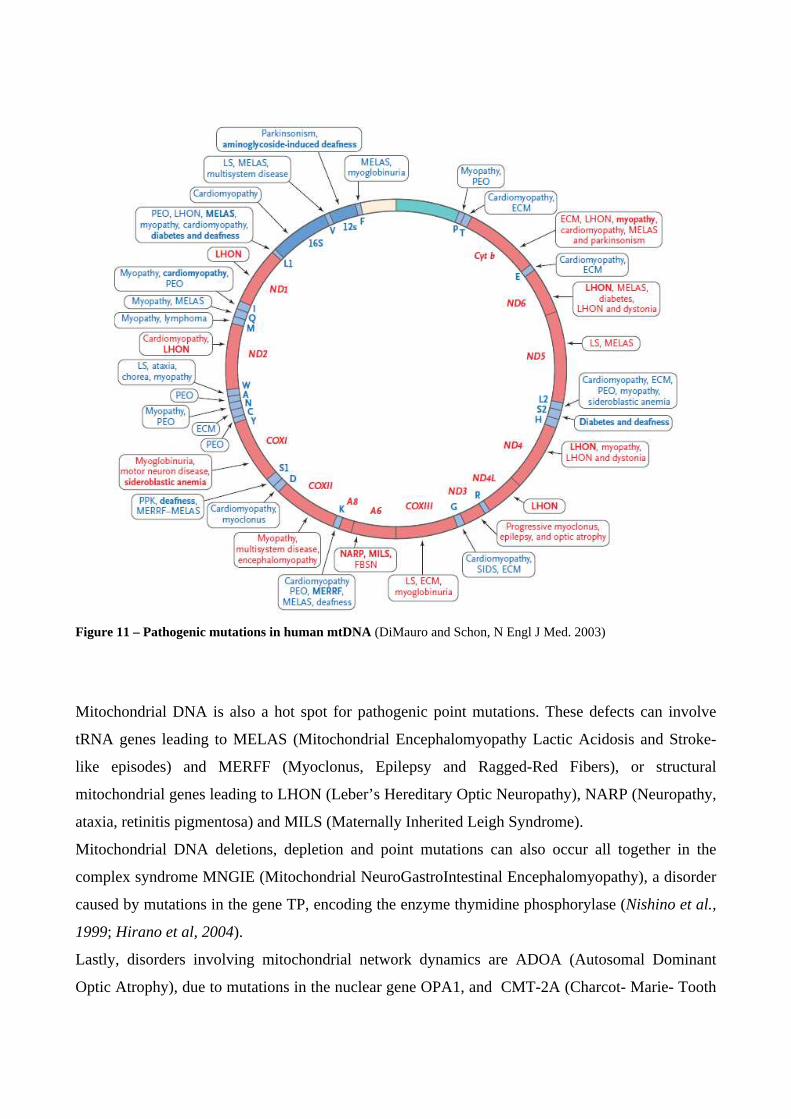
Figure 11 – Pathogenic mutations in human mtDNA (DiMauro and Schon, N Engl J Med. 2003)
Mitochondrial DNA is also a hot spot for pathogenic point mutations. These defects can involve
tRNA genes leading to MELAS (Mitochondrial Encephalomyopathy Lactic Acidosis and Stroke-
like episodes) and MERFF (Myoclonus, Epilepsy and Ragged-Red Fibers), or structural
mitochondrial genes leading to LHON (Leber’s Hereditary Optic Neuropathy), NARP (Neuropathy,
ataxia, retinitis pigmentosa) and MILS (Maternally Inherited Leigh Syndrome).
Mitochondrial DNA deletions, depletion and point mutations can also occur all together in the
complex syndrome MNGIE (Mitochondrial NeuroGastroIntestinal Encephalomyopathy), a disorder
caused by mutations in the gene TP, encoding the enzyme thymidine phosphorylase (Nishino et al.,
1999; Hirano et al, 2004).
Lastly, disorders involving mitochondrial network dynamics are ADOA (Autosomal Dominant
Optic Atrophy), due to mutations in the nuclear gene OPA1, and CMT-2A (Charcot- Marie- Tooth

Type 2A), caused by mutations in the MFN2 gene. Recently, a defect in DRP-1 gene has been
reported in a severe infantile encephalopathy (Waterham et al., 2007).
Inherited mitochondrial optic neuropathies
Leber’s hereditary optic neuropathy (LHON) and Autosomal Dominant Optic Atrophy (ADOA) are
the two most common inherited optic neuropathies and both are the result of mitochondrial
dysfunctions.
Despite the primary mutations causing these disorders are different, being an mtDNA mutation in
subunits of complex I in LHON and defects in the nuclear gene encoding the mitochondrial protein
OPA1 in ADOA, both pathologies share some peculiar features:
• A variable penetrance modulated by both genetic and environmental factors, leading to a
inter and intra-familial phenotypical heterogeneity
• The tissue-specificity of the pathological mechanism, involving a highly specialised group
of cells within the retina: the retinal ganglion cells (RGCs), whose axons compose the optic
nerve.
These features have not been completely explained yet, but their elucidation represent a prerequisite
for the development of effective therapeutic strategies, which are currently limited (Yu-Wai-Man et
al., 2009).
Leber’s hereditary optic neuropathy (LHON)
LHON is a maternally inherited disease characterized by severe loss of central vision, affecting
predominantly young males. It was first described by Leber in 1871 (Leber, 1871), but only in 1988
Wallace and colleagues discovered that the causative mutation was in the mtDNA (Wallace et al.,
1988). LHON is now recognized as the most frequent mitochondrial disease (Man et al., 2003a).
Clinical features
LHON patients present rapid and painless loss of central vision in one or both eyes, accompanied
by dyschromatopsia. The second eye is usually involved in a short time laps (Newman, 1998;
Carelli et al., 2009). Visual acuity reaches stable values at or below 20/200 within a few months,
and the visual field defect involves the central vision in the form of a large centro-cecal absolute
scotoma. Fundus examination during the acute/subacute stage reveals circumpapillary telangiectatic
microangiopathy, swelling of the nerve fiber layer around the disc (pseudoedema), and absence of
leakage on fluorescein angiography (Nikoskelainen et al, 2003; Nikoskelainen et al., 1984).
Microangiopathy and fundus changes may be present in asymptomatic maternal family members
(Nikoskelainen et al., 1982). In the acute phase, axonal loss in the papillomacular bundle leads to

temporal atrophy of the optic nerve, and the endpoint of the disease is generally a full optic atrophy
with permanent severe loss of central vision but with relative preservation of pupillary light
responses. Spontaneous recovery of visual acuity may infrequently occur even years after the onset,
and the most favourable prognostic factors are young age of onset and the 14484/ND6 mutation
(Carelli et al., 2004).
The optic nerve morphology may have a protective role in the development and prognosis of
LHON. A recent study demonstrated that LHON carriers (harbouring the mutation, but unaffected)
display a larger optic disc area and a higher vertical disc diameter, compared to controls and
affected LHON. Furthermore, among the LHON-affected, larger discs were correlated with visual
recovery and better visual outcome (Ramos Cdo et al., 2009).
Even if LHON is a monosymptomatic disorder, a subset of patients show a syndromic form of optic
atrophy frequently referred as “Leber’s plus” (Nikoskelainen et al., 1995), which may include
central nervous system involvement and movement disorders frequently associated with basal
ganglia lesions, Leigh-like syndrome, cerebellar atrophy, migraine, epilepsy and peripheral
neuropathy, and also cardiac involvement with conduction abnormalities or skeletal deformities
(Larson et al., 1991; Funalot et al., 2002; Funakawa et al., 1995; Cupini et al., 2003;
Nikoskelainen et al., 1985). The occurrence of “Leber plus” has been related to specific mtDNA
mutations, different from the primary LHON mutation, or to the presence of a LHON primary
mutation together with other putative pathogenic changes, multiple pathogenic mutations and the
co-occurrence of two primary LHON mutations (Howell et al., 1991; De Vries et al., 1995; Howell
et al., 2002).
Histopathologic description of LHON patients have demonstrated a very selective loss of a single
cell type, the RGCs, and their axons, which constitute the retinal nerve fiber layer (RNFL) and optic
nerve (Sadun et al., 2000). Mitochondria accumulate in the RNFL, especially in the unmyelinated
portion anterior to the lamina cribrosa, representing the area with the greatest energy requirements
(Carelli et al., 2004). The high energy demand of the unmyelinated RNFL may explain why the
optic nerve is the target tissue in LHON (Sadun et al., 2000).
Genetics
LHON is transmitted with a maternal pattern of inheritance, indicative of mutations in the mtDNA.
The most common pathogenic point mutations are 11778/ND4, 3460/ND1 and 14484/ND6,
characterizing about 90% of LHON cases; several rare but truly pathogenic mutations of mtDNA
have been identified, all affecting subunits of complex I (Carelli et al., 2004; Yu-Wai-Man et al.,
2009).

Incomplete penetrance in homoplasmic LHON maternal lineages and male prevalence among the
affected individuals are still poorly understood features. In the last years, the importance of the
mtDNA background has been fully recognized. It has been definitely demonstrated that two
subclades of haplogroup J (J1c and J2b) are relevant to increase the penetrance of the 11778/ND4
and 14484/ND6 mutations, whereas the haplogroup K results associated with the 3460/ND1
mutation (Hudson et al., 2007). Moreover, some “private” non –synonymous changes in mtDNA
may modify the clinical expression of LHON (La Morgia et al., 2008).
Apart from the role of the mtDNA background, the existence of other genetic determinants, such as
nuclear modifying genes, has been suggested and widely debated (Bu and Rotter, 1991, Giordano et
al., 2011).
Chromosome X has been extensively investigated and recently two loci have been identified
(Hudson et al., 2005; Shankar et al., 2008). However, to date no significant genetic variants
associated with LHON were reported by several approaches, such as direct sequencing of candidate
genes in the X-linked loci or studies on the X-inactivation pattern in affected females (Chen et al.,
1989; Carvalho et al., 1992; Chalmers et al., 1996b; Pegoraro et al., 1996; Oostra et al., 1996;
Pegoraro et al., 2003).
Recently, it has been demonstrated in vitro a protective role of 17-β-estradiol in cells harbouring the
three primary LHON mutations, proposing a metabolic basis for the unexplained male prevalence in
LHON (Giordano et al., 2011).
A recent genome-wide linkage scan of LHON families of Asian ancestry suggested the existence of
multiple loci, with the strongest association with two SNPs in the PARL gene encoding for a
mitochondrial protease (Phasukkijwatana et al., 2010). The association between these two variants
in PARL gene and LHON has not been confirmed by a following study in a cohort of Chinese
LHON patients (Zhang et al., 2010).
Several studies reported the exclusion of single polymorphic variants in candidate modifying genes
for LHON, including debrisoquine hydroxilase (Chalmers et al., 1996a), NDUFA1 (Man et al.,
2002), NDUFB11 (Petruzzella et al., 2007), APOE (Man et al., 2003b), MTHFR (Hudson et al.,
2009), whereas two polymorphic variants in the TP53 and EPHX1 genes were associated with age
at onset in a Japanese study (Ishikawa et al., 2005).
Lastly, also the exposure to certain environmental factors may influence LHON penetrance,
triggering the pathological features in previously unaffected mutation carriers. These factors include
not only tobacco smoking and alcohol consumption, but also exposure ti n-hexane and other
solvents, head trauma, non-controlled diabetes, ethambutol and antiretroviral therapy in HIV
patients (Carelli et al., 2009).

Biochemistry
Primary LHON mutations generally induce moderate changes in the catalytic function of complex I,
with the only exception of 3460/ND1 mutation, the most severe, which has been shown to decrease
the electron transport activity of complex I (Majander et al., 1991; Carelli et al., 1997). Moreover,
the three common LHON mutations decrease the sensitivity to rotenone, a powerful complex I
inhibitor, and the 14484/ND6 and 3460/ND1 mutations induce an increase sensitivity of complex I
to myxothiazol and nonyl-benzoquinol (Carelli et al., 1999; Majander et al., 1996), suggesting that
the LHON mutations may influence the interaction between complex I and ubiquinone (Degli
Esposti et al., 1994).
Several biochemical studies have been carried out on cellular models, including primary cultured
cells and transmitochondrial cytoplasmic hybrids (cybrids). Cybrids are generated from human
immortalized cell lines, lacking their own mtDNA (Rho0 cells), and repopulated with mitochondria
from patients, harbouring mtDNA mutations (King and Attardi, 1989). This cell model is used to
study the pathological features of the mtDNA mutations, without the influence of the nuclear
background of the patients.
The main consequences of the complex I activity defect are a decrease of net energy production and
a chronic increase of oxidative stress.
The amount of ATP produced by complex I is consistently decreased in the presence of all three
common LHON mutations, even if cells may compensate this energy reduction by alternative
pathways, such as glycolysis and complex II/glycerol 3-phosphate dehydrogenase (Baracca et al.,
2005). These results fit with the 31P magnetic resonance spectroscopy (MRS), indicating a defective
ATP synthesis in skeletal muscle and brain (Lodi et al., 1997; Lodi et al., 2002).
A significant increase in ROS production and glutathione depletion have been observed in NT2
neuronal differentiated LHON cybrids carrying the 11778/ND4 and 3460/ND1 mutations and in
osteosarcoma cybrids (Wong et al., 2002; Schoeler et al., 2007).
Growing LHON cybrids in a glucose free/galactose medium, which forces cells to relay on
oxidative metabolism, causes cell death characterized by the typical apoptotic hallmarks, including
changes in nuclear morphology, chromatin condensation and fragmentation of chromosomal DNA
(Ghelli et al., 2003). The apoptotic process under this condition is caspase-indipendent and involves
AIF and EndoG (Zanna et al., 2003; Zanna et al., 2005). Moreover, an increased sensitivity to cell
death was also reported in LHON cybrids after treatment with Fas, a well-known activator of the
extrinsic apoptotic pathway (Danielson et al., 2002).

Only recently it has been demonstrated that, even if the LHON mutations do not affect the steady
state levels of respiratory chain complexes, an accumulation of low molecular weight subcomplexes
is evident in LHON cybrids. Moreover, LHON mutants belonging to different haplogroups shows a
differentially delayed assembly rates of complexes I, III and IV, revealing that specific mtDNA
polymorphisms may modify the pathogenic potential of LHON mutations (Pello et al., 2008).
Therapy and experimental treatments
Many treatments has been proposed for LHON, such as vitamins, cofactors, steroids and surgical
treatment, but none of these resulted effective (Carelli et al., 2004; Carelli et al., 2006). The
clinical trial with a neuroprotective agent, the brimonidine, during the acute phase of LHON, failed
to avoid the involvement of the second eye, during the disease progression (Newman et al., 2005).
A partial improvement of visual recovery and neurological symptoms have been described with
idebenone treatment, a coenzyme Q analogue (Mashima et al., 2002; Mashima et al., 2000).
The induced expression of corrected mitochondrial genes by the nucleus and targeted to
mitochondria (allotopic expression) has been used to rescue the biochemical defect, due to
mutations 8993 in ATPase 6 gene (NARP/MILS) and 11778 in ND4 gene (LHON) (Manfredi et al.,
2002; Guy et al., 2002). However, the use of this approach is still controversial, especially because
of the lacking of complete and long-lasting rescue (Oca-Cossio et al., 2003; Bokori-Brown and
Holt, 2006). Recently, the allotopic expression has been optimized and the approach for
mitochondrial genes ATPase6, ND1 and ND4 has been developed, obtaining a complete restoration
of mitochondrial activity in mutated human fibroblasts (Bonnet et al., 2007; Bonnet et al., 2008).
The same authors also demonstrated that the allotopic expression of the human mitochondrial ND4
prevents blindness in a LHON rat model. The LHON 11778/ND4 mutation was introduced in rat
eyes in vivo by electroporation causing the RGCs degeneration. Subsequent electroporation with
the wild-type ND4 gene prevented the degeneration and the impairment of visual function (Ellouze
et al., 2008). Another similar approach, consists to complement the mitochondrial defect through
the expression of a transgene with ND subunits from other species. This approach has been applied
on human cybrids bearing the 11778/ND4 mutation, using the nuclear protein Ndi1, a rotenone
sensitive NADHquinone oxidoreductase, from S.cerevisiae (Park et al., 2008). Mutant cells
expressing Ndi1 show a recovery in complex I specific activity and in complex I driven respiration,
a partial increase in ATP synthesis, a decrease in ROS production and are able to grow in galactose
medium (Park et al., 2008).
The biochemical phenotype of LHON mutations includes an increase of cellular oxidative stress,
due to the “electron leaking” of impaired complex I. Different strategies have been tested in order to

reduce the chronic oxidative condition. Ghelli et al. in 2008 demonstrated that exogenous
glutathione is the only one, in an variety of antioxidant and antiapoptotic compounds, able to reduce
the cell death induced by the exposure of LHON cybrids to oxidative stress (Ghelli et al., 2008).
Moreover, the overexpression of human MnSOD is able to rescue the apoptotic cell death induced
by galactose medium in mutant cells 11778/ND4 (Qi et al., 2007).
Autosomal Dominant Optic Atrophy (ADOA)
ADOA was first described in one British family by Batten in 1896; the phenotype was further
clarified by Kjer in 1959, but only in 2000 two side by side studies identified mutations in the
OPA1 gene in patients affecting by DOA (Alexander et al., 2000; Delettre et al., 2000). The
prevalence of DOA is not well established, but a frequency of 1:50000 is often reported in the
literature (Lyle, 1990).
Clinical features
DOA is characterized by a slowly progressive bilateral loss of central vision starting in childhood
and variably progressing in adult life (Carelli et al., 2009; Yu-Wai-Man et al., 2011).
The disease is highly variable in clinical expression and shows incomplete penetrance in some
families (Hoyt, 1980; Johnston et al., 1999; Votruba et al., 1998). Visual impairment is usually
moderate (6/10 to 2/10), but ranges from mild or even insignificant to severe (legal blindness).
Patient examination demonstrates centrocecal scotomas and impairment of colours vision and
temporal pallor of the optic disc. The endpoint is similar to that in LHON, beginning with the
predominant involvement of the papillomacular bundle (Carelli et al., 2009).
The predominant colour defect in DOA is a generalize dyschromatopsia, involving both the blue-
yellow and red-green axes, with a minority of patients having pure tritanopia (Berninger et al.,
1991).
Postmortem studies of two patients with DOA identified similar histopathological changes, with
diffuse atrophy of the RGC layer, loss of myelin and fibrillary gliosis along the anterioe visual
pathways extending to the lateral geniculate body (Johnston et al., 1979; Kjer et al., 1983). MRI
data from patients also confirmed significant tissue loss and thinning of the optic nerve along its
entire length (Votruba et al, 2000). Although less pronounced, the underlying ocular pathology in
DOA is therefore remarkably similar to LHON, with the primary loss of RGCs leading to ascending
optic atrophy.

Patients with mutations in OPA1 gene and DOA show a significantly smaller optic disc size
compared to controls, suggesting a role of OPA1 in shaping the conformation of the optic nerve
head in DOA patients (Barboni et al., 2010). Overall, similar to LHON, the optic disc size may be
involved in the pathological mechanism of the disease (Ramos Cdo et al., 2009).
Most of the patients affected by DOA have no additional neurologic deficits; however,
sensorineural hearing loss is not uncommon, and tends to cluster within the families. The hearing
loss ranges from severe and congenital to subclinical. In most cases it is unclear whether these
pedigrees represent a phenotypic variant of DOA, a genetically distinct disorder or a genetically
heterogeneous group of disorders with a similar phenotype (Amati-Bonneau et al., 2005). In patients
showing a “DOA plus” phenotype, optic atrophy may be associated with additional severe
phenotypes including neuromuscular involvement, such as sensorineural deafness, cerebellar ataxia,
axonal sensory-motor polyneuropathy and mitochondrial myopathy frequently complicated by
CPEO (Amati-Bonneau et al.,2008; Hudson et al., 2008). In these patients evidence of
mitochondrial myopathy was observed in muscle biopsies and correlated with accumulation of
mtDNA multiple deletions (Amati-Bonneau et al., 2008).
Recently, a form of DOA and premature cataract (ADOAC) has been associated to pathogenic
mutations of the OPA3 gene, encoding a mitochondrial protein (Reynier et al., 2004).
Genetics
Mutations in OPA1 are causative for ~ 60% of DOA cases; interestingly, a recent report suggested
that large scale rearrangements of entire OPA1 coding regions could account for up to 20% of all
OPA1 negative cases (Fuhrmann et al., 2009). The causative nuclear defects in the remaining
families with DOA have not yet been identified, but a small number of families have been mapped
to other chromosomal loci (OPA3, OPA4, OPA5, OPA7, OPA8) (Yu-Wai-Man et al., 2011; Carelli
et al., 2011), of which only OPA3 gene has been characterised (Reynier et al., 2004).
Over 200 pathogenic mutations have been identified and most of it localised in two specific regions:
the GTPase region and the C-terminus, which is the proposed site of the GTPase effector domain.
At the protein level the 40% of the OPA1 mutations results in premature translation termination,
supporting haploinsufficiency as the pathogenic mechanism, 27% are in frame splice variants, and
6% are deletions or duplications (eOPA1 database at http://lbbma.univ-angers.fr/lbbma.php?id=9).
To date , no mutations have been found in exon 4 and 4b, which are alternatively spliced.
In addition to haploinsufficiency, some data indicate that DOA can also develop as a consequence
of a dominant negative mechanism. In support of this idea, several missense OPA1 mutations that
ablate the consensus elements for GTP-binding have been reported (G300E, G401D, K468E,

D470G), and GTPase mutants of OPA1 show a dominant effect in the presence of the wild-type
protein. The dominant negative effect is due to the capacity of mutant OPA1 to oligomerize with
wild-type proteins and, in this way, interfere with GTPase activity (Amati-Bonneau et al., 2008;
Ferraris et al., 2008; Hudson et al., 2008).
Biochemistry and pathophysiology
Altered maintenance of mitochondrial network is central to the pathophysiology in DOA and there
is good experimental evidence to support a predominant complex I defect. Reduced mitochondrial
membrane potential and ATP synthesis have been observed in cultured fibroblasts carrying
pathogenic OPA1 mutations (Amati-Bonneau et al., 2005; Chevrollier et al., 2008). Moreover, in
vivo impairment of oxidative metabolism was evident in skeletal muscle of DOA patients using 31P-
MRS (Lodi et al., 2011).
Another link between OPA1 mutations and the defective mitochondrial respiratory chain in DOA is
provided by immunoprecipitation studies, that demonstrated a direct interaction of OPA1 with
complexes I, II and III and a role of OPA1 has been proposed in the assembly and stabilisation of
supercomplexes (Zanna et al., 2008).
Mutations in OPA1 have obvious consequences in the mitochondrial network morphology.
Fibroblasts from DOA patients show either normal or fragmented mitochondrial networks in
comparison with controls (Zanna et al., 2008; Chevrollier et al., 2008). Mitochondrial structural
alterations have been frequently reported in fibroblasts (Amati-Bonneau et al., 2005; Olichon et al.,
2007b; Zanna et al., 2008), in myotubes (Spinazzi et al., 2008), in skeletal muscle from DOA
patients (Amati-Bonneau et al., 2008) as well as in OPA1 mouse models (Alavi et al., 2007; Davies
et al., 2007). In one study a specific OPA1 mutation has been implicated in altered fusion activity
without affecting bioenergetics or increasing sensitivity to apoptosis. Thus, in this case, pro-fusion
activity of OPA1 per se seemed most relevant in DOA pathogenesis (Spinazzi et al., 2008).
Therapy
There is no effective therapy at this moment for these patients. Open trials with idebenone are under
way, showing preliminary encouraging results (recovery of visual acuity) (Carelli, unpublished
results).
Autosomal Optic Atrophy plus Cataract (ADOAC) and OPA3
The OPA3 gene was originally identified in eight Iraqi Jewish families affected by Costeff
syndrome: an autosomal recessive form of optic atrophy, associated with neurocognitive deficits,

elevated urinary excretion of 3-methyl glutaconic acid, and increased plasma 3-methylglutaric acid
levels (Costeff et al., 1989; Anikster et al., 2001; Kleta et al., 2002).
Later, pathogenic dominant mutations in the OPA3 gene have also been identified in two French
families in association with DOA and premature cataract (ADOAC) (Reynier et al., 2004; Verny et
al., 2005).
Recently, a mutation in OPA3 gene has been associated with dilated cardiomyopathy in bovines,
suggesting that this gene might also be responsible for some forms of familiar dilated
cardiomyopathies in human (Owczarek-Lipska et al., 2011).
OPA3 gene was mapped on chromosome 19 and consists of three exons; two transcript variants
have been identified, deriving from alternative splicing of exon 2 and exon 3 (also named exon 2b)
(Fig. 12) (Huizing et al., 2010). The nucleotide sequences of exon 2 and exon 3, including their
intron/exon boundaries, closely resemble each other (80% homology), suggesting a segmental
duplication event. This hypothesis is supported by the presence of a transposon in OPA3 ~ 24kb
upstream of exon 2 (Fig. 12). OPA3A variant (or OPA3V1) (ex1-ex2) is expressed and conserved
from fungi to primates, whereas OPA3B (or OPA3V2) variant (ex1-ex3) seems to have arisen
between fish and mammals (Huizing et al., 2010).
OPA3A and OPA3B both localised in mitochondria, thanks to the presence of a mitochondrial
targeting sequence (MTS) at the N-terminal (Da Cruz et al., 2003; Huizing et al., 2010; Ryu et al.,
2010), but it is still controversial their localisation within the organelle. The presence of a
transmembrane domain in the protein structure, suggests that the protein is anchored to a
membrane. A proteomic investigation indicated a location for the OPA3 protein in the inner
membrane of rodent mitochondria suggesting that this also may apply to mammals (Da Cruz et al.,
2003), but a recent study also demonstrated that OPA3 is located in the outer mitochondrial
membrane (Ryu et al., 2010).
OPA3A and OPA3B contain respective C-terminal tripeptides SKK and SEK, that resemble the
peroxisomal targeting signal type 1 (SKL), but the peroxisomal localisation has been excluded in
cellular systems (Huizing et al., 2010).
Despite the high percentage of homology between the two protein variants, OPA3B has a lower
expression level than OPA3A, and may not yield a significant translation product in human cells,
since OPA3B is not identified in proteomic database and no human disease has been associated
with mutations in the OPA3B-specific exon 3. However OPA3B gene expression is significantly
up-regulated in OPA3A deficient cells (3-MGCA type III fibroblasts), suggesting that the gain of
expression of OPA3B may be important in the etiology of the disease (Huizing et al., 2010).

Figure 12 – Human OPA3 gene structure. (Huizing et al., Mol Genet Metab. 2010)
A mitochondrial coupling defect has been observed in fibroblasts from patients affected by
ADOAC (313_C>G; Q105E), demonstrated by a lower respiratory capacity respect to controls, and
a reduction of the mitochondrial membrane potential and of ATP/O ratio. Surprisingly, in these
cells the level of ATP synthesis is similar to that of controls, indicating a possible mechanism of
compensation (Chevrollier et al., 2008). Furthermore, also the mitochondrial network morphology
in the OPA3 mutant cells was similar to that of controls (Chevrollier et al., 2008).
Mutant OPA3 was proposed to play an important role in optic atrophy and neuronal degeneration.
However, OPA3 protein function and regulation that underlie OPA3-linked pathogenic processes
remains poorly understood. Recently, a functional study of OPA3 revealed that overexpression of
the protein significantly induced mitochondrial fragmentation, whereas OPA3 knockdown resulted
in highly elongated mitochondria (Ryu et al., 2010). Cells with mitochondria fragmented by OPA3
did not undergo spontaneous apoptotic cell death, but were significantly sensitized to staurosporine-
and TRAIL-induced apoptosis. In contrast, overexpression of a familial OPA3 mutant (G93S)
induced mitochondrial fragmentation and spontaneous apoptosis, suggesting that OPA3 may cause
optic atrophy via a gain-of-function mechanism (Ryu et al., 2010).
A mouse model of OPA3-related disease was created recapitulating most of the clinical features
observed in the patients affected by Costeff Syndrome (Davies et al., 2008), whereas a OPA3 null
mutant zebrafish modelling Costeff Syndrome demonstrated a requirement for mitochondrial OPA3
to limit 3-hydroxy-3-methylglutarylcoenzyme-derived 3-methylglutaconic acid and to protect the
electron transport chain against inhibitory compounds (Pei et al., 2010).

Aims

Leber’s hereditary optic neuropathy (LHON) and Autosomal Dominant Optic Atrophy (ADOA) are
the two most common inherited optic neuropathies and both are the result of mitochondrial
dysfunctions.
LHON is one of the most common mitochondrial diseases, characterized by a very rapid loss of
central vision and optic atrophy, due to the selective degeneration of retinal ganglion cells. The age
of onset is around 20, and the degenerative process is fast and usually the second eye becomes
affected in weeks or months. Even if this pathology is well known and has been well characterized,
there are still open questions on its pathophysiology, such as the male prevalence, the incomplete
penetrance and the tissue selectivity.
Probably, one of the most interesting and unclear aspect of LHON is the variable penetrance. This
phenomenon is common in LHON families, most of them being homoplasmic mutant. Inter-family
variability of penetrance may be caused by nuclear or mitochondrial ‘secondary’ genetic
determinants or other predisposing triggering factors. However, within-family variability of
penetrance in pedigrees with a homoplasmic mutation harboured by all maternally related
individuals remains unexplained. Thus, the first aim was to identify some molecular markers that
may clearly differentiate affected individuals from carriers.
In several mitochondrial disorders, the respiratory chain impairment is followed by an increase in
mitochondrial mass, a common cellular strategy to compensate for the energy defect. The
compensatory activation of mitochondrial biogenesis is particularly evident in skeletal muscle of
MELAS and MERRF patients, in which there is a massive subsarcolemmal accumulation of
aberrant mitochondria responsible for the histological hallmark known as ragged-red fibers (RRFs).
In LHON this mitochondrial proliferation is less evident, but an increase in SDH staining in skeletal
muscle has been shown. The compensatory mechanism consisting in activation of the mitochondrial
biogenesis could be an important factor in the regulation of the variable penetrance in LHON. Thus,
in this part of the project, carried out in collaboration with Dr. Carla Giordano and Prof. Giulia
d’Amati, at the University La Sapienza, Roma, we investigated the mitochondrial biogenesis in
LHON patients and furthermore we screened single nucleotide polymorphisms in five candidate
genes involved in the regulation of this process or of mtDNA replication.
The main consequences of the complex I defect in LHON are a decrease of net energy production
and a chronic increase of oxidative stress. The efficiency of the enzymes belonging to the
antioxidant machinery could influence the risk of expressing the pathology contrasting the
overproduction of ROS. Thus, we investigated the modifying role of the antioxidant system
screening functional polymorphisms in the most important genes involved in the detoxifying

process in LHON patients, with the collaboration of Prof. Patrick Chinnery, at the Newcastle
University.
ADOA is characterized by a slowly progressive bilateral loss of central vision starting in childhood
and variably progressing in adult life. The disease is highly variable in clinical expression and
shows incomplete penetrance in some families.
ADOA is due to mutation in OPA1 gene in the majority of cases. The causative nuclear defects in
the remaining families with DOA have not yet been identified, but a small number of families have
been mapped to other chromosomal loci (OPA3, OPA4, OPA5, OPA7, OPA8). Recently, a form of
DOA and premature cataract (ADOAC) has been associated to pathogenic mutations of the OPA3
gene, encoding a mitochondrial protein. The OPA3 gene was originally identified in eight Iraqi
Jewish families affected by Costeff syndrome: an autosomal recessive form of optic atrophy,
associated with neurocognitive deficits, elevated urinary excretion of 3-methyl glutaconic acid, and
increased plasma 3-methylglutaric acid levels. Furthermore, a mutation in OPA3 gene has been
associated with dilated cardiomyopathy in bovines, suggesting that this gene might also be
responsible for some forms of familiar dilated cardiomyopathies in human.
In the last year OPA3 has been investigated by two different groups, but a clear function for this
protein and the pathogenic mechanism leading to ADOAC have not been identified yet. Thus, the
second aim was to develop a functional investigation of OPA3, discriminating for the first time the
two different isoforms, to shed light on the role of OPA3 within mitochondria and the pathogenesis
of ADOAC. This part of the project has been carried out in the laboratory of Prof. Guy Lenaers at
the Institut of Neurosciences of Montpellier (INM).

Materials and methods

Cell culture
HeLa cells and HEK cells were cultured in Dulbecco Modified Eagle Medium (DMEM Euroclone)
supplemented with 10% fetal bovine serum (FBS Euroclone), 2 mmol/L L-glutamine, 100 units/mL
penicillin, and 100 µg/mL streptomycin, at 37°C in a 5% CO2 humidified incubator.
Transfection of HeLa cells
HeLa cells transfection were performed with Lipofectamine 2000 reagent (Invitrogen). Briefly 105
cells were seeded the day before the transfection on a 6 well plate. Transfections were performed
according to the manufacturer’s instructions by using 4µg of plasmid DNA and 12µl of
Lipofectamine reagent per well. Plasmids used in this study were pCDNA, pCDNA-OPA3A,
pCDNA-OPA3B, pCDNA-OPA3G93S, pIRES-GFP, pIRES-GFP-OPA3A, pIRES-GFP-OPA3B,
pIRES-GFP-OPA3G93S, pEYFP, pEYFP-OPA3V1, pEYFP-OPA3V2, pEYFP-OPA3V1G93S,
pEYFP-AIF. All this vector were previously constructed by Dr Cecile Delettre, Institute de
Neurosciences de Montpellier.
In silencing experiments the final concentration of the siRNA duplex (Darmacon) in culture
medium was 100nM and 6µl of Lipofectamine reagent was used. For the microscopy observations
the kit Silencer® siRNA Labeling Kit (Ambion) was used to stain siRNAs molecules, following
manufacturer’s instructions.
For plates with different surface, the number of cells, transfection reagent volume and amount of
DNA or siRNA were varied proportionally to the area of the plate.
Mitochondrial network morphology
After 24h or 48h of transfection HeLa cells were incubating with 100nM CMXros Mitotracker Red
(Molecular Probes) for 30 minutes to label mitochondria. The incubation was followed by two PBS
washes and direct observation. Images were captured by a confocal microscope (Zeiss, LSM 510
Meta) or by an epifluorescent microscope (Zeiss Axiolmager Z1/Apotome) with 63X or 100X oil
objectives (Diaphot, Nikon, Japan).
Mitochondrial membrane potential
After 24h or 48h of transfection HeLa cells were incubated with 5µg/ml JC-1 (Molecular Probes)
for 20 minutes. The incubation was followed by two PBS washes and direct observation. Images
were captured by a confocal microscope (Zeiss, LSM 510 Meta) or by an epifluorescent microscope
(Zeiss Axiolmager Z1/Apotome) with 63X or 100X oil objectives (Diaphot, Nikon, Japan).

Apoptosis assay on fixed cells
After 24h or 48h of transfection, HeLa cells were incubated with Staurosporine 1µM for 3h at 37°C.
After two washes with PBS cells were incubated with 4% paraformaldehyde (PFA) in PBS at RT
for 1h. After the fixation, cells were washed twice with PBS for 5 min and incubated with Hoechst
(Sigma) 5µg/ml for 20 min at dark. Cells were washed twice with PBS and the cover slips were
mounted using a fluorescent mounting medium (DACO) and observed at microscope (Zeiss
Axiolmager Z1/Apotome).
Immunofluorescence on fixed cells or tissues
HeLa cells were washed with PBS cells were incubated with 4% paraformaldehyde (PFA) in PBS at
RT for 1h. After the fixation, cells were washed twice with PBS for 5 min and the incubated with
30% Donkey serum and 0.3% Triton solution for 1h at RT to permeabilize. Eyes from 7 days old
mice were fixed in 4% PFA overnight at 4°C, included in paraffine and the slice of retina were
mounted on the microscope slide and incubated with 30% Donkey serum and 0.3% Triton. After
permeabilization, cells and retina were incubated with primary antibodies in 5% Donkey serum and
0.3% Triton solution, overnight at 4°C. The day after they were washed three times for 5 min with
PBS and then incubated with secondary antibodies in PBS for 1h at RT and at dark. After three PBS
washes, microscope slide were mounted using a fluorescent mounting medium (DACO) and
observed at a confocal microscope (Zeiss, LSM 510 Meta). The primary antibody used are OPA3A
(1:500, homemade), OPA3B (1:500, homemade), ATP synthase (1:500, Sigma), Brn3a (1:500,
Santa Cruz), while secondary AlexaFluor® antibodies (1:1000, Invitrogen) anti-rabbit and anti-
mouse were used with different conjugated fluorophores.
Total cellular lysates preparation
Cells were scraped and cells pellets were washed in PBS and resuspended in 100µl of RIPA lysis
buffer (PBS, 1% Triton X-100, 0.5 mM EDTA, 0.6 mM PMSF and 100µl/mL protease inhibitors).
The lysate was incubated in ice for 15 min, frozen and thawed twice, sonicated in waterbath for 2
min and centrifuged at 12000 rpm for 10 min at 4°C. The supernatant was the collected and protein
content was assessed according to Bradford (Bradford, 1976).
Mitochondria isolation from cultures cells
HEK cells were washed once with PBS, resuspended in 0.5mL of 200mM mannitol, 70mM sucrose,
1mM EGTA, 10mM Hepes (pH 7.6), with protease inhibitor cocktail and homogenized for 30
strokes with a Dounce homogenizer at 4°C. The homogenate was centrifuged for 10 min at 500 x g,

and supernatant re-centrifuged for 20 min at 10000 x g. The resulting pellet (mitochondrial fraction)
was resuspended in 100µl RIPA buffer (50mM Tris-HCL pH 7.6, 150mM NaCl, 1% NaDOC, 1%
SDS, 5mM EDTA) and protein content determined (Bradford, 1976).
Coimmunoprecipitation (CoIP)
Mitochondria fraction from HEK cells were resuspended in 100µl RIPA buffer and protein content
determined (Bradford). IP was performed following the protocol from Zanna et al., 2008, with
minor modifications. Briefly, 250µg of mitochondrial proteins were incubated with 5µg primary
antibody cross-linked to protein A-Sepharose (Sigma) at 4°C for 3h. Immuno-precipitated
complexes were loaded on Biorad columns, centrifuged for 1 min at 500 x g, and 20µl of the
unbound eluates were collected and solubilised with 5µl Laemmli buffer. Columns were washed
five times with PBS then eluted in 400µl 7M Urea, 2M Thiourea, 2% Chaps. Eluates were
precipitated with acetone overnight at -20°C and resuspended in 25µl Laemmli buffer. The protein
A-Sepharose was resuspended in PBS and 20µl were solubilised with 5µl Laemmli buffer. Samples
were separated on 12% SDS-PAGE and analysed by Western blot using OPA3, OPA1, MFN2,
POLG, cyt c, and α-tubulin primary antibodies.
SDS-PAGE and Immunoblotting
30-40µg of proteins were solubilised in Laemmli sample buffer and boiled for 10 min. Samples
were separated on polyacrylamide gels. 8-12% gels were run in SDS running buffer for 1h and 30
min at 100V, according to the manufacturer’s instruction. After SDS-PAGE, the protein were
transferred onto a nitrocellulose membrane (0.22mm BioRad) or Hybond nitrocellulose
(Amarsham) using an apparatus (BioRad), in transfer buffer containing 20% of methanol. Transfer
was performed at RT for 1h at 100V, according to the manufacturer’s instructions. The membrane
was blocked with Tris-buffered saline (0.9% NaCl, 50mM Tris-HCl, pH 7.6) with 0.1% Tween 20
(TBS-T) containing 5% skin milk for 1h at RT, the hybridized with the primary antibody in
blocking solution overnight at 4°C, washed with TBS-T, hybridized with secondary antibody in
TBS-T with 0.5% milk for 1h at RT, and then washed with TBS-T. Immunodetection was
performed using the secondary horseradish-peroxidase conjugated anti-mouse/rabbit IgG (Sigma)
or with the anti-rabbit IgG-Alkaline phosphatise and revealed by BCIP/NBT. Membranes were
stained using the following antoobodies: OPA3 (1:500, Sigma), OPA1 (1:500, BD), POLG (1:500,
Abcam), α-tubulin (1:1000, Sigma), MFN2 (1:1000, Sigma), cyt c (1:500, BD), secondary anti-
mouse and anti-rabbit IgG-Hrp conjugated (Jackson immunoresearch 1:2000).
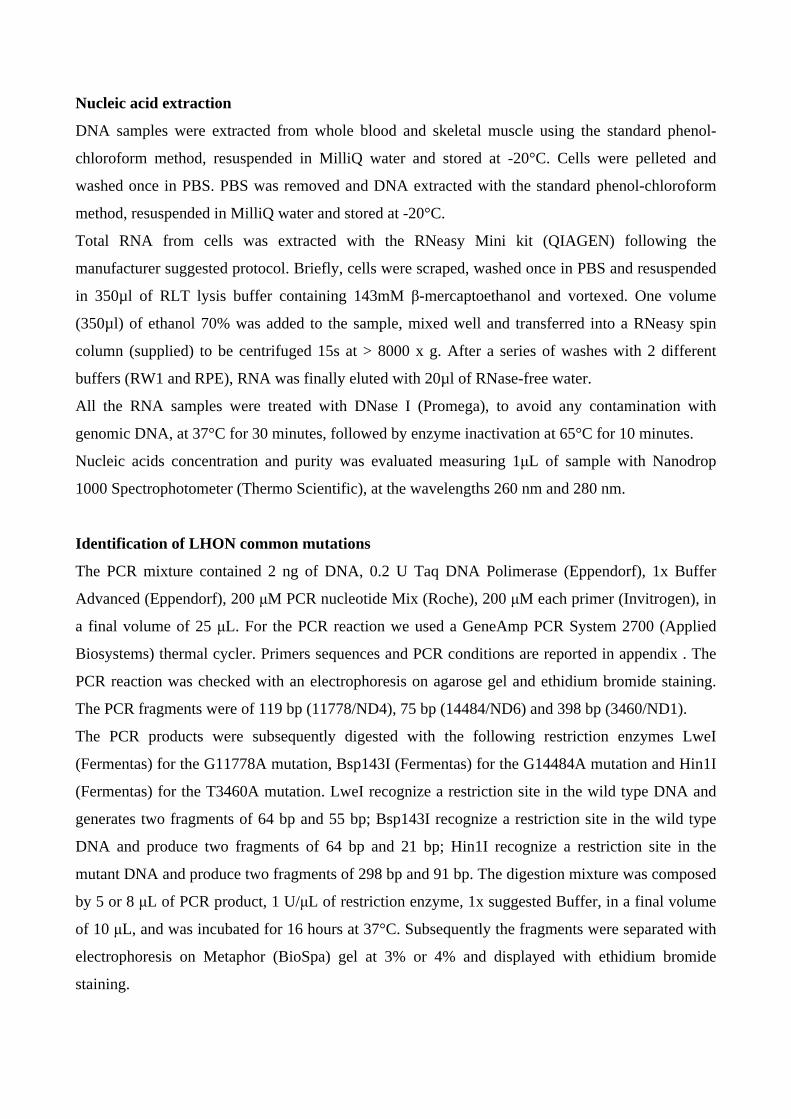
Nucleic acid extraction
DNA samples were extracted from whole blood and skeletal muscle using the standard phenol-
chloroform method, resuspended in MilliQ water and stored at -20°C. Cells were pelleted and
washed once in PBS. PBS was removed and DNA extracted with the standard phenol-chloroform
method, resuspended in MilliQ water and stored at -20°C.
Total RNA from cells was extracted with the RNeasy Mini kit (QIAGEN) following the
manufacturer suggested protocol. Briefly, cells were scraped, washed once in PBS and resuspended
in 350µl of RLT lysis buffer containing 143mM β-mercaptoethanol and vortexed. One volume
(350µl) of ethanol 70% was added to the sample, mixed well and transferred into a RNeasy spin
column (supplied) to be centrifuged 15s at > 8000 x g. After a series of washes with 2 different
buffers (RW1 and RPE), RNA was finally eluted with 20µl of RNase-free water.
All the RNA samples were treated with DNase I (Promega), to avoid any contamination with
genomic DNA, at 37°C for 30 minutes, followed by enzyme inactivation at 65°C for 10 minutes.
Nucleic acids concentration and purity was evaluated measuring 1µL of sample with Nanodrop
1000 Spectrophotometer (Thermo Scientific), at the wavelengths 260 nm and 280 nm.
Identification of LHON common mutations
The PCR mixture contained 2 ng of DNA, 0.2 U Taq DNA Polimerase (Eppendorf), 1x Buffer
Advanced (Eppendorf), 200 µM PCR nucleotide Mix (Roche), 200 µM each primer (Invitrogen), in
a final volume of 25 µL. For the PCR reaction we used a GeneAmp PCR System 2700 (Applied
Biosystems) thermal cycler. Primers sequences and PCR conditions are reported in appendix . The
PCR reaction was checked with an electrophoresis on agarose gel and ethidium bromide staining.
The PCR fragments were of 119 bp (11778/ND4), 75 bp (14484/ND6) and 398 bp (3460/ND1).
The PCR products were subsequently digested with the following restriction enzymes LweI
(Fermentas) for the G11778A mutation, Bsp143I (Fermentas) for the G14484A mutation and Hin1I
(Fermentas) for the T3460A mutation. LweI recognize a restriction site in the wild type DNA and
generates two fragments of 64 bp and 55 bp; Bsp143I recognize a restriction site in the wild type
DNA and produce two fragments of 64 bp and 21 bp; Hin1I recognize a restriction site in the
mutant DNA and produce two fragments of 298 bp and 91 bp. The digestion mixture was composed
by 5 or 8 µL of PCR product, 1 U/µL of restriction enzyme, 1x suggested Buffer, in a final volume
of 10 µL, and was incubated for 16 hours at 37°C. Subsequently the fragments were separated with
electrophoresis on Metaphor (BioSpa) gel at 3% or 4% and displayed with ethidium bromide
staining.

Restriction fragment length polymorphism (RFLP) assay for nuclear genes polymorphisms
The PCR mixture contained 2 ng of DNA, 0.2 U Taq DNA Polimerase (Eppendorf), 1x Buffer
Advanced (Eppendorf), 200 µM PCR nucleotide Mix (Roche), 200 µM each primer (Invitrogen), in
a final volume of 25 µL.
For the PCR reaction we used a GeneAmp PCR System 2700 (Applied Biosystems) thermal cycler.
Primers sequences and PCR conditions are reported in appendix. The PCR reaction was checked
with an electrophoresis on agarose gel and ethidium bromide staining.
The PCR products was subsequently digested with different restriction enzymes (Fermentas). The
digestion mixture was composed by 5 or 8 µL of PCR product, 1 U/µL of restriction enzyme, 1x
suggested Buffer, in a final volume of 10 µL, and was incubated at condition of time and
temperature suggested by the manufacturers . Subsequently the fragments were separated with
electrophoresis on Metaphor (BioSpa) gel at 4% or agarose gel at 3% and displayed with ethidium
bromide staining.
Mitochondrial DNA copy number evaluation
Absolute quantification of mtDNA relative to nuclear DNA (nDNA) was performed by a real-time
PCR based method using the LightCycler480 (Roche). This method is a multiplex assay based on
hydrolysis probe chemistry. A mtDNA fragment (ND2 gene) and a nDNA fragment (FasL gene)
were co-amplified by multiplex polymerase chain reaction according to the primers, probes and
conditions previously published (Cossarizza et al., 2003). These two fragments were cloned tale to
tale in a vector and serial dilutions were used to construct a standard curve, obtaining a ratio of 1:1
of the reference molecules. Primers and probes sequences and PCR conditions are available on
request.
Reverse transcription and quantitative assay for gene expression
Reverse transcription was performed on extracted RNA, using Transcriptor First Strand cDNA
Synthesis Kit (Roche) and following the manufacturer’s protocol. The cDNA was generated
performing a reverse transcription of 1µg of total RNA using random hexameric primers.
Absolute mRNA quantification was performed by a real-time PCR based method using the
instrument LightCycler480 (Roche). Standard curves using a cDNA reference sample were used to
determinate concentrations of OPA3V1, OPA3V2, OPA1 genes. The amount of target genes were
normalized for the concentration of a reference gene (RPL27).
Statistical analysis

Statistical analysis was performed using the SigmaStat ver.3.5 software package, choosing the most
appropriate test. Student t-test or paired t-test were performed to compare two different groups of
data, while ANOVA Dunn’s test, ANOVA Holm-Sidak or Mann-Whitney test were performed to
compare more than two groups. Fisher’s exact test or χ2 test were used to correlate frequencies and
proportions, and a multiple linear regression was performed to analyse combinations of genotypes.
Data were considered significantly different for p-values < 0.05.

Results
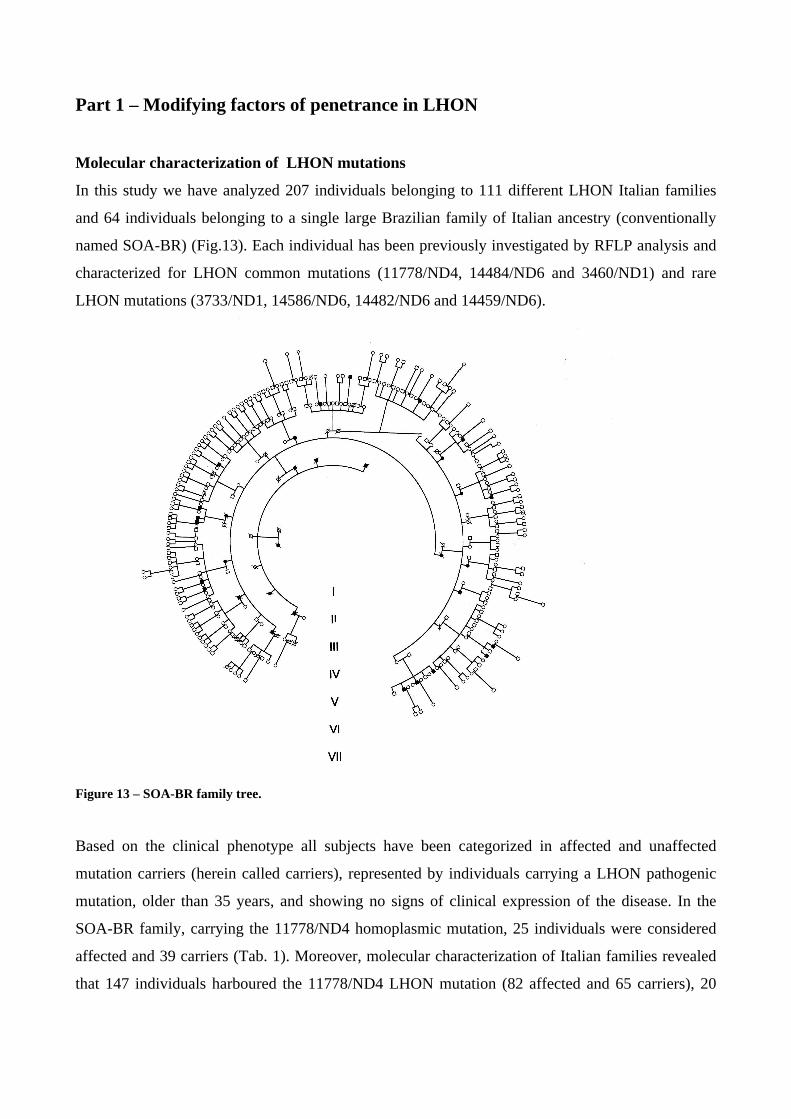
Part 1 – Modifying factors of penetrance in LHON
Molecular characterization of LHON mutations
In this study we have analyzed 207 individuals belonging to 111 different LHON Italian families
and 64 individuals belonging to a single large Brazilian family of Italian ancestry (conventionally
named SOA-BR) (Fig.13). Each individual has been previously investigated by RFLP analysis and
characterized for LHON common mutations (11778/ND4, 14484/ND6 and 3460/ND1) and rare
LHON mutations (3733/ND1, 14586/ND6, 14482/ND6 and 14459/ND6).
Figure 13 – SOA-BR family tree.
Based on the clinical phenotype all subjects have been categorized in affected and unaffected
mutation carriers (herein called carriers), represented by individuals carrying a LHON pathogenic
mutation, older than 35 years, and showing no signs of clinical expression of the disease. In the
SOA-BR family, carrying the 11778/ND4 homoplasmic mutation, 25 individuals were considered
affected and 39 carriers (Tab. 1). Moreover, molecular characterization of Italian families revealed
that 147 individuals harboured the 11778/ND4 LHON mutation (82 affected and 65 carriers), 20

individuals had the 14484/ND6 mutation (10 affected and 10 carriers), 36 individuals had the
3460/ND1 mutation (19 affected and 17 carriers) and 4 individuals had rare mutations (Tab. 1).
FAMILY MUTATION AFFECTED CARRIER TOTAL
SOA-BR 11778/ND4 25 39 64
ITALIAN 11778/ND4 82 65 147
14484/ND6 10 10 20
3460/ND1 19 17 36
RARE 4 4
Table 1 – LHON affected and carriers from SOA-BR and Italian families.
Mitochondrial DNA evaluation in LHON individuals
The mtDNA content has been determined in DNA samples extracted from peripheral blood of the
large SOA-BR Brazilian family and from selected individuals belonging to the Italian families. For
this analysis two approaches have been carried out. First, we examined the mtDNA content in the
25 affected individuals and the 39 carriers of the SOA-BR family, comparing them with a control
group consisting in 70 unrelated Brazilian individuals. Next, we repeated the analysis on the Italian
patients, selecting those carrying the homoplasmic LHON mutations and comparing one affected
individual, usually the proband, with one asymptomatic carrier on the same maternal lineage,
siblings when it was possible. Therefore, we analysed 39 affected individuals, and their
corresponding 39 carriers, 21 harbouring the 11778/ND4 mutation, 5 harbouring the 11484/ND6
mutation and 13 harbouring the 3460/ND1 mutation. Lastly, we evaluated the mtDNA content also
in DNA samples extracted from skeletal muscle biopsies in 13 controls and 31 LHON individuals
harbouring the 11778/ND4 and 3460/ND1 mutations (25 affected and 6 carriers).
In the SOA-BR family the mtDNA copy number/cell resulted significantly higher in the individuals
harbouring the mutation respect to the controls (p<0.001). In turn, the carrier individuals showed a
significantly higher mtDNA copy number/cell value compared to the affected individuals
(p<0.001). In the control group the average value of mtDNA copy number/cell was 181±7, whereas
Brazilian affected and carriers had respectively 358±18 and 550±26 (Fig. 14).
The distributions of mtDNA copy number in the three groups examined divided for sex are reported
in figure 15. The mtDNA copy number resulted normally distributed in controls and affected
individuals (Fig. 15A), whereas in carriers two peaks were easily distinguishable (Fig. 15A). In
control population no differences were found in males and females, being both normally distributed

(Fig. 15D). On the contrary, a reduced mtDNA content in females carriers respect to males led to
the presence of two peaks in both these distributions (Fig. 15C). In ~ 83% of male carriers the
mtDNA content overcame the value of 500 copies/cell, whereas in females only the 37% reached
this number.
SOA-BR
0
100
200
300
400
500
600
700
WT AFFECTED CARRIER
mtD
NA
cop
y nu
mbe
r/ce
ll
Figure 14 – Mitochondrial DNA copy number in Brazilian controls and SOA-BR affected and carriers. Data are reported as average ± SEM. Asterisks indicate statistical significance (at least p<0.05).
The evaluation of mtDNA copy number in the 39 Italian families reproduced the results from the
SOA-BR family analysis. Figure 16 shows the increase in mtDNA content in the unaffected carriers
compared to the affected individuals and this feature was similar indipendently from the LHON
mutation. In affected individuals the average values of mtDNA copy number were 305±14
(11778/ND4), 340±11 (14484/ND6) and 315±14 (3460/ND1), whereas in LHON carriers were
688±21 (11778/ND4), 660±77 (14484/ND6) and 583±41 (3460/ND1). The difference between
affected and carrier is statistically significant for all the three LHON mutations (p<0.001 for
11778/ND4 and 3460/ND1 and p=0.011 for 14484/ND6). In spite of what we observed in the SOA-
BR, the distribution of mtDNA copy number of the Italian families were normally distributed, both
in affected and carrier groups. This is probably due to the different design of the study, being for the
SOA-BR an intra-familiar study and for the Italian families an association study.
*
*

Figure 15 – Mitochondrial DNA distributions in controls and SOA-BR affected and carrier. A) Distribution in affected, carrier and controls individuals. B) Distribution in males and females affected. C) Distribution in males and females carriers. D) Distribution in males and females controls.
Italian families
0
100
200
300
400
500
600
700
800
11778 14484 3460
mtD
NA
co
py
nu
mb
er/c
ell
AFFECTED
CARRIER
Figure 16 - Mitochondrial DNA copy number in Italian affected and carriers. Data are reported as average ± SEM. Asterisks indicate statistical significance (at least p<0.05).
The mtDNA quantification in DNA extracted from skeletal muscle biopsies confirmed the results
obtained in the previous analysis on blood samples. Also in this tissue, the mtDNA copy number
was higher in LHON affected and carriers than in controls (p≤0.001), and carriers showed a higher
mtDNA content compared to the affected individuals (p<0.05), although this difference is less
05
10152025
303540
4550
0 1 2 3 4 5 6 7 8 9 10 11 12 13 14 15
mtDNA copy number/cell x 100
nu
mb
er o
f in
div
idu
als
AFFECTED
CARRIER
CTRL
0123456789
10
0 1 2 3 4 5 6 7 8 9 10 11 12 13 14 15
mtDNA copy number/cell x 100
nu
mb
er o
f in
div
idu
als
CARRIER
MALES
FEMALES
0123456789
10
0 1 2 3 4 5 6 7 8 9 10 11 12 13 14 15
mtDNA copy number/cell x 100
nu
mb
er o
f in
div
idu
als
AFFECTED
MALES
FEMALES
05
101520253035404550
0 1 2 3 4 5 6 7 8 9 10 11 12 13 14 15
mtDNA copy number/cell x 100
nu
mb
er o
f in
div
idu
als
CTRL
MALES
FEMALES
A B
C D
* *
*

pronounced compared to SOA-BR and Italian blood samples, probably because of the limited
number of carriers analysed. We found an average value of 5450 ± 336 in controls, 6853 ± 243 in
affected individuals and 8065 ± 485 in carrier individuals (Fig. 17).
All these results suggest the existence of a compensatory mechanism, due to the presence of LHON
mutations, being the controls and LHON individuals clearly distinguishable based on their mtDNA
content. In particular, the unaffected carriers seem to have a higher efficiency in upregulating
mtDNA copy number than affected individuals, making this parameter a possible biomarker of a
modifying mechanism regulating LHON penetrance.
0
1000
2000
3000
4000
5000
6000
7000
8000
9000
10000
WT AFFECTED CARRIERS
mtD
NA
co
py
nu
mb
er/c
ell
Figure 17 – Mitochondrial DNA quantification in controls and LHON skeletal muscles. Data are reported as average ± SEM. Asterisks indicate statistical significance (at least p<0.05).
Screening of polymorphisms in nuclear genes involved in the regulation of mitochondrial
biogenesis
The results from the previous section strongly support a role for mitochondrial biogenesis in the
modulating LHON penetrance. Thus, we investigated genetic variants in some of the genes
regulating this process and regulating specifically mtDNA replication. We selected single
nucleotide polymorphisms (SNPs) already reported in literature as associated with diseases or
having a functional activity. We screened SNPs in the coding region of PGC-1α, PGC-1β, p53,
Tfam, and two SNPs in PARL, one in the coding region and one in the promoter (Table 2).
The screening of the genetic variants of these genes was carried out on the previously described
SOA-BR family (25 affected and 39 carriers), analysing DNA extracted from peripheral blood by
RFLP. The affected and carrier individuals were compared, considering genotypes and alleles
frequencies. The off-pedigree group has been genotyped to provide reference frequencies of a
*
*

Brazilian control population. Moreover, a possible correlation between genotypes and mtDNA copy
number has been investigated.
GENE SNP SNP rs# CLUSTER
ID REFERENCE
PGC-1α Gly482Ser rs8192678 Choi et al., 2006
PGC-1β Ala203Pro rs7732671 Wirtenberger et al., 2007
p53 Arg72Pro rs1042522 Matlashewski et al., 1986
Tfam Ser12Thr rs1937 Günther et al., 2004
PARL -191T/C rs3792589 Curran et al., 2010
PARL Leu262Val rs3732581 Powell et al., 2008
Table 2 – SNPs in genes involved in mitochondrial biogenesis analysed.
None of the six genetic variants analysed resulted associated with the status of affected or carriers,
being genotypes and alleles frequencies not statistically different in the three groups (Fig. 18-19).
Furthermore, no correlation between SNPs and mtDNA content was found (not shown).
PGC-1alpha Gly482Ser
0
10
20
30
40
50
60
70
80
90
100
G/ G G/ S S/ S
% f
req
uen
cies
AFF
CAR
OFF
PGC-1beta Ala203Pro
0
10
20
30
40
50
60
70
80
90
100
A/ A A/ P P/ P
% f
req
uen
cies
AFF
CAR
OFF
p53 Arg72Pro
0
10
20
30
40
50
60
70
80
90
100
R/ R R/ P P/ P
% f
req
uen
cies
AFF
CAR
OFF
PARL Leu212Val
0
10
20
30
40
50
60
70
80
90
100
V/ V V/ L L/ L
% f
req
uen
cies
AFF
CAR
OFF
PARL -191T/C
0
10
20
30
40
50
60
70
80
90
100
T/ T T/ C C/ C
% f
req
uen
cies
AFF
CAR
OFF
Tfam
0
10
20
30
40
50
60
70
80
90
100
S/ S S/ T T/ T
% f
req
uen
cies
AFF
CAR
OFF
Figure 18 – Genotypes distributions in off-pedigree individuals and in SOA-BR affected and carrier individuals.

PGC-1alpha Gly482Ser
01020
3040506070
8090
100
G S
% f
req
uen
cies AFF
CAR
OFF
PGC-1beta Ala203Pro
010
2030
405060
7080
90100
A P
% f
req
uen
cies AFF
CAR
OFF
p53 Arg72Pro
010
2030
405060
7080
90100
R P
% f
req
uen
cies AFF
CAR
OFF
PARL Leu212Val
010
2030
405060
7080
90100
V L
% f
req
uen
cies AFF
CAR
OFF
PARL -191T/C
010
2030
405060
7080
90100
T C
% f
req
uen
cies AFF
CAR
OFF
Tfam
010
2030
4050
6070
8090
100
S T
% f
req
uen
cies AFF
CAR
OFF
PGC-1alpha Gly482Ser
01020
3040506070
8090
100
G S
% f
req
uen
cies AFF
CAR
OFF
PGC-1beta Ala203Pro
010
2030
405060
7080
90100
A P
% f
req
uen
cies AFF
CAR
OFF
p53 Arg72Pro
010
2030
4050607080
90100
R P
% f
req
uen
cies AFF
CAR
OFF
PARL Leu212Val
010
2030
405060
7080
90100
V L
% f
req
uen
cies AFF
CAR
OFF
PARL -191T/C
010
2030
405060
7080
90100
T C
% f
req
uen
cies AFF
CAR
OFF
Tfam
010
2030
4050
6070
8090
100
S T
% f
req
uen
cies AFF
CAR
OFF
Figure 19 – Alleles distributions in off-pedigree individuals and in SOA-BR affected and carrier individuals.
Screening of polymorphisms in nuclear genes involved in the antioxidant machinery
Since the increase in ROS production is one of the consequences of complex I impairment in
LHON, we screened six SNPs by RFLP in five nuclear genes with involved in buffering oxidative
stress. Also in this study we selected SNPs already reported in literature as associated with diseases
or having a functional activity. The genetic variants were located in the coding region of MnSOD
and GPx and in the promoter or intronic regions of Cu/ZnSOD, catalase and aldose reductase (Table
3).
GENE SNP SNP rs# CLUSTER
ID REFERENCE
MnSOD Ala16Val rs4880 Ambrosone et al.,1999
GPx1 Pro198Leu rs1050450 Sutton et al., 2006
Cu/ZnSOD +35A/C rs2234694 Young et al., 2006
CAT -21A/T rs7943316 Podgoreanu et al., 2006
CAT -262C/T rs1049982 Forsberg et al., 2001
ALDR1 -106C/T rs759853 Granier et al., 2008
Table 3 – SNPs in antioxidant genes analysed.
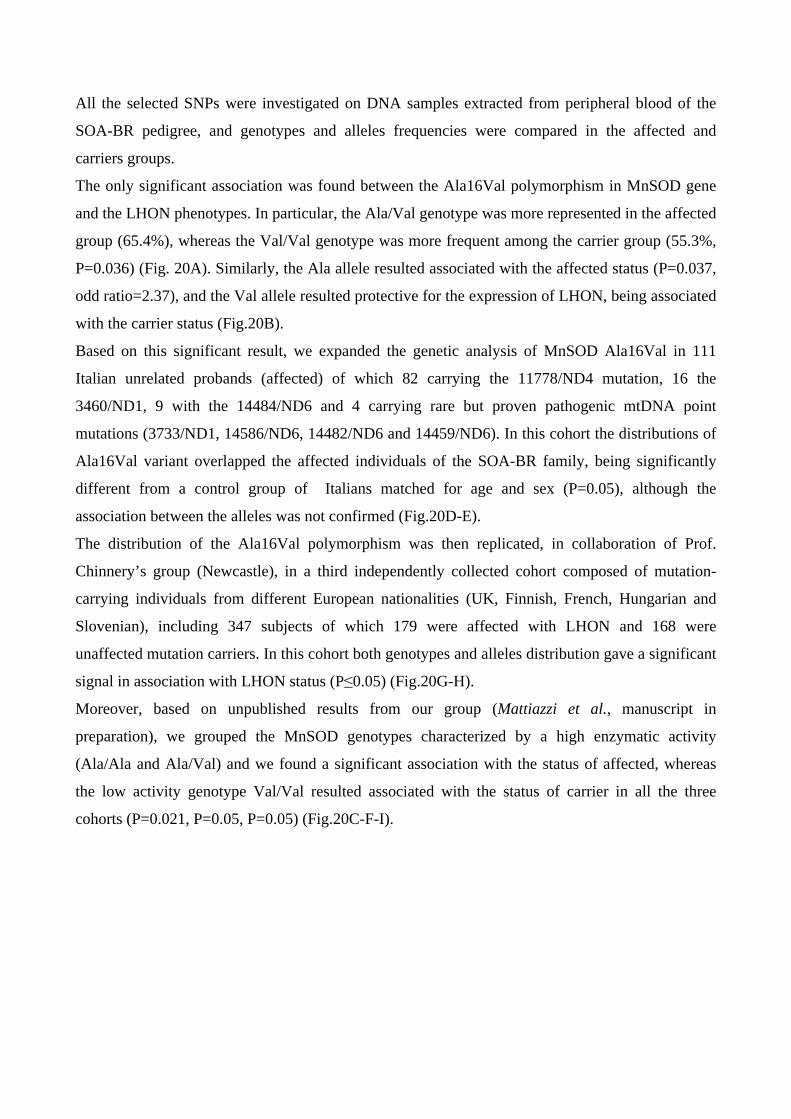
All the selected SNPs were investigated on DNA samples extracted from peripheral blood of the
SOA-BR pedigree, and genotypes and alleles frequencies were compared in the affected and
carriers groups.
The only significant association was found between the Ala16Val polymorphism in MnSOD gene
and the LHON phenotypes. In particular, the Ala/Val genotype was more represented in the affected
group (65.4%), whereas the Val/Val genotype was more frequent among the carrier group (55.3%,
P=0.036) (Fig. 20A). Similarly, the Ala allele resulted associated with the affected status (P=0.037,
odd ratio=2.37), and the Val allele resulted protective for the expression of LHON, being associated
with the carrier status (Fig.20B).
Based on this significant result, we expanded the genetic analysis of MnSOD Ala16Val in 111
Italian unrelated probands (affected) of which 82 carrying the 11778/ND4 mutation, 16 the
3460/ND1, 9 with the 14484/ND6 and 4 carrying rare but proven pathogenic mtDNA point
mutations (3733/ND1, 14586/ND6, 14482/ND6 and 14459/ND6). In this cohort the distributions of
Ala16Val variant overlapped the affected individuals of the SOA-BR family, being significantly
different from a control group of Italians matched for age and sex (P=0.05), although the
association between the alleles was not confirmed (Fig.20D-E).
The distribution of the Ala16Val polymorphism was then replicated, in collaboration of Prof.
Chinnery’s group (Newcastle), in a third independently collected cohort composed of mutation-
carrying individuals from different European nationalities (UK, Finnish, French, Hungarian and
Slovenian), including 347 subjects of which 179 were affected with LHON and 168 were
unaffected mutation carriers. In this cohort both genotypes and alleles distribution gave a significant
signal in association with LHON status (P≤0.05) (Fig.20G-H).
Moreover, based on unpublished results from our group (Mattiazzi et al., manuscript in
preparation), we grouped the MnSOD genotypes characterized by a high enzymatic activity
(Ala/Ala and Ala/Val) and we found a significant association with the status of affected, whereas
the low activity genotype Val/Val resulted associated with the status of carrier in all the three
cohorts (P=0.021, P=0.05, P=0.05) (Fig.20C-F-I).
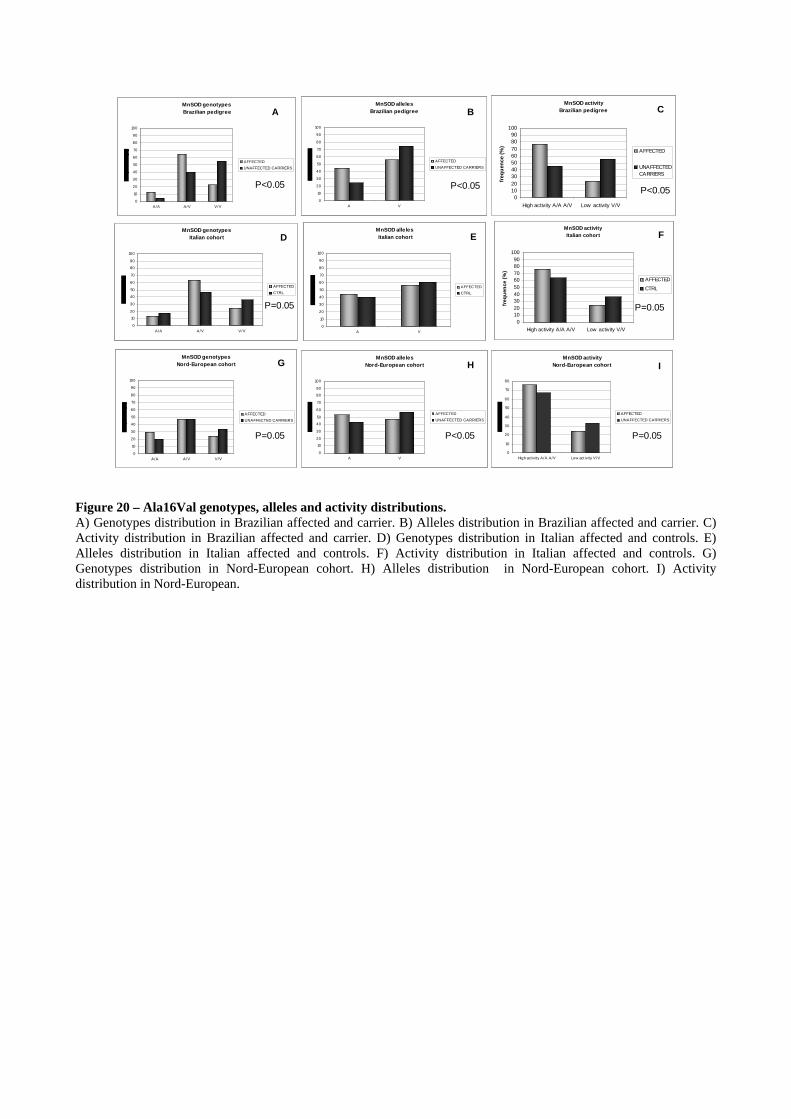
MnSOD genotypes Brazilian pedigree
0
10
20
30
40
50
60
70
80
90
100
A/A A/V V/V
AFFECTED
UNAFFECTED CARRIERS
MnSOD alleles Brazilian pedigree
0
10
20
30
40
50
60
70
80
90
100
A V
AFFECTED
UNAFFECTED CARRIERS
MnSOD activity Brazilian pedigree
0102030405060708090
100
High activity A/A A/V Low activity V/V
freq
uen
ce (
%)
AFFECTED
UNAFFECTEDCARRIERS
MnSOD genotypes Italian cohort
0
10
20
30
40
50
60
70
80
90
100
A/A A/V V/V
AFFECTED
CTRL
MnSOD alleles Italian cohort
0
10
20
30
40
50
60
70
80
90
100
A V
AFFECTED
CTRL
MnSOD activity Italian cohort
0102030405060708090
100
High activity A/A A/V Low activity V/V
freq
uen
ce (
%)
AFFECTED
CTRL
MnSOD genotypes Nord-European cohort
0
10
20
30
40
50
60
70
80
90
100
A/A A/V V/V
AFFECTED
UNAFFECTED CARRIERS
MnSOD alleles Nord-European cohort
0
10
20
30
40
50
60
70
80
90
100
A V
AFFECTED
UNAFFECTED CARRIERS
MnSOD activity Nord-European cohort
0
10
20
30
40
50
60
70
80
High act ivity A/A A/V Low act ivity V/V
AFFECTED
UNAFFECTED CARRIERS
P<0.05 P<0.05 P<0.05
P=0.05 P=0.05
P=0.05 P<0.05 P=0.05
A B C
D E F
G H I
Figure 20 – Ala16Val genotypes, alleles and activity distributions. A) Genotypes distribution in Brazilian affected and carrier. B) Alleles distribution in Brazilian affected and carrier. C) Activity distribution in Brazilian affected and carrier. D) Genotypes distribution in Italian affected and controls. E) Alleles distribution in Italian affected and controls. F) Activity distribution in Italian affected and controls. G) Genotypes distribution in Nord-European cohort. H) Alleles distribution in Nord-European cohort. I) Activity distribution in Nord-European.

Part 2 – Elucidating the mitochondrial function of OPA3 and its role in ADOAC
pathogenesis
OPA3 isoforms expression in different mouse tissues and in Hela cells
The amount of OPA3V1 and OPA3V2 transcripts has been measured by a quantitative Real Time-
PCR in different tissues from a 7 days old mouse. The qRT-PCR was carried out on total RNA
samples extracted from frozen kidney, lung, skeletal muscle, liver, retina, heart, brain and cochlea.
The gene expression of OPA3 isoforms in each tissue has been compared with OPA1 mRNA
content, using primers recognizing all OPA1 isoforms. The ribosomal protein RPL27 has been used
as reference.
Although OPA3V1 seemed to be more expressed than OPA1 in most of the tissues analyzed, the
pattern of expression resulted comparable to OPA1, except for the brain where the OPA1 content
was much higher than OPA3V1 (Fig 21). Similar to results previously published by others,
OPA3V2 clearly showed a lower expression level compared with both OPA3V1 (from a minimum
of 4 fold of difference in lung to a maximum of 9 fold in heart) and OPA1, reaching their mRNA
content only in the cochlea, where OPA3V1 and OPA1 seemed to have a very low expression (Fig.
21).
OPA3 isoforms transcripts were quantified also in HeLa cells and compared with OPA1 total
mRNA content. Also in these cells OPA3V1 showed an higher gene expression than OPA1,
whereas OPA3V2 resulted expressed at very low levels (~ 40 fold less express than OPA3V1) (Fig.
22).
OPA3 expression in mouse tissues
0
0,2
0,4
0,6
0,8
1
1,2
1,4
1,6
KIDNEY
LUNG
MUSCLE
LIVER
RETINA
HEART
BRAIN
COCHLEA
mR
NA
rel
ativ
e ex
pre
ssio
n
OPA3V1/RPL27
OPA3V2/RPL27
OPA1/RPL27
Figure 21 – Relative gene expression of OPA3V1, OPA3V2, OPA1 in different mouse tissues. Data are normalized for RPL27 gene expression and reported as average (3 independent experiments) ± SEM.

Figure 22- Relative gene expression ofOPA3V1, OPA3V2 and OPA1 in HeLa cells Data are normalized for RPL27 gene expression and reported as average (3 independent experiments) ± SEM.
The expression of OPA3V1 and OPA3V2 was qualitatively evaluated by Immunofluorescence in
slices of mouse retina. Home made polyclonal antibodies generated in rabbit and specific for
OPA3V1 and OPA3V2 were used to characterize the expression of the two isoforms in the different
cellular types constituting the retina. Retinal ganglion cells were stained with a monoclonal
antibody against BRN3A, a specific marker of these cells, and nuclei were stained with Hoechst.
Both variants showed a widespread expression in the different retina layers, even if the picks of
expression were in retinal ganglion cells (RGCs) and photoreceptors, both cell types being enriched
in mitochondria. Moreover, OPA3V1 had qualitatively a higher expression in RGCs than OPA3V2,
confirming the results from qRT-PCR (Fig. 23).
Figure 23 – Immunofluorescence on mouse retina. A) Staining for OPA3V1(green), nuclei (blue) and RGCs (pink). B) Staining for OPA3V2 (green), nuclei (blue) and RGCs (pink). OPA3V1, OPA3V2 and OPA3V1-G93S over-expression in HeLa cells
MERGE MERGE NUCLEI NUCLEI
OPA3V1 OPA3V2 RGCs RGCs
A B

To investigate the possible role played by OPA3 in mitochondria, we transfected HeLa cells with
plasmids expressing OPA3V1, OPA3V2 and OPA3V1 carrying the dominant mutation G93S (exon
2), causative for ADOAC. After confirmation by Western blot of the increased proteins expression
due to the transfection, we evaluated different mitochondrial functional indicators such as the
integrity of mitochondrial network, the mitochondrial membrane potential, the mtDNA content and
the susceptibility to apoptosis after treatment with a pro-apoptotic compound (staurosporine).
HeLa cells transfected with pCDNA-OPA3V1, pCDNA-OPA3V2, and pcDNA-OPAV1-G93S
plasmids were pelleted and after 24 hours cells lysated and proteins were extracted. 30 µg of
proteins were analysed by SDS-PAGE, transferred on a nitrocellulose membrane and blotted for
OPA3V1 and OPA3V2, using α-tubulin as reference. Two distint membranes have been assessed to
discriminate the OPA3 variants. Interestingly, both OPA3V1 and OPA3V2 were not detectable in
the control untransfected sample, whereas it was evident the efficiency and specificity of the over-
expression in all the transfected sample (Fig. 24).
Figure 24 – Western blot on HeLa transfected cells. Left side was blotted for OPA3V1and α-tubulin, right side was blotted for OPA3V2 and α-tunulin. Lane 1 untransfected cells, lane 2 pCDNA-OPA3V1, lane 3 pcDNA-OPA3V2, lane 4 pcDNA-OPA3G93S. Mitochondrial network morphology evaluation
HeLa cells were transfected using plasmids expressing the target protein fused with the yellow
fluorescent protein (YFP): pEYFP, pEYFP-OPA3V1, pEYFP-OPA3V2, pEYFP-OPA3V1G93S,
and pEYFP-AIF. After 24 hours, cells were fixed and processed for immunostaining. An antibody
against the ATP synthase was used to visualize the mitochondrial network and the fluorescence
emitted from the YFP was used to identify transfected cells. Transfection with a plasmid expressing
the mitochondrial protein AIF was used as a control.
Transfection with a plasmid expressing only the YFP gave a diffuse green fluorescence in the cells
and the staining for ATP synthase in red defined a normal mitochondrial network, with tubular
mitochondria extending on the whole cellular body. On the contrary, the over-expression of both
OPA3V1 and OPA3V2 produced mitochondria aggregation and the complete disappearance of
tubular mitochondria, leading to the loss of mitochondrial network integrity. OPA3V1
overexpression seemed to cause a more severe damage compared to OPA3V2. In fact, OPA3V2
overexpression led to aggregation but mitochondria seemed to have a more scattered distribution in
the cytoplasm compared to cells overexpressing both wild-type and mutant OPA3V1 . No
consequences in the network morphology have been observed by inducing AIF expression (Fig.
25).
Figure 25 – Mitochondrial network estimation in HeLa transfected cells HeLa cells were transfected with plasmids expressing YFP and the target protein. The mitochondrial network was stained with Ab anti-ATP synthase.
Mitochondrial membrane potential estimation
The mitochondrial membrane potential has been evaluated using the fluorescent probe JC-1. The
dye undergoes a reversible change in fluorescence emission from green to red as mitochondrial
membrane potential increases. Cells with high membrane potential promote the formation of dye
aggregates, which fluoresce red; cells with low potential will contain monomeric JC-1 and fluoresce
green.

HeLa cells were transfected with plasmids containing the green fluorescent protein (GFP) and the
target proteins, which are not fused in the same construct, thus expressed independently: pIRES-
GFP, pIRES-GFP-OPA3V1, pIRES-GFP-OPA3V2, pIRES-GFP-OPA3V1G93S.
The cells overexpressing the GFP alone, showed an homogeneous green fluorescence overlapping
the JC-1 green fluorescence, and concomitantly the red fluorescence due to the formation of JC-1
aggregates, evidencing a high mitochondrial potential. Interestingly, the over-expression of
OPA3V1, OPA3V2 and OPA3V1G93S produced a consistent loss of membrane potential, as
documented by the complete disappearance of the red fluorescence in transfected cells (Fig. 26).
Figure 26 – Membrane potential assessment in HeLa transfected cells. Hela cells were transfected with plasmids coexpressing the GFP and the target proteins. Mitochondrial membrane potential was revealed using the JC-1 dye.
Measurement of the susceptibility to apoptosis
HeLa cells were transfected with pIRES-GFP, pIRES-GFP-OPA3V1, pIRES-GFP-OPA3V2 and
pIRES-GFP-OPA3V1G93S and after 24 hours were treated with staurosporine, a pro-apoptotic
compound, for three hours. After the incubation cells were fixed and nuclei were stained with
Hoescht. Nuclei morphology was observed microscopically, and 100 cells for each sample were
counted, distinguishing apoptotic cells with chromatin condensation and non-apoptotic cells with
normal nuclei.

Over-expression of OPA3V1, OPA3V2 and OPA3V1G93S produced no effect on the apoptosis,
having the three samples the same percentage of apoptotic cells as the control (GFP only). On the
contrary, after incubation with staurosporine the percentage of apoptotic cells increased in cells
overexpressing OPA3V1, OPA3V2 and OPA3V1G93S, being significantly different from the
control transfected with the GFP alone (p<0.001). The increase of apoptotic cell number was not
different in cells over-expressing the mutant OPA3V1 compared to those overexpressing the wild-
type protein (Fig. 27).
Figure 27 – Quantification of apoptotic nuclei in HeLa transfected cells Data are reported as average (3 experiments) ± SEM. Asterisks indicates statistic significance associated to a p<0.001.
Mitochondrial DNA content quantification
To investigate if overexpression of OPA3 had consequences on mtDNA maintenance and
replication, HeLa cells were transfected with pCDNA, pCDNA-OPA3V1, pCDNA-OPA3V2 and
cotransfected with both pCDNA-OPA3V1 and pCDNA-OPA3V2. After 24 hours, cells were
pelleted, the DNA was extracted and analysed by quantitative Real Time-PCR.
We found average mtDNA copy values of 1434 ± 115 in untransfected cells, 1521 ± 121 in cells
transfected with pCDNA, 1362 ± 46 in cells overexpressing OPA3V1, 1456 ± 30 in cells
overexpressing OPA3V2, and 1247 ± 70 in cells overexpressing both OPA3V1 and OPA3V2.
Thus, no significant differences in mtDNA content were observed between the samples and cells
over-expressing OPA3 showed almost the same mtDNA copy number than the untransfected cells
or cells expressing the plasmid without the target proteins (Fig. 28).

Figure 28 – Mitochondrial DNA quantification in Hela transfected cells Data are reported as average (3 independent experiments) ± SEM.
OPA3 isoforms silencing in HeLa cells
To investigate the effects of OPA3 loss, we selectively inhibited the expression of endogenous
OPA3 variants using a silencing approach. siRNAs matching Ex1, Ex2, and Ex2b were transfected
into HeLa cells and the effects on mitochondrial function were investigated using the same
parameters evaluated in the overexpression experiment. For all the studies consisting in microscopy
observations, we used a kit able to stain specifically siRNAs molecules, making possible the
selective analysis of transfected cells.
The efficiency and specificity of siRNAs was measured by quantification of the OPA3 transcripts
in Real Time-PCR after 24, 48 and 72 hours from transfection, using RPL27 as reference. Since the
silencing efficiency resulted independent from the time, we decided to study the mitochondrial
functions after 48 hours from transfection. The effects of silencing on OPA3 isoforms gene
expression are reported in figure 29. Transfecting cells with siEx1, we were able to abolish about
80% of OPA3V1 and OPA3V2 mRNA expression (P<0.001), being the Ex1 present in both the
variants. The effect of siEx2 was specific for OPA3V1, producing about 90% of decrease in mRNA
expression (P<0.001), whereas siEx2b showed a decrease of 70% of OPA3V2 (P<0.001).
Interestingly, the suppression of OPA3V1 induced by siEx2, produced an increase in OPA3V2 gene
expression (P=0.02) and vice versa an increase of OPA3V1 gene expression was found in cells
treated with siEx2b (P=0.01).

Figure 29 – OPA3 gene expression after 48h from silencing HeLa cells were transfected with a scramble siRNA, siEx1, siEx2 and siEx2b. After 48 hours OPA3 transcripts were quantified. Data are shown normalized for the expression in the scramble and as average (3 independent experiments) ± SEM.
Mitochondrial network morphology evaluation
HeLa cells were transfected with a scramble siRNA, siEx1, siEx2, and siEx2b and after 48h were
incubated with Mitotracker Red for 20 minutes and observed at microscope.
The qualitative evaluation of mitochondrial network demonstrated that there were no differences
between cells transfected with the scramble siRNA and cells transfected with siEx1, siEx2 and
siEx2b. Moreover, no differences have been observed silencing both isoforms (siEx1) or OPA3V1
(siEx2) and OPA3V2 (siEx2b) separately. In the figure 30, representative pictures of mitochondrial
network are reported.
Mitochondrial membrane potential estimation
The membrane mitochondrial potential has been estimated after 48 hours from the silencing. HeLa
cells were transfected with scramble siRNA, siEx1, siEx2 and siEx2b and after 48 hours have been
incubated with JC-1 dye for 20 minutes.
The microscopy observation showed no drastic differences between cells transfected with the
scramble siRNA and those transfected with siRNA specific for OPA3 isoforms, the latter exhibiting
the typical red spots corresponding to high membrane potential sites and formation of J-aggregates.
No differences have been observed between cells silenced for both the variant simultaneously and
cells silenced for OPA3V1 and OPA3V2 separately (Fig. 31).

Figure 30 – Mitochondrial network evaluation in HeLa transfected cells
Figure 31 – Mitochondrial membrane potential evaluation in HeLa transfected cells
Measurement of the susceptibility to apoptosis
HeLa cells were transfected with scramble siRNA, siEx1, siEx2, siEx2b and after 48 hours treated
with staurosporine, a pro-apoptotic compound for three hours. After the incubation cells were fixed
and nuclei were stained with Hoescht. Nuclei morphology was observed microscopically, and 100

cells for each sample were counted, distinguishing apoptotic cells with chromatin condensation and
non-apoptotic cells with normal nuclei.
The silencing of OPA3V1 and OPA3V2, alone or together, did not exert effects on the percentage
of apoptotic cells, however cells transfected with siEx2 and siEx2b resulted more sensitive to
staurosporine, exhibiting about 50% of apoptotic cells after the treatment, compared to 30% of
apoptotic cells in cells transfected with the scramble and cells transfected with siEx1 (Fig. 32). In
both cases the differences in the groups were statistically significant (p<0.01)
Figure 32 - Quantification of apoptotic nuclei in HeLa transfected cells Data are reported as average (3 independent experiments) ± SEM. Asterisks indicates statistic significance associated to a p<0.001.
Mitochondrial DNA content quantification
We investigated the effects of silencing of OPA3V1, OPA3V2, or both on the mtDNA
maintenance or replication. HeLa cells were transfected with a scramble siRNA, siEx1, siEx2 and
siEx2b. After 48 hours from the transfection, cells were pelleted, DNA extracted and analysed by
Real Time-PCR.
The average mtDNA copy values were 1451 ± 107 in the untransfected cells, 1421 ± 128 in cells
transfected with the scramble, 1717 ± 44 in cells transfected with siEx1, 1244 ± 69 in cells
transfected with siEx2, 1123 ± 136 in cells transfected with siEx2b. No significant differences have
been found between the cells transfected with the scramble and cells silenced for OPA3V1,
OPA3V2 or both (Fig. 33).

Figure 33 – Mitochondrial DNA quantification in Hela transfected cells Data are reported as average (3 independent experiments) ± SEM.
Coimmunoprecipitation of OPA3V1 on isolated mitochondria from HEK cells
To identify possible interactors of OPA3, we carried out a coimmunoprecipitation (CoIP)
experiment. Since HEK cells are characterized by a high number of mitochondria, we chose this
cell line for this experiment. The CoIP was carried out in purified mitochondrial extracts using a
commercial antibody specific for OPA3V1, since OPA3V2 is expressed at very low levels and
therefore it is hardly detectable. The different immunoprecipitate fractions (unbound, eluted, resin)
were analysed by Western blot to detect the presence of OPA1, MFN2, two proteins involved in the
mitochondrial fusion, POLG, a regulator of mtDNA replication, and cytochrome c, for its role in
apoptosis.
Western blot revealed the presence of all these proteins in the unbound fraction (Fig. 34), indicating
that no interaction exists between OPA3V1 and OPA1, MFN2, POLG and cytochrome c.

Figure 34 – Coimmunoprecipitation for OPA3 in HEK cells Western blots using OPA1, MFN2, POLG, cyt c, OPA3 antibodies, performed on the flow through (UB), eluted (E) and resin (R) proteins from mitochondrial fractions of HEK cells.

Discussion

Part 1 – Modifying factors of penetrance in LHON
Mitochondrial DNA content as a biomarker to distinguish LHON affected individuals from
carriers
The increase in mtDNA content has been observed in mitochondrial diseases and aging. This feature
is currently interpreted hypothesizing that the impairment of respiratory chain activity and the
consequent reduction of ATP production due to mtDNA mutations may trigger a retrograde
pathway, which activates mitochondrial biogenesis and compensates the mitochondrial dysfunction.
Similarly, an increase in mtDNA content has been reported in different tissues from elderly
individuals, such as brain, lungs, and skeletal muscle (Barrientos et al., 1997; Lee et al., 1998;
Pesce et al., 2001). Futhermore, an up-regulation of two master regulators of mtDNA replication,
NRF-1 and Tfam, has been found in skeletal muscle of elderly subjects (Lezza et al., 2001).
The increase in mitochondrial biogenesis and in mtDNA content has been documented in
mitochondrial encephalomyopathies, such as MELAS and MERRF, where mtDNA copy number is
significantly increased in leukocytes of young subjects compared to controls, whereas it is lower in
old affected individuals (Liu et al., 2006). Moreover, accumulation of large collections with
frequently aberrant mitochondria is common in the skeletal muscle (RRFs) of patients affected by
these diseases, indicating a signalling for a compensatory mechanism based on the activation of
mitochondrial biogenesis (Hirano et al., 1999). The RRFs have been reproduced in an animal model
by disrupting the expression of mitochondrial transcription factor A (mtTFA). The increased
mitochondrial mass partly compensated for the reduced function of the respiratory chain by
maintaining overall ATP production in skeletal muscle (Wredenberg et al., 2002). Thus, within
certain limits, the increase of mitochondrial mass is a successful compensatory strategy.
Although RRFs are not detectable, some signs of mitochondrial proliferation in LHON patients
skeletal muscles is also occurring as shown, for example by the increased subsarcolemmal SDH
activity (Valentino et al., 2004; Carelli et al., 1998). In LHON patients with the 11778/ND4
mutation, an increased succinate cytochrome c reductase activity, with normal complex III activity,
has been reported in blood cells mitochondria, suggesting the occurrence of a nuclear compensatory
effect for defective respiratory chain (Yen et al., 1996). Moreover, an increased mtDNA copy
number in blood cells of LHON affected and asymptomatic carrier individuals harbouring the
11778/ND4 and 14484/ND6 mutations, has also been reported (Yen et al., 2002; Nishioka et al.,
2004). Finally, it has been recently demonstrated that an increase in mitochondrial biogenesis
induced by β-estradiol is able to rescue the energetic defect in LHON cybrids (Giordano et al.,
2011), supporting the relevance of an efficient mitochondrial biogenesis in LHON.

Based on these observations, we measured the mtDNA content in blood cells and skeletal muscle of
LHON affected subjects and unaffected mutation carriers individuals. The results from this
investigation showed a significant increase in mtDNA copy number in individuals carrying LHON
mutations compared to controls individuals, and, interestingly, the LHON unaffected carriers had a
significantly higher mtDNA content also compared to the affected individuals. The increase in
mtDNA content was found in both blood cells and skeletal muscle and it was independent from the
type of mutation. In fact, this result was reproducible in the large Brazilian family carrying the
11778/ND4 mutation and in the 39 Italian families carrying the three common LHON mutations.
The increase in mtDNA copy number could be influenced by genetic and/or environmental factors,
determining the difference between affected and carrier. In fact, the subjects with an efficient
compensatory response have a high mtDNA copy number and may not develop the disease
(unaffected carriers), whereas those characterized by a lower mtDNA copy number cannot
completely compensate for the energy defect and will be more prone to develop LHON converting
to affected.
No correlation between mtDNA copy number and age or sex was observed in this study. However,
in the carrier group the distribution of mtDNA content showed two different populations,
represented by males and females, expressing a lower mtDNA copy number. Considering the
compensatory response as a multifactorial mechanism, it is possible that females need a lower
mtDNA content, but the compensation mechanism could be efficient being influenced by other sex-
related factors, such as estrogens.
Seven selected SNPs in nuclear regulators of mitochondrial biogenesis do not influence LHON
penetrance
Mitochondrial biogenesis is a complex process involving the coordinated expression of
mitochondrial and nuclear genes, the import of mitochondrial proteins encoded by nuclear genome
and turnover of mitochondrial population. Although the complete pathway has not been elucidated
yet, key players have been identified in the last few years (Diaz and Moraes, 2008).
Two classes of nuclear regulators of mitochondrial biogenesis can be distinguished: transcriptional
coactivators (PGC-1α, PGC-1β, PPRC, etc.) and transcriptional factors (NRF1, NRF2, ERRα, Tfam,
etc.). The first class includes nuclear proteins which do not bind directly the DNA but are able to
activate transcriptional factors through direct interaction. Once activated, the transcriptional factors
can stimulate expression of genes involved in the OXPHOS functioning or in mtDNA replication
(Kelly and Scarpulla, 2004).

Several SNPs are able to influence the expression or the activity of these genes. The polymorphism
Gly482Ser in PGC-1α gene has been associated to a variety of pathologies, such as hypertension,
diabetes mellitus and insulin resistance (Brito et al., 2009; Su et al., 2008; Lai et al., 2008). A recent
study demonstrates that PGC-1α variant with Gly/Gly at 482nd amino acid impairs Tfam
transcription, thus lowering mtDNA replication (Choi et al., 2006). A polymorphic variant of PGC-
1β, Ala203Pro, has been associated with obesity and breast cancer (Andersen et al., 2006;
Wirtenberger et al., 2007). The position 203 is in close proximity of the nuclear receptor box 1
(NR1), through which PGC-1β interacts with nuclear receptors such as ERα/β or PPARγ, recruiting
a complex of coactivators to target DNA sites (Nolte et al., 1998; Feng et al., 1998). Therefore, the
Ala203Pro change is predicted to interfere with the interaction of PGC-1β with ERs and ERRs,
leading to an altered transactivation of target genes (Kressler et al., 2002). Tfam is a major
transcription factors promoting the mitochondrial biogenesis, being an important regulator of
mtDNA replication and transcription. Only three missense SNPs have been identified in the gene
sequence, and one of these, Ser12Thr, has been investigated for correlation with insulin resistance
(Gianotti et al., 2008) or neurodegenerative diseases, showing a significant association with late-
onset Alzheimer (Zhang et al., 2011; Alvarez et al., 2008; Günther et al., 2004).
In recent studies, a new role in mitochondrial biogenesis, mtDNA maintenance and mtDNA
replication has been attributed to the tumor suppressor protein p53 (Kulawiec et al., 2009; Park et
al., 2009; Lebedeva et al., 2009). In fact, in response to endogenous or exogenous stimuli, such as
oxidative stress, p53 is recruited to mitochondria and interacts with apoptotic proteins and regulators
of mtDNA transcription and replication, such as Tfam and POLG (Park et al., 2005; Mihara et al.,
2003). It has been demonstrated that the Pro72Arg polymorphism can influence p53 ability to
promote the apoptosis, due to its increase within mitochondria (Matlashewski et al., 1987).
Moreover, this polymorphism has been largely investigated for association to different type of
tumors, chemo-radiotherapy resistance and neurological disease (Rangel-López et al., 2006).
In the last year, some evidences for a role in mtDNA replication of the mitochondrial protease
PARL has been found. A polymorphic variant in the promoter region (-191T/C) has been shown to
influence mtDNA content in a control Caucasian population (Curran et al., 2010). Moreover, a
genome-wide scan analysis indicated two variants in non coding regions of PARL gene (rs3749446
and rs1402000) as associated with LHON in Thai families (Phasukkijwatana et al., 2010), although
this result has not been replicated by a following study in LHON Chinese patients (Zhang et al.,
2010). The variant Leu262Val is the only SNPs in the coding region of PARL associated with
pathologies, such as metabolic syndrome and coronary artery disease (Powell et al., 2008).

We selected PGC-1α, PGC-1β, Tfam, p53 and PARL as potential candidate genes to have a
modifying role in LHON penetrance and we investigated the distributions of the most relevant SNPs
in these genes (Gly482Ser, PGC-1α; Ala203Pro, PGC-1β; Ser12Thr, Tfam; Pro72Arg, p53; -
191T/C, Leu262Val, PARL) in the large Brazilian family. No correlation between these
polymorphic variants and the status of affected and carrier has been found. Moreover, we didn’t find
any significant correlation between mtDNA copy number and the SNPs in LHON affected and
carrier groups.
Ala16Val variant in MnSOD modify the LHON penetrance
Mitochondria are the major source of ROS under normal physiological conditions, with superoxide
radicals being the primary ROS produced by these organelles. Complex I and complex III are the
major superoxide (O2.-)-producing sites in mitochondria (Lenaz, 1998). The LHON mutations in
complex I promote a chronic increase in oxidative stress (Wong et al., 2002; Schoeler et al., 2007),
which, together with the decrease of net energy production (Baracca et al., 2005; Lodi et al., 1997;
Lodi et al., 2002), have a key role in the pathogenesis of the disease.
We selected polymorphic variants in the major players of the cellular antioxidant machinery to
identify genetic determinants able to modify LHON penetrance.
The Ala16Val in the MTS of MnSOD has been reported as associated with several pathologies,
including Alzheimer diseases (Wiener et al., 2007), and with aging and longevity (Soerensen et al.,
2009). It has been demonstrated that the Ala allele confers a 40% higher MnSOD activity and a
higher content of the protein within mitochondria than the Val allele (Sutton et al., 2005). The
variant +35A/C in the cytosolic SOD, CuZnSOD, is located in a splice site (exon3/intron3) of the
gene and is related to the enzyme activity, having the AA genotype the higher CuZnSOD activity.
This SNP has been found associated with diabetes mellitus (Flekac et al., 2008) and diabetic
nephropaty in type I diabetes (Panduru et al., 2010).
The Pro198Leu variant in GPx gene has an influence on the enzymatic activity of the protein, being
the Pro198 allele related to a higher detoxifying activity than the Leu198 allele (Hu and Diamond,
2003). According to this founding, the Leu allele has been reported to increase risk to develop
different cancers, such as hepatocellular carcinoma, prostate, breast and lung cancer (Sutton et al.,
2006).
The two polymorhisms in the CAT gene (-21A/T; -262C/T) are located in the promoter and have
been reported as modifier of the catalase gene expression (Forsberg et al., 2001b). Moreover, the -
262C/T variant has been associated with the systemic lupus erythematosus (SLE) (D'souza A et al.,
2008).

Aldose reductase (ALDR1) is a cytosolic enzyme that, in the presence of NADPH, catalyzes the
rate-limiting step of the polyol pathway converting glucose in sorbitol, but some evidences of a role
of this enzyme in detoxification from ROS are also reported. In particular, it has been shown that
H2O2 can promote the expression and activity of this enzyme (Stefan et al., 1997) and the
participation of ALDR1 in an oxidative defence mechanism able to neutralize toxic effects of lipid
peroxidation has been proposed (Heike et al., 1999). Moreover, ALDR1 is able to translocate into
mitochondria after protein kinase C-dependent phosphorylation, although its role in the organelle is
still unknown (Varma et al., 2002). A further link between aldose reductase and mitochondria was
shown by a microarray analysis of LHON and controls cybrids, documenting its over-expression in
LHON cells and 35% increase of protein expression in their mitochondria. Thus, a role for ALDR1
in LHON pathogenesis has been proposed (Danielson et al., 2005). The -105C/T polymorphism in
the promoter seems to modify the gene expression of ALDR1 (Liu et al., 2002) and it has been
found associated with diabetic nephropathy in subjects affected with type 2 diabetes mellitus
(Makiishi T et al., 2003).
The analysis of distributions of these selected polymorphisms in the large SOA-BR family revealed
a significant signal from the MnSOD Ala16Val variant. In fact, the Val/Val genotype resulted more
frequent in the unaffected mutation carrier, whereas the Ala/Val genotype was associated to the
affected individuals. Moreover, considering the Ala/Ala and Ala/Val genotypes as related to a
higher enzymatic activity (Mattiazzi et al., manuscript in preparation), the affected individuals
resulted significantly characterized by a high MnSOD activity, compared to the carrier group. The
allelic distributions among the two groups, showed that Val allele was protective, being
significantly associated to the carriers, whereas the Ala allele resulted associated to the increased
risk for LHON expression with an odd ratio of 2.37. These results have been replicated in a cohort
composed of individuals from different nationalities and carrying LHON mutations. Furthermore,
the distribution of the polymorphism Ala16Val in a cohort of 111 Italian LHON affected unrelated
individuals overlapped the distribution found in the Brazilian affected, being significantly different
from a control group of Italians matched for age and sex.
These results on the MnSOD variant are counter intuitive if we assume that high antioxidant activity
would be a protective factor in LHON. However, our results lead to the conclusion that the
Ala16Val variant in MnSOD represents one of the genetic modifiers of LHON penetrance. The Ala
allele predisposes to the clinical expression of the disease, whereas the protective allele is Val,
which is known to affect the targeting sequence for mitochondrial import inducing a partial stalling
of MnSOD transport, and lowering the final amount of active enzyme in the matrix. We propose
that high MnSOD activity in mitochondria of LHON subjects, which chronically overproduce

superoxide, may become deleterious if downstream other antioxidant enzymes fail to buffer the
excess H2O2. As a consequence, we may envisage a scenario where the antioxidant machinery
within mitochondria may become overwhelmed by H2O2 production and this radical, more stable
than superoxide, may spill out of mitochondria and trigger cell damage and ultimately apoptosis.
Part 2 – Elucidating the mitochondrial function of OPA3 and its role in ADOAC
pathogenesis
OPA3 variants are ubiquitously expressed and OPA3V1 is the most abundant
Huizing et al. in 2010 reported that OPA3V1 and OPA3V2 were ubiquitously expressed (Huizing et
al., 2010). In this study we carried out a quantitative analysis in a multiple tissues panel from mouse
and we compared the OPA3 variants gene expression with OPA1 expression, being this gene a
major site for mutations causing ADOA.
We found that OPA3V1 and OPA3V2 were both expressed in kidney, lung, skeletal muscle, liver,
brain, retina and cochlea from a 7 days old mouse, the OPA3V2 being much less expressed
compared to the OPA3V1. In particular, OPA3V2 reached expression levels from a minimum of 4
fold lower in lung to a maximum of 9 fold lower in heart. Expression levels of OPA3V2 were
similar in all the tissues examined, whereas OPA3V1 showed a pattern of expression close to that of
OPA1, although it seemed to be more expressed in most of the tissues, except for brain, where
OPA1 exceeded OPA3V1.
.In according to what observed in mouse, in HeLa cells OPA3V1 resulted more expressed than
OPA1, whereas OPA3V2 showed an expression of ~ 40 folds lower than OPA3V1. Interestingly,
we observed in HeLa cells a compensatory mechanism based on the increase of OPA3V1 mRNA
expression when OPA3V2 was suppressed, and vice versa. This phenomenon has been already
observed in fibroblasts from patients carrying a 3-MGCA type III-related mutation located in a
splice site (143-1G>C). This mutation abolished the OPA3V1 mRNA expression in these cells, but
OPA3V2 mRNA resulted significantly up-regulated (Huizing et al., 2010). Moreover, we found that
in HeLa cells the protein expression of both OPA3 variants was considerably low, being not
detectable in 30-40µg of loaded proteins, indicating the possible existence of a post-transcriptional
mechanism regulating OPA3 proteins translation.
The expression of OPA3V1 and OPA3V2 was confirmed in retina by Immunofluorescence, and we
found that both the variants are clearly detectable in RGCs, and, as the mRNA quantification
demonstrated, OPA3V2 is less express than OPA3V1.
OPA3 may be involved in the regulation of mitochondrial fission
To determine the function of OPA3, we investigated if the overexpression or silencing of the two
isoforms had an impact on mitochondrial morphology in HeLa cells.
HeLa cells overexpressing OPA3V1, OPA3V2 or OPA3V1G93S showed abnormal mitochondrial
morphology, which led to extensive mitochondrial aggregation, more marked in the cells

transfected with the mutated OPA3V1. This observation is in line with the findings reported by Ryu
after overexpression of OPA3V1 (Ryu et al., 2010).
To confirm the effect of OPA3 on mitochondrial morphology, we repressed the expression of
endogenous OPA3 variants through a silencing approach. We transfected HeLa cells with three
different siRNAs specific for Ex1, Ex2, and Ex2b and directed respectively to OPA3V1 and
OPA3V2, OPA3V1, and OPA3V2. Through qualitative observation of the transfected cells, loss of
OPA3V1 and OPA3V2 seemed to have no effects on the mitochondrial morphology, being cells
transfected with siEx1, siEx2 and siEx2b comparable to control cells. This result is in contrast to
what shown by Ryu et al., who found an increase in elongated mitochondria in the cells silenced for
OPA3V1 (Ryu et al., 2010). The different findings between these two studies may be due to
technical issues given to the different experimental condition used.
Contrary to expectations, OPA3 may have an opposite function respect to OPA1, being involved in
the regulation of mitochondrial fission instead of mitochondrial fusion.
OPA3 affects mitochondrial membrane potential
The overexpression of OPA3 in HeLa cells had remarkable effects on the maintenance of
mitochondrial membrane potential. In fact, cells transfected with OPA3V1, OPA3V2 and
OPA3V1G93S completely lost the membrane potential, since red fluorescence of JC1 aggregates
disappeared in these cells. On the contrary, silencing of OPA3 isoforms, simultaneously or
independently, did not affect the membrane potential, showing in these cells the same pattern of
JC1 fluorescence observed in the control cells.
Thus, the overexpression of OPA3 may have a deleterious effect on mitochondrial function, since it
strongly induced lack of membrane potential, required for ATP production and directly involved in
processes such as mitochondrial proteins import, Ca2+ release from mitochondria and apoptosis.
OPA3 increases sensitivity to apoptotic signals
It is well known from literature that altered mitochondrial morphology and membrane potential are
closely related to apoptotic sensitivity (Youle and Karbowsky, 2005; Suen et al., 2008). We
evaluated whether the induction or repression of OPA3 expression may lead to cell death in absence
or presence of an apoptotic stimulus.
The overexpression or silencing of OPA3 did not influence predisposition to apoptosis, since
conditions these cells did not undergo to apoptosis spontaneously. On the contrary, treatment with
staurosporine significantly increased the apoptosis in cells overexpressing OPA3V1, OPA3V2 and
OPA3V1G93S. A different effect was observed silencing OPA3 and treating cells with

staurosporine. In fact, cells silenced for both the isoforms showed apoptosis levels comparable to
control cells, whereas cells silenced for OPA3V1 and OPA3V2 independently significantly
increased the number of apoptotic cells. This phenomenon could be dependent on the compensatory
mechanism inducing an increase in OPA3V1 expression when OPA3V2 is repressed and vice versa.
Thus, the increase in apoptotic cells number could be due to the overexpression of OPA3 isoform
which was not silenced.
The increased sensitivity to staurosporine in cells overexpressing OPA3 has been previously
demonstrated by Ryu et al., and cytochrome c release has been observed in these conditions (Ryu et
al., 2010).
OPA3 does not influence mtDNA content
Multiple deletions in mtDNA has been found in association to OPA1 mutations in skeletal muscle
of “ADOA plus” patients, suggesting a role of OPA1 in mtDNA stability (Amati-Bonneau et al.,
2008). Moreover, OPA1 has been recently shown as directly involved in the maintenance of
mitochondrial genome integrity, influencing mtDNA stability and replication and being associated
to nucleoids (Elachouri et al., 2011).
To determine if also OPA3 could be involve in the maintenance of mtDNA, we quantified mtDNA
content after OPA3 overexpression and silencing. OPA3V1, OPA3V2 and OPA3V1G93S
overexpression and silencing of OPA3 variants did not influence mtDNA copy number/cell,
showing that these cells had the same mtDNA content as control cells. Thus, contrary to OPA1,
OPA3 does not seem to be involved in mtDNA maintenance.
OPA3 is not an interactor of OPA1, MFN2, POLG and cyt c
To identify possible interactors of OPA3, we carried out a CoIP experiment on HEK cells, taking
advantage of their high content in mitochondria.
We failed to evidence interactions between OPA3V1 and OPA1 or MFN2, two proteins involved in
mitochondrial fusion. This result further confirms that OPA3 is not involved in the mitochondrial
fusion process. Furthermore, we also excluded interactions between OPA3V1 and POLG,
corroborating the mtDNA quantification experiments, and strongly supporting the absence of
connection between OPA3 and mtDNA replication. Lastly, since the overexpression of OPA3
showed a pro-apoptotic effect and the release of cytochrome c has been already demonstrated under
thi condition (Ryu et al., 2010), we also checked for a direct interaction between OPA3V1 and
cytochrome c, failing to show this possible connection.

Conclusions

Leber’s hereditary optic neuropathy (LHON) and Autosomal Dominant Optic Atrophy (ADOA) are
the two most common inherited optic neuropathies and both are the result of mitochondrial
dysfunctions. Since the first causative mutations have been identified, LHON and ADOA have been
intensively investigated, even though to date many questions are still open. The genetic factors
modulating the variable penetrance and tissue-specificity of the pathological mechanism have not
been completely explained yet. Moreover, many loci have been found associated with ADOA
families negative for OPA1 mutations, but only theOPA3 gene has been characterized. The function
of the mitochondrial protein OPA3 and its role in the pathogenic mechanism of ADOAC are still
elusive, and contradictory findings have been recently published.
The results here reported contribute to clarify some aspects of the LHON variable penetrance and
try to elucidate OPA3 function and the ADOAC pathogenic mechanism.
We identified a compensatory mechanism in LHON patients, able to distinguish affected
individuals from unaffected mutation carriers. In fact, carrier individuals resulted more efficient
than affected subjects in increasing the mitochondrial biogenesis to compensate for the energetic
defect. Thus, the activation of the mitochondrial biogenesis may be a crucial factor in modulating
penetrance, determining the fate of subjects harbouring LHON mutations. Furthermore, mtDNA
content can be used as a molecular biomarker which, for the first time, clearly differentiates LHON
affected from LHON carrier individuals, providing a valid mechanism that may be exploited for
development of therapeutic strategies. Although the mitochondrial biogenesis gained a relevant role
in LHON pathogenesis, we failed to identify a genetic modifying factor for the variable penetrance
in a set of candidate genes involved in the regulation of this process. A more systematic high-
throughput approach will be necessary to select the genetic variants responsible for the different
efficiency in activating mitochondrial biogenesis.
A genetic modifying factor was instead identified in the MnSOD gene. The SNP Ala16Val in this
gene seems to modulate LHON penetrance, since the Ala allele in this position significantly
predisposes to be affected. Thus, we propose that high MnSOD activity in mitochondria of LHON
subjects may produce an overload of H2O2 for the antioxidant machinery, leading to release from
mitochondria of this radical and promoting a severe cell damage and death.
Our study on OPA3 provides new information about the pattern of expression of the two isoforms
OPA3V1 and OPA3V2, and, moreover, suggests that OPA3 may have a different function in
mitochondria from OPA1, the major site for ADOA mutations. In fact, based on our results, we
propose that OPA3 is not involved in the mitochondrial fusion process, but, on the contrary, it may
regulate mitochondrial fission. Furthermore, at difference from OPA1, we excluded a role for OPA3
in mtDNA maintenance and we failed to identify a direct interaction between OPA3 and OPA1.

Considering the results from overexpression and silencing of OPA3, we can conclude that the
overexpression has more drastic consequences on the cells than silencing, suggesting that OPA3
may cause optic atrophy via a gain-of-function mechanism. These data provide a new starting point
for future investigations aimed at identifying the exact function of OPA3 and the pathogenic
mechanism causing ADOAC.

References

References
Abrahams JP, Leslie AG, Lutter R, et al. Structure at 2.8 A resolution of F1-ATPase from bovine heart mitochondria. Nature. 1994; 370:621-628. Adams JM, Cory S. The Bcl-2 protein family: arbiters of cell survival. Science 1998; 281:1322-1326.
Alavi MV, Bette S, Schimpf S, et al. A splice site mutation in the murine Opa1 gene features pathology of autosomal dominant optic atrophy. Brain. 2007; 130:1029-1042.
Albano E, Bellomo G, Parola M, et al. Stimulation of lipid peroxidation increases the intracellular calcium content of isolated hepatocytes. Biochim Biophys Acta. 1991; 1091:310-316. Alexander C, Votruba M, Pesch UE, et al. OPA1, encoding a dynamin-related GTPase, is mutated in autosomal dominant optic atrophy linked to chromosome 3q28. Nat Genet. 2000 Oct; 26:211-5.
Alvarez V, Corao AI, Alonso-Montes C, et al. Mitochondrial transcription factor A (TFAM) gene variation and risk of late-onset Alzheimer's disease. J Alzheimers Dis. 2008; 13:275-280.
Amati-Bonneau P, Guichet A, Olichon A, et al. OPA1 R445H mutation in optic atrophy associated with sensorineural deafness. Ann Neurol. 2005; 58:958-963.
Amati-Bonneau P, Valentino ML, Reynier P, et al. OPA1 mutations induce mitochondrial DNA instability and optic atrophy plus phenotypes. Brain 2008, 131:338-351.
Andersen G, Wegner L, Yanagisawa K et al. Evidence of an association between genetic variation of the coactivator PGC-1beta and obesity. J. Med. Genet. 2006; 42, 402-407.
Anderson S, Bankier AT, Barrell BG, et al. Sequence and organization of the human mitochondrial genome. Nature. 1981; 290:457-465. Anderson S, Bankier AT, Barrell BG, et al. Sequence and organization of the human mitochondrial genome. Nature. 1981; 290:457-465. Andersson U, Scarpulla RC. PGC-1-Related coactivator, a novel, serum-inducible coactivator of nuclear respiratory factor-1-dependent transcription in mammalian cells. Mol. Cell. Biol. 2001; 21:3738-3749 Anikster Y, Kleta R, Shaag A, et al. Type III 3-methylglutaconic aciduria (optic atrophy plus syndrome, or Costeff optic atrophy syndrome): identification of the OPA3 gene and its founder mutation in Iraqi Jews. Am J Hum Genet. 2001; 69:1218-1224. Attardi G, Schatz G. Biogenesis of mitochondria. Annu Rev Cell Biol 1988; 4:289-333. Bach D, Pich S, Soriano FX, et al. Mitofusin-2 determines mitochondrial network architecture and mitochondrial metabolism. A novel regulatory mechanism altered in obesity. J Biol Chem. 2003; 278:17190-197. Bacon BR, O’Neill R, Britton RS. Hepatic mitochondrial energy production in rats with chronic iron overload. Gastroenterology. 1993; 105:1134-1140.

Ban T, Heymann JA, Song Z, Hinshaw JE, Chan DC. OPA1 disease alleles causing dominant optic atrophy have defects in cardiolipin-stimulated GTP hydrolysis and membrane tubulation. Hum Mol Genet. 2010; 19:2113-2122.
Baracca A, Solaini G, Sgarbi G, et al. Severe impairment of complex I-driven adenosine triphosphate synthesis in leber hereditary optic neuropathy cybrids. Arch Neurol. 2005; 62:730-736.
Barboni P, Carbonelli M, Savini G, et al. OPA1 mutations associated with dominant optic atrophy influence optic nerve head size. Ophthalmology. 2010; 117:1547-1553.
Batten B. A family suffering from hereditary optic atrophy. Trans. Ophtalmol. Soc. UK 1896; 16:125. Bernardi P, Azzone GF. Cytochrome c as an electron shuttle between the outer and inner mitochondrial membranes. J Biol Chem. 1981; 256:7187-7192. Berninger TA, Jaeger W, Krastel H. Electrophysiology and color perimetry in dominant infantile optic atrophy. Br J Ophtalmol. 1991; 75:49-52. Berry EA, Guergova-Kuras M, Huang LS, et al. Structure and function of cytochrome bc complexes. Annu Rev Biochem. 2000; 69:1005-1075. Bogenhagen DF, Rousseau D, Burke S. The layered structure of human mitochondrial DNA nucleoids. J Biol Chem. 2008; 283:3665-3675. Bohr VA. Repair of oxidative DNA damage in nuclear and mitochondrial DNA, and some changes with aging in mammalian cells. Free Radic Biol Med. 2002; 32:804-812. Bokori-Brown M, Holt IJ. Expression of algal nuclear ATP synthase subunit 6 in human cells results in protein targeting to mitochondria but no assembly into ATP synthase. Rejuvenation Res. 2006; 9:455-469. Bonnet C, Augustin S, Ellouze S, et al. The optimized allotopic expression of ND1 or ND4 genes restores respiratory chain complex I activity in fibroblasts harbouring mutations in these genes. Biochim Biophys Acta. 2008; 1783:1707-1017. Bonnet C, Kaltimbacher V, Ellouze S, et al. Allotopic mRNA localization to the mitochondrial surface rescues respiratory chain defects in fibroblasts harboring mitochondrial DNA mutations affecting complex I or v subunits. Rejuvenation Res. 2007; 10:127-144. Bourdon A, Minai L, Serre V, et al. Mutation of RRM2B, encoding p53-controlled ribonucleotide reductase (p53R2), causes severe mitochondrial DNA depletion. Nat Genet. 2007; 39:776-780. Bowmaker M, Yang MY, Yasukawa T, et al. Mammalian mitochondrial DNA replicates bidirectionally from an initiation zone. J Biol Chem. 2003; 278:50961-50969.
Bradford MM. A rapid and sensitive method for the quantitation of microgram quantities of protein utilizing the principle of protein-dye binding. Anal Biochem. 1976; 72:248-254.

Brito EC, Vimaleswaran KS, Brage S, et al. PPARGC1A sequence variation and cardiovascular risk-factor levels: a study of the main genetic effects and gene x environment interactions in children from the European Youth Heart Study. Diabetologia. 2009; 52:609-613.
Brown WM, George JM & Wilson AC. Rapid evolution of animal mitochondrial DNA. Proc Natl Acad Sci U S A 1979; 76:1967–1971. Bu XD, Rotter JI. X chromosome-linked and mitochondrial gene control of Leber hereditary optic neuropathy: evidence from segregation analysis for dependence on X chromosome inactivation. Proc Natl Acad Sci USA. 1991; 88:8198-8202 Carelli V, Barboni P, Sadun AA. Mitochondrial opthalmology. In Mitochondrial medicine. Edited by DiMauro S, Hirano M, Schon EA. Informa healthcare. 2006. pp. 105-142.
Carelli V, Barboni P, Zacchini A, et al. Leber's Hereditary Optic Neuropathy (LHON) with 14484/ND6 mutation in a North African patient. J Neurol Sci. 1998; 160:183-188.
Carelli V, Ghelli A, Bucchi L, et al. Biochemical features of mtDNA 14484 (ND6/M64V) point mutation associated with Leber's hereditary optic neuropathy. Ann Neurol. 1999; 45:320-328. Carelli V, Ghelli A, Ratta M, et al. Leber's hereditary optic neuropathy: biochemical effect of 11778/ND4 and 3460/ND1 mutations and correlation with the mitochondrial genotype. Neurology. 1997; 48:1623-1632. Carelli V, La Morgia C, Valentino ML, et al. Retinal ganglion cell neurodegeneration in mitochondrial inherited disorders. Biochim Biophys Acta. 2009; 1787:518-528. Carelli V, Ross-Cisneros FN, Sadun AA. Mitochondrial dysfunction as a cause of optic neuropathies. Prog Retin Eye Res. 2004; 23:53-89. Carelli V, Schimpf S, Fuhrmann N, et al. A clinically complex form of dominant optic atrophy (OPA8) maps on chromosome 16. Hum Mol Genet. 2011. (Epub ahead of print) Carroll J, Shannon RJ, Fearnley IM, et al. Definition of the nuclear encoded protein composition of bovine heart mitochondrial complex I. Identification of two new subunits. J Biol Chem. 2002; 277:50311-50317. Carvalho MR, Müller B, Rötzer E, et al. Leber's hereditary optic neuroretinopathy and the Xchromosomal susceptibility factor: no linkage to DXs7. Hum Hered. 1992; 42:316-320. Catlett NL, Weisman LS. Divide and multiply: organelle partitioning in yeast. Curr Opin Cell Biol. 2000; 12:509-516. Chalmers RM, Bandmann O, Harding AE. Debrisoquine hydroxylase polymorphism in Leber's hereditary optic neuropathy. J Neurol Neurosurg Psychiatry 1996a; 60:588. Chalmers RM, Davis MB, Sweeney MG, et al. Evidence against an X-linked visual loss susceptibility locus in Leber hereditary optic neuropathy. Am J Hum Genet. 1996b; 59:103-108. Chau CA, Evans MJ, Scarpulla RC. Nuclear respiratory factor 1 activation sites in genes encoding the gamma-subunit of ATP synthase, eukaryotic initiation factor 2α, tyrosine aminotransferase.

Specific interaction of purified NRF-1 with multiple target genes. J Biol Chem. 1992; 267:6999-7006. Chen H, Chan DC. Critical dependence of neurons on mitochondrial dynamics. Curr Opin Cell Biol. 2006; 18:453-459. Chen H, Chan DC. Emerging functions of mammalian mitochondrial fusion and fission. Hum Mol Genet. 2005; 2:R283-289. Chen H, Chomyn A, Chan DC. Disruption of fusion results in mitochondrial heterogeneity and dysfunction. J Biol Chem. 2005; 280:26185-26192. Chen H, Detmer SA, Ewald AJ, et al. Mitofusins Mfn1 and Mfn2 coordinately regulate mitochondrial fusion and are essential for embryonic development. J Cell Biol. 2003; 160:189-200. Chen JD, Cox I, Denton MJ. Preliminary exclusion of an X-linked gene in Leber optic atrophy by linkage analysis. Hum Genet. 1989; 82:203-207.
Chevrollier A, Guillet V, Loiseau D, et al. Hereditary optic neuropathies share a common mitochondrial coupling defect. Ann Neurol. 2008; 63:794-798.
Choi YS, Hong JM, Lim S, et al. Impaired coactivator activity of the Gly482 variant of peroxisome proliferator-activated receptor gamma coactivator-1alpha (PGC-1alpha) on mitochondrial transcriptionfactor A (Tfam) promoter. Biochem Biophys Res Commun. 2006; 344:708-712.
Cipolat S, de Brito OM, Dal Zilio B et al. OPA1 requires mitofusin 1 to promote mitochondrial fusion. Proc. Natl Acad. Sci. USA 2004; 101:15927-15932. Cipolat S, Rudka T, Hartmann D, et al. Mitochondrial rhomboid PARL regulates cytochrome c release during apoptosis via OPA1-dependent cristae remodeling. Cell. 2006; 126:163-175. Clayton DA. Mitochondrial DNA replication: what we know. IUBMB Life. 2003; 55:213–217. Clayton DA. Replication and transcription of vertebrate mitochondrial DNA. Annu Rev Cell Biol. 1991; 7:453-478. Clayton DA. Vertebrate mitochondrial DNA: a circle of surprises. Exp Cell Res. 2000; 255:4–9. Collins TJ, Berridge MJ, Lipp P, et al. Mitochondria are morphologically and functionally heterogeneous within cells. EMBO J. 2002; 21:1616-1627. Cossarizza A, Riva A, Pinti M, et al. Increased mitochondrial DNA content in peripheral blood lymphocytes from HIV-infected patients with lipodystrophy. Antivir Ther. 2003; 8:315-321.
Costeff H, Gadoth N, Apter N, et al. A familial syndrome of infantile optic atrophy, movement disorder, and spastic paraplegia. Neurology.1989; 39:595-597.
Cryns V, Yuan Y. Proteases to die for. Genes Dev. 1999; 12:1551-1570. Cupini LM, Massa R, Floris R, et al. Migraine-like disorder segregating with mtDNA 14484 Leber hereditary optic neuropathy mutation. Neurology. 2003; 60:717-719.

Curran JE, Jowett JB, Abraham LJ, et al. Genetic variation in PARL influences mitochondrial content. Hum Genet. 2010;127:183-190.
Da Cruz S, Xenarios I, Langridge J, et al. Proteomic analysis of the mouse liver mitochondrial inner membrane. J Biol Chem. 2003; 278:41566-41571.
Danielson SR, Carelli V, Tan G, et al. Isolation of transcriptomal changes attributable to LHON mutations and the cybridization process. Brain. 2005; 128:1026-1037.
Danielson SR, Wong A, Carelli V, et al. Cells bearing mutations causing Leber's hereditary optic neuropathy are sensitized to Fas-Induced apoptosis. J Biol Chem. 2002; 277:5810-5815.
Davies VJ, Hollins AJ, Piechota MJ, et al. Opa1 deficiency in a mouse model of autosomal dominant optic atrophy impairs mitochondrial morphology, optic nerve structure and visual function. Hum Mol Genet. 2007;16:1307-1318.
Davies VJ, Powell KA, White KE, et al. A missense mutation in the murine Opa3 gene models human Costeff syndrome. Brain. 2008; 131:368-380.
de Brito OM, Scorrano L. Mitofusin 2 tethers endoplasmic reticulum to mitochondria. Nature. 2008; 456:605-610. De Vries DD, Went LN, Bruyn GW, et al. Genetic and biochemical impairment of mitochondrial complex I activity in a family with Leber hereditary optic neuropathy and hereditary spastic dystonia. Am J Hum Genet. 1996; 58:703-711. Degli Esposti M, Carelli V, Ghelli A, et al. Functional alterations of the mitochondrially encoded ND4 subunit associated with Leber's hereditary optic neuropathy. FEBS Lett. 1994; 352:375-379. Delettre C, Lenaers G, Griffoin JM, et al. Nuclear gene OPA1, encoding a mitochondrial dynamin-related protein, is mutated in dominant optic atrophy. Nat Genet. 2000 Oct; 26:207-10. Detmer SA, Chan DC. Functions and dysfunctions of mitochondrial dynamics. Nat Rev Mol Cell Biol. 2007; 8:870-879. D'Herde K, De Prest B, Mussche S, et al. Ultrastructural localization of cytochrome c in apoptosis demonstrates mitochondrial heterogeneity. Cell Death Differ. 2000; 7:331-337. Diaz F, Moraes CT. Mitochondrial biogenesis and turnover. Cell Calcium. 2008; 44:24-35. DiMauro S and Schon EA. Mitochondrial disorders in the nervous system. Annu Rev Neurosci. 2008; 31:91-123. DiMauro S, Schon EA. Mitochondrial respiratory-chain diseases. N Engl J Med. 2003; 348:2656-68. DiMauro S, Schon EA. The mitochondrial respiratory chain and its disorders. In Mitochondrial medicine. Ed. Informa healthcare. 2006. pp. 7-26. Diot A, Guillou E, Daloyau M, et al. Transmembrane segments of the dynamin Msp1p uncouple its functions in the control of mitochondrial morphology and genome maintenance. J Cell Sci 2009; 122:2632-2639.

D'souza A, Kurien BT, Rodgers R, et al. Detection of catalase as a major protein target of the lipid peroxidation product 4-HNE and the lack of its genetic association as a risk factor in SLE. BMC Med Genet. 2008; 9:62.
Ehses S, Raschke I, Mancuso G, et al. Regulation of OPA1 processing and mitochondrial fusion by m-AAA protease isoenzymes and OMA1. J Cell Biol. 2009; 187:1023-1036. Elachouri G, Vidoni S, Zanna C, et al. OPA1 links human mitochondrial genome maintenance to mtDNA replication and distribution. Genome Res. 2011; 21:12-20. Ellouze S, Augustin S, Bouaita A, et al. Optimized allotopic expression of the human mitochondrial ND4 prevents blindness in a rat model of mitochondrial dysfunction. Am J Hum Genet. 2008; 83:373-387. Elpeleg O, Miller C, Hershkovitz E, et al.Deficiency of the ADP-forming succinyl CoA synthase activity is associated with encephalomyopathy and mitochondrial DNA depletion. Am J Hum Genet. 2005; 76:1081-1086. Eskes R, Desagher S, Antonsson B, et al. Bid induces the oligomerization and insertion of Bax into the outer mitochondrial membrane. Mol Cell Biol. 2000; 20:929-935. Evans MJ, Scarpulla RC. NRF-1: a trans-activator of nuclearencoded respiratory genes in animal cells. Genes Dev. 1990; 4:1023-1034. Falkenberg M, Gaspari M, Rantanen A, et al. Mitochondrial transcription factors B1 and B2 activate transcription of human mtDNA. Nat Genet; 2002; 31: 289-294. Falkenberg M, Larsson NG, Gustafsson CM. DNA replication and transcription in mammalian mitochondria. Annu Rev Biochem. 2007; 76:679-699. Fan M, Rhee J, St-Pierre J, et al. Suppression of mitochondrial respiration through recruitment of p160 myb binding protein to PGC-1alpha: modulation by p38 MAPK. Genes Dev. 2004; 18:278-289.
Feng W, Ribeiro RC, Wagner RL, et al. Hormone-dependent coactivator binding to a hydrophobic cleft on nuclear receptors. Science 1998; 280:1747-1749.
Fernández-Silva P, Enriquez JA, Montoya J. Replication and transcription of mammalian mitochondrial DNA. Exp Physiol. 2003; 88:41-56.
Ferraris S, Clark S, Garelli E, et al. Progressive external ophthalmoplegia and vision and hearing loss in a patient with mutations in POLG2 and OPA1. Arch Neurol. 2008; 65:125-131.
Filosto M, Mancuso M. Mitochondrial diseases: a nosological update. Acta Neurol Scand. 2007; 115:211-221.
Flekac M, Skrha J, Hilgertova J, et al. Gene polymorphisms of superoxide dismutases and catalase in diabetes mellitus. BMC Med Genet. 2008;9:30.
Forsberg L, de Faire U, Morgenstern R. Oxidative stress, human genetic variation, and disease. Arch Biochem Biophys. 2001a; 389:84-93.

Forsberg L, Lyrenäs L, de Faire U, et al. A common functional C-T substitution polymorphism in the promoter region of the human catalase gene influences transcription factor binding, reporter gene transcription and is correlated to blood catalase levels. Free Radic Biol Med. 2001b; 30:500-505.
Frey TG, Mannella CA. The internal structure of mitochondria. Trends Biochem Sci. 2000; 25:319-324. Frezza C, Cipolat S, Martins de Brito O, et al. OPA1 controls apoptotic cristae remodeling independently from mitochondrial fusion. Cell. 2006; 126:177-189. Fritz S, Rapaport D, Klanner E, et al. Connection of the mitochondrial outer and inner membranes by Fzo1 is critical for organellar fusion. J. Cell Biol. 2001; 152:683-692.
Fuhrmann N, Alavi MV, Bitoun P, et al. Genomic rearrangements in OPA1 are frequent in patients with autosomal dominant optic atrophy. J Med Genet. 2009; 46:136-144.
Funakawa I, Kato H, Terao A, et al. Cerebellar ataxia in patients with Leber’s hereditar optic neuropathy. J Neurol. 1995; 242:75-77. Funalot B, Reynier P, Vighetto A, et al. Leigh-like encephalopathy complicating Leber's hereditary optic neuropathy. Ann Neurol .2002; 52:374-377. Garrido N, Griparic L, Jokitalo E, et al. Composition and dynamics of human mitochondrial nucleoids. Mol Biol Cell. 2003; 14:1583-1596. Ghelli A, Porcelli AM, Zanna C, et al. Protection against oxidant-induced apoptosis by exogenous glutathione in Leber hereditary optic neuropathy cybrids. Invest Ophthalmol Vis Sci. 2008; 49:671-676. Ghelli A, Zanna C, Porcelli AM, et al. Leber's hereditary optic neuropathy (LHON) pathogenic mutations induce mitochondrial-dependent apoptotic death in transmitochondrial cells incubated with galactose medium. J Biol Chem. 2003; 278:4145-4150.
Gianotti TF, Sookoian S, Dieuzeide G, et al. A decreased mitochondrial DNA content is related to insulin resistance in adolescents. Obesity 2008;16:1591-155.
Gilkerson RW. Mitochondrial DNA nucleoids determine mitochondrial genetics and dysfunction. Int J Biochem Cell Biol. 2009; 41:1899-1906. Giordano C, Montopoli M, Perli E, et al. Oestrogens ameliorate mitochondrial dysfunction in Leber's hereditary optic neuropathy. Brain. 2011; 134:220-234. Gray H, Wong TW. Purification and identification of subunit structure of the human mitochondrial DNA polymerase. J Biol Chem. 1992; 267:5835-5841. Griffin EE, Graumann J and Chan DC. The WD40 protein Caf4p is a component of the mitochondrial fission machinery and recruits Dnm1p to mitochondria. J. Cell Biol. 2005; 170:237-248.

Griparic L, Kanazawa T, van der Bliek AM. Regulation of the mitochondrial dynamin-like protein Opa1 by proteolytic cleavage. J. Cell Biol. 2007; 178:757-764. Griparic L, van der Wel NN, Orozco IJ, et al. Loss of the intermembrane space protein Mgm1/OPA1 induces swelling and localized constrictions along the lengths of mitochondria. J Biol Chem. 2004; 279:18792-18798.
Grochola LF, Zeron-Medina J, Mériaux S, et al. Single-nucleotide polymorphisms in the p53 signaling pathway. Cold Spring Harb Perspect Biol. 2010; 2:a001032.
Günther C, von Hadeln K, Müller-Thomsen T, et al. Possible association of mitochondrial transcription factor A (TFAM) genotype with sporadic Alzheimer disease. Neurosci Lett. 2004; 369:219-223.
Guy J, Qi X, Pallotti F, et al. Rescue of a mitochondrial deficiency causing Leber Hereditary Optic Neuropathy. Ann Neurol. 2002;52:534-542. Hales KG, Fuller MT. Developmentally regulated mitochondrial fusion mediated by a conserved, novel, predicted GTPase. Cell. 1997; 90:121-129. Halliwell B, Gutteridge JM, Cross CE. Free radicals, antioxidants, and human disease: where are we now? J Lab Clin Med. 1992; 119:598-620. Halliwell B, Gutteridge JMC. 2007. Free Radicals in Biology and Medicine. Oxford University Press. New York. Handschin C, Rhee J, Lin J, et al. An autoregulatory loop controls peroxisome proliferator-activated receptor gamma coactivator 1alpha expression in muscle. Proc Natl Acad Sci USA. 2003; 100:7111-7116. Head B, Griparic L, Amiri M, et al. Inducible proteolytic inactivation of OPA1 mediated by the OMA1 protease in mammalian cells. J. Cell Biol. 2009; 187:959-966. Hermann GJ, Thatcher JW, Mills JP,et al. Mitochondrial fusion in yeast requires the transmembrane GTPase Fzo1p. J. Cell Biol. 1998; 143:359-373. Hirano M, Nishigaki Y, Martí R. Mitochondrial neurogastrointestinal encephalomyopathy (MNGIE): a disease of two genomes. Neurologist. 2004; 10:8-17. Holley AK, Dhar SK, St Clair DK. Manganese superoxide dismutase versus p53: the mitochondrial center. Ann N Y Acad Sci. 2010;1201:72-78. Holt IJ, Harding AE, Morgan-Hughes JA. Deletions of muscle mitochondrial DNA in patients with mitochondrial myopathies. Nature. 1988; 331:717-719. Holt IJ, Lorimer HE, Jacobs HT. Coupled leading- and lagging-strand synthesis of mammalian mitochondrial DNA. Cell. 2000; 100:515-524. Howell N, Kubacka I, Xu M, et al. Leber hereditary optic neuropathy: involvement of the mitochondrial ND1 gene and evidence for an intragenic suppressor mutation. Am J Hum Genet. 1991; 48: 935-942.

Howell N, Miller NR, Mackey DA, et al. Lightning strikes twice: Leber hereditary optic neuropathy families with two pathogenic mtDNA mutations. J Neuroophthalmol. 2002; 22:262-269. Hoyt Cs. Autosomal dominant optic atrophy. A spectrum of disability. Ophtalmology 1980; 87:245:251.
Hu Y, Diamond AM. Role of glutathione peroxidase 1 in breast cancer: loss of heterozygosity and allelic differences in the response to selenium. Cancer Res 2003; 63: 3347-3351.
Hudson G, Amati-Bonneau P, Blakely EL, et al. Mutation of OPA1 causes dominant optic atrophy with external ophthalmoplegia, ataxia, deafness and multiple mitochondrial DNA deletions: a novel disorder of mtDNA maintenance. Brain. 2008;131:329-337.
Hudson G, Carelli V, Spruijt L, et al. Clinical expression of Leber hereditary optic neuropathy is affected by the mitochondrial DNA-haplogroup background. Am J Hum Genet. 2007; 81:228-233. Hudson G, Keers S, Yu Wai Man P, et al. Identification of an X-chromosomal locus and haplotype modulating the phenotype of a mitochondrial DNA disorder. Am J Hum Genet. 2005; 77:1086-1091. Hudson G, Yu−Wai−Man P, Zeviani M, Chinnery PF. Genetic variation in the methylenetetrahydrofolate reductase gene, MTHFR, does not alter the risk of visual failure in Leber's hereditary optic neuropathy. Mol Vis 2009; 15:870-875.
Huizing M, Dorward H, Ly L, et al. OPA3, mutated in 3-methylglutaconic aciduria type III, encodes two transcripts targeted primarily to mitochondria. Mol Genet Metab. 2010;100:149-154.
Ishihara N, Fujita Y, Oka T, et al. Regulation of mitochondrial morphology through proteolytic cleavage of OPA1. EMBO J. 2006; 25:2966-2977. Ishikawa K, Funayama T, Ohde H, et al. Genetic variants of TP53 and EPHX1 in Leber's hereditary optic neuropathy and their relationship to age at onset. Jpn J Ophthalmol 2005; 49:121-126. James DI, Parone PA, Mattenberger Y, Martinou JC. hFis1, a novel component of the mammalian mitochondrial fission machinery. J Biol Chem. 2003; 278:36373-363739. Johnson PC, Asbury AK. The pathology of peripheral nerve. Muscle Nerve. 1980; 3:519-528. Johnston PB, Gaster RN, Smith VC, et al. A clinicopathologic study of autosomal dominant optic atrophy. Am J Ophtalmol. 1979; 88: 868-875. Johnston RL, Seller MJ, Behnam JT, et al. Dominant optic atrophy. Refining the clinical diagnostic criteria in light of genetic linkage studies. Ophtalmology 1999; 106:123-128. Jourdain A, Martinou JC. Mitochondrial outer-membrane permeabilization and remodelling in apoptosis. Int J Biochem Cell Biol. 2009; 41:1884-1889. Kaguni LS. DNA polymerase gamma, the mitochondrial replicase. Annu Rev Biochem. 2004; 73:293-320.

Kanazawa T, Zappaterra MD, Hasegawa A, et al. The C. elegans Opa1 homologue EAT-3 is essential for resistance to free radicals. PLoS Genet. 2008; 4:e1000022. Karren MA, Coonrod EM, Anderson TK, et al. The role of Fis1p-Mdv1p interactions in mitochondrial fission complex assembly. J Cell Biol. 2005; 171:291 301. Kaufman BA, Durisic N, Mativetsky JM, et al. The mitochondrial transcription factor TFAM coordinates the assembly of multiple DNA molecules into nucleoid-like structures. Mol Biol Cell. 2007; 18:3225-3236.
Kawamata H, Manfredi G. Import, maturation, and function of SOD1 and its copper chaperone CCS in the mitochondrial intermembrane space. Antioxid Redox Signal. 2010;13:1375-1384.
Kelly DP, Scarpulla RC. Transcriptional regulatory circuits controlling mitochondrial biogenesis and function. Genes Dev. 2004; 18:357-68. Kerr JF, Wyllie AH, Currie, AR. Apoptosis: a basic biological phenomenon with wide-ranging implications in tissue kinetics. Br. J. Cancer 1972; 26:239-257. Kienhöfer J, Häussler DJ, Ruckelshausen F, et al. Association of mitochondrial antioxidant enzymes with mitochondrial DNA as integral nucleoid constituents. FASEB J. 2009; 23:2034-2044. King MP, Attardi G. Human cells lacking mtDNA: repopulation with exogenous mitochondria by complementation. Science. 1989; 246:500-503. Kjer B. Infantile optic atrophy with dominant transmission. Dan Med Bull 1956; 3:135-141. Kjer P, Jensen OA, Klinken L. Histopathology of eye, optic nerve and brain in a case of dominant optic atrophy. Acta Ophtalmol. 1983; 61:300-312.
Kleta R, Skovby F, Christensen E, et al. 3-Methylglutaconic aciduria type III in a non-Iraqi-Jewish kindred: clinical and molecular findings. Mol Genet Metab. 2002; 76:201-206.
Kressler D, Schreiber SN, Knutti D et al. The PGC- 1-related protein PERC is a selective coactivator of estrogen receptor alpha. J. Biol. Chem. 2002 ;277:13918-13925.
Kroemer G, Galluzzi L, Brenner C. Mitochondrial membrane permeabilization in cell death. Physiol Rev 2007; 87:99-163.
Kulawiec M, Ayyasamy V, Singh KK. p53 regulates mtDNA copy number and mitocheckpoint pathway. J Carcinog. 2009;8:8.
La Morgia C, Achilli A, Iommarini L, et al. Rare mtDNA variants in Leber hereditary optic neuropathy families with recurrence of myoclonus. Neurology. 2008; 70:762-770. Labrousse AM, Zappaterra MD, Rube DA, et al. C. Elegans dynamin related protein DRP-1 controls severing of the mitochondrial outer membrane. Mol Cell. 1999; 4:815-826.
Lai CQ, Tucker KL, Parnell LD, et al. PPARGC1A variation associated with DNA damage, diabetes, and cardiovascular diseases: the Boston Puerto Rican Health Study. Diabetes. 2008; 57:809-816.

Landes T, Leroy I, Bertholet A, et al. OPA1 (dys)functions. Semin Cell Dev Biol. 2010; 21:593-598. Larsson NG, Andersen O, Holme E, et al. Leber’s hereditary optic neuropathy and complex I deficiency in muscle. Ann Neurol. 1991; 30:701-708. Larsson NG, Wang JM, Wilhelmsson H, et al. Mitochondrial transcription factor A is necessary for mtDNA maintenance and embryogenesis in mice. Nature Genet. 1998; 18: 231-236.
Lebedeva MA, Eaton JS, Shadel GS. Loss of p53 causes mitochondrial DNA depletion and altered mitochondrial reactive oxygen species homeostasis. Biochim Biophys Acta. 2009; 1787:328-334.
Leber T. Ueber hereditaere und congenital angelegte Sehnervenleiden. Graefes Arch Ophthal. 1871; 17: 249-291. Lee YJ, Jeong SY, Karbowski M, et al. Roles of the mammalian mitochondrial fission and fusion mediators Fis1, Drp1, and Opa1 in apoptosis. Mol Biol Cell. 2004; 15:5001-5011. Legros F, Malka F, Frachon P, et al. Organization and dynamics of human mitochondrial DNA. J Cell Sci. 2004; 117:2653-2662. Lenaz G. Role of mitochondria in oxidative stress and ageing. Biochim Biophys Acta. 1998; 1366:53-67. Lin J, Puigserver P, Donovan J, Tarr P, et al..Peroxisome proliferator-activated receptor γ coactivator 1β (PGC-1β), a novel PGC-1-related transcription coactivator associated with host cell factor. J. Biol. Chem. 2002a; 277:1645-1648. Lin J, Tarr PT, Yang R, et al. PGC-1beta in the regulation of hepatic glucose and energy metabolism. J Biol Chem. 2003; 278:30843-30848. Lin J, Wu H, Tarr PT, et al. Transcriptional co-activator PGC-1 alpha drives the formation of slow-twitch muscle fibres. Nature. 2002b; 418:797-801. Ling C, Poulsen P, Carlsson E, et al. Multiple environmental and genetic factors influence skeletal muscle PGC-1alpha and PGC-1beta gene expression in twins. J Clin Invest. 2004; 114:1518-1526. Liu X, Weaver D, Shirihai O, Hajnoczky G. Mitochondrial ‘kiss-and-run’: interplay between mitochondrial motility and fusion-fission dynamics. EMBO J 2009; 28:3074-3089.
Liu YF, Wat NM, Chung SS, et al. Diabetic nephropathy is associated with the 5'-end dinucleotide repeat polymorphism of the aldose reductase gene in Chinese subjects with Type 2 diabetes. Diabet Med. 2002; 19:113-118.
Lodi R, Carelli V, Cortelli P, et al. Phosphorus MR spectroscopy shows a tissue specific in vivo distribution of biochemical expression of the G3460A mutation in Leber's hereditary optic neuropathy. J Neurol Neurosurg Psychiatry. 2002; 72:805-807. Lodi R, Taylor DJ, Tabrizi SJ, et al. In vivo skeletal muscle mitochondrial function in Leber's hereditary optic neuropathy assessed by 31P magnetic resonance spectroscopy. Ann Neurol. 1997; 42:573-579.

Lodi R, Tonon C, Valentino ML, et al. Defective mitochondrial adenosine triphosphate production in skeletal muscle from patients with dominant optic atrophy due to OPA1 mutations. Arch Neurol. 2011; 68:67-73.
Lyle WM. Genetic risks. A reference for eye care practitioners. Waterloo, Ontario, Canada: University of Waterllo Press, 1990. Majander A, Finel M, Savontaus ML, et al. Catalytic activity of complex I in cell lines that possess replacement mutations in the ND genes in Leber's hereditary optic neuropathy. Eur J Biochem. 1996; 239:201-207. Majander A, Huoponen K, Savontaus ML, et al. Electron transfer properties of NADH:ubiquinone reductase in the ND1/3460 and the ND4/11778 mutations of the Leber hereditary optic neuroretinopathy (LHON). FEBS Lett. 1991; 292:289-292.
Makiishi T, Araki S, Koya D, et al. C-106T polymorphism of AKR1B1 is associated with diabetic nephropathy and erythrocyte aldose reductase content in Japanese subjects with type 2 diabetes mellitus. Am J Kidney Dis. 2003; 42:943-951.
Malka F, Guillery O, Cifuentes-Diaz C, et al. Separate fusion of outer and inner mitochondrial membranes. EMBO Rep. 2005; 6:853-859. Man PY, Brown DT, Wehnert MS, et al. NDUFA−1 is not a nuclear modifier gene in Leber hereditary optic neuropathy. Neurology 2002; 58:1861-1862. Man PY, Griffiths PG, Brown DT, et al. The epidemiology of Leber hereditary optic neuropathy in the North East of England. Am J Hum Genet. 2003a; 72:333-339. Man PY, Morris CM, Zeviani M, et al. The role of APOE in the phenotypic expression of Leber hereditary optic neuropathy. J Med Genet. 2003b; 40:e41. Manfredi G, Fu J, Ojaimi J, et al. Rescue of a deficiency in ATP synthesis by transfer of MTATP6, a mitochondrial DNA-encoded gene, to the nucleus. Nat Genet. 2002; 30:394-399. Mao CC, Holt IJ. Clinical and molecular aspects of diseases of mitochondrial DNA instability. Chang Gung Med J. 2009; 32:354-369. Marchington DR, Macaulay V, Hartshorne GM, et al. Evidence from human oocytes for a genetic bottleneck in an mtDNA disease. Am J Hum Genet. 1998; 63:769-775. Margulis L. Symbiotic theory of the origin of eukaryotic organelles; criteria for proof. Symp Soc Exp Biol. 1975; 29:21-38. Mashima Y, Hiida Y, Oguchi Y. Remission of Leber's hereditary optic neuropathy with idebenone. Lancet. 1992; 340:368-369. Mashima Y, Kigasawa K, Wakakura M, et al. Do idebenone and vitamin therapy shorten the time to achieve visual recovery in Leber hereditary optic neuropathy? J Neuroophthalmol. 2000; 20:166-170.
Matlashewski GJ, Tuck S, Pim D, Lamb P, Schneider J, Crawford LV. Primary structure polymorphism at amino acid residue 72 of human p53. Mol Cell Biol. 1987; 7:961-963.
Meeusen S, DeVay R, Block J, et al. Mitochondrial inner-membrane fusion and crista maintenance requires the dynamin-related GTPase Mgm1. Cell. 2006; 127:383-395. Meier P, Finch A, Evan G. Apoptosis in development. Nature 2000; 407:796-801. Melov S, Coskun P, Patel M, et al. Mitochondrial disease in superoxide dismutase 2 mutant mice. Proc Natl Acad Sci USA. 1999; 96:846-851. Messerschmitt M, Jakobs S, Vogel F, et al. The inner membrane protein Mdm33 controls mitochondrial morphology in yeast. J Cell Biol. 2003; 160:553-564.
Mihara M, Erster S, Zaika A, et al. p53 has a direct apoptogenic role at the mitochondria. Mol Cell. 2003;11:577-590.
Mitchell P. Coupling of phosphorylation to electron and hydrogen transfer by chemiosomotic type of mechanism. Nature. 1961; 191:144-148. Montoya J, López-Pérez MJ, Ruiz-Pesini E. Mitochondrial DNA transcription and diseases: past, present and future. Biochim Biophys Acta. 2006; 1757:1179-1189. Moraes CT. What regulates mitochondrial DNA copy number in animal cells? Trends Genet. 2001; 17:199-205. Newman NJ, Biousse V, David R, et al. Prophylaxis for second eye involvement in leber hereditary optic neuropathy: an open-labeled, nonrandomized multicenter trial of topical brimonidine purite. Am J Ophthalmol. 2005; 140:407-415. Newman NJ. Leber’s optic neuropathy. In Walsh and Hoyt’s Clinical Neuro-Ophthalmology. Edited by Miller NR, Newman NJ. Williams & Wilkins. 1998; pp. 742-753. Nicholls DG, Ferguson SJ. Bioenergetics 3 Academic press, London, 2002. Nikoskelainen E, Hoyt WF, Nummelin K, et al. Fundus findings in Leber's hereditary optic neuroretinopathy. III. Fluorescein angiographic studies. Arch Ophthalmol. 1984; 102:981-989. Nikoskelainen E, Hoyt WF, Nummelin K. Ophthalmoscopic findings in Leber's hereditary optic neuropathy. II. The fundus findings in the affected family members. Arch Ophthalmol. 1983; 101:1059-1068. Nikoskelainen E, Hoyt WF, Nummelin K. Ophthalmoscopic findings in Leber's hereditary optic neuropathy. I. Fundus findings in asymptomatic family members. Arch Ophthalmol. 1982; 100:1597-1602. Nikoskelainen E, Wanne O, Dahl M. Pre-excitation syndrome and Leber’s hereditary optic neuroretinopathy. Lancet. 1985; 1:696. Nikoskelainen EK, Marttila RJ, Huoponen K, et al. Leber's "plus": neurological abnormalities in patients with Leber's hereditary optic neuropathy. J Neurol Neurosurg Psychiatry. 1995; 59:160-164.

Nishino I, Spinazzola A, Hirano M.Thymidine phosphorylase gene mutations in MNGIE, a human mitochondrial disorder. Science. 1999 Jan; 283:689-692. Nisoli E, Carruba MO. Nitric oxide and mitochondrial biogenesis. J Cell Sci. 2006; 119:2855-2862. Nisoli E, Clementi E, Paolucci C, et al. Mitochondrial biogenesis in mammals: the role of endogenous nitric oxide. Science. 2003; 299:896-899.
Nolte RT, Wisely GB, Westin S, et al. Ligand binding and co-activator assembly of the peroxisome proliferator-activated receptor-gamma. Nature 1998; 395:137-143.
Oca-Cossio J, Kenyon L, Hao H, et al. Limitations of allotopic expression of mitochondrial genes in mammalian cells. Genetics. 2003; 165:707-720. Okamoto K, Shaw JM. Mitochondrial morphology and dynamics in yeast and multicellular eukaryotes. Annu Rev Genet. 2005; 39:503-536. Olichon A, Baricault L, Gas N, et al. Loss of OPA1 perturbates the mitochondrial inner membrane structure and integrity, leading to cytochrome c release and apoptosis. J Biol Chem 2003; 278:7743-7746. Olichon A, Elachouri G, Baricault L, et al. OPA1 alternate splicing uncouples an evolutionary conserved function in mitochondrial fusion from a vertebrate restricted function in apoptosis. Cell Death Differ. 2007a; 14:682-692. Olichon A, Emorine LJ, Descoins E, et al. The human dynamin-related protein OPA1 is anchored to the mitochondrial inner membrane facing the inter-membrane space. FEBS Lett. 2002; 523:171-176.
Olichon A, Landes T, Arnauné-Pelloquin L, et al. Effects of OPA1 mutations on mitochondrial morphology and apoptosis: relevance to ADOA pathogenesis. J Cell Physiol. 2007b; 211:423-430.
Oostra RJ, Kemp S, Bolhuis PA, et al. No evidence for 'skewed' inactivation of the X-chromosome as cause of Leber's hereditary optic neuropathy in female carriers. Hum Genet. 1996; 97:500-505.
Owczarek-Lipska M, Plattet P, Zipperle L, et al. A nonsense mutation in the optic atrophy 3 gene (OPA3) causes dilated cardiomyopathy in Red Holstein cattle. Genomics. 2011; 97:51-57.
Panduru NM, Cimponeriu D, Cruce M, et al. Association of +35A/C (intron3/exon3) polymorphism in SOD1-gene with diabetic nephropathy in type 1 diabetes. Rom J Morphol Embryol. 2010; 51:37-41.
Paradies G, Petrosillo G, Paradies V, Ruggiero FM. Oxidative stress, mitochondrial bioenergetics, and cardiolipin in aging. Free Radic Biol Med. 2010; 48:1286-1295.
Park BS, Song YS, Yee SB, et al. Phospho-ser 15-p53 translocates into mitochondria and interacts with Bcl-2 and Bcl-xL in eugenol-induced apoptosis. Apoptosis 2005; 10:193-200.

Park JS, Li YF, Bai Y. Yeast NDI1 improves oxidative phosphorylation capacity and increases protection against oxidative stress and cell death in cells carrying a Leber's hereditary optic neuropathy mutation. Biochim Biophys Acta. 2007; 1772:533-542.
Park JY, Wang PY, Matsumoto T, et al. p53 improves aerobic exercise capacity andaugments skeletal muscle mitochondrial DNA content. Circ Res. 2009; 105:705-712.
Pegoraro E, Carelli V, Zeviani M, et al. X-inactivation patterns in female Leber's hereditary optic neuropathy patients do not support a strong X-linked determinant. Am J Med Genet. 1996; 61:3563-62. Pegoraro E, Vettori A, Valentino ML, et al. X-inactivation pattern in multiple tissues from two Leber's hereditary optic neuropathy (LHON) patients. Am J Med Genet A. 2003; 119A:37-40.
Pei W, Kratz LE, Bernardini I, et al. A model of Costeff Syndrome reveals metabolic and protective functions of mitochondrial OPA3. Development. 2010; 137:2587-2596.
Pello R, Martín MA, Carelli V, et al. Mitochondrial DNA background modulates the assembly kinetics of OXPHOS complexes in a cellular model of mitochondrial disease. Hum Mol Genet. 2008; 17:4001-4011.
Perier C, Tieu K, Guégan C, Caspersen C, Jackson-Lewis V, Carelli V, Martinuzzi A, Hirano M, Przedborski S, Vila M. Complex I deficiency primes Bax-dependent neuronal apoptosis through mitochondrial oxidative damage. Proc Natl Acad Sci U S A. 2005; 102:19126-19131.
Perkins GA, Renken CW, Frey TG, Ellisman MH. Membrane architecture of mitochondria in neurons of the central nervous system. J Neurosci Res. 2001; 66:857-865. Perotti ME, Anderson WA, Swift H. Quantitative cytochemistry of the diaminobenzidine cytochrome oxidase reaction product in mitochondria of cardiac muscle and pancreas. J Histochem Cytochem. 1983; 31:351-365. Petruzzella V, Tessa A, Torraco A, et al. The NDUFB11 gene is not a modifier in Leber hereditary optic neuropathy. Biochem Biophys Res Commun. 2007; 355:181-187.
Phasukkijwatana N, Kunhapan B, Stankovich J, et al. Genome-wide linkage scan and association study of PARL to the expression of LHON families in Thailand. Hum Genet. 2010; 128:39-49.
Pinz KG, Bogenhagen DF. Characterization of a catalytically slow AP lyase activity in DNA polymerase gamma and other family A DNA polymerases. J Biol Chem. 2000; 275:12509-12514. Pinz KG, Bogenhagen DF. Efficient repair of abasic sites in DNA by mitochondrial enzymes. Mol Cell Biol. 1998; 18:1257-1265.
Powell BL, Wiltshire S, Arscott G, et al. Association of PARL rs3732581 genetic variant with insulin levels, metabolic syndrome and coronary artery disease. Hum Genet. 2008; 124:263-270.
Puigserver P, Rhee J, Lin J, et al. Cytokine stimulation of energy expenditure through p38 MAP kinase activation of PPARgamma coactivator-1. Mol Cell. 2001; 8:971-982.

Puigserver P, Wu Z, Park CW, et al. A cold-inducible coactivator of nuclear receptors linked to adaptive thermogenesis. Cell 1998; 92:829-839. Qi X, Sun L, Hauswirth WW, et al. Use of mitochondrial antioxidant defenses for rescue of cells with a Leber hereditary optic neuropathy-causing mutation. Arch Ophthalmol. 2007; 125:268-272. Ramos Cdo V, Bellusci C, Savini G, et al. Association of optic disc size with development and prognosis of Leber's hereditary optic neuropathy. Invest Ophthalmol Vis Sci. 2009; 50:1666-1674.
Rangel-López A, Piña-Sánchez P, Salcedo M. Genetic variations of the tumor suppressor TP53: outstanding and strategies of analysis. Rev Invest Clin. 2006; 58:254-264.
Rantanen A, Jansson M, Oldfors A, et al. Downregulation of Tfam and mtDNA copy number during mammalian spermatogenesis. Mammalian Genome. 2001; 12: 787-792. Rapaport D, Brunner M, Neupert W et al. Fzo1p is a mitochondrial outer membrane protein essential for the biogenesis of functional mitochondria in Saccharomyces cerevisiae. J. Biol. Chem. 1998; 273:20150-20155.
Reynier P, Amati-Bonneau P, Verny C, et al. OPA3 gene mutations responsible for autosomal dominant optic atrophy and cataract. J Med Genet. 2004; 41:e110.
Rhee SG. Cell signaling. H2O2, a necessary evil for cell signaling. Science. 2006; 312:1882-1883. Rodgers JT, Lerin C, Haas W, et al. Nutrient control of glucose homeostasis through a complex of PGC-1alpha and SIRT1. Nature. 2005; 434:113-118. Rojo M, Legros F, Chateau, D, et al. Membrane topology and mitochondrial targeting of mitofusins, ubiquitous mammalian homologs of the transmembrane GTPase Fzo. J. Cell Sci. 2002; 115:1663-1674. Rotig A, de Lonlay P, Chretien D, et al. Aconitase and mitochondrial iron-sulphur protein deficiency in Friedreich ataxia. Nat Genet. 1997; 17: 215-217. Rustin P, Rotig A. Inborn errors of complex II - unusual human mitochondrial diseases. Biochim Biophys Acta. 2002; 1553:117-122.
Ryu SW, Jeong HJ, Choi M, et al. Optic atrophy 3 as a protein of the mitochondrial outer membrane induces mitochondrial fragmentation. Cell Mol Life Sci. 2010; 67:2839-2850.
Sadun AA, Win PH, Ross-Cisneros FN, et al. Leber's hereditary optic neuropathy differentially affects smaller axons in the optic nerve. Trans Am Ophthalmol Soc. 2000;98:223-232. Santel A and Fuller MT. Control of mitochondrial morphology by a human mitofusin. J. Cell Sci. 2001; 114:867-874. Saraste M. Oxidative phosphorylation at the fin de siècle. Science. 1999; 283:1488-1493. Satoh M, Hamamoto T, Seo N, et al. Differential sublocalization of the dynamin-related protein OPA1 isoforms in mitochondria. Biochem Biophys Res Commun. 2003; 300:482-493.

Scacchi R, Gambina G, Moretto G, et al. Association study between P53 and P73 gene polymorphisms and the sporadic late-onset form of Alzheimer's disease. J Neural Transm. 2009; 116:1179-1184.
Scarpulla RC. Nuclear control of respiratory gene expression in mammalian cells. J Cell Biochem. 2006; 97:673-683. Scarpulla RC. Transcriptional activators and coactivators in the nuclear control of mitochondrial function in mammalian cells. Gene. 2002; 286:81-89. Scarpulla RC. Transcriptional paradigms in mammalian mitochondrial biogenesis and function. Physiol Rev. 2008; 88:611-638. Schoeler S, Winkler-Stuck K, Szibor R, et al. Glutathione depletion in antioxidant defense of differentiated NT2-LHON cybrids. Neurobiol Dis. 2007; 25:536-544. Schultz BE, Chan SI. Structures and proton-pumping strategies of mitochondrial respiratory enzymes. Annu Rev Biophys Biomol Struct. 2001; 30:23-65. Scorrano L, Ashiya M, Buttle K, et al. A distinct pathway remodels mitochondrial cristae and mobilizes cytochrome c during apoptosis. Dev Cell. 2002; 2:55-67. Shankar SP, Fingert JH, Carelli V, et al. Evidence for a novel x-linked modifier locus for leber hereditary optic neuropathy. Ophthalmic Genet. 2008; 29:17-24. Shoubridge EA. Mitochondrial DNA segregation in the developing embryo. Hum Reprod. 2000; 2:229-234. Skulachev VP. Mitochondrial filaments and clusters as intracellular power transmitting cables. Trends Biochem. Sci. 2001; 26:23-29. Smirnova E, Griparic L, Shurland DL, van der Bliek AM. Dynamin-related protein Drp1 is required for mitochondrial division in mammalian cells. Mol Biol Cell. 2001; 12:2245-2256. Smirnova E, Shurland DL, Ryazantsev SN et al. A human dynamin-related protein controls the distribution of mitochondria. J. Cell Biol. 1998; 143: 351-358.
Soerensen M, Christensen K, Stevnsner T, et al. The Mn-superoxide dismutase single nucleotide polymorphism rs4880 and the glutathione peroxidase 1 single nucleotide polymorphism rs1050450 are associated with aging and longevity in the oldest old. Mech Ageing Dev. 2009; 130:308-314.
Song Z, Chen H, Fiket M, et al.. OPA1 processing controls mitochondrial fusion and is regulated by mRNA splicing, membrane potential, and Yme1L. J. Cell Biol. 2007; 178:749-755. Song Z, Ghochani M, McCaffery JM, et al. Mitofusins and OPA1 mediate sequential steps in mitochondrial membrane fusion. Mol Biol Cell. 2009; 20:3525-3532. Spelbrink JN. Functional organization of mammalian mitochondrial DNA in nucleoids: history, recent developments, and future challenges. IUBMB Life. 2010; 62:19-32.

Spinazzi M, Cazzola S, Bortolozzi M, et al. A novel deletion in the GTPase domain of OPA1 causes defects in mitochondrial morphology and distribution, but not in function.Hum Mol Genet. 2008; 17:3291-3302.
Spinazzola A, Viscomi C, Fernandez-Vizarra E, et al. MPV17 encodes an inner mitochondrial membrane protein and is mutated in infantile hepatic mitochondrial DNA depletion. Nat Genet. 2006; 38:570-575. Spinazzola A, Zeviani M. Disorders from perturbations of nuclear-mitochondrial intergenomic cross-talk. J Intern Med 2009; 265:174-192. Spinazzola A, Zeviani M. Disorders of nuclear-mitochondrial intergenomic communication. Biosci Rep. 2007; 27: 39-51. Stoneking M. Mitochondrial DNA and human evolution. J Bioenerg Biomembr 1994; 26:251-259. Strachan T, Read AP. Human Molecular Genetics. 2nd edition. New York: Wiley-Liss; 1999.
Su Y, Peng SB, Li ZQ, et al. Association study between PPARGC1A Thr394Thr/Gly482Ser polymorphisms and type 2 diabetes. Yi Chuan. 2008; 30:304-308.
Suen DF, Norris KL, Youle RJ. Mitochondrial dynamics and apoptosis. Genes Dev. 2008; 22:1577-1590. Sutovsky P, Moreno RD, Ramalho-Santos J, et al. Ubiquitin tag for sperm mitochondria. Nature. 1999; 402:371-372. Sutovsky P, Moreno RD, Ramalho-Santos J, et al. Ubiquitinated sperm mitochondria, selective proteolysis, and the regulation of mitochondrial inheritance in mammalian embryos. Biol Reprod. 2000; 63:582-590.
Sutton A, Imbert A, Igoudjil A, et al. The manganese superoxide dismutase Ala16Val dimorphism modulates both mitochondrial import and mRNA stability. Pharmacogenet Genomics. 2005; 15:311-319.
Sutton A, Nahon P, Pessayre D, et al. Genetic polymorphisms in antioxidant enzymes modulate hepatic iron accumulation and hepatocellular carcinoma development in patients with alcohol-induced cirrhosis. Cancer Res. 2006; 66:2844-2852.
Suzuki M, Youle RJ, Tjandra N. Structure of Bax: coregulation of dimer formation and intracellular localization. Cell. 2000; 103:645-654. Szabadkai G, Simoni AM, Bianchi K, et al. Mitochondrial dynamics and Ca2+ signaling. Biochim Biophys Acta. 2006; 1763:442-449. Taylor RC, Cullen SP, Martin SJ. Apoptosis: controlled demolition at the cellular level. Nature Rev. Mol. Cell Biol. 2008; 9:231-241. Thornberry N, Lazebnik Y. Caspases: enemies within. Science. 1998; 281:1312-1316.

Tondera D, Czauderna F, Paulick K, Schwarzer R, Kaufmann J, Santel A. The mitochondrial protein MTP18 contributes to mitochondrial fission in mammalian cells. J Cell Sci. 2005; 118:3049-3059. Torroni A, Huoponen K, Francalacci P, et al. Classification of European mtDNAs from an analysis of three European populations. Genetics. 1996; 144:1835–1850. Twig G, Hyde B, Shirihai OS. Mitochondrial fusion, fission and autophagy as a quality control axis: the bioenergetic view. Biochim Biophys Acta. 2008; 1777:1092-1097. van Gurp M, Festjens N, van Loo G, et al. Mitochondrial intermembrane proteins in cell death. Biochem Biophys Res Commun. 2003; 304:487-497.
Varma T, Liu SQ, West M, et al. Protein kinase C-dependent phosphorylation and mitochondrial translocation of aldose reductase. FEBS Lett. 2003; 534:175-179.
Vaux DL, Korsmeyer SJ. Cell death in development. Cell 1999; 96:245-54.
Verny C, Amati-Bonneau P, Dubas F, et al. An OPA3 gene mutation is responsible for the disease associating optic atrophy and cataract with extrapyramidal signs. Rev Neurol (Paris). 2005; 161:451-454.
Vila M, Przedborski S. Targeting programmed cell death in neurodegenerative diseases. Nat Rev Neurosci. 2003; 4:365-375. Virbasius CA, Virbasius JV, Scarpulla RC. NRF-1, an activator involved in nuclear-mitochondrial interactions, utilizes a new DNA-binding domain conserved in a family of developmental regulators. Genes Dev. 1993; 7:2431-2445. Votruba M, Fitzke FW, Holder GE, et al. Clinical features in affected individuals from 21 pedigrees with dominant optic atrophy. Arch Ophtalmol. 1998; 116: 351-358. Votruba M, Leary S, Losseff N, et al. MRI of the intraorbital optic nerve in patients with autosomal dominant optic atrophy. Neuroradiology 2000; 42: 180-183. Wallace DC, Singh G, Lott MT, et al. Mitochondrial DNA mutation associated with Leber’s hereditary optic neuropathy. Science 1988, 242:1427-1430. Wallace DC. A mitochondrial paradigm of metabolic and degenerative diseases, aging, and cancer: a dawn for evolutionary medicine. Annu Rev Genet. 2005; 39:359-407. Wang Y, Bogenhagen DF. Human mitochondrial DNA nucleoids are linked to protein folding machinery and metabolic enzymes at the mitochondrial inner membrane. J Biol Chem. 2006; 281:25791-25802. Waterham HR, Koster J, van Roermund CW, et al. A lethal defect of mitochondrial and peroxisomal fission. N Engl J Med 2007; 356:1736-1741. Westermann B. Mitochondrial fusion and fission in cell life and death. Nat Rev Mol Cell Biol. 2010; 11:872-884.
Wiener HW, Perry RT, Chen Z, et al. A polymorphism in SOD2 is associated with development of Alzheimer's disease. Genes Brain Behav. 2007; 6:770-775.
Wirtenberger M, Tchatchou S, Hemminki K et al. Associations of genetic variants in the estrogen receptor coactivators PPARGC1A, PPARGC1B and EP300 with familial breast cancer. Carcinogenesis. 2006; 27:2201-2208.
Wong A, Cavelier L, Collins-Schramm HE, et al. Differentiation-specific effects of LHON mutations introduced into neuronal NT2 cells. Hum Mol Genet. 2002; 11:431-438.
Wredenberg A, Wibom R, Wilhelmsson H, et al. Increased mitochondrial mass in mitochondrial myopathy mice. Proc Natl Acad Sci U S A. 2002; 99:15066-15071.
Wu Z, Puigserver P, Andersson U, et al. Mechanisms controlling mitochondrial biogenesis and respiration through the thermogenic coactivator PGC-1. Cell. 1999; 98:115-24. Yang MY, Bowmaker M, Reyes A, et al. Biased incorporation of ribonucleotides on the mitochondrial L-strand accounts for apparent strand-asymmetric DNA replication. Cell. 2002; 111:495-505. Yarosh W, Monserrate J, Tong JJ,et al. The molecular mechanisms of OPA1-mediated optic atrophy in Drosophila model and prospects for antioxidant treatment. PLoS Genet. 2008; 4:e6. Yoon JC, Puigserver P, Chen GX, et al. Control of hepatic gluconeogenesis through the transcriptional coactivator PGC-1. Nature. 2001; 413:131-138. Yoon Y, Krueger EW, Oswald BJ, et al. The mitochondrial protein hFis1 regulates mitochondrial fission in mammalian cells through an interaction with the dynamin-like protein DLP1. Mol Cell Biol. 2003; 23:5409-5420. Youle RJ, Karbowski M. Mitochondrial fission in apoptosis. Nat Rev Mol Cell Biol. 2005; 6:657-663. Youle RJ, Strasser A. The BCL-2 protein family: opposing activities that mediate cell death. Nat Rev Mol Cell Biol 2008; 9:47-59. Yu-Wai-Man P, Griffiths PG, Hudson G, et al. Inherited mitochondrial optic neuropathies. J Med Genet. 2009; 46:145-58. Zamzami N, Kroemer G. The mitochondrion in apoptosis: how Pandora's box opens. Nat Rev Mol Cell Biol. 2001; 2:67-71. Zanna C, Ghelli A, Porcelli AM, et al. Apoptotic cell death of cybrid cells bearing Leber's hereditary optic neuropathy mutations is caspase independent. Ann N Y Acad Sci. 2003; 1010:213-217.
Zanna C, Ghelli A, Porcelli AM, et al. OPA1 mutations associated with dominant optic atrophy impair oxidative phosphorylation and mitochondrial fusion. Brain. 2008; 131:352-367.

Zanna C, Ghelli A, Porcelli AM, et al.Caspase-independent death of Leber's hereditary optic neuropathy cybrids is driven by energetic failure and mediated by AIF and Endonuclease G. Apoptosis 2005; 10:997-1007.
Zhang AM, Jia X, Zhang Q, Yao YG. No association between the SNPs (rs3749446 and rs1402000) in the PARL gene and LHON in Chinese patients with m.11778G>A. Hum Genet. 2010; 128:465-468.
Zhang P, Hinshaw JE. Three-dimensional reconstruction of dynamin in the constricted state. Nat Cell Biol. 2001; 3:922-926.
Zhang Q, Yu JT, Wang P, et al. Mitochondrial transcription factor A (TFAM) polymorphisms and risk of late-onset Alzheimer's disease in Han Chinese. Brain Res. 2011;1368:355-360.
Zhang Y and Chan DC. Structural basis for recruitment of mitochondrial fission complexes by Fis1. Proc. Natl Acad. Sci. USA 2007; 104:18526-18530. Zhang Y, Marcillat O, Giulivi C, et al. The oxidative inactivation of mitochondrial electron transport chain components and ATPase. J Biol Chem. 1990; 265:16330-16336. Zong H, Ren JM, Young LH, et al. AMP kinase is required for mitochondrial biogenesis in skeletal muscle in response to chronic energy deprivation. Proc Natl Acad Sci USA. 2002; 99:15983-15987.

Appendix Primer sequences, PCR conditions, restriction enzymes, siRNAs sequences LHON common mutations
LHON 11778 Fw: 5’-GAATGTAGGAGTAATGATAAG-3’ Rv: 5’-ATTATCGAAAAACTACTGAAC-3’ 1 cycle 94°C x 5’ - - 25 cycles 94°C x 30’’, 55°C x 60’’, 72°C x 2’30’’ 1 cycle 72°C x 7’ LHON 14484 Fw: 5’-ATCATATAGGTTTCTGTTGGT-3’ Rv: 5’-GGGACTGGGGGTACGGAGTC-3’ 1 cycle 94°C x 5’ 25 cycles 94°C x 30’’, 49°C x 60’’, 72°C x 2’30’’ 1 cycle 72°C x 7’ LHON 3460 Fw: 5’-AAGTGTTTCGCGGAAGGGGG-3’ Rv: 5’-GAGTAACATGGGTAAGATTA-3’ 1 cycle 94°C x 5’ 30 cycles 94°C x 30’’, 55°C x 30’’, 72°C x 2’30’’ 1 cycle 72°C x 7’ RFLP nuclear genes
PGC1α Gly482Ser Fw: 5’-TGCTACCTGAGAGAGACTTTG-3’ Rv: 5’- CTTTCATCTTCGCTGTCATC-3’ 1 cycle 94°C x 5’ 30 cycles 94°C x 60’’, 60°C x 60’’, 72°C x 60’’ 1 cycle 72°C x 10’ HpaII (Fermentas), 16 hours at 37°C PGC-1β Ala203Pro Fw: 5’-GTGGGGCTTTGTCAGTGAAT-3’ Rv: 5’- GGACTCTGGAGGCATGGTG-3’ 1 cycle 94°C x 5’ 30 cycles 94°C x 60’’, 58°C x 60’’, 72°C x 60’’ 1 cycle 72°C x 10’ NlaIV (Fermantas), 16 hours at 37°C p53 Pro72Arg Fw: 5’-TTGCCGTCCCAAGCAATGGATGA-3’ Rv: 5’- TCTGGGAAGGGACAGAAGATGAC-3’ 1 cycle 94°C x 5’ 30 cycles 94°C x 60’’, 60°C x 60’’, 72°C x 60’’ 1 cycle 72°C x 10’

AccII (Fermentas), 2 hours at 37°C Tfam Ser12Thr Fw: 5’- CCCCGCCCCCATCTTSCCGA-3’ Rv: 5’- GACGTCCTGGGCCCTGCTG-3’ 1 cycle 94°C x 5’ 30 cycles 94°C x 60’’, 61°C x 60’’, 72°C x 60’’ 1 cycle 72°C x 10’ DdeI (Fermentas), 16 hours at 37°C PARL Leu212Val Fw: 5’- GGGGCGAAAGAGTGAAAT-3’ Rv: 5’- GGGTGAAGGGTATATGAGAACC-3’ 1 cycle 94°C x 5’ 30 cycles 94°C x 30’’, 55°C x 30’’, 72°C x 30’’ 1 cycle 72°C x 10’ MvaI (Fermentas), 16 hours at 37°C PARL -191T/C Fw: 5’- GCCTGGTATGTGCCGTTACT-3’ Rv: 5’- GCAACACCATAGAGCACGAG-3’ 1 cycle 94°C x 5’ 30 cycles 94°C x 30’’, 55°C x 30’’, 72°C x 30’’ 1 cycle 72°C x 10’ BbvI (Fermentas), 16 hours at 65°C MnSOD Ala16Val Fw: 5’- ACCAGCAGGCAGCTGGCGCCGG-3’ Rv: 5’- GCGTTGATGTGAGGTTCCAG-3’ 1 cycle 94°C x 5’ 30 cycles 94°C x 30’’, 61°C x 30’’, 72°C x 30’’ 1 cycle 72°C x 10’ Cac8-I (Biolabs), 16 hours at 37°C GPx-1 Pro189Leu Fw: 5’- TGTGCCCCTACGCAGGTACA-3’ Rv: 5’- CCCCCGAGACAGCAGCA-3’ 1 cycle 94°C x 5’ 30 cycles 94°C x 30’’, 55°C x 30’’, 72°C x 30’’ 1 cycle 72°C x 10’ ApaI (Fermentas), 16 hours at 37°C ALRD1 -106C/T Fw: 5’- GTCTAAGAACAAAGTGCGGTAAAC-3’ Rv: 5’- CGCCGTTGTTGAGCAGGAGAC-3’ 1 cycle 94°C x 5’ 30 cycles 94°C x 60’’, 59°C x 60’’, 72°C x 60’’ 1 cycle 72°C x 10’ FspBI (Fermentas), 16 hours at 37°C

Cu/ZnSOD +35A/C Fw: 5’- CTATCCAGAAAACACGGTGGGCC-3’ Rv: 5’- TCTATATTCAATCAAATGCTACAAAACC-3’ 1 cycle 94°C x 5’ 30 cycles 94°C x 60’’, 55°C x 60’’, 72°C x 60’’ 1 cycle 72°C x 10’ HingI (Fermentas), 2 hours at 37°C CAT -21A/T Fw: 5’- CCAATCAGAAGGCAGTCCTC -3’ Rv: 5’- CCGCTTTCTAAACGCACCTT -3’ 1 cycle 94°C x 5’ 30 cycles 94°C x 60’’, 58°C x 60’’, 72°C x 60’’ 1 cycle 72°C x 10’ HinfI (Fermentas), 16 hours at 37°C CAT -262C/T Fw: 5’- TAAGAGCTGAGAAAGCATAGCT -3’ Rv: 5’- AGAGCCTCGCCCCGCCGGACCG -3’ 1 cycle 94°C x 5’ 30 cycles 94°C x 60’’, 60°C x 60’’, 72°C x 60’’ 1 cycle 72°C x 10’ SmaI (Fermentas), 2 hours at 30°C Real Time-PCR assay
OPA3V1 human Fw: 5’- CTCCCGCCGGCTCAACTGTA - 3’ Rv: 5’- GCCCACGATGAAGATGGTGGCT -3’
OPA3V2 human Fw: 5’- CCCGCCGGCTCAACTGTACC - 3’ Rv: 5’- GGCAGCTGCAGGCGGTGAT -3’ OPA1 human Fw: 5’- TGCGGAGGACAGCTTGAGGGTT - 3’ Rv: 5’- TTGAGACGAGCCTGCAGAGCCT - 3’ RPL27 human Fw: 5’- AGCTGTCATCGTGAAGAACAT - 3’ Rv: 5’- CTTGGCGATCTTCTTCTTGCC -3’
OPA3V1 mouse Fw: 5’-CCCAGCTGTACCACTGGGTG - 3’ Rv: 5’-ACCTCATCCTGCAGAGCGTTC -3’
OPA3V2 mouse Fw: 5’-CCCAGCTGTACCACTGGCTA - 3’ Rv: 5’-CTGGGCAATGCTGCCTGCAC -3’

OPA1 mouse Fw: 5’-AGAAATCTCAGCCTTGCTGTG - 3’ Rv: 5’-ACAGGGATTGCTGCAGGATTT-3’ RPL27 mouse Fw: 5’- ACGCAAAGCCGTCATCGTGAAG - 3’ Rv: 5’- CTTGGCGATCTTCTTCTTGCC -3’
Preincubation: 1 cycle 95°C x 10’ Amplification : 45 cycle 95°C x 30’’, 56°C x 20’’, 72°C x 25’’, acquisition of fluorescence signal Melting curve: 1 cycle 95°C x 5’, 64°C x 1’, 65°C - 97°C (ramp rate 0.11°C/s), acquisition of fluorescence in continuous
OPA3 siRNAs duplex sequences siEx1 sense 5’-GCGCGUUCCCUAUGGCGAAAUU- 3’ antisense 5’-UUCGCCAUAGGGAACGCGCUU-3’ siEx2 sense 5’-GCACAGAGCUGCAAGAGGUUU- 3’ antisense 5’-ACCUCUUGCAGCUCUGUGCUU-3’ siEx2b sense 5’-GCACAAAGUUCCUACGGACUU- 3’ antisense 5’-GUCCGUAGGAACUUUGUGCUU-3’

Acknowledgements
This work has been supported by Fondazione “Giuseppe Tommasello” ONLUS and Programma
Marco Polo, University of Bologna.
Thanks to
Prof. Michela Rugolo, Dr. Anna Ghelli, Dr. Sara Vidoni, Dr. Claudia Zanna, Department of
Evolutionistic Experimental Biology, University of Bologna, Italy
Dr. Valerio Carelli, Dr. Luisa Iommarini, Dr. Leonardo Caporali, Department of Neurological
Sciences, University of Bologna, Italy
Prof. Guy Lenaers and Dr. Cecile Delettre, Institut des Neurosciences de Montpellier (INM),
Montpellier, France
Prof. Giulia d’Amati and Dr. Carla Giordano, Department of Experimental Medicine, University La
Sapienza, Roma, Italy