Embed Size (px)
Citation preview

Page 1 of 29
Knowledge, Analysis and
Intelligence (KAI)
Author: Max Rowe-Brown
and Huw James
Date: November 2020
Patent Box Evaluation
Abstract
Patent box policies are a widespread tax incentive that offer a reduced corporate
tax rate on profits derived from intellectual property (IP). Much of the patent box
literature addresses arguments that the policies encourage international tax
competition, enable profit shifting, and provide little benefit to the economy.
However, almost no work to date has been done on the effect of patent boxes on
company outcomes. We use micro-level company data to assess the impact of the
UK Patent Box on firm-level capital investment using a difference-in-difference
approach. When comparing against our control group, we find that firms using
the patent box display an approximate 10% increase in investment over the post-
implementation period. Our results should however be interpreted with some
caution, owing to limitations of the data and the identification strategy employed.
Acknowledgements and disclaimer
The work presented in this report would not have been possible without the input
from colleagues both inside and outside HMRC. We are particularly grateful to Dr.
Emma Gorman and Prof. Peter Urwin from the University of Westminster for their
constructive comments. We also thank officials from HMRC and HM Treasury for
taking part in roundtable discussions. The views expressed in this paper are those
of the author and do not necessarily represent those of HMRC. Any remaining
errors are the author’s own responsibility.
This publication may be reported free of charge in any format or medium,
provided it is reproduced accurately and not used in a misleading context. The
material must be acknowledged as Crown copyright with the title and source of
the publication specified. This document has been made accessible, however,
some parts may not be fully accessible for some assistive technologies.

Page 2 of 29
Contents
1. Introduction .................................................................................... 3
2. Policy Background ........................................................................... 4
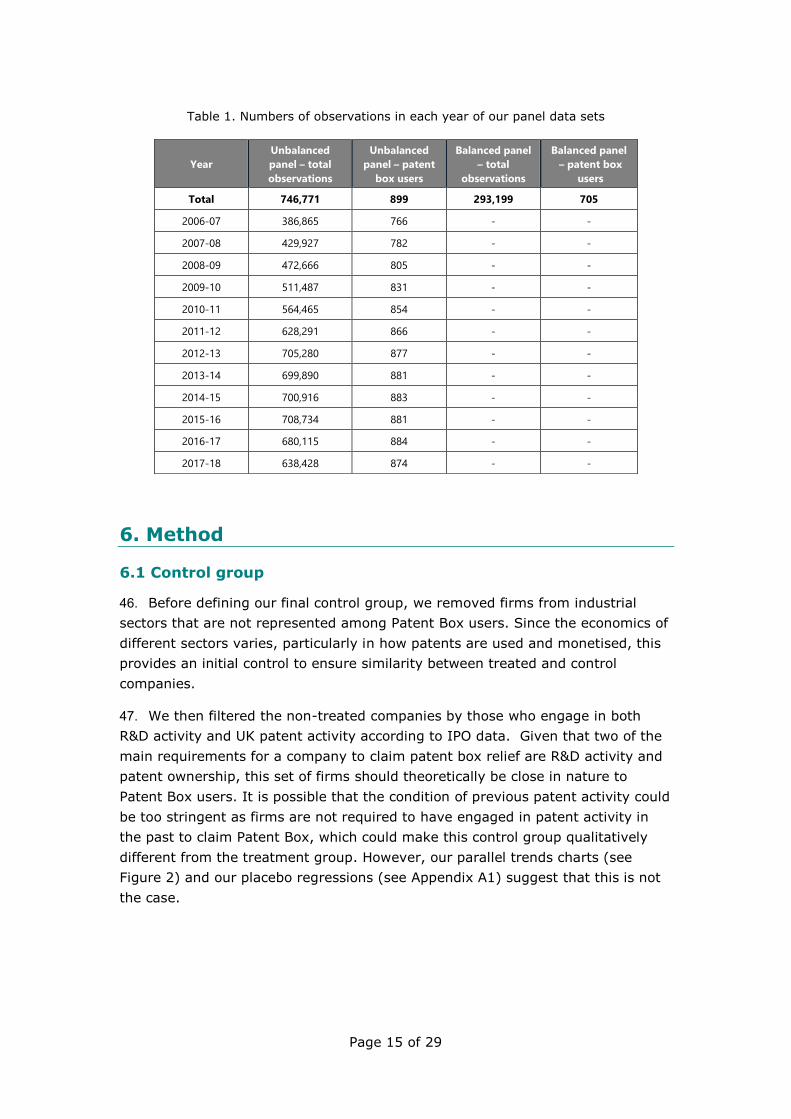
3. Literature Review ............................................................................ 5
4. Conceptual Framework ..................................................................... 9
5. Data ............................................................................................ 13
6. Method ......................................................................................... 15
6.1 Control group .......................................................................... 15
6.2 Treatment group ...................................................................... 16
6.3 Estimation strategy .................................................................. 20
7. Results ......................................................................................... 23
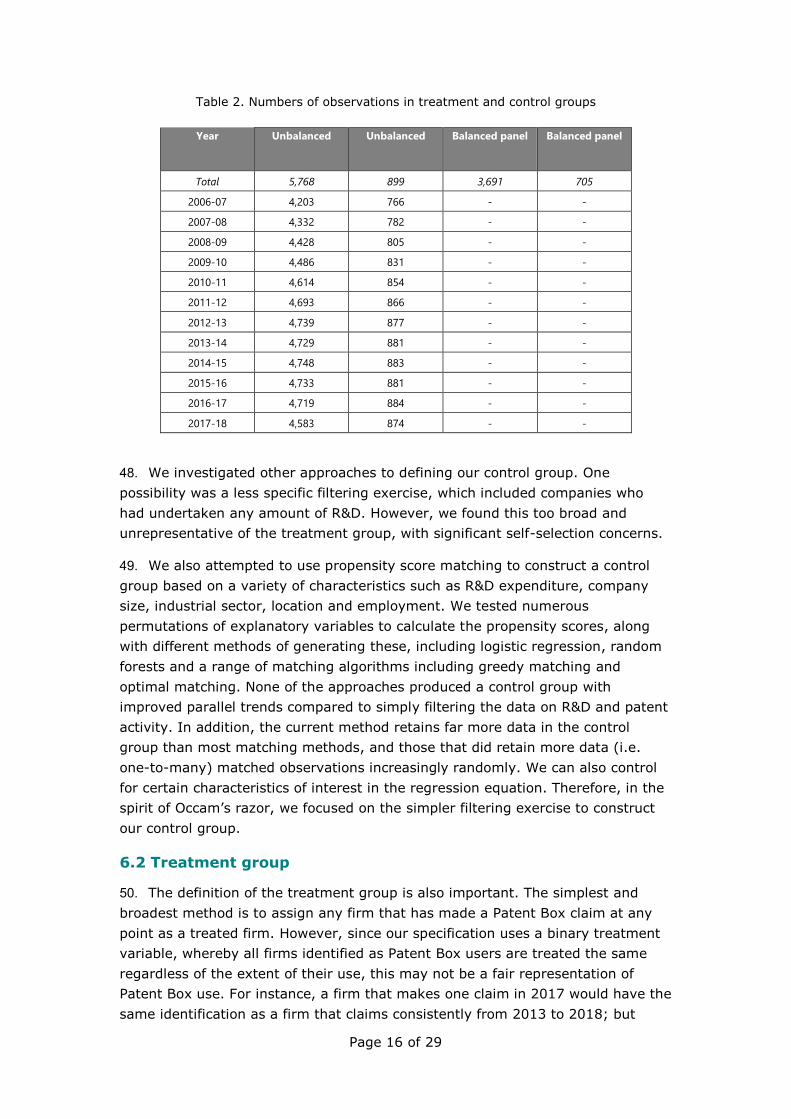
8. Discussion .................................................................................... 24
9. Conclusion .................................................................................... 27
References ....................................................................................... 28
Page 3 of 29
1. Introduction
1. Patent box policies are a relatively recent and increasingly popular type of tax
incentive. They offer a financial benefit to companies that exploit intellectual
property (IP) locally, with the intention of encouraging further investment in a
given country. (Over the past five years, new rules set by OECD have required
the benefit to be linked more closely to R&D undertaken by the company itself.)
Generally, a patent box allows a company to pay tax on profits derived from their
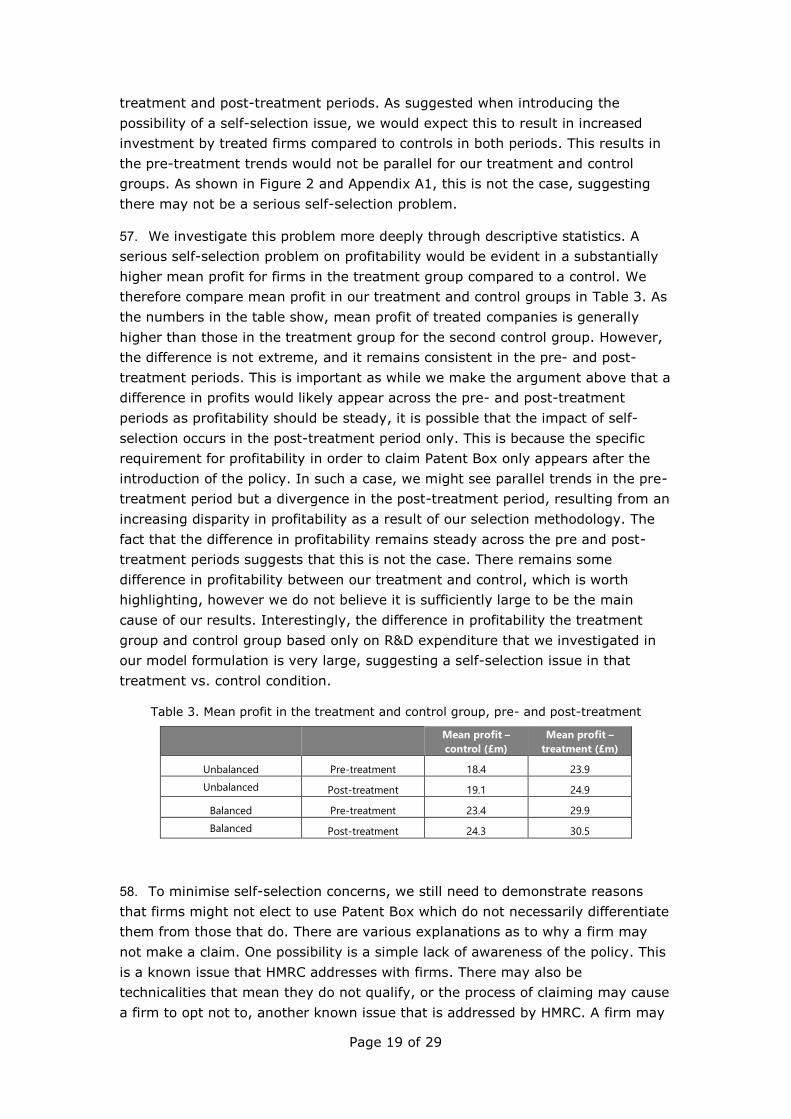
IP below the statutory Corporate Tax (CT) rate.
2. There is a large body of research on the efficacy of R&D incentives such as
the UK’s R&D tax credits. This is unsurprising as R&D incentives are more
established, and incentivising R&D investment is a major trend in attempts to
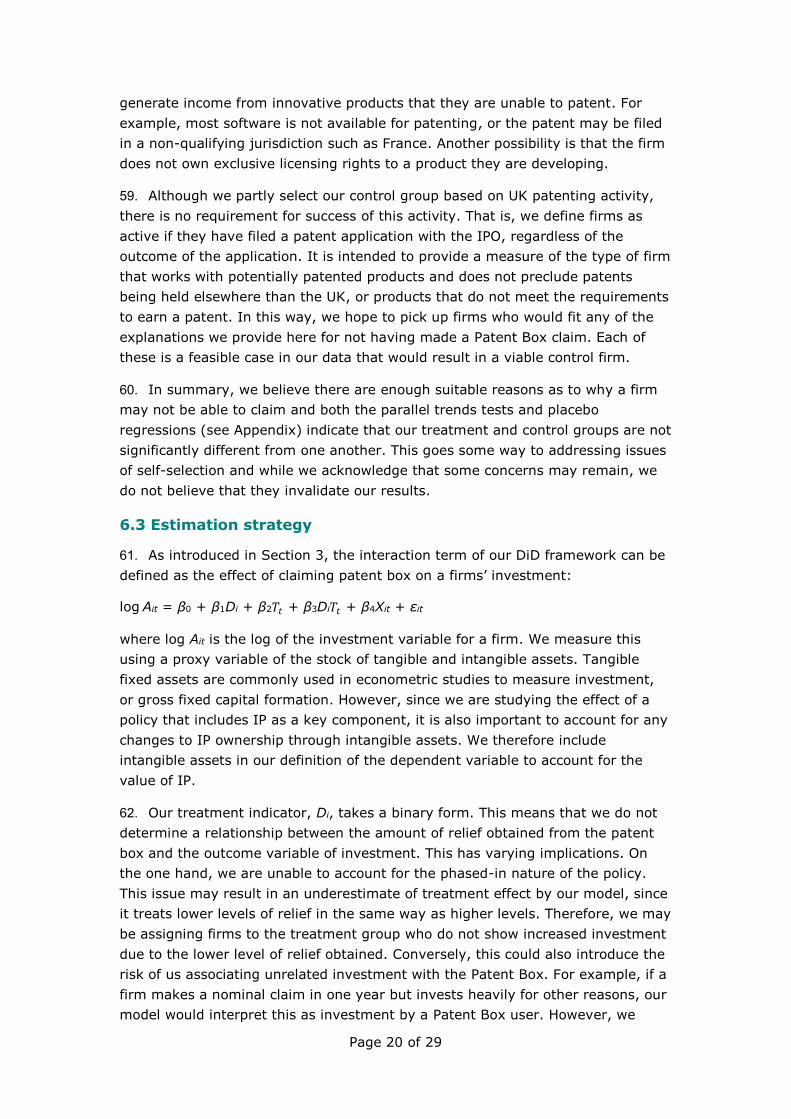
stimulate economic growth, particularly in the aftermath of the financial crisis
(Guceri & Liu, 2019). Patent box policies have received comparatively little
attention. While the body of patent box literature is growing, most published work
focuses on aspects such as company decisions, using publicly available data such
as European Patent Office (EPO) filings to investigate how the presence of a
patent box policy can influence where companies locate their IP (Griffith, et al.,
2011; Alstadsæter, et al., 2018). The inference in these studies is that a
company’s decision to locate IP in a country with a patent box is one of tax
competition over investment.
3. The problem with this current trend of patent box research is that it does not
always assess the policy intent of patent boxes. While the areas of research
mentioned above are important – particularly from the point of view of profit
shifting and international tax competition – few studies have examined whether
patent boxes achieve their stated policy objectives. One exception to this is an
evaluation by Mohnen, et al. (2017). They calculated a bang-for-buck measure of
company outcomes of the Dutch innovation box; however, the outcomes they
investigated do not represent the aim of the UK Patent Box very well. The UK’s
Patent Box is intended to encourage the commercialisation of patents and similar
IP in the UK, through for example bringing a patented product or service to
market, so that the UK benefits from the activities associated with
commercialisation. It aims to do this by:
• incentivising companies whose IP is already in the UK to invest in the
commercialisation and undertake exploitation of that IP in the UK
• providing an incentive for companies whose IP is outside of the UK to
develop it in the UK and then invest in commercialisation and undertake
exploitation activities in the UK
• reducing the risk of companies whose IP is in the UK shifting it outside of
the UK and thus investing in commercialisation and undertake exploitation
activities in a foreign jurisdiction.
4. However, there is a lack of empirical evidence on whether the UK Patent Box
is meeting its objective. In order to fill that gap, we undertake a micro-
econometric evaluation to assess whether the policy is achieving its goal, through
examining the extent to which it has incentivised investment in the UK. Although
we are unable to provide a bang-for-buck estimate like Mohnen, et al. (2017), our
methods will indicate whether the patent box has increased investment in the UK,
and the approximate size of that effect.
5. This paper contributes to the literature in two key ways. Firstly, it provides an
evaluation of the UK Patent Box from a policy intention perspective, by measuring
whether the UK Patent Box has encouraged greater investment in the UK. This is
the first study of its kind to look at investment outcomes as an appraisal of a
patent box policy and is important in the context of investigating its efficacy.
Secondly, our work adds to the slim body of research that uses micro-level data
to perform an econometric evaluation of a patent box. To our knowledge, only
Mohnen, et al. (2017) have published work with a similar framework using micro-
econometric analysis.
Page 4 of 29
6. We use a difference-in-difference approach within a regression framework to
investigate the investment of firms that have used the patent box compared to an
equivalent control group, using data from accounting periods ending in 2006-07
to 2017-18. If the patent box has been successful at increasing investment in the
UK, we expect to find that firms who have used the patent box will show
increased tangible and intangible assets compared to a control group of similar
firms that do not use the patent box.
7. The paper is presented as follows. After addressing the policy background in
section 2, we provide a review of the relevant literature in section 3. Section 4
sets out the conceptual framework. Section 5 details the data we use in the
analysis and section 6 sets out our econometric approach. In section 7 we present
our results, with a discussion of our findings in section 8, where we address the
caveats to our work. We conclude in section 89
2. Policy Background
8. The UK Patent Box was introduced in the 2012 Finance Act and allows
companies to apply a lower CT rate of 10% to relevant profits from qualifying IP.
The policy was phased in from April 2013, restricting the lower CT rate to a
proportion of eligible profits; starting at 60% in the financial year 2013-14 with
full relief available from 1 April 2017 onwards. The intention of the UK Patent Box
is to encourage companies to invest in the UK by retaining and commercialising
their IP and locating skilled employment in the country.
9. Changes were made to the UK Patent Box in 2016 to comply with OECD rules
on base erosion and profit shifting (BEPS). These changes formalised the
requirement for ‘significant’ R&D to have been undertaken towards the qualifying

Page 5 of 29
IP by the company making the claim1; previously it could have been another
company in the group. The result of this legislation is a tighter restriction on what
is eligible for the lower rate of CT via the Patent Box. Several countries currently
have similar patent box policies, offering a lower rate of corporate tax on profits
derived from IP. Most have been introduced recently. The number of EU countries
with a patent box in their tax regime increased from two in 1995, to eleven as of
2015 (Bräutigam, et al., 2017), with more implemented since. The Netherlands
have a similar ‘Innovation Box’, with wider scope, which started as a patent box
in 2007 before the definition of qualifying IP was broadened.
10. However, a number of arguments have been made against patent boxes,
including: allegations that they enable tax planning (Straathof, et al., 2014),
encourage tax competition between nations (Evers, et al., 2015), only benefit
already successful companies (Alstadsæter, et al., 2018), or are ineffective
(Gaessler, et al., 2018). Concerns about tax competition, and specifically profit
shifting, have been further addressed by Action 5 of the OECD BEPS project
(known as the modified Nexus approach) which aims to ensure that any tax
benefit from IP profits is linked to the R&D undertaken towards that IP (OECD,
2015). Much of the literature addresses the above-mentioned arguments, but
little has done so from the point of view of company outcomes.
3. Literature Review
11. Broadly, current patent box research appears to focus on two areas. Most
papers cover IP location strategies or filing behaviour and use macro data. In the
literature review of their paper, Gaessler, et al. (2018) present a collection of
empirical works that relate directly to patent boxes. Most research covers the
period between 1995 and 2015, as this is when most patent box policies were
introduced (Bräutigam, et al., 2017). In total, Gaessler, et al. (2018) identify
seven papers on corporate taxation and patent location, and a further eight that
specifically analyse the effect of patent boxes on patent location and transfer of
IP.
12. In one example, Griffith, et al. (2011) used PATSTAT data from the European
Patent Office (EPO) and Bureau van Dijk (BvD) company data, finding that tax
rates and the presence of a patent box can influence a company’s decision of
where to locate IP. Also using EPO data, as well as the EU Industrial R&D
Scoreboard, Alstadsædter, et al. (2018) investigate the determinants of patent
registration with a focus on the tax benefits offered by patent box regimes. They
1 It should be noted that prior to FA16 there was already a requirement for a business to meet the
‘development’ and ‘active ownership’ conditions to be a qualifying company for the Patent Box
(s357BC and BE CTA09 respectively) to prevent IP holding companies from being eligible. The
changes in FA16 brought in an ‘R&D Fraction’ to provide the complete transparency and substantive
activity required by OECD as part of Action 5 on BEPS, in addition to the existing requirements.
Page 6 of 29
find a small impact of patent box policies on the location of patent registrations.
This paper also looked at the effect of patent boxes on local R&D activity, finding
little impact. Gaessler, et al. (2018) themselves use EPO PATSAT data to
investigate whether patents are transferred to countries for the purpose of
gaining a tax advantage. They suggest a small impact of patent boxes on transfer
of IP, but not innovation itself.
13. Papers that discuss the effect of patent boxes on the location of patent filings
are not directly related to our research question, which concerns company
investment outcomes. However, similar studies do suggest a negative relationship
between corporate tax rate and intangible assets. For example, Karkinsky &
Riedel (2012) found that a one percentage point increase in tax rate can reduce
patent filings by 3.5%. Logically a decrease in corporate tax rate, say via a patent
box, would have the opposite effect. Furthermore, the location of IP may
indirectly reflect increased investment: if for example development, production
and/or sales of the products derived from that IP were located with the IP itself.
This is reflective of UK Patent Box’s aims – to ensure that investment associated
with IP, having been developed in the UK, is realised there. The work highlighted
above is somewhat limited to measuring intangible assets or IP registration but
much of it does show that patent boxes can encourage IP to be registered in a
given jurisdiction. The current paper will extend this to both tangible and
intangible assets to assess the UK Patent Box and its impact on investment more
generally.
14. The second area of patent box research, which is often covered within papers
such as those described above, looks at whether patent boxes are effective at
stimulating innovation. Gaessler, et al. (2018) do this by looking at the number of
patent filings in countries with a patent box regime. For 12 countries, they plot
graphs of patent filings over time, either side of the introduction of a patent box.
They follow this with a regression, measuring patent filings as a function of the
existence of a patent box, CT rate, population, real GDP, R&D–GDP ratio, and a
set of year and country dummies. This shows a weak negative effect, at the 10%
significance level, of the presence of a patent box on the number of patent filings.
There are however several issues with this analysis. Firstly, out of the 12
countries investigated, 4 have almost no data available after the implementation
of a patent box. One of these countries is the UK, so data this result is based on
are somewhat lacking. Additionally, the policies were implemented at different
times (leading to the data issues), so time-variant effects can also not be ruled
out as affecting the analysis.
15. In a paper that is closer in nature to the current work, Mohnen, et al. (2017)
conducted an econometric evaluation of the Dutch Innovation Box and its impact
on local R&D activity. The authors believed this to be the first study of its kind on
patent boxes; Gaessler, et al. (2018) also acknowledge this to be the case in their
literature review. The success of their methods offers a proof of concept for those
in the present work.

Page 7 of 29
16. Although the outcome variable of interest differs from the current work –
their dependent variable is R&D expenditure, while we use a measure of
investment – this paper most closely resembles ours among the literature, given
the methodology and their use of micro-level data. They use a difference-in-
difference approach to assess the effect of the Innovation Box on R&D
expenditure. Given that the policy changed almost yearly after its introduction,
Mohnen, et al. (2017) extended their DiD framework to allow for multiple
‘generations’ of policy users. Their results indicate an increase in R&D spend by
innovation box users, with a ‘bang-for-buck’ estimate of 0.5.
17. Aside from arguments about tax competition and profit shifting, which are
addressed by Action 5 of the OECD BEPS project (the modified Nexus approach),
all the studies presented above consider patent boxes from the perspective of
their impacts on innovation or R&D. It is on this basis that many deem patent
boxes to be ineffective. Alstadsæter, et al. (2018) neatly articulate a common line
of theoretical criticism: “unlike expense-based tax incentives for R&D, [patent
box] schemes do not reward firms for the social benefits that they cannot
appropriate. Instead, they award additional tax benefits to a successful innovation
that already enjoys IP protection." This argument is particularly relevant where
patent box regimes allow already patented products to qualify for reduced tax on
profits. The implication of this is that patent boxes provide no real economic
benefit. Instead, they simply reduce the tax payable on the profits of already
successful innovation (since the product has been patented and is generating
sales) and which is already protected by being patented (and therefore restricts
sales to the owning company, increasing profit).
18. In the same paper the authors also look at “the interaction between patent
box regimes and local R&D activities as this is an often-advocated justification for
granting preferential tax treatment”. This highlights an important point in relation
to the framing of patent box research and poses an important question: why are
we interested in impacts on investment, as opposed to R&D? The widely held
belief is that patent box policies aim to stimulate R&D and innovation, and with
good reason: various countries’ patent box-style initiatives explicitly mention this
in their policies. For example, the Dutch innovation box is intended “to encourage
innovation by companies registered in the Netherlands” (NLO, n.d.). As Mohnen,
et al. (2017) state in their paper, “stimulating R&D is the explicit goal of the
policy” with an emphasis on the returns of R&D contributing to innovation and its
associated economic benefits. The Polish patent box, introduced in January 2019,
includes among its main purposes “retaining and increasing the attractiveness of
conducting R&D activity by Polish and foreign entrepreneurs” and “encouraging
new/potential entrepreneurs to undertake R&D activity in Poland” (European
Commission, 2019). There is a clear focus on innovation R&D in the
implementation of these policies.
19. The UK Patent Box, in contrast, has a slightly different rationale. While the
potential for encouraging development of new innovative products is
acknowledged, it is not the key aim of the policy. As stated in the Tax Information
Page 8 of 29
Impact Note, published alongside Finance Act 2012: “The aim of the Patent Box is
to provide an additional incentive for companies to retain and commercialise
existing patents and to develop new innovative patented products. This will
encourage companies to locate the high-value jobs associated with the
development, manufacture and exploitation of patents in the UK and maintain the
UK’s position as a world leader in patented technologies.” (HM Revenue and
Customs, 2013). The focus here is on investment and employment associated
with commercialisation in the UK. Therefore, evaluating the UK Patent Box solely
by virtue of its impacts on R&D spend or patent filing would not be an accurate
representation of the policy. While it has perhaps become more significant post-
Action 5, the incentivisation of further R&D in the UK, through increasing the
post-tax returns to successful projects, is a subsidiary effect of the Patent Box.
20. The UK already has several R&D-focused incentives, which are explicitly
geared towards supporting R&D. These are complementary to the Patent Box but
with different goals. (For a more detailed look at the effectiveness of the UK R&D
regime, see Guceri & Liu (2019) or Foakes, et al. (2015)). One could argue that
R&D incentives are designed to stimulate innovation and the Patent Box aims to
ensure that innovation results is commercialised in the UK.
21. This is a view offered by Shanahan (2011). He remarks that “Patent boxes
may be seen as the logical follow-up to the research and development tax credits
currently offered by many countries: while the research and development credits
serve to incentivize activities that are likely to result in innovation, patent box
regimes serve to entice innovative corporations to exploit such innovations within
the country.” This is the benefit that UK sought to encourage with its patent box
policy.
22. From a theoretical point of view this makes sense, considering the
mechanisms by which policies hope to affect company decisions. Some tax
incentives are expenditure-based, offering relief for current expenditure. Many
R&D incentives operate this way, for example by reducing the user cost of (R&D)
capital, which represents the pre-tax return necessary to break even. In contrast,
patent boxes are an income-based tax incentive, offering advantageous tax
treatment of income that results from R&D. While this does not mean R&D cannot
be incentivised through such means, it highlights the structural difference
between typical R&D incentives and patent box policies. This fits with the notion
that the potential benefits of patent boxes lie with commercialisation rather than
R&D. So how should we consider the success of the Patent Box in encouraging
commercialisation in the UK?
23. Logically, the commercialisation of patents is likely to lead to investment in
UK business. The increased value of balance sheet assets, both tangible and
intangible, may reflect the expansion of operations in order to bring a product to
market or increase market share as additional capital items or additional IP
acquisitions are brought in. This could be through the acquisition of plant and
machinery required for a patented manufacturing process or in manufacturing a
Page 9 of 29
patented product, or through the consolidation of a group’s IP in the UK alongside
the management and exploitation of its patents here. It is also not uncommon
for external investors to invest in innovative businesses, which will be reflected on
the balance sheet and the eventual upward cycle will be reinvestment into R&D,
which is a welcome secondary outcome.
24. Another potential indicator of the Patent Box’s effectiveness is employment
outcomes. Increased employment is an indication that volume or range of output
is increasing and is a regularly used to measure of company growth. However,
limitations in the available data on employment (discussed in more detail in
section 4) mean we are unable to satisfactorily estimate employment outcomes of
Patent Box use. We therefore focus on measuring investment to represent policy
success.
25. Although no previously published work assesses the role of patent boxes in
investment outcomes, the impact of tax rates on investment has been well
studied. As mentioned above, some studies have shown a negative relationship
between tax rate and patent applications or intangible assets. Furthermore, there
is evidence of a negative relationship between tax rates and capital investment,
and that this persists across a number of countries (Hall & Jorgensen, 1967;
Vergara, 2010; Chatelain & Tiomo, 2001). Indeed, incentivising investment and
economic growth is an argument oft-used by governments for reducing tax rates.
In terms of a patent box, the logic is the same: a lower effective tax rate for
companies using the patent box ought to encourage investment, in terms of both
tangible and intangible assets.
4. Conceptual Framework
26. As detailed above, we are interested in evaluating the UK Patent Box based
on its aims, which centre around the commercialisation of new and existing IP.
Commercialisation can be defined as the process of bringing new products or
services to market. However, identifying a simple metric that measures
commercialisation is not so straightforward. There are several facets to the
process of commercialisation, including (but not limited to): production,
distribution, marketing and sales. Bringing together these aspects is difficult. For
the purposes of this evaluation we use a measure of investment, via tangible and
intangible assets, to measure commercialisation in relation to the policy’s aims.
27. As touched upon above, a large proportion of activity that is related to
commercialisation is correlated with increased investment and assets. For
example, the commercialisation of physical patented products requires the setting
up of structures to produce and sell such products, which requires investment in
tangible capital assets. This could be not just in buildings, but also plant and
machinery. Using assets as our measure of investment is also relevant as it gives
a measure of presence in the UK. This relates to the intention of the Patent Box
to keep firms operating in the UK – firms leaving the UK would be evidenced by a
Page 10 of 29
reduction of UK assets and likewise an increased presence should display the
opposite effect.
28. We also look at intangible assets to cover additions to the balance sheet that
may occur with the commercialisation of patents in the UK. There may also be
other intangible assets recognised on the balance sheet that are associated with
the marketing of patented products, such as trademarks. Patents moved to the
UK will appear on the balance sheet as intangible assets and should be
accompanied by physical activity for a firm to successfully claim the relief. The
patent box rules, even prior to the changes in 2016, required active ownership
and development conditions to be fulfilled to for a firm to successfully claim
patent box relief. This intended to ensure that any IP moved to the UK is
managed and exploited in the UK in line with the policy aim, and this is further
supported by the implementation of the Nexus fraction from 2016 onwards.
29. We considered alternative methods of measuring ‘investment in the UK’. For
example, an individual investor might use the size of the return on their original
investment as a measure of success. However, such information on a company’s
investment in specific (patented) products is not obtainable. Based on the
availability of data and the prevalence of assets as a proxy for investment in the
literature, we conclude that the best approach available for examining how well
the Patent Box meets its policy aim is to examine assets on the UK balance sheet
as a measure of increased investment. This covers external investment, revalued
IP and capital expenditure. Revenue expenditure is not included as it may be a
consequence of too many other factors.
30. We are aware that these measures do not provide a complete picture of
commercialisation or the full suite of intended policy outcomes mentioned in
section 2. One area which we do not measure relates to employment. For
example, employee numbers are associated with commercialisation via sales and
marketing, and more generally are often used to measure ‘growth’. Furthermore,
the policy aims mention ‘high-value jobs’ associated with the development and
ownership of patents. This is an area that can be assessed by metrics such as
average employee remuneration. However, the available data on employment
(from the ‘Financial Accounting Made Easy’ database) is not sufficiently well-
populated to investigate these areas in our evaluation, so we have focused here
on our measure of investment. While we acknowledge that this is by no means a
complete measure of ‘commercialisation’ and the policy intention, we believe that
it captures a large part of it.
31. Our expectation is that the Patent Box encourages commercialisation, via
investment, by reducing the user cost of capital. The user cost of capital is the
rate of return that a marginal investment must make to recover its cost. The
corporate tax rate is a component of this (Hall & Jorgensen, 1967). A lower
corporate tax rate, in this case from claiming the Patent Box, should reduce the
user cost of capital. This makes investment more likely to be viable and
commercialisation more attractive.

Page 11 of 29
32. We use quasi-experimental methods to approximate a controlled experiment
and isolate the effect of Patent Box use on investment. For this we employ a
difference-in-difference (DiD) approach within a regression framework. The use of
DiD allows us to compare companies who have used the Patent Box to an
equivalent control group, differencing out individual effects whilst controlling for
time-invariant global effects.
33. As is often the case in empirical policy evaluation, it is difficult to conduct a
truly experimental study of the effect of the Patent Box. The effects on company
outcomes of interventions implemented through the tax system are often
inextricable from other causes, such as global economic factors or individual
differences. In addition, treatment (use of the Patent Box) is observed, in the
sense that companies themselves elect to use the Patent Box or not, introducing
the risk of a self-selection problem. In an ideal experiment, treatment would be
assigned randomly, but this is not possible here. We discuss the issue of self-
selection in more detail in Section 5. The DiD method is our best effort at
approximating a random assignment as it allows us to analyse time-series data
where we are lacking a true counterfactual, i.e. Patent Box users who have not
used the Patent Box. Another benefit of using DiD in our case is that we can use
DiD with unbalanced panel data.
34. The identification of a control group is fundamental to the confidence in our
model. One of the key assumptions of DiD methods is the parallel trends
assumption, which states that pre-treatment trends in the outcome variable
should be equivalent between the control and treatment groups. It then follows
that post-treatment outcomes in the treatment and control groups would exhibit
the same trend in the absence of treatment, allowing us to assign any observed
difference in post-treatment trends to the policy intervention. It is therefore vital
that we choose a set of firms that are as similar as possible in nature to those
using the Patent Box to satisfy the parallel trends assumption. The construction of
our control groups is detailed in Section 5.
35. To our knowledge, the one other study in the literature that evaluates a
patent box-style policy at a micro level also uses the DiD method (Mohnen, et al.,
2017). In their paper, the authors employ an approach that compares successive
generations of policy users due to the frequent changes of the policy over time.
In contrast, the UK Patent Box has remained more consistent than the Dutch
Innovation Box. Although the level of Patent Box relief has increased yearly since
it was implemented in 2013, the fundamentals of the policy remained constant
until 2016, when the modified nexus approach was introduced. Since data are
only available to 2017-18 there is insufficient information to reliably compare
outcomes before and after the changes in 2016. ‘Grandfathering’ rules also allow
companies to claim under the pre-2016 rules in certain circumstances, and this is
anticipated to occur for several years beyond 2016. Therefore, the effects of the
modified nexus approach would be difficult to identify at this stage, even with a
few more years of data. As a result, we believe there is no need for a
generational approach and for simplicity we retain a simple DiD framework, with

Page 12 of 29
a single treatment group and time dummy. It should be noted that this is a
somewhat simplified specification, the consequences of which we discuss in
greater detail in Section 6.
36. The DiD method requires a minimum of two periods of observations for each
unit – one pre-treatment and one post-treatment. However, this is often
extended to multiple period pre- and post-treatment time points for improved
robustness. In its simplest form, Difference-in-Difference regression can be
represented by:
Yi = β0 + β1Di + β2Ti + β3DiTi + β4Xi + εi
where:
• Y is the outcome variable of interest (investment),
• D is a treatment dummy, equal to 0 for the control group and 1 for the
treatment group (i.e., Patent Box users),
• T is a time dummy, equal to 0 in the pre-intervention period and 1 in the
post-intervention period
• X is a vector of control variables
• ε is the error term.
The interaction term D * T represents the policy effect, thus the coefficient β3
measures the effect size of the policy intervention. This can be shown below and
in Figure 1.
Figure 1. Graphical representation of difference-in-difference regression
37. The coefficient β0 is the average outcome of the control group in the pre-
treatment period 0. Post-intervention, the average outcome for the control group
is β0 + β1. For treated companies, i.e. users of the Patent Box, β0 + β2 is the
average outcome in period 0, and β0 + β1 + β2 + β3 the average outcome in
Page 13 of 29
period 1. It therefore follows that β1 + β3 is the difference between the pre- and
post-intervention periods for Patent Box users. Since β1 is the same as the
difference in the control group between period 0 and 1 (i.e. the change over
time), the remaining term β3 is a measure of the policy effect, which in this case
is the effect of Patent Box usage on investment. Therefore, the value of β3 in our
model indicates the change in investment for the treatment group compared to
controls.
5. Data
38. The data set used for the analysis is constructed from multiple sources. We
have matched company level data from the BvD ‘Financial Accounting Made Easy’
(FAME) database with UK tax data on R&D spend and Patent Box claims, and data
from the UK Intellectual Property Office (IPO). We use data from accounting
periods ending in the financial year 2006-07 through to 2017-18.
39. From the Fame database, we extracted information on tangible and intangible
assets, SIC sector, company size and the UK group owner. This is supplemented
with UK tax data on the UK group owner, R&D data and Patent Box data. The
R&D and Patent Box data sets are specialist tax data sets that are used in the
production of their respective Official/National Statistics publications. From the
R&D data we use information on company level R&D expenditure, while from the
Patent Box data we identify which companies have made claims and the year of
the claim(s). From the IPO data we extracted the number of patent applications
made by companies prior to 2013, regardless of their success.
40. Further Fame variables of interest included employee numbers and average
remuneration of employees (a proxy for skilled employment). These variables
would have provided alternative approaches to assessing company outcomes,
focusing on the employment aspect of the policy goals. However, these
employment variables are poorly populated in the data and the completion rate of
these variables in the data is skewed towards larger companies. This would likely
produce weak results and an unrepresentative sample, with little analytical
benefit. We therefore concentrate on asset data as a proxy for investment. By
measuring investment, we still capture a significant aspect of ‘commercialisation’
as discussed in Section 3.
41. We analyse the company data at the ‘firm’ level. By a ‘firm’, we mean the
consolidated level of a group of UK companies; we use this term to avoid
potential confusion between a ‘control group’ and a ‘group of companies’.
Aggregating to the firm level, or not, carries different levels of risk for our
analysis. One the one hand, working at the company/subsidiary level might result
in the analysis missing potential impacts of the Patent Box. This is because any
investment stimulated by the policy may be directed to a different area of the
firm from the specific company making the claim. This is also a concern when
identifying the control group based on R&D data, as the company that conducts

Page 14 of 29
the R&D is not necessarily the company that claims Patent Box relief according to
the pre-2016 policy legislation.
42. An opposing argument can be made that analysing at the firm level might
dilute the visible effects of the Patent Box because potential investment as a
result of the Patent Box could be lost within the other activities of the firm. This is
of greater concern for larger firms. However, we believe one route would have a
far greater impact on our empirical model than the other. If investment effects
are diluted, they may still be evident just to a lesser degree. In contrast if
investment were directed to a different company it would be missed altogether,
or worse could incorrectly appear as extra investment in the control group. We
therefore chose to aggregate to the firm level to minimise the impact this decision
could have on our results. In any case, most companies in the data set (90%) are
in fact singletons. Since there is no difference between firm level and company
level analysis for singletons, and most Patent Box claims are made by such
companies, we expect any dilution of the effect size to be quite small.
43. The company level data were aggregated using a combination of Fame data
and UK tax data to identify the UK owner of companies, prioritising the Fame data
as it is better populated for ultimate owner information. The data in Fame cover
the majority of company owner information used.
44. We performed analysis on two versions of the data. Both are panel data sets:
the first includes all firms with at least one pre- and one post-intervention record
for assets and the second is a balanced panel retaining only firms with complete
asset data from 2006-7 to 2017-18. Note that this does not require all companies
within a firm to have complete data in each year – observations with incomplete
asset data were dropped after aggregating by UK ultimate owner. We also
removed firms involved in the upstream oil and gas trade and public
utility/infrastructure companies. These are heavily asset-driven businesses which
are likely to behave in different ways to our treatment and control groups.
45. There is a trade-off between using the balanced panel or the larger data set.
The balanced panel is likely to produce more robust results as concerns over
missing data are mitigated and an identical sample of firms is compared in each
year of the data. However, the results are also less generalizable to the wider
population, as many observations are removed when filtering out firms with
incomplete asset information. Indeed, the entire pool of data from which we draw
our samples contains 2,164,021 firms, but nearly two thirds of these are missing
asset data such that they cannot be analysed. Our initial panel data set includes
746,711 firms, and the balanced panel data has 290,408 firms (see Table 1) from
which to identify our treatment and control groups. This is a greater problem for
our treatment group, which is reduced from 899 observations to 705. This
highlights the issues we would have encountered were we to analyse employment
or average employee remuneration as the outcome variable, because these were
more poorly populated than assets, our outcome variable here.
Page 15 of 29
Table 1. Numbers of observations in each year of our panel data sets
Year
Unbalanced
panel – total
observations
Unbalanced
panel – patent
box users
Balanced panel
– total
observations
Balanced panel
– patent box users
Total 746,771 899 293,199 705
2006-07 386,865 766 - -
2007-08 429,927 782 - -
2008-09 472,666 805 - -
2009-10 511,487 831 - -
2010-11 564,465 854 - -
2011-12 628,291 866 - -
2012-13 705,280 877 - -
2013-14 699,890 881 - -
2014-15 700,916 883 - -
2015-16 708,734 881 - -
2016-17 680,115 884 - -
2017-18 638,428 874 - -
6. Method
6.1 Control group
46. Before defining our final control group, we removed firms from industrial
sectors that are not represented among Patent Box users. Since the economics of
different sectors varies, particularly in how patents are used and monetised, this
provides an initial control to ensure similarity between treated and control
companies.
47. We then filtered the non-treated companies by those who engage in both
R&D activity and UK patent activity according to IPO data. Given that two of the
main requirements for a company to claim patent box relief are R&D activity and
patent ownership, this set of firms should theoretically be close in nature to
Patent Box users. It is possible that the condition of previous patent activity could
be too stringent as firms are not required to have engaged in patent activity in
the past to claim Patent Box, which could make this control group qualitatively
different from the treatment group. However, our parallel trends charts (see
Figure 2) and our placebo regressions (see Appendix A1) suggest that this is not
the case.
Page 16 of 29
Table 2. Numbers of observations in treatment and control groups
Year Unbalanced
panel – control
(R&D + patent)
Unbalanced
panel –
treatment
Balanced panel
– control
(R&D + patent)
Balanced panel
– treatment
Total 5,768 899 3,691 705
2006-07 4,203 766 - -
2007-08 4,332 782 - -
2008-09 4,428 805 - -
2009-10 4,486 831 - -
2010-11 4,614 854 - -
2011-12 4,693 866 - -
2012-13 4,739 877 - -
2013-14 4,729 881 - -
2014-15 4,748 883 - -
2015-16 4,733 881 - -
2016-17 4,719 884 - -
2017-18 4,583 874 - -
48. We investigated other approaches to defining our control group. One
possibility was a less specific filtering exercise, which included companies who
had undertaken any amount of R&D. However, we found this too broad and
unrepresentative of the treatment group, with significant self-selection concerns.
49. We also attempted to use propensity score matching to construct a control
group based on a variety of characteristics such as R&D expenditure, company
size, industrial sector, location and employment. We tested numerous
permutations of explanatory variables to calculate the propensity scores, along
with different methods of generating these, including logistic regression, random
forests and a range of matching algorithms including greedy matching and
optimal matching. None of the approaches produced a control group with
improved parallel trends compared to simply filtering the data on R&D and patent
activity. In addition, the current method retains far more data in the control
group than most matching methods, and those that did retain more data (i.e.
one-to-many) matched observations increasingly randomly. We can also control
for certain characteristics of interest in the regression equation. Therefore, in the
spirit of Occam’s razor, we focused on the simpler filtering exercise to construct
our control group.
6.2 Treatment group
50. The definition of the treatment group is also important. The simplest and
broadest method is to assign any firm that has made a Patent Box claim at any
point as a treated firm. However, since our specification uses a binary treatment
variable, whereby all firms identified as Patent Box users are treated the same
regardless of the extent of their use, this may not be a fair representation of
Patent Box use. For instance, a firm that makes one claim in 2017 would have the
same identification as a firm that claims consistently from 2013 to 2018; but

Page 17 of 29
these firms will have different levels of opportunity to benefit from the policy. This
could impact the analysis in different ways. For example, firms that only claim in
later years may also not yet have had time to respond to the policy and show no
change in our dependent variable, dulling a treatment effect. On the other hand,
a firm may increase investment for reasons separate to the Patent Box in the
early post-treatment years and make a nominal Patent Box claim in 2017. Within
a ‘catch-all’ approach, this investment could be interpreted by our model as
having been stimulated by Patent Box use, where in such a case it is clearly not.
This could lead us to incorrectly find a significant effect. Things are further
complicated by the rule changes in 2016, which slightly alter the nature of the
patent box from this point onwards.
51. In order to mitigate these potential issues, we identify treated firms as those
who made a claim in more than one year prior to 2016. This gives us a better
opportunity to observe any changes in firms’ outcomes as a result of claiming
relief as they should have had enough time to undergo an increase in investment
and reduces the risk of incorrectly attributing some unrelated investment as
relevant to the policy2. However, it should be acknowledged that this does not
completely remove the risk that investment unrelated to the Patent Box is picked
up in our results. For example, the profits from a firm’s patented products could
be marginal to its business model but investment in its core businesses lines,
returns from which may not be benefit from the Patent Box rate, would
nonetheless be picked up in our results. We address this issue as best we can,
both by the definition of treatment mentioned above and the DiD approach used.
Since the difference-in-difference method controls for individual differences
(provided the parallel trends assumption is satisfied), investment unrelated to
Patent Box should be seen at similar levels in both our control group and
treatment group, given that the firms in our control group should be
representative of Patent Box users. That is to say, the reasons for which a treated
firm may invest, aside from Patent Box use, are equally represented in our
control and treatment groups and any resulting difference may have been
stimulated by Patent Box use.
52. Firms that have used the Patent Box but do not fit the criteria for our
treatment group were retained in the analysis within the control group. We know
these firms are similar in nature since they do make Patent Box claims, but they
will not yet have had the opportunity to increase their investment. Table 2 shows
the number of firms in the treatment and control groups for each data set.
2 It is worth noting at this point that investment prior to making a Patent Box claim is not necessarily
unrelated to patent box – a firm may decide to invest in the UK in anticipation of benefit bestowed by
the Patent Box. However, it is unlikely that the Patent Box would stimulate investment several years
before receiving the anticipated benefit, and these are the cases that our narrower treatment group
identification seeks to exclude.
Page 18 of 29
53. As the definition of treated companies in the analysis is restricted to pre-2016
claimants, our estimation model does not exactly represent the current regime.
As the changes implemented since 2016 slightly tighten the rules on claiming,
future impacts of the Patent Box could decrease. On the other hand, by this time
the phase-in would have ended, and the relief will be fully operational, which is
likely to increase any policy effects. Regrettably, we do not have data to assess
the effects of 2016 changes and how they might affect the success of the policy.
The essence of the policy remains the same however, therefore this work is still
relevant. If the Patent Box is shown to be successful in increasing investment in
the current work, then further research to assess the effect of the 2016 changes
would be of interest.
54. There is a concern that the treatment group suffers from self-selection. That
is, our treatment group may be populated by those that use the Patent Box
because of a certain set of characteristics, which differ from those who do not (or
cannot) claim Patent Box. One would expect that a rational firm which qualifies
for the relief would make a claim. The problem arises that if all firms who can
claim will do so, then the population from which we are left to draw our control
group is different from our treatment group in some fundamental way. One way
in which this could be the case is with profitability. To be able to claim Patent Box
relief a firm must be profitable. Therefore, if all, or almost all, firms which are
eligible for Patent Box were to make a claim, our control group could consist of
firms which are simply not profitable. In this case, a self-selection problem would
occur wherein our methods are comparing profitable companies with non-
profitable companies. Naturally, successful companies are likely to invest more
and as such any result we find could be a result of difference in profitability, not
the Patent Box. While we attempt to control for some variables that we believe
are relevant, we do not control for profitability, since profitability (in the form of a
firm’s profits) was adjudged to be an endogenous variable.
55. However, we believe that our choice of methodology (DiD) and the resulting
satisfied parallel trends assumption go some way to assuage these concerns.
Provided our control group is representative of our treatment group, the DiD
method accounts for individual differences in observation. Given that we believe
self-selection on profitability may be an issue, and that this would affect the
outcome measure of investment, then profitability is one such individual
difference that should be controlled for. To test whether the control group is
representative, we must satisfy the parallel trends assumption. The results of the
parallel trends tests are shown in Figure 2 and display common trends between
the treatment and control group in the pre-treatment period. Further analysis
(see Appendix A1) using placebo regressions further supports the satisfaction of
the parallel trends condition.
56. If a self-selection problem was present, we would expect this to be apparent
in our parallel trend tests. Considering the specific example here, increased
profitability of firms is likely to be reasonably consistent across the time-series.
Therefore, treated firms would be more profitable than controls in both the pre-
Page 19 of 29
treatment and post-treatment periods. As suggested when introducing the
possibility of a self-selection issue, we would expect this to result in increased
investment by treated firms compared to controls in both periods. This results in
the pre-treatment trends would not be parallel for our treatment and control
groups. As shown in Figure 2 and Appendix A1, this is not the case, suggesting
there may not be a serious self-selection problem.
57. We investigate this problem more deeply through descriptive statistics. A
serious self-selection problem on profitability would be evident in a substantially
higher mean profit for firms in the treatment group compared to a control. We
therefore compare mean profit in our treatment and control groups in Table 3. As
the numbers in the table show, mean profit of treated companies is generally
higher than those in the treatment group for the second control group. However,
the difference is not extreme, and it remains consistent in the pre- and post-
treatment periods. This is important as while we make the argument above that a
difference in profits would likely appear across the pre- and post-treatment
periods as profitability should be steady, it is possible that the impact of self-
selection occurs in the post-treatment period only. This is because the specific
requirement for profitability in order to claim Patent Box only appears after the
introduction of the policy. In such a case, we might see parallel trends in the pre-
treatment period but a divergence in the post-treatment period, resulting from an
increasing disparity in profitability as a result of our selection methodology. The
fact that the difference in profitability remains steady across the pre and post-
treatment periods suggests that this is not the case. There remains some
difference in profitability between our treatment and control, which is worth
highlighting, however we do not believe it is sufficiently large to be the main
cause of our results. Interestingly, the difference in profitability the treatment
group and control group based only on R&D expenditure that we investigated in
our model formulation is very large, suggesting a self-selection issue in that
treatment vs. control condition.
Table 3. Mean profit in the treatment and control group, pre- and post-treatment
Mean profit –
control (£m)
Mean profit –
treatment (£m)
Unbalanced Pre-treatment 18.4 23.9
Unbalanced Post-treatment 19.1 24.9
Balanced Pre-treatment 23.4 29.9
Balanced Post-treatment 24.3 30.5
58. To minimise self-selection concerns, we still need to demonstrate reasons
that firms might not elect to use Patent Box which do not necessarily differentiate
them from those that do. There are various explanations as to why a firm may
not make a claim. One possibility is a simple lack of awareness of the policy. This
is a known issue that HMRC addresses with firms. There may also be
technicalities that mean they do not qualify, or the process of claiming may cause
a firm to opt not to, another known issue that is addressed by HMRC. A firm may
Page 20 of 29
generate income from innovative products that they are unable to patent. For
example, most software is not available for patenting, or the patent may be filed
in a non-qualifying jurisdiction such as France. Another possibility is that the firm
does not own exclusive licensing rights to a product they are developing.
59. Although we partly select our control group based on UK patenting activity,
there is no requirement for success of this activity. That is, we define firms as
active if they have filed a patent application with the IPO, regardless of the
outcome of the application. It is intended to provide a measure of the type of firm
that works with potentially patented products and does not preclude patents
being held elsewhere than the UK, or products that do not meet the requirements
to earn a patent. In this way, we hope to pick up firms who would fit any of the
explanations we provide here for not having made a Patent Box claim. Each of
these is a feasible case in our data that would result in a viable control firm.
60. In summary, we believe there are enough suitable reasons as to why a firm
may not be able to claim and both the parallel trends tests and placebo
regressions (see Appendix) indicate that our treatment and control groups are not
significantly different from one another. This goes some way to addressing issues
of self-selection and while we acknowledge that some concerns may remain, we
do not believe that they invalidate our results.
6.3 Estimation strategy
61. As introduced in Section 3, the interaction term of our DiD framework can be
defined as the effect of claiming patent box on a firms’ investment:
log Ait = β0 + β1Di + β2𝑇𝑡 + β3Di𝑇𝑡 + β4Xit + εit
where log Ait is the log of the investment variable for a firm. We measure this
using a proxy variable of the stock of tangible and intangible assets. Tangible
fixed assets are commonly used in econometric studies to measure investment,
or gross fixed capital formation. However, since we are studying the effect of a
policy that includes IP as a key component, it is also important to account for any
changes to IP ownership through intangible assets. We therefore include
intangible assets in our definition of the dependent variable to account for the
value of IP.
62. Our treatment indicator, Di, takes a binary form. This means that we do not
determine a relationship between the amount of relief obtained from the patent
box and the outcome variable of investment. This has varying implications. On
the one hand, we are unable to account for the phased-in nature of the policy.
This issue may result in an underestimate of treatment effect by our model, since
it treats lower levels of relief in the same way as higher levels. Therefore, we may
be assigning firms to the treatment group who do not show increased investment
due to the lower level of relief obtained. Conversely, this could also introduce the
risk of us associating unrelated investment with the Patent Box. For example, if a
firm makes a nominal claim in one year but invests heavily for other reasons, our
model would interpret this as investment by a Patent Box user. However, we

Page 21 of 29
show in our time series charts (see Figure 2) and placebo regressions (Appendix
A1) that the parallel trends assumption is satisfied so, as set out earlier in the
section, this type of investment should be similarly represented in both treatment
and control groups.
63. Although a flow variable is often used for the analysis of investment over
time, here we are using a stock due to issues with volatility in the computed flow
variable, which makes obtaining parallel trends difficult. A possible reason for this
is that missing asset data is more problematic for a flow variable than our stock
variable. A missing year of asset data makes it impossible to calculate the change
from the previous year and to the following year; so missing asset data in one
year affects two data points, rather than one. Following the logic of Guceri & Liu
(2019) and references therein, over a short time-series, measures of capital stock
should not produce different results to measures of investment. Hall & Mairesse
(1995) demonstrated this in the context of production functions. We therefore
use the stock of tangible and intangible assets as our proxy variable for
investment and we refer to this as ‘assets’ for simplicity.
64. As the dependent variable is measured in logarithmic form, the interaction
term represents an elasticity and can be considered to show the percentage
change in investment as a result of Patent Box use. The null hypothesis, that
Patent Box use has no impact on investment outcomes, is β3 = 0.
65. We also present a second scenario to account for a policy lag effect. Following
the logic used when defining our treatment group – that there may be a time
delay in a firm’s ability to benefit from the Patent Box relief – we present this
specification with the treatment year defined as 2014. If changes to investment
are indeed not immediate then this second scenario should display a stronger
treatment effect.
66. In our regression equations we include control variables to account for firm-
level variations in industrial sector, company size and (log) R&D spend. There is
large variation in patent use across industrial sectors, by both numbers and size
of claims and a difference in the distribution of sectors in treatment and control
groups. There is also a clear positive correlation between firm size and assets, so
it is important to control for this. Data on the industrial sector is taken from Fame
at the SIC section level. Company size is a categorical variable taken from
HMRC’s data identifying micro, SME and large companies, according to the
European Commission definition3. For the firm-level sector and company size
variable, we take the mode of a firm’s subsidiaries as the value. Ties in this
calculation are settled by the sector/size with the highest total profit.
67. Though a requirement for our control group, R&D spend may be more
prevalent in our treatment group than control given the nature of firms that claim
patent box relief. Furthermore, we believe that the level of R&D spend of a firm
3 See https://stats.oecd.org/glossary/detail.asp?ID=3123

Page 22 of 29
may be related to investment decisions at the intensive margin. This means that
a firm may choose to invest their profits on further R&D rather than investment in
assets, which is our dependent variable. If this is true, then it is important to
control for R&D expenditure in our framework to account for this.
68. However, inclusion of R&D expenditure as a control variable does introduce
concerns of possible endogeneity bias. By including R&D expenditure as a
covariate, we might be controlling for extra R&D that results from patent box use.
We have investigated different methods of addressing this issue. One common
method used to mitigate endogeneity concerns is the use of lagged control
variables. This is prevalent in the literature (see, for example, Vergara (2010)
and Aschhoff and Schmidt (2008)). The logic goes that the dependent variable
cannot affect the lagged independent variable as it occurred before the outcome
variable, thus avoiding simultaneity.
69. However, recent research by Reed (2015) and Bellamare et al (2017)
questions this practice. The authors show for a variety of endogeneity concerns
(including simultaneity), that lagging variables does not reduce bias except for in
very specific circumstances. In fact, using a serially correlated variable can
increase the bias caused by endogeneity. Lagged variables are naturally, often
highly serially correlated. Bellamare et al (2017) suggest it may in fact be better
to ignore concerns of endogeneity than to include a lagged variable.
70. Another option is to use an instrumental variable (IV) regression framework
(see Bascle (2008) for a detailed description of endogeneity and IV regression
which he applies to strategic management research). However, this requires
careful identification of a suitable instrument, which must be uncorrelated with
the error term and strongly correlated with the endogenous independent variable.
A poor instrument, for example one that is weakly correlated with the
endogenous variable, would introduce more problems than it would solve. Since
we have been unable to identify a suitable instrument, we include the log of R&D
expenditure as control variable in a regression both normally and as a one-year
lag, addressing concerns of bias the in sections below.

Page 23 of 29
7. Results
71. We begin by presenting a time series of treatment vs. control for our two
model variants: the unbalanced or balanced panel data. These are displayed in
Figure 2, with the treatment group shown by the dashed line. The time series
show that parallel trends are satisfied in each case.
Figure 2. Time series trends of our two permutations. The dotted vertical line represents
the implementation of the policy in 2013.
72. Next, we show the results of the DiD regression specified in Section 5. In
Table 4 we report the outputs for our control group in the unbalanced panel. We
then repeat this for the balanced panel in Table 5 as a robustness check. In each
table we display the results of three specifications as follows:
(a) log Ait = β0 + β1Di + β2𝑇𝑡 + β3Di𝑇𝑡 + εit
(b) log Ait = β0 + β1Di + β2𝑇𝑡 + β3Di𝑇𝑡 + β4Ii + β5Si + εit
(c) log Ait = β0 + β1Di + β2𝑇𝑡 + β3Di𝑇𝑡 + β4Ii + β5Si + β5log Rit + εit
where I = industrial sector, S = firm size and log R = the natural log of R&D
expenditure. Specification (a) is the basic form of the regression framework with
no control variables. Specification (b) includes industrial sector and firm size and
controls. Specification (c) also includes log R&D expenditure as a control. In each
case we report the coefficient of the interaction term, β3, its error term,
significance level and the adjusted R2 of the model. We also report a second
series of specifications with the treatment year set as 2014, to account for
possible policy lag effects.
Page 24 of 29
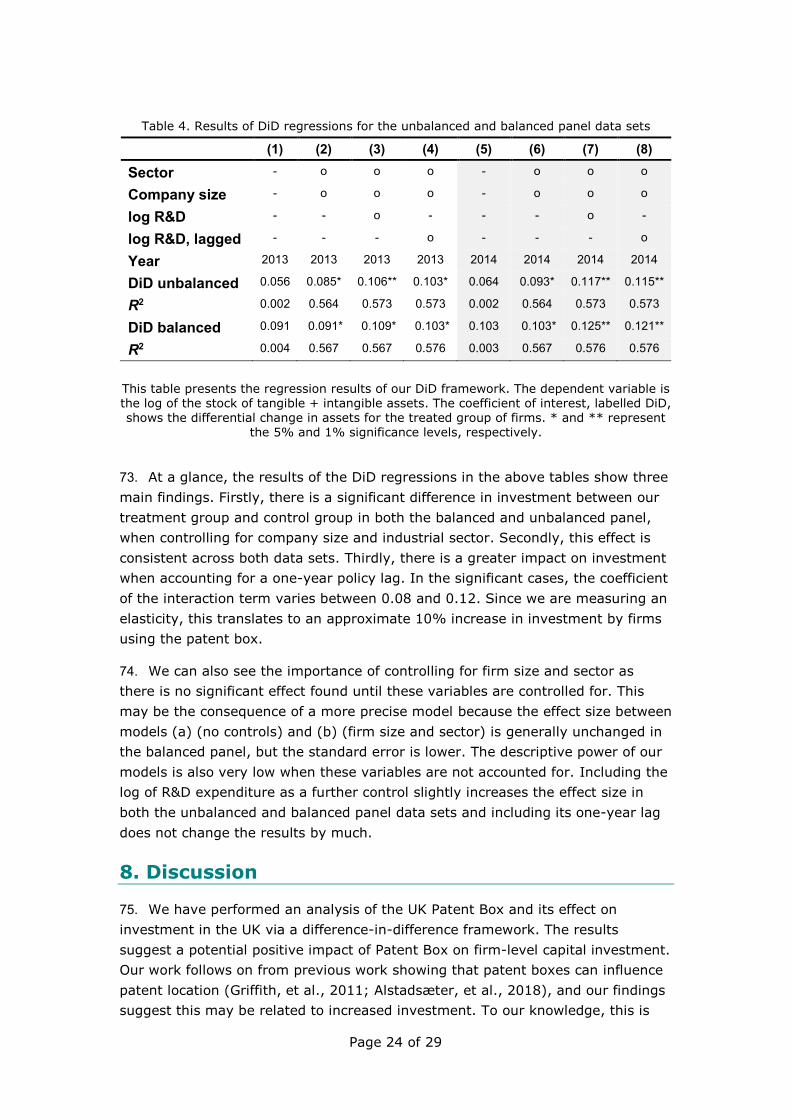
Table 4. Results of DiD regressions for the unbalanced and balanced panel data sets (1) (2) (3) (4) (5) (6) (7) (8)
Sector - o o o - o o o
Company size - o o o - o o o
log R&D - - o - - - o -
log R&D, lagged - - - o - - - o
Year 2013 2013 2013 2013 2014 2014 2014 2014
DiD unbalanced 0.056 0.085* 0.106** 0.103* 0.064 0.093* 0.117** 0.115**
R2 0.002 0.564 0.573 0.573 0.002 0.564 0.573 0.573
DiD balanced 0.091 0.091* 0.109* 0.103* 0.103 0.103* 0.125** 0.121**
R2 0.004 0.567 0.567 0.576 0.003 0.567 0.576 0.576
This table presents the regression results of our DiD framework. The dependent variable is the log of the stock of tangible + intangible assets. The coefficient of interest, labelled DiD, shows the differential change in assets for the treated group of firms. * and ** represent
the 5% and 1% significance levels, respectively.
73. At a glance, the results of the DiD regressions in the above tables show three
main findings. Firstly, there is a significant difference in investment between our
treatment group and control group in both the balanced and unbalanced panel,
when controlling for company size and industrial sector. Secondly, this effect is
consistent across both data sets. Thirdly, there is a greater impact on investment
when accounting for a one-year policy lag. In the significant cases, the coefficient
of the interaction term varies between 0.08 and 0.12. Since we are measuring an
elasticity, this translates to an approximate 10% increase in investment by firms
using the patent box.
74. We can also see the importance of controlling for firm size and sector as
there is no significant effect found until these variables are controlled for. This
may be the consequence of a more precise model because the effect size between
models (a) (no controls) and (b) (firm size and sector) is generally unchanged in
the balanced panel, but the standard error is lower. The descriptive power of our
models is also very low when these variables are not accounted for. Including the
log of R&D expenditure as a further control slightly increases the effect size in
both the unbalanced and balanced panel data sets and including its one-year lag
does not change the results by much.
8. Discussion
75. We have performed an analysis of the UK Patent Box and its effect on
investment in the UK via a difference-in-difference framework. The results
suggest a potential positive impact of Patent Box on firm-level capital investment.
Our work follows on from previous work showing that patent boxes can influence
patent location (Griffith, et al., 2011; Alstadsæter, et al., 2018), and our findings
suggest this may be related to increased investment. To our knowledge, this is
Page 25 of 29
the first micro-econometric analysis to assess a patent box policy using firm-level
investment outcomes. There is also some evidence of a delayed policy effect,
suggesting that it may take at least one year before the impacts of the Patent
Box use are fully translated into increased investment. This is demonstrated by
an increase in effect size when the treatment dummy is set to 2014, one year
after implementation. That said, we still find a significant effect with the true
treatment year. The size and direction of our results are consistent across the
balanced and unbalanced data sets and significance is only found when control
variables for company size and industry sector are included. Here we discuss the
various results and some issues that should be considered when interpreting the
results of our study.
76. As mentioned in Section 6, there are endogeneity concerns in our
specification that includes R&D expenditure as a control. The inclusion, or not, of
R&D as an extra control variable may be viewed a decision between two potential
sources of bias. Should log R&D be related to patent box uptake (treatment) and
assets as we expect, then it would suggest that R&D is something to be controlled
for to avoid omitted variable bias. A further argument in favour controlling for
R&D stems from our control group identification. We filter on R&D expenditure to
find innovative firms that are like Patent Box users. However, our definition is
broad and will likely include firms with very small amounts of R&D spend in
comparison to our treatment group. It may therefore be necessary to include R&D
in our regression model to account for this. Our balanced panel data may also go
some way to achieving this.
77. However, by including R&D in our specification we risk introducing
endogeneity bias. Mohnen, et al.’s (2017) study of the Dutch Innovation Box
showed some impact of the policy on R&D outcomes. If the UK Patent Box has a
similar impact on R&D outcomes there is a risk that by controlling for in-year R&D
expenditure, we could be capturing extra R&D that has been stimulated by the
Patent Box. One possible way to address this, which is used widely in the
literature, is to introduce a lag on the R&D control variable. The premise is that
by controlling for R&D spend in the previous year, we avoid controlling for extra
R&D in the present year that might be caused by the policy. The lagging method
is not without its problems however. As mentioned in Section 5, recent papers by
Reed (2015) and Bellemare, et al. (2017) question the common practice of using
lagged variables to avoid endogeneity. Considering this, while we present the
results of our specification including lagged R&D spend in our results, we remain
aware of the potential for bias. The significant findings reported with log R&D
included as a control are also replicated with a one-year lag on log R&D. This
provides some reassurance as far as the introduction of endogeneity bias is
concerned. While we are aware that these results carry the risk of bias, there is
also a logical argument behind controlling for R&D. Pursuing R&D is expensive,
and firms need to make decisions about how much, or indeed whether, to invest.
Those that use the Patent Box may have a greater opportunity, through the relief,
to increase their assets. The fact that we also find a significant positive impact in
Page 26 of 29
both data sets when including and excluding R&D as a control provides further
comfort.
78. However, whether this impact is a result of the policy itself, or a side effect of
firms being profitable and therefore able to claim, is less clear. As discussed in
Section 5, there is some concern about self-selection in our treatment group. If
all firms who can claim Patent Box relief do so, there may be some underlying
difference between treatment and control firms that we are selecting on. One
possibility is profitability. For companies to claim Patent Box they must be in
profit, so there is a risk that our control group consists of companies who don’t
claim because they aren’t profitable. If this were the case, the effect we show
might be the result of a difference in profitability rather than Patent Box use.
However, we show through our parallel trends test and calculation of mean profits
that this should not be a serious issue. Though we do find some difference in
overall profitability between treatment and control, it remains consistent both
before and after the treatment period, suggesting that it is not a significant
contributor to our overall findings.
79. Our results are also complicated by the identification strategy we have
employed. The analysis takes a simplified view of the Patent Box. The policy was
phased in from 2013 onwards, with relief only available on 60% of a firm’s
relevant profits in the first year. Full relief on profits has only been available since
2017-18. Since we only have data up to 2017-18 and given the complexity of
attempting to allow for different levels of treatment in a DiD framework, we
model treatment as a catch-all. While this means that our model is not an exact
reflection of the policy, the likely impact would be a type II error as we are
examining a time period before relief was fully available. The fact that we have
found some indication of increased investment for patent box users, over a period
where the relief was not fully implemented, is encouraging from this perspective.
80. However, a contrasting argument is that our strategy risks incorrectly
assigning positive investment outcomes to the Patent Box policy. Given the binary
treatment condition and the inability to directly link output to the relief itself, it is
possible that firms who received a marginal benefit from the Patent Box but
invested heavily for separate reasons, would be regarded as a treatment effect by
our model, biasing our results. As we describe in Section 5, both DiD’s
requirement for parallel trends and our treatment group definition should account
for this, but some risk remains that unrelated investment by treated companies
outweighs that of controls.
81. Another concern from an identification point of view is the policy changes
introduced in 2016. The modified nexus approach restricts the scope of claims,
which could reduce the impact of the Patent Box on investment, but we have not
accounted for this in our analysis. Our treatment group concerns only firms that
claimed prior to 2016, owing to a lack of data past this point. Therefore, the
findings we present can only be said to relate to the Patent Box as it was before
2016 so should be treated with caution. Nevertheless, the policy changes are not
Page 27 of 29
radical, and our results still offer a useful indication of the success of the Patent
Box in relation to investment outcomes.
82. Our choice of outcome variable is also not perfect. As described in Sections 2
and 3, we aim to evaluate the UK Patent Box in terms of its policy aims, in
contrast to much of the previous literature. The Patent Box aims to incentivise the
commercialisation of IP in the UK, which we measure via investment, since
investment is highly relevant to many aspects of commercialisation. However, it
is by no means a complete measure, notably omitting aspects such as
employment. Therefore, though we find evidence to suggest a significant impact
of Patent Box use on investment, we must be careful when equating this to the
policy successfully meeting its aims. Nevertheless, policy aims aside, an impact of
Patent Box use on investment is an interesting finding.
9. Conclusion
83. We have assessed the impact of the UK Patent Box on investment, which we
link to commercialisation using a difference-in-difference approach. Very little
previous work has addressed the effects of patent box policies on firm outcomes,
focusing instead on profit shifting and IP location. In addition, no study so far has
evaluated the effect of a patent box on investment, instead assessing R&D
impacts. Our micro-level analysis suggests a potential 10% increase in
investment by firms that use the patent box. However, there are several factors
that should also be considered when interpreting these findings, which are
discussed in greater detail in Section 7.
84. We conducted analysis using a control group that selected companies on R&D
expenditure and patent activity, with both a balanced an unbalanced data set. A
significant effect was found across both data sets when controlling for industry
sector and firm size. The inclusion of R&D expenditure as a control variable
results in a slightly stronger policy effect, but there are endogeneity concerns
with this model.
85. The identification strategy is also somewhat simplified and does not consider
the gradual phase-in of UK Patent Box relief, nor the technical changes made in
2016. Once more data are available, further analysis could investigate both the
effects of phasing in the policy and the difference in effects before and after the
changes implemented in 2016. Future work may also look at levels of skilled
employment, or employment in general, as a possible outcome variable. The
scarcity of data on this topic has prevented us from doing so.
86. Our study is one of very few that looks at the success of a patent box policy
at a micro level, and the first, to our knowledge, that does so in the context of
investment outcomes. There is some evidence to suggest that firms using the UK
Patent Box increase their investment in the UK compared to equivalent firms,
with caveats.

Page 28 of 29
References
Alstadsæter, A. et al., 2018. Patent boxes design, patents location, and local
R&D. Economic Policy, 33(93), p. 131–177. Aschhoff, B. & Schmidt, T., 2008. Empirical evidence on the success of R&D
cooperation—Happy together?. Review of Industrial Organization, Volume 33, pp.
41-62.
Bascle, G., 2008. Controlling for endogeneity with instrumental variables in
strategic management research. Strategic Organization, 6(3), pp. 285-327.
Bellamere, M. F., Masaki, T. & Pepinski, T. B., 2017. Lagged Explanatory
Variables and the Estimation of Causal Effect. The Journal of Politics, 79(949-
963).
Bräutigam, R., Spengel, C. & Streif, F., 2017. Decline of CFC rules and rise of
patent boxes: How the ECJ affects tax competition and economic distortions in
Europe. Fiscal Studies, 34(4), p. 719–745.
Chatelain, J. B. & Tiomo, A., 2001. Investment, the Cost of Capital, Monterey
Policy in Nineties in France: A Panel Data Investigation, s.l.: European Central
Bank.
European Commission, 2019. Poland's IP regime (PL012). [Online]
Available at: https://data.consilium.europa.eu/doc/document/ST-9652-2019-
ADD-5/en/pdf
[Accessed 11 December 2019].
Evers, L., Miller, H. & Spengel, C., 2015. Intellectual property box regimes:
effective tax rates and tax policy considerations. International Tax and Public
Finance, Volume 22, p. 502–530.
Fowkes, R. K., Sousa, J. & Duncan, N., 2015. Evaluation of Research and
Development, London: HM Revenue and Customs.
Gaessler, F., Hall, B. & Harhoff, D., 2018. Should there be lower taxes on patent,
Cambridge, MA: National Bureau of Economic Research.
Griffith, R., Miller, H. & O'Connell, M., 2011. Corporate Taxes and the Location of
Intellectual Property. CEPR Discussion Papers, June.p. No 8424.
Guceri, I. & Liu, L., 2019. Effectiveness of Fiscal Incentives for R&D: Quasi-
experimental Evidence. American Economic Journal: Economic Policy, 11(1), pp.
266-291.
Hall, B. H. & Mairesse, J., 1995. Exploring the Relationship between R&D and
Productivity in French Manufacturing Firms. Journal of Econometrics, 65(1), pp.
263-293.
Hall, R. & Jorgensen, D., 1967. Tax Policy and Investment Behavior. American
Economic Review, Volume 57, pp. 391-414.
Hall, R. & Jorgenson, D., 1967. Tax Policy and Investment Behavior. American
Economic Review, Volume 57, pp. 391-414.
HM Revenue and Customs, 2013. Corporation Tax Reform: Patent Box. [Online]
Available at:
https://webarchive.nationalarchives.gov.uk/20130605101416/http://www.hmrc.g
ov.uk/budget2012/tiin-0726.htm
[Accessed 11 December 2019].
HM Revenue and Customs, 2019. Statistics on uptake of the Patent Box. [Online]
Available at:
https://assets.publishing.service.gov.uk/government/uploads/system/uploads/att
achment_data/file/837487/Patent_Box_Statistics_2016-17_and_2017-
18_partial.pdf
[Accessed 11 December 2019].

Page 29 of 29
Karkinsky, T. & Riedel, N., 2012. Corporate Taxation and the Location of Patents
within Multinational Firms. Journal of International Economics, 88(1), pp. 176-
185.
Mohnen, P., Vankan, A. & Verspagen, B., 2017. Evaluating the innovation box tax
policy instrument in the Netherlands, 2007–13. Oxford Review of Economic Policy,
33(1), p. 141–156.
NLO, n.d. The Innovation Box. [Online]
Available at: https://www.nlo.eu/en/services/patents/patent-
application/innovation-box
[Accessed 11 December 2019].
OECD, 2015. Action 5: Agreement on Modified Nexus Approach for IP Regimes.
[Online]
Available at: https://www.oecd.org/ctp/beps-action-5-agreement-on-modified-
nexus-approach-for-ip-regimes.pdf
[Accessed 11 December 2019].
Reed, R. W., 2015. On the Practice of Lagging Variables to Avoid Simultaneity.
Oxford Bulletin of Economics and Statistics, 77(6), pp. 897-905.
Shanahan, J., 2011. Is it time for your country to consider the "patent box"?.
Dublin, PriceWaterhouseCoopers.
Straathof, B. et al., 2014. A Study on R&D Tax Incentives, Brussels: European
Commission.
Vergara, R., 2010. Taxation and Private Investment: Evidence for Chile. Applied
Economics, Volume 42, p. 717–725.