Embed Size (px)
Citation preview

1
Passive Self-Interference Suppression forFull-Duplex Infrastructure Nodes
Evan Everett, Achaleshwar Sahai, and Ashutosh Sabharwal
Abstract— Recent research results have demonstrated thefeasibility of full-duplex wireless communication for short-rangelinks. Although the focus of the previous works has beenactive cancellation of the self-interference signal, a majority ofthe overall self-interference suppression is often due to passivesuppression, i.e., isolation of the transmit and receive antennas.We present a measurement-based study of the capabilities andlimitations of three key mechanisms for passive self-interferencesuppression: directional isolation, absorptive shielding, and cross-polarization. The study demonstrates that more than 70 dB ofpassive suppression can be achieved in certain environments,but also establishes two results on the limitations of passivesuppression: (1) environmental reflections limit the amountof passive suppression that can be achieved, and (2) passivesuppression, in general, increases the frequency selectivity ofthe residual self-interference signal. These results suggest twodesign implications: (1) deployments of full-duplex infrastructurenodes should minimize near-antenna reflectors, and (2) activecancellation in concatenation with passive suppression shouldemploy higher-order filters or per-subcarrier cancellation.
I. INTRODUCTION
Conventional wireless devices operate in half-duplex modeto avoid the high-powered self-interference that is generatedwhen transmission and reception coexist in time and fre-quency. Recent results [1]–[12], however, have demonstratedthe feasibility of short-range full-duplex wireless communi-cation by mitigating self-interference through a combinationof passive suppression and active cancellation of the self-interference. Passive suppression is any technique to electro-magnetically isolate the transmit and receive antennas, whileactive suppression is any technique to exploit a node’s knowl-edge of its own transmit signal to cancel the self-interference.Active cancellation, which has been studied extensively inthe literature, functions by injecting a cancellation waveforminto the receive signal path to null the self-interference. Thecancellation waveform can be injected over a transmissionline as in [4], [6], [8], [11], [12] or over the air using extraantennas as in [1], [5], [9], [10]. Passive suppression, however,has been studied only sparsely. With the aim to developa better understanding of the capabilities and limitations ofpassive self-interference suppression, this paper presents a
The authors would like to thank the Antenna and Wireless Systems Branchof NASA’s Johnson Space Center for both technical advice and the use ofthe Antenna Test Facility. In particular, the authors would like to recognizeMichael Khayat for his guidance in experiment design, and Wayne Copefor his EM measurement expertise. The authors also thank Jingwen Bai andGuarav Patel for their crucial assistance.
This work was partially supported by NSF Grants CNS 0923479, CNS1012921 and CNS 1161596 and NSF Graduate Research Fellowship 0940902.
E. Everett, A. Sahai and A. Sabharwal are with the Department of Electricaland Computer Engineering, Rice University, Houston, TX, 77005 USA. e-mail: {evan.everett, as27, ashu}@rice.edu.
measurement-based characterization of passive suppressionmechanisms for full-duplex infrastructure nodes.
Our motivation for studying passive suppression stems fromthe observation that passive suppression accounts for a largeportion of the total self-interference suppression in existingfull-duplex designs. For example, of the 85 dB of self-interference suppression achieved in the full-duplex design in[11], 65 dB is attributed to passive suppression and only 20 dBto active cancellation. Moreover, recent characterizations ofactive cancellation [13]–[15] have shown that the amountof self-interference that can be actively cancelled is limitedby fundamental radio impairments such as phase noise [13]and limited dynamic range [14], [15], but it is not knownwhether passive suppression will also encounter fundamentalbottlenecks and what those bottlenecks may be. Thus, anopportunity exists to improve full-duplex performance througha richer understanding of capabilities and limitations of passivesuppression mechanisms.
A. Contribution
Our first (and primary) contribution is an experimentalcharacterization of passive self-interference suppression meth-ods for full-duplex infrastructure nodes. The characterizationfocuses on three key passive suppression mechanisms: (1)directional isolation – the use of directional antennas suchthat the gain of the transmit antenna is low in the direction ofthe receive and visa versa, (2) absorptive shielding – the useof lossy materials to attenuate the self-interference, and (3)cross-polarization – the use of transmit and receive antennasin orthogonal polarization states. The characterization has twomain goals, (a) to quantify the performance and limitationsof the three mechanisms and combinations among the threemechanisms, and (b) to study the effect of passive suppressionon the characteristics of the self-interference channel. Toaccomplish these goals, the three mechanisms were evaluatedboth in a best-case environment of an anechoic chamber, anda worst-case environment of a highly reflective room withmetal walls. In each environment the self-interference channelwas measured for several different antenna configurations bothwith and without the three passive suppression mechanisms inplace. The characterization establishes two main results whichare summarized below.
Result 1: Environmental reflections present a fundamentalbottleneck in the amount of passive suppression that can beachieved. Comparing the measurements in the anechoic cham-ber to those in the reflective room, it is observed that althoughthe passive mechanisms are quite effective in suppressing thedirect path between antennas, none can predictably attenuate
arX
iv:1
302.
2185
v2 [
cs.I
T]
17
Dec
201
3
2
reflected self-interference paths. The design implication isthat, in order to achieve high-levels of passive suppression,deployers of full-duplex infrastructure should seek to minimizenearby reflectors.
Result 2: Passive self-interference suppression, in general,causes a decrease in the coherence bandwidth of the residualself-interference channel. Since the passive suppression oper-ates on the direct path between transmit and receive antennas,but not necessarily reflected paths, passive suppression cantransition the self-interference channel from a predominantlyline-of-sight channel to a multi-path dominated channel, wherefrequency selectivity occurs due to constructive and destructivecombinations of reflected paths. The design implication is thatwhen active cancellation is employed in concatenation withpassive suppression, the active canceler should be designed tohandle a frequency-selective self-interference signal.
As a second contribution, we present a prototype full-duplex infrastructure node, implemented in the WARPLab [16]framework, that combines the passive suppression mechanismsstudied in the above characterization with the existing activecancellation mechanisms studied in [7], [11]. We evaluatethe performance of this design in an outdoor full-duplex up-link, and see that total self-interference suppression exceeding90 dB can be achieved, enabling the prototype to outperform acomparable half-duplex link even at ranges exceeding 100 m.
The above two results, when combined with previous works,paint a more complete picture of self-interference mitigation.Passive suppression is the first line-of-defense against self-interference, but is effective only against the direct path.The residual multi-path self-interference signal can be furthersuppressed by a per-subcarrier active cancellation strategy [7],[11] that is robust to frequency selectivity. Unfortunately,active cancelation also encounters bottlenecks due to RFimpairments such as phase noise [13] and limited dynamicrange [14], [15]. Because both passive and active suppressionencounter limitations, it is important that full-duplex designsreach their full potential in both the active and passivesuppression regimes.
B. Prior Art
Many of the full-duplex designs in the literature haveemployed one or more passive suppression method. In the full-duplex designs of [1], [4]–[7] the only passive suppressionmechanism utilized is physical separation of transmit andreceive antennas, i.e., free-space path loss. In [8], [11] heuristicstrategies for laptop antenna placement are studied including“device-induced path loss,” in which transmit and receiveantennas are shielded by laptop hardware such as the screen.Such techniques were used in [11] to achieve as much as 65 dBof passive suppression. Passive suppression for full-duplexrelay systems in which the transmit and receive antennasare not collocated, and large amounts of path loss can beleveraged, are studied in [17]–[19]. In [17], [18] directionalisolation and 4-5 m of antenna separation are leveraged toachieve 75-90 dB of passive suppression. In [19] an outdoor-to-indoor relay systems is studied, in which directional iso-lation and cross-polarization are leveraged. In a deployment
where the antennas are on opposite sides of a wall, 48 dB ofpassive suppression is observed, and when the indoor antennais moved into the interior of the building, benefitting fromlarge path loss, 60-80 dB of passive suppression is observed. Incontrast to [17]–[19], our study focuses on more compact full-duplex deployments in which the antenna separation does notexceed 50 cm. Moreover, our study, which includes directionalisolation, cross-polarization and absorptive shielding, is toour knowledge the first comprehensive study of passive self-interference suppression for wireless full-duplex systems. Inparticular, none of the previous designs have quantified theimpact of environmental reflections on the performance ofpassive suppression.
C. Organization of Paper
The organization of the rest of the paper is as follows.In Section II we describe the experiment design in detail.In Section III we present the outcomes of the experiment,with special focus on the two main results listed above. InSection IV we analyze the impact of passive suppression oncapacity. In Section V we present a prototype and evaluate theperformance of combined passive and active suppression in awideband OFDM full-duplex physical layer. In Section VI wehave some system-level discussion on implementing passivesuppression at infrastructure nodes. We conclude in Sec-tion VII.
II. EXPERIMENT DESIGN
The goal of the experiments presented in this paper is tocharacterize the performance of three key mechanisms forpassive self-interference suppression in full-duplex infrastruc-ture nodes, and to study how the three mechanisms affect theself-interference channel. To accomplish this goal, a networkanalyzer was used to characterize the self-interference channelbetween transmitting and receiving antennas as the three pas-sive suppression mechanisms were applied to several differentantenna configurations both in a reflective environment andin a nonreflective environment. The following is a detaileddescription of the experiment.
A. Experiment Setup
We begin by describing the directional antenna configura-tions studied, and then describe how absorptive shielding andcross-polarization are leveraged within in each configuration.
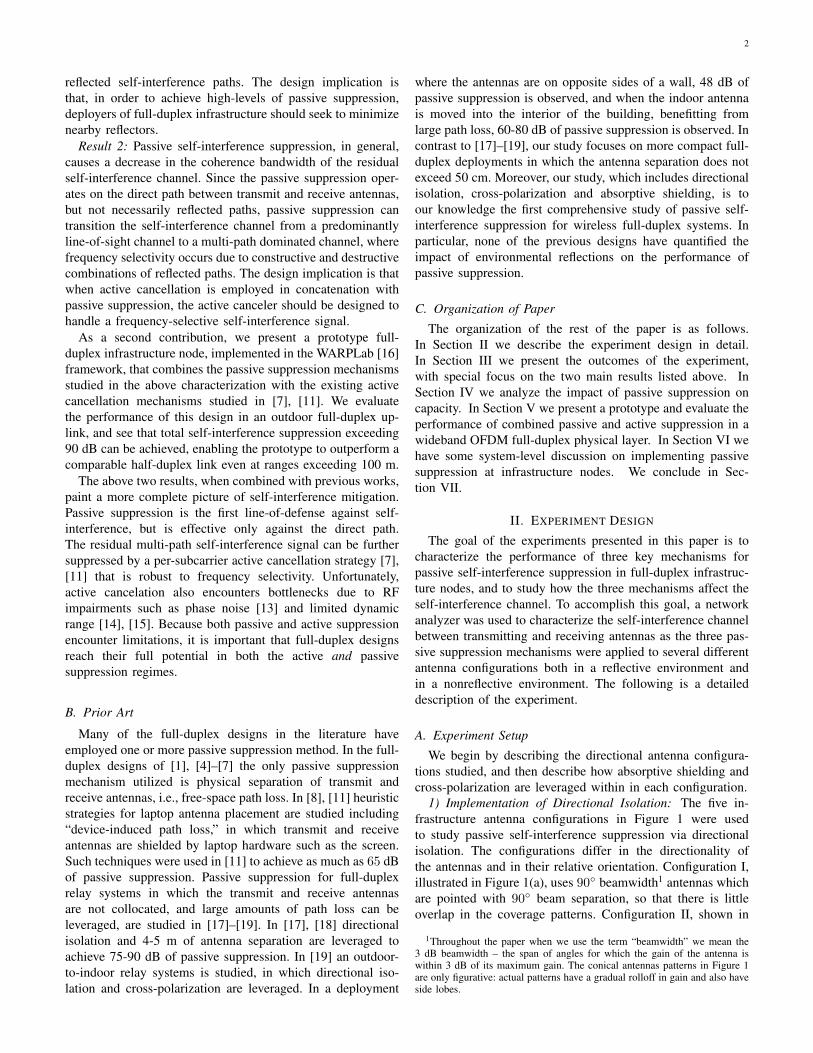
1) Implementation of Directional Isolation: The five in-frastructure antenna configurations in Figure 1 were usedto study passive self-interference suppression via directionalisolation. The configurations differ in the directionality ofthe antennas and in their relative orientation. Configuration I,illustrated in Figure 1(a), uses 90◦ beamwidth1 antennas whichare pointed with 90◦ beam separation, so that there is littleoverlap in the coverage patterns. Configuration II, shown in
1Throughout the paper when we use the term “beamwidth” we mean the3 dB beamwidth – the span of angles for which the gain of the antenna iswithin 3 dB of its maximum gain. The conical antennas patterns in Figure 1are only figurative: actual patterns have a gradual rolloff in gain and also haveside lobes.

3
50 cm
(a) Configuration I: 90◦ beamwidth antennas,90◦ beam separation, 50 cm antennaseparation.
50 cm
(b) Configuration II: 90◦ beamwidthantennas, 60◦ beam separation,50 cm antenna separation.
35 cm
(c) Configuration III: 90◦ beamwidthantennas, 60◦ beam separation,35 cm antenna separation.
50 cm
(d) Configuration IV:Omnidirectional antennas, 50 cm antennaseparation.
35 cm
(e) Configuration V:Omnidirectional antennas, 35 cm antennaseparation.
Fig. 1: Five architectures evaluated in the passive suppression characterization. We do not designate one antennas as thetransmitter and one as receiver as these roles exchange.
Fig 1(b), also uses 90◦ beamwidth antennas, but with a beamseparation of 60◦, so that there is 30◦ overlap between thecoverage zones. In both Configurations I and II the separationbetween antennas is 50 cm. Configuration III, shown inFigure 1(c), is identical to Configuration II, except that theseparation between antennas is scaled down to 35 cm. The90◦ beamwidth antennas used in Configurations I, II, and IIIare HG2414DP-090 panel antennas from L-com [20] designedfor outdoor sectorized WiFi access points. For comparing tocases without directional isolation, Configurations IV and V,shown in Figures 1(d) and 1(e), were also studied. The50 cm separation between antennas in Configuration IV isthe same as in Configurations I and II, the 35cm separationin Configuration V is the same as in Configuration III. Theomnidirectional antennas used in Configurations IV and V areHGV-2406 outdoor WiFi antennas from L-com [21].
2) Implementation of Absorptive Shielding: Absorptiveshielding is realized by placing a slab of RF absorber materialbetween the two antennas as illustrated in Figure 2. Thematerial used in our experiments is Eccosorb AN-79 [22] free-space RF absorber. AN-79 is a broadband, tapered loadingabsorber made from polyurethane foam impregnated with acarbon gradient. It is a 4.25 inch slab that can be cut to fitthe application. The manufacturer’s data sheet indicates thatAN-79 can provide up to 25 dB of absorption.
3) Implementation of Cross-polarization: The L-ComHGV-2406 antennas used in the directional-antenna configura-tions are dual-polarized as indicated in Figure 2, which meansthey have two ports: one excites a horizontally polarized mode,and the other a vertically polarized mode. By measuring thecoupling between both co-polarized and cross-polarized ports,we can study the impact of cross-polarization on the self-interference channel. Most commercial omnidirectional anten-
Dual-polarizedRF Absorber
Fig. 2: Shielding via RF absorver and cross-polarization viadual-polarized antennas.
nas support only a single polarization mode,2 and such is thecase for the L-Com HGV-2406 antennas used in the omnidirec-tional configurations of Figure 1, which only support verticalpolarization. Thus passive suppression via cross-polarizationwas not studied in the omnidirectional configurations.
B. Environments
In order for the measurements to be as repeatable as possi-ble, the first stage of the passive suppression characterizationwas performed in a shielded anechoic chamber to minimizereflections and interference from other sources. After themeasurements were performed in the anechoic chamber, theywere repeated in a highly reflective room to observe the effectof environmental reflections. The room used was roughly 30ft. × 60 ft. with metal walls and a low metal ceiling, intendedto represent a worst case reflection environment for practicaldeployments.
2Most commercial omnidirectional antennas are implemented as an electricdipole or an electric monopole, which only support a vertically polarizedmode. Directional antennas, however, are commonly implemented as circularor rectangular patches, which can support two modes: one with verticalpolarization and the other with horizontal polarization.

4
C. Measurements and Metrics
1) Measurement Procedure: For notational convenience letthe variable,
mech ∈ {∅,D,A,C,DA,DC,AC,DCA}, (1)
denote a combination of passive suppression mechanisms,where ∅ denotes no passive suppression, D denotes directionalisolation, A denotes absorptive shielding, and C denotes cross-polarization. Note that the antenna configuration constrainswhich combinations are possible. Since directional antennasare used in Configurations I, II, and III, the possible values ofmech are {D,DA,DC,DCA} for these configurations. Simi-larly the possible values for mech in Configurations IV and Vare {∅,A}, since the antennas are omnidirectional and notdual-polarized. Therefore, for each of the directional-antennaconfigurations shown in Figure 1, the self-interference channelbetween antennas was measured for the following combina-tions of passive self-interference suppression mechanisms: di-rectional isolation only (mech = D), directional isolation plusabsorptive shielding (mech = DA), directional isolation pluscross-polarization (mech = DC), and directional isolation plusabsorptive shielding plus cross-polarization (mech = DCA).For the omnidirectional configurations, the combination ofmechanisms measured were no suppression (mech = ∅) andabsorptive shielding (mech = A). For each combination ofapplied suppression mechanisms, mech, we directly measuredthe frequency response H(mech)(f) of the self-interferencechannel between the two antennas using an Agilent E8364B[23] general-purpose network analyzer (PNA). The channelresponse, H(mech)(f), was obtained by connecting the transmitand receive antenna ports to the network analyzer, configuredto record the S-parameters of a two-port network at 20,000uniformly spaced frequency components in the WiFi ISMband, f ∈ [2.40, 2.48] GHz. Each frequency sample wasaveraged over 20 measurements to reduce noise.
2) Metrics: Let α(mech)P denote the amount of passive sup-
pression achieved by the combination of mechanisms mech.We define α
(mech)P to be ratio of the transmit power to
the power of the self-interference incident on the receiver,which is the inverse of the power in the frequency response,H(mech)(f). Thus we compute α
(mech)P from the measured
frequency response according to
α(mech)P =
1
N
fmax∑f=fmin
∣∣∣H(mech)(f)∣∣∣2−1 . (2)
In addition to studying the amount of suppression thatdifferent mechanisms attain, we also want to study how pas-sive suppression affects the frequency-selectivity of the self-interference channel. The metric most often used to quantifythe frequency-selectivity of a wireless channel is the coherencebandwidth, BC . The definition of coherence bandwidth weadopt is the range of frequencies over which the channelresponse is at least 90% correlated [24]. The coherencebandwidth is difficult to measure directly, but can computedfrom the power delay profile of the channel, P (τ), which canbe easily measured. In our study, the power-delay profile is
obtained by taking the inverse discrete time Fourrier transform(DTFT) of the measured frequency response. The RMS delayspread of the channel, στ , can be computed from the powerdelay profile, which is related to the 90% coherence bandwidthvia the approximation [25]
BC ≈0.02
στ. (3)
Let P0(τ) denote the normalized power delay profile, that isP0(τ) = P (τ)∫ ∞
0P (τ)dτ
. The mean delay, µτ is given by µτ =∫∞0τP0(τ)dτ, and the RMS delay spread, στ , can then be
computed as [24].
στ =
√∫ ∞0
(τ − µτ )2P0(τ)dτ. (4)
Taking στ , computed as shown above from the measuredpower delay profile, and plugging into Equation (3) allowsapproximation of the coherence bandwidth from the empiricalchannel response. If we think of the normalized power delay,P0(τ), as the “distribution” on the delay τ then the aboveequations are easy to interpret.
III. EXPERIMENT RESULTS
Table I shows the passive suppression, α(mech)P , measured
for all of the configurations, both in the anechoic chamberand in the reflective room. Table I(a) contains the suppressionmeasurements for the directional-antenna configurations inthe anechoic chamber, and Table I(b) compares these mea-surements to those made in the reflective room. Similarly,Table I(c) shows the passive suppression measurements forthe omnidirectional configurations in the anechoic chamber,and Table I(d) shows the measurements for the omnidirectionalconfigurations is the reflective room. In parenthesis under eachentry is the uncertainty in each measurement due to networkanalyzer noise and calibration error3. See Appendix A for anexplanation of how these uncertainty values are obtained. Foreasier visualization, we also plot the directional-configurationdata shown in Tables I(a) and I(b) in Figure 3. To indicatehow far the worst-case passive suppression at any particularfrequency can differ from average passive suppression over thefrequency band, the minimum suppression over the frequencyband is indicated by a one-sided “error bar” (and does notcorrespond to the measurement uncertainty given in Table I).
First consider the passive suppression achieved for Config-uration I in the low-reflection environment of the anechoicchamber, shown in the first cluster of Figure 3(a). Looking atthe first bar in Figure 3(a) we see that when Configuration Iis used without any absorptive shielding or cross-polarization,the passive suppression is 45 dB. Comparing to the omnidirec-tional Configuration IV in the first column of Table I(c), wesee that the directional isolation (D) that comes from using the90◦ beamwidth antennas with 90◦ beam separation provides
3The uncertainty values in Table I account for noise and calibration biasof the measurement equipment. The extent to which the fabrication of theantenna configuration is repeatable will also affect the uncertainty, but isvery difficult to quantify. In the case of the anechoic chamber measurements,the reported uncertainties do not account for possible imperfections in theanechoic chamber, which is also hard to empirically quantify.

5
TABLE I: Passive Suppression Measurements
(a) Anechoic ChamberApplied Mechanism (mech) α
(mech)P
Config Iα(mech)P
Config IIα(mech)P
Config III
Directional (D) 45.3 dB(0.12 dB)
39.7 dB(0.10 dB)
45.1 dB(0.12 dB)
D + Absorber (DA) 55.4 dB(0.22 dB)
50.9 dB(0.16 dB)
55.9 dB(0.24 dB)
D + Cross-polarization (DC) 63.9 dB(0.51 dB)
58.3 dB(0.28 dB)
56.9 dB(0.26 dB)
D + Cross-pol + Absorber (DCA) 73.8 dB(1.5 dB)
72.5 dB(1.2 dB)
72.4 dB(1.2 dB)
(b) Reflective Roomα(mech)P
Config Iα(mech)P
Config IIα(mech)P
Config III
37.7 dB(0.10 dB)
36.0 dB(0.09 dB)
37.1 dB(0.09 dB)
39.4 dB(0.10 dB)
38.1 dB(0.10 dB)
37.4 dB(0.10 dB)
45.1 dB(0.12 dB)
44.9 dB( 0.12dB)
44.4 dB(0.11 dB)
45.9 dB(0.12 dB)
44.9 dB(0.12 dB)
45.7 dB(0.12 dB)
(c) Anechoic ChamberApplied Mechanism (mech) α
(mech)P
Config IVα(mech)P
Config V
None (∅) 27.9 dB(0.08 dB)
24.5 dB(0.08 dB)
Absorber (A) 48.0 dB(0.14 dB)
48.2 dB(0.14 dB)
(d) Reflective Roomα(mech)P
Config IVα(mech)P
Config V
27.6 dB(0.08 dB)
25.1 dB(0.08 dB)
40.1 dB(0.10 dB)
41.1 dB(0.10 dB)
(e) Legend
α(mech)P
Configuration
Value(Uncertainty)
(a) Anechoic Chamber
Config I Config II Config III
30
40
50
60
70
Pass
ive
Supp
ress
ion
(dB
)
D DA DC DCA
(b) Reflective Room
Config I Config II Config III
30
40
50
60
70
Pass
ive
Supp
ress
ion
(dB
)
D DA DC DCA
Fig. 3: Passive suppression measurements with directional isolation (D), directional isolation + absorptive shielding (DA),directional isolation + cross-polarization (DC), and directional isolation + cross-polarization shielding + cross-polarization(DCA). The worst-case (minimum) suppression over the frequency band is indicated by the error bar.
around 17 dB of passive suppression in addition to the 28 dBof path loss between antennas. Adding absorptive shielding(DA) gives an extra 10 dB of suppression for 55 dB totalsuppression. Similarly, adding cross-polarization (DC) givesan extra 18 dB of suppression for a total suppression of66 dB. When all the mechanisms are applied in tandem, di-rectional isolation absorptive shielding, and cross-polarizationtogether (DCA) yield 74 dB total suppression. A similar trendis followed for the other directional-antenna configurations
shown in Figure 3(a).4 We see in Figure 3(a) that, whenin the low-reflection environment of the anechoic chamber,leveraging directional isolation, cross-polarization, absorptiveshielding, in tandem (DCA) provides more than 70 dB ofpassive self-interference suppression in all three directional-antenna configurations. In the reflective room, however, thetotal suppression is much less, leading to the following result.
4We see in the first row of Tables I(a) and Tables I(b) that the sup-pression with directional isolation (D) is greater for Configuration II thanConfiguration III, both in the anechoic chamber and in the reflective room.This is surprising because the antennas are closer in Configuration III thanConfiguration II. We believe this is an artifact of the near-field couplingbetween the specific antennas used, not evidence of a general trend.

6
A. Effect of Environmental Reflections
Result 1: Environmental reflections limit the amount ofpassive self-interference suppression that can be achieved.
Comparing Figures 3(a) and 3(b), we see that in everycase the achieved suppression is less in the reflective roomthan in the anechoic chamber. Moreover, we observe that theincremental contribution of each applied mechanisms is muchless in the reflective room than in the anechoic chamber. InConfiguration I, for example, adding absorber improves theachieved suppression by 10 dB in the anechoic chamber, butprovides less than 3 dB added suppression in the reflectiveroom.
Reason for Result 1: Environmental reflections causea bottleneck in passive self-interference suppression, becausealthough the proposed mechanisms are very effective in sup-pressing the direct path between the transmit and receiveantennas, they are not necessarily effective in suppressingreflected self-interference paths. Once the direct-path self-interference is suppressed to the extent that it is no longerthe dominant path, further efforts to passively suppress self-interference may prove ineffective. Directional isolation iseffective in suppressing the direct path, but will not suppress areflected path that exits within the beamwidth of the transmitantenna and enters within the beamwidth of the receive an-tenna. Similarly, absorptive shielding certainly suppresses thedirect path, but will do nothing to suppress a self-interferencepath that includes a reflector outside the node. Finally, re-flections do not, in general, preserve polarization. Thus cross-polarizing the transmit and receive antennas suppresses thedirect path, but not necessarily the reflected paths.
We will now observe the time-domain response of themeasured self-interference channels to verify the hypothesisthat suppression of the direct path but not reflected paths is thereason for Result 1. We expect that for a given combination ofpassive suppression mechanisms the time response of the self-interference channel measured in the anechoic chamber willbe nearly the same as that measured in the reflective room foran initial interval corresponding to the direct path delay, butafterward we expect the tail of the time response to be muchmore powerful in the reflective room than in the anechoicchamber. Moreover, we expect that when more passive sup-pression mechanisms are applied, the tail of the time responsewill become dominant over the direct path, explaining whyadding more passive suppression mechanisms often does notimprove the achieved suppression in the reflective room.
The hypothesized behavior is exactly what we observe inFigure 4, which compares the time domain channel responsesmeasured in the chamber to those measured in the reflectiveroom for four different combinations of passive suppressionmechanisms. The time responses for omnidirectional antennaswith no suppression mechanisms in place (Configuration IV,mech = ∅) are shown in Figure 4(a). In this case, the self-interference is dominated by the direct path in both envi-ronments, explaining why the value the average suppression,α(mech)P , listed in Table I for this configuration is the same
in both environments. Figure 4(b) shows that when we applydirectional isolation (Configuration I, mech = D), the direct
path is significantly suppressed, but the reflection floor isnot. We saw in Figure 3 that adding absorber between thedirectional antennas gives 10 dB improvement in the anechoicchamber, but less than 3 dB improvement in the reflectiveroom; Figure 4(c) explains why. Comparing Figure 4(b) andFigure 4(c), we see that adding absorber suppresses the directpath by more than 10 dB in both environments, but in thereflective environment the direct path is no longer the domi-nant path after adding absorber, while in the anechoic chamberthe direct path remains the dominant path even after addingthe absorber. Thus the full benefit of adding the absorberis not realized in the reflective environment. Finally, we seein Figure 4(d) that adding cross-polarization in addition toabsorptive shielding adds another 10 dB of suppression in theanechoic chamber but does little in the reflective room, becausereflections have already become the bottleneck.
Design Implications of Result 1: All other factors beingequal, a full-duplex infrastructure node should be deployed asfar as possible from potential reflectors. In an environment thatis unavoidably reflective, resources should not be expendedattempting to passively suppress self-interference beyond thereflection strength.
B. Impact of Passive Suppression Frequency Selectivity ofSelf-interference Channel
Result 2: Passive self-interference suppression generallydecreases the coherence bandwidth (i.e. increases the fre-quency selectivity) of the residual self-interference channel.
Figure 5 shows measurements of the self-interference chan-nel frequency response, H(mech)(f), that illustrate the trendof increased frequency selectivity with increased passive sup-pression. Figure 5(a) plots the channel responses measured forConfiguration I in the anechoic chamber. We see in Figure 5(a)that the variation of the self-interference channel gain withfrequency increases as passive suppression mechanisms areapplied.5 The same trend was observed in the other fourconfigurations measured in the anechoic chamber. Figure 5(b)shows the channel responses measured for configuration I inthe reflective room. We see in Figure 5(b) that with directionalisolation alone, the self-interference channel is already quitefrequency selective. Adding cross-polarization and absorptiveshielding in Figure 5(b) does not significantly increase thefrequency selectivity, but nor does it increase the average self-interference suppression, since the direct path has already beensuppressed to the reflection floor as discussed in Result 1.Figure 5(b) hints that there is nothing special about direc-tional isolation, cross-polarization, or absorptive shielding thatcauses the increase in frequency selectivity, but the fact thateach mechanism serves to reduce the direct path.
Reason for Result 2: Result 2 is nearly a corollary ofResult 1. Since the dominant direct path is suppressed, the
5The channel responses in Figure 5(a) also may appear to be growing morenoisy as more suppression mechanisms are applied. The appearance of greaternoise is an artifact of the dB scaling of the plot making the measurement noiseof the much lower-power suppressed channel appear larger. The thermal noisefloor in this measurement was -100 dB, as computed from the manufacturerdata sheet [23] given the 20Khz IFBW and averaging factor or 20 used in themeasurement.

7
(a) Omnis (∅)
Reflective
Anechoic
0 20 40 60 80 100
−100
−80
−60
−40
−20
t (ns)
|h(t)|
2(d
B)
∅: Anechoic Chamber∅: Reflective Room
(b) Directionals (D)
Reflective
Anechoic
0 20 40 60 80 100
−100
−80
−60
−40
−20
t (ns)
|h(t)|
2(d
B)
D: Anechoic ChamberD: Reflective Room
(c) Directionals + Absorber (DA)
Reflective
Anechoic
0 20 40 60 80 100
−100
−80
−60
−40
−20
t (ns)
|h(t)|
2(d
B)
DA: Anechoic ChamberDA: Reflective Room
(d) Directionals + Crosspol + Absorber (DCA)
Reflective
Anechoic
0 20 40 60 80 100
−100
−80
−60
−40
−20
t (ns)
|h(t)|
2(d
B)
DCA: Anechoic ChamberDCA: Reflective Room
Fig. 4: Comparing time responses measured in an anechoic chamber against the time responses measured in a reflective room.
(a) Configuration I in anechoic chamber
D
DA
DC
DCA
Noise Floor
2.4 2.42 2.44 2.46 2.48
−100
−80
−60
−40
−20
f (GHz)
|H(f
)|2
(dB
)
Directional (D)D + Absorber (DA)D + Cross-pol (DC)DCA
(b) Configuration I in reflective room
DDA
DA
DCA
Noise Floor
2.4 2.42 2.44 2.46 2.48
−100
−80
−60
−40
−20
f (GHz)
|H(f
)|2
(dB
)
Directional DD + Absorber (DA)D + Cross-pol (DC)DCA
Fig. 5: Self-interference channel responses illustrating increased frequency selectivity with increased passive suppression.

8
residual channel after passive suppression is the superposi-tion of many reflected paths. Passive suppression transformsthe self-interference channel from a high-power line-of-sight-dominated channel to a low-power multi-path channel. It iswell known that multi-path channels are frequency selectivedue to paths combining constructively at some frequencies anddestructively at others. We will more precisely give the reasonfor Result 2 in two steps: first we will consider a simpleanalytical example that illustrates why the coherence band-width of the self-interference channel decreases as the directpath is suppressed. Second, we will present measurements ofthe coherence bandwidth for all five configurations in bothenvironments to give further evidence of Result 2 and reinforcethe intuitions gained from the analytical example.
0 5 10 15 200
10
20
30
Delay, τ (s)
P(τ)
(dB
)
Fig. 6: Example of a power-delay profile with both direct andreflected paths. In this example PD = 25 dB, PR = 5 dB⇒ DRR = 20 dB, and TR = 20 s.
1) Analytical example: Consider the “two-level” self-interference power delay profile shown in Figure 6, in whichthe first tap which contains the direct path and has powerPD, and the remaining TR − 1 taps, all due to reflectedpaths, have power PR, where TR is the reflection durationof the environment. Denote the ratio of the direct-pathpower to the reflected-path power as the direct-to-reflectedratio, DRR ≡ PD
PR. As passive suppression mechanisms are
employed, we know from Result 1 that DRR will decrease,since the direct path will be suppressed while the reflectivepaths maintain the same power.
Figure 7 plots the RMS delay spread, στ , and the cor-responding coherence bandwidth, BC = 0.02/στ , vs. DRRfor four different values of TR. Suppressing the direct path(reducing DRR) will lead to a heavier tail in the normalizedpower delay profile, P0(τ), and hence a larger RMS delayspread and smaller coherence bandwidth. When the passivesuppression is such that the power in the direct path is thesame as the power in the reflected paths, the RMS delayspread is maximum. Once DRR < 0 dB, the reflected portionof the power delay profile becomes dominant, so that furthersuppression of the direct path has little impact on the RMSdelay spread and coherence bandwidth.
In summary, the analytical example shows the followingtrend. When no passive suppression is applied, the direct-path self-interference will be significantly stronger than re-flected paths, and the coherence bandwidth will be relatively
high, such that the self-interference channel will be relativelyfrequency-flat. As passive suppression is applied, the reflectedpaths become a larger portion of the power delay profile,and the coherence bandwidth decreases such that the self-interference channel becomes more frequency-selective. In thelimit of very strong passive suppression, the direct path iseffectively eliminated, and the coherence bandwidth levels off,because the delay spread converges to the reverberation spreadof the environment.
2) Coherence Bandwidth Measurements: Now let us checkthat the measurements in the passive suppression character-ization follow the trend illustrated in the above analyticalexample. For each self-interference channel measurement, thethe direct-path suppression and the coherence bandwidth werecomputed from the measured frequency response. The result-ing tuples of direct-path suppression and coherence bandwidthare shown as a scatter plot in Figure 8(a). The dark redpoints in Figure 8(a) correspond to measurements made inthe anechoic chamber, and the light blue points correspond tothe reflective room. The combination of mechanisms used islabeled by the symbol as shown in the legend.6
The trend we observe in Figure 8(a) is the same as predictedfrom our analytical example. The anechoic chamber has a verylow reflection floor, around −80 dB, so when no suppression isapplied, the coherence bandwidth is large: between 10 and 25MHz depending on the configuration. If absorptive shieldingor cross-polarization is employed: the direct-path suppressionis increased to 50-70 dB and the coherence bandwidth shrinksto 2-15 MHz. When both cross-polarization and absorptiveshielding are applied together, the direct-path suppression isgreater than 70 dB, near the reflection floor of the chamber,hence the coherence bandwidth begins to level off at around3 MHz. In the reflective room, the trend is the same butmuch more abrupt, since the reflection floor is much higher:around −45 dB. In the reflective room, only when omnidi-rectional antennas are used with no suppression mechanisms(mech = ∅) is the direct path significantly stronger than thereflected paths (as was seen in Figure 4), in which casethe coherence bandwidth is around 2 MHz. Once one ormore suppression mechanisms are employed, the direct path ispushed below 40 dB, and the coherence bandwidth convergesto the 0.6-0.9 MHz dictated by the long reverberations ofthe reflective room. Typical deployments will have a reflec-tion floor between the two extremes presented here, but thetrend will be the same. Passive suppression can transform arelatively frequency-flat self-interference channel to a highlyfrequency-selective channel, but the coherence bandwidth willbe no worse than natural coherence bandwidth dictated by thereverberation depth of the environment.
Design Implications of Result 2: Most full-duplex systemswill attempt to further suppress self-interference by employingactive cancellation in addition to passive suppression. Self-interference is cancelled by leveraging foreknowledge of the
6Not evident in Figure 8 (to reduce clutter and focusing on the trend), isthe configuration on which the measurement was made, which accounts forthe sometimes wide variation in points corresponding to the same suppressionmechanisms.

9
(a) RMS delay spread vs. direct-to-reflected ratio.
TR = 5
TR = 10
TR = 20
TR = 40
−60−40−200204060
0
5
10
15
DRR (dB)
στ
(s)
TR = 5
TR = 10
TR = 20
TR = 40
(b) Coherence bandwidth vs. direct-to-reflected ratio.
−60−40−2002040600
2
4
6·10−2
TR = 5
TR = 10
TR = 20TR = 40
DRR (dB)
BC
(nor
mal
ized
Hz)
TR = 5
TR = 10
TR = 20
TR = 40
Fig. 7: Impact passive suppression on RMS delay spread and coherence bandwidth.
(a) Scatter plot of coherence bandwidth vs. direct-pathsuppression plot over all configurations.
20 40 60 800
10
20
Direct-path suppression (dB)
Coh
eren
ceB
W,B
C(M
Hz)
Anechoic: ∅Anechoic: AAnechoic: DAnechoic: DAAnechoic: DCAnechoic: DCARoom: ∅Room: ARoom: DRoom: DARoom: DCRoom: DCA
(b) Required taps for the active self-interferencecanceler.
20 40 60 800
10
20
30
Direct-path suppression (dB)
Req
uire
dta
ps
Fig. 8: Influence of direct-path suppression of frequency selectivity
signal to inject a cancellation waveform into the receivedsignal path. To craft the cancellation signal, a copy of thetransmit signal must pass through a filter whose response isthe negative of the self-interference channel. Result 2 impliesthat the number of taps in this cancellation filter may increasewhen passive suppression is employed. Figure 8(b) takesthe data shown in Figure 8(a), and computes the requirednumber of taps in the cancellation filter, assuming the transmitsignal has a bandwidth of 20 MHz. In the low-reflectionenvironment only one or two taps are needed when the passivesuppression is low (25-45 dB), but as the passive suppressiongets strong (60-80 dB), 10-15 taps may be needed. In the high-reflection environment, 7-12 taps are needed when the passivesuppression is low, but once the passive suppression is morethan 40 dB, nearly 30 taps are needed. In an OFDM system,Result 2 implies that when active cancellation is employed inconcatenation with strong passive suppression, it may be betterto perform the active cancellation on a per-subcarrier basis asin [11], [12] rather than directly canceling the broadband self-interference as in [6].
C. Passive Suppression vs. Active Cancellation
The above discussion raises the following question: is therea tradeoff between passive suppression and active cancellation,and would one rather use one than the other, or alwaysuse both together? The results from this paper and thosefrom related works are in agreement that passive suppressionand active cancellation should be applied together wheneverpossible. In this paper, it is shown that passive suppressionis limited by reflections, and active cancellation is needed tosuppress the residual reflected paths. Conversely, in [13]–[15]it is shown that active cancellation is limited by transmitternoise, and thus passive suppression (which can suppresstransmitter noise just as well as transmitter signal) is neededto improve performance. In [13] a preprint of this paper iscited and our Result 1 is used to show that although passivesuppression can degrade active cancelation performance, itcan only increase the total self-interference suppression. Inthe full-duplex system evaluation such as [2], [10], [11],the designs employing both passive suppression and activecancellation together always have the best performance. Thesummary of ours and the previous work is that although

10
the gains of passive suppression and active cancellation arenot dB-additive, never is it the case that passive suppressionalone or active cancellation alone will have better performancethan both in concatenation. The question of which approach,passive suppression or active cancellation, is more efficient isstill open, and is in interesting topic for future study.
IV. IMPACT OF PASSIVE SUPPRESSION ON SYSTEMMETRICS
We will now analytically assess the impact that Re-sults 1 and 2 have on the performance of a full-duplex infras-tructure node. Consider a full-duplex infrastructure node thatreceives an uplink signal from one user while also transmittingto another user as shown in Figure 12(b). We will focus onuplink performance, since it is the uplink that suffers fromself-interference.
A. Channel Model
The channel model must capture the limitations of bothpassive suppression and active cancellation. Prior work [13]–[15] has identified transmitter noise as the major factor limitingactive cancellation, and this paper identifies environmental re-flections as the major factor limiting passive suppression. Thuswe model the signal received by the full-duplex infrastructurenode at time n as,
y[n] =hS [n] ∗ (xS [n] + zS [n]) (5)+ hI [n] ∗ (xI [n] + zI [n]) + zR[n],
where xI and xS are the signals transmitted by the infras-tructure node and the uplink user, respectively, hI and hS arethe discrete baseband-equivalent impulse responses of the self-interference channel and the signal-of-interest channel, respec-tively, zI and zS are transmitter noise in the self-interferenceand signal-of-interest, respectively, zR is the receiver noise,and “∗” signifies convolution. For convenience, we assumethe signal-of-interest channel, hS , has only a single tap andthe signal-of-interest is free of transmitter noise, as thesewill have little impact on self-interference suppression. Letthe receiver noise and transmitter noise be drawn i.i.d. fromcircularly-symmetric gaussian distributions of variance NRand NT , respectively, and let the transmit signals, xS and xI ,be subject to average power constraint of PT . With the aboveassumptions, the received signal can be rewritten as
y[n] = hSxS [n] + hI [n] ∗ (xI [n] + zI [n]) + zR[n],
zI ∼ CN (0, NT ), zR ∼ CN (0, NR). (6)
Let us extend the “two-level” self-interference power delayprofile discussed in section III-B to model the self-interferencechannel hI [n]. We assume that there are many reflected pathsof power PR that extend over TR taps and a single directpath of power PD. Thus we model the first channel tap asRician fading with κ-factor PD/PR and variance PD + PR,and the remaining TR−1 taps as Rayleigh fading with variancePR. We assume the single-tap signal-of-interest channel, hS ,is Rayleigh fading with variance PS . Per Result 1, passivesuppression can reduce PD, but not PR. We assume each
channel tap is ergodic block fading with coherence timeTC � 1, and assume coding can be performed over a largenumber of coherence times so that the notion of ergodiccapacity can be employed [26]. We assume both the user andthe infrastructure node have perfect knowledge of the channelresponses, and the infrastructure has knowledge of its owntransmit signal, xI , but has no knowledge of its transmitternoise, zI .
B. Impact of Direct-path Suppression on Capacity
Theorem 1: The capacity of the full-duplex uplink channeldescribed in eq. 6 is
CFDUplink = E
[∫ π
−π
(1 +
(ν − SN (f))+
SN (f)
)df
], (7)
where SN (f) = |√NTHI(f)+
√NR|2, HI(f) is the DTFT of
the self-interference channel impulse response, hI [n], and ν isa water-filling parameter chosen such that
∫(ν−SN (f))+df =
|hS |2PT . The expectation is with respect to the channelresponses, hI and hS .
Proof: Because the portion of the self-interference dueto intended signal, hI ∗ xI , is known, it can be cancelled byforming
y′[n] = y[n]− hI [n] ∗ xI [n] (8)= hSxS [n] + hI [n] ∗ zI [n] + zR[n], (9)
so that the only self-interference that remains is the transmitternoise filtered by the self-interference channel response. Withina single coherence time, Equation 9 is equivalent to thewell-known colored Gaussian noise channel with input powerconstraint P = |hS |2PT and noise power spectral densitySN (f) = |
√NTHI(f) +
√NR|2, where HI(f) is the DTFT
of hI [n]. The capacity of the colored Gaussian channel isachieved via water-filling in the spectral domain and is givenby [27]
C =
∫ π
−π
(1 +
(ν − SN (f))+
SN (f)
)df, (10)
where ν is the “water level” chosen such that∫
(ν −SN (f))+df = P . By averaging over many independent fadesof the channel taps, the capacity given in Theorem 1 isobtained.
We want to compare full-duplex capacity to both half-duplex and “ideal” full-duplex capacity. Assuming that inhalf-duplex mode the uplink must evenly time-share with thedownlink, the uplink capacity is easily shown to be
CHDUplink = E
[1
2log2
(1 +
2|hS |2PTNR
)], (11)
where the pre-log factor of 1/2 accounts for the time sharing,and the factor of 2 in the numerator of the SNR term is due tothe fact that the user can transmit with twice the power since itonly transmits half the time. Similarly, the “ideal” full-duplexergodic capacity (the capacity when self-interference channelis zero) is easily shown to be
CIdealFDUplink = E
[log2
(1 +|hS |2PTNR
)]. (12)

11
(a) System parameters assumed.
Parameter ValueTransmit power, PT 0 dBm
Transmit noise power, NT −30 dBmReceiver noise power, NR −90 dBm
Signal channel variance, PS −60 dBExtent of reflections, TR 32
(b) Capacity vs. direct-path strength.
Ideal Full-Duplex
Half-duplex
−100−80−60−40−200
2
4
6
8
10
Direct-path strength, PD (dB)
CFD
Uplink
(bits
/s/H
z)
PR = −40 dBPR = −50 dBPR = −60 dBPR = −70 dBPR = −80 dB
Fig. 9: Numerical evaluation of ergodic uplink capacity ofEq. 7.
Note that neither half-duplex nor ideal full-duplex capacitiesdepend on PD or PR.
Equations (7) (11) and (12) are numerically evaluated inFigure 9(b). The values assumed for the system parameters,shown in Figure 9(a), are typical of WiFi systems. We seein Figure 9(b) that once the direct path strength, PD, issuppressed to the reflection level, PR, the capacity no longergrows, which emphasizes the design implication of Result 1:that full-duplex infrastructure nodes should be deployed so asto neutralize nearby reflections.
C. Influence of Increased Frequency Selectivity on ActiveCancellation
In the above analysis we have assumed no limitation onthe number of taps in the self-interference canceler. Wenow relax this assumption to study how increased frequencyselectivity influences the performance of an active cancelerwith NTap ≤ TR taps. Denote the first NTap taps of hI ash′I [n] = hI [0, 1, . . . , NTap − 1]. We assume that the infras-tructure node has perfect knowledge of h′I [n] and subtractsthe known transmit signal, filtered by h′I [n], from its receivedsignal forming
y′[n] = y[n]− h′I [n] ∗ xI [n]
= hSxS [n] +
TR−1∑m=NTap
h[m]xI [n−m]
+ hI [n] ∗ zI [n] + zR[n]. (13)
We define the average passive suppression, αP, to be theaverage ratio of the transmit power to the power of the self-interference incident on the receiver. Similarly, we define theaverage active cancellation, αA, to be the average ratio of thepower of the self-interference incident on the receiver to thepower of the self-interference after cancellation. It is easy toshow from Equation (13) that the average passive suppressionis αP = E
[1|hI |2
], and the average active cancellation is
αA = E
[|hS |2(PT +NT )∑TR−1
m=NTap|hI [m]|2PT +
∑TR−1m=0 |hI [m]|2NT
],
(14)where the expectations are with respect to the channel gaindistributions specified above.
PR
−100−80−60−40−200
10
20
30
40
Direct-path strength, PD (dB)
Supp
ress
ion
(dB
) αP
αA NTap = 1
αA NTap = 24
αA NTap = 32
Fig. 10: Passive suppression, αP, and active cancellation,αA, vs. direct-path strength with reflection strength of PR =−60 dB and reflection extent of TR = 32.
Equation (14) is evaluated numerically in Figure 10 forNTap = 1, 24 and 32, where a reflection strength of PR =−60 dB, a reflection extent of TR = 32, and parameter valuesshown in Figure 9(a) are assumed. Figure 10 emphasizesthe design implication of Result 2. We see that when thepassive suppression is low, a single-tap canceler can have goodperformance, but as the passive suppression increases and thechannel becomes frequency selective, the single tap cancelerdegrades. Only if the self-interference canceler employs thefull-number of taps in the channel, TR = 32, can the itcontinue to cancel significant amounts of self-interference inthe presence of strong passive suppression.
V. FULL-DUPLEX PROTOTYPE WITH COMBINED PASSIVEAND ACTIVE SUPPRESSION
We now investigate the performance of combined passiveand active suppression in a prototype wideband OFDM full-duplex physical layer.
A. Prototype Full-Duplex Infrastructure Node Description
A full-duplex infrastructure node was prototyped using theWARPLab framework [16], in which baseband signals are pro-cessed offline in MATLAB, then up-converted and transmittedover-the-air at 2.4 GHz in real time. The prototype implements

12
a 20 MHz, 64-subcarrier OFDM PHY with a packet structurebased on IEEE 802.11. The prototype infrastructure node wasmounted outdoors on a 7 ft. pole just outside the Rice Univer-sity Tudor Fieldhouse. The prototype was evaluated using an-tenna Configuration II (Figure 1(b)) with absorptive shielding,and with and without cross-polarization. Thus the mechanismcombinations evaluated were mech = {DA,DCA}.
For active self-interference cancellation, we adopted the per-subcarrier analog and digital cancellation mechanisms demon-strated in [7], [11], [28]. Analog cancellation is implementedby estimating the self-interference channel via OFDM pilots,crafting a wideband cancellation waveform, and injecting thecancellation waveform into the receive signal path using anRF combiner, so that the the self-interference is cancelledprior to the RF front end. Digital cancellation is implementedby estimating and subtracting, at baseband, the residual self-interference left after analog cancellation. Result 2 tells us thatthe coherence bandwidth of the self-interference channel willlikely by high due to the passive suppression. Because thecancellation scheme is performed on a per-subcarrier basis,we expect that cancellation performance will be robust to suchfrequency-selectivity.
B. Protoype Evaluation Results
1) Total suppression exceeding 90 dB: One-hundred pack-ets were transmitted by the infrastructure node at a power of7 dBm, and the amount of self-interference suppression wasmeasured by observing the received signal strength indication(RSSI) from the WARP radio. Figure 11(a) shows the empiri-cal CDFs for the self-interference suppression. We see in Fig-ure 11(a) that with directional isolation and absorptive shield-ing (mech = DA), 60 dB of passive suppression is achievedon the average. Adding cross-polarization (mech = DCA)increases the average passive suppression to 71 dB. Thesevalues are in line with the characterization of Section III:since the outdoor deployment has weak reflections, we expectthe achieved suppression to be near that seen in the anechoicchamber, in which we saw 72 dB of passive suppression formech = DCA. Furthermore, we see in Figure 11(a) that activecancellation adds around 25 dB of suppression, on the average,in both co-polarized and cross-polarized cases. In the cross-polarized case, the total self-interference suppression rangesfrom 87 dB to 100 dB, with 95 dB average suppression.7 Thusthe analog and digital cancellation mechanisms of [11] are stillable to provide 20-25 dB of self-interference cancellation, evenafter the self-interference is attenuated 70 dB by the passivemechanisms.
2) Full-duplex uplink-rate improvements at 100+ m: Ina full-duplex infrastructure node with simultaneous uplinkand downlink (such as a full-duplex relay or a full-duplexsectorized access point as shown in Figure 12(b)), the uplinkto the infrastructure node is the link that will suffer from self-interference. Thus a good system-level metric for comparing
7In the empirical CDF for “w/ Cross-pol: passive + active”, there is aslight flat spot at 95 dB. We believe this is an artifact of the finite-sampled(i.e. histogram) approximation of the distribution, and not evidence of a multi-moded distribution of self-interference suppression.
full-duplex performance against half-duplex is comparing theaverage achievable full-duplex uplink rate RFD
Uplink to thecomparable average achievable half-duplex uplink RHD
Uplink. Toexperimentally measure the average achievable rate, we em-ploy the common practice of measuring the effective SNR (orSINR) for each packet, and computing the achievable rate foreach packet from Shannon’s formula [27] R = log(1 +SNR).Averaging over all packets received, we obtain the averageachievable rate. The effective SNR (SINR) of packet p ismeasured by computing the average error vector magnitude,EVM(p), which is the average distance between the receivedsymbols (after equalization) in packet p and the originaltransmitted symbols. Average EVM is used to find the effectiveSNR using the common conversion SNR(p) = 1/EVM(p)2
[29].We measure the signal-to-self-interference-plus-noise ratio
(SSINR) for the full-duplex uplink by having the infras-tructure node receive packets from the uplink mobile nodewhile simultaneously transmitting. From the EVM statisticswe measure the SSINRFD
Uplink for each packet. Similarly, tomeasure the SNR of the comparable half-duplex uplink, wecompute SNRHD
Uplink from the EVM statistics of the packetsreceived at the uplink, but without the infrastructure nodetransmitting simultaneously. The average achievable rates ofthe full-duplex/half-duplex links are thus computed from themeasured SSINR/SNR values using the formulae,
RFDUplink =
1
N
N∑p=1
log2[1 + SSINRFDUplink(p)] (15)
RHDUplink =
1
N
N∑p=1
1
2log2[1 + SNRHD
Uplink(p)], (16)
where p is the packet index, and N is the total number ofpackets. Note that the pre-log factor of 1
2 in Equation (16)is due to the assumption of even timesharing with downlinkin half-duplex mode. To make the comparison fair in averagepower, the uplink mobile is given twice the transmission power(10 dBm rater than 7 dbm) in half-duplex mode, since weassume it defers to downlink half of the time. We note thatthe above method of characterizing a prototype’s performanceby computing achievable rates from measured SNR/SSINRis well-established in prior work such as [7], [30], [31].For a very thorough explanation see Section III of [31] andreferences therein.
The achievable rates of the full-duplex uplink and com-parable half-duplex uplink were measured as the range fromof the uplink mobile to the infrastructure node was variedfrom 50 to 200 meters in order to encounter a variety ofpath losses. Figure 11(b) plots the percent improvement ofthe full-duplex uplink rate, RFD
Uplink, versus the half-duplexuplink rate, RHD
Uplink, as a function of the encountered pathloss.8 We see that at 86 dB path loss, the improvement over
8As expected, the encountered path loss was not monotonic with range dueto shadowing effects, hence rate vs. range curves are noisy and difficult tointerpret. Instead, we measured the encountered path loss for each mobilenode location so that the performance could be indexed by this meaningful,repeatable parameter.

13
(a) CDF of self-interference suppression.
60 70 80 90 1000
0.25
0.5
0.75
1
Self-interference Suppression (dB)
Em
piri
cal
CD
F
w/o Cross-pol: Passivew/ Cross-pol: Passivew/o Cross-pol: Activew/ Cross-pol: Active
(b) Percent uplink rate improvement of FD over HD.
85 90 95 100 105−100
−50
0
50
100
Path Loss (dB)
%Im
prov
emen
t
Without cross-polarizationWith cross-polarization
70 100 150 215 315Range (m) Shadowed Urban
Fig. 11: Full-duplex prototype evaluation results.
half-duplex is 86% when directional isolation and absorptiveshielding are applied together with active cancellation. Whencross-polarization is also employed, the gain over half-duplexat 86 dB path loss is 96%, meaning that the effect of self-interference is nearly eliminated, since the rate is nearlydoubled. In Figure 11(b), a second x-axis is also shown, whichmaps path loss to effective range in a typical urban chan-nel [32]. With the best design, including cross-polarization,we expect to see full-duplex outperform half-duplex for up to200 m range. Even without cross-polarization, the prototypefull-duplex design outperforms half-duplex at effective rangesexceeding 100 m. Of particular note is the significant impact ofcross-polarization. Figure 11(a) showed that cross-polarizationprovides an extra 10 dB of total suppression, and we see thesystem-level impact of this extra 10 dB in Figure 11(b): thesame gains over half-duplex can be attained at 10 dB morepath loss with cross-polarization than without.
VI. DISCUSSION: IMPACT ON THE USER’S ACCESS TOTHE INFRASTRUCTURE NODE
There are two main scenarios in which an infrastructurenode can leverage full-duplex capability to enhance its serviceto users: two-node full-duplex and three-node full-duplex, il-lustrated in Figure 12. Note that two-node full-duplex requiresthe user device to be full-duplex capable, while three-nodedoes not. Due to the extra hardware burden that full-duplexwould place on mobile devices, we expect the first applicationsof full-duplex will be three-node scenarios, where the usersare half-duplex, hence the emphasis on infrastructure nodesrather than user nodes in this paper. The interference from theuplink user to the downlink user in three-node full-duplex canbe managed by either scheduling non-interfering users as in[33], or canceling the inter-user interference using advancedphysical layers as in [34].
AP
M
Full-duplex Infrastructure
Full-duplex User
(a) Two-node full-duplex: infrastructure nodesimultaneously transmits and receives to a singlefull-duplex user.
M1
M2
AP
Half-duplex User
Half-duplex User
Full-duplex Infrastructure
(b) Three-node full-duplex: infrastructure node receivesfrom one user while transmitting to another user.
Fig. 12: Scenarios for full-duplex transmissions.

14
A. Impact of Directional Isolation
1) Supporting Full-duplex and Half-duplex Users: Wemake the distinction between two-node and three-node full-duplex, because directional isolation is often better suitedfor three-node full-duplex applications. For example, in Con-figuration I (Figure 1(a)), the two antennas cover disjointareas, and cannot transmit and receive in the same direction,hence Configuration I is poorly suited to support two-nodefull-duplex transmissions. However, Configuration I is indeedwell-suited to support three-node full-duplex transmissions,when the uplink user is covered by one antenna the downlinkuser is covered by the other antenna as in Figure 12(b).Configurations II and III (Figures 1(b) and 1(c)), both of whichuse 90◦ beamwidth antennas with 60◦ separation, also supportthree-node full-duplex transmissions but can only support atwo-node full-duplex transmission if the full-duplex-equippeduser is in the 30◦ intersection of the two coverage patterns.Configurations IV and V (Figures 1(d) and1(e)) which useomnidirectional antennas support both two-node and three-node full-duplex scenarios regardless of location of the user.
2) Managing directional access: In a directional antennasystem, control must be employed to ensure that any user isserviced by the antenna(s) with the strongest gain in the user’sdirection. Many algorithms have been proposed for adaptivedirectional antenna selection [35]–[37], and commercial accesspoints with directional antennas that implement dynamic userselection are in the market [38], [39]. It is outside the scope ofthis paper, but modest extension of the control algorithms usedin these existing systems can be used to schedule concurrentthree-node full-duplex transmissions with directional antennas.
B. Impact of Cross-polarization
Cross-polarization at the infrastructure node can also affectusers. Assume the infrastructure node transmits with horizon-tal polarization and receives with vertical polarization. Theimpact of cross-polarization on the user nodes depends on theenvironment as described below.
1) Non-line-of-environments: In a non-line-of-sight envi-ronment, studies have shown that scattering leads to signalsbecoming de-polarized [40]: the received wave is the superpo-sition of many randomly polarized components. Thus the useris agnostic to the polarization state at the infrastructure node. Asingle-antenna user with any arbitrarily polarized antenna willbe able to receive from the infrastructure node’s horizontallypolarized transmit antenna and transmit to the infrastructurenodes’ vertically polarized receive antenna equally well.9
2) Line-of-sight environments: In a line-of-sight environ-ment, however, cross-polarization at the infrastructure nodeinfluences the polarization requirements of the user. If the userhas only a single vertically polarized antenna, for instance,then it will have poor SNR when receiving the horizontally-polarized downlink. The ideal solution would be for users to
9The optimal design at the user device would have three orthogonallypolarized antennas, combining power from all three so that all incident energyis captured. But this is not specific to full-duplex, but the case also for half-duplex in any non-line-of-sight environment.
match the infrastructure polarization: a half-duplex user witha dual-polarized antenna could transmit on the vertical portand receive on the horizontal port. Dual-polarized antennasare available in form factors suitable for mobile phones [41].The downside to polarization matching is that it requires theuser device to either be in a stable orientation or to trackits orientation. Smartphone sensors make tracking orientationfeasible, and as orientation information was leveraged forantenna-pattern switching in [42], so it could be leveragedfor polarization matching. A simpler solution is for each userdevice to use a circularly polarized antenna, which coupleswith both vertical and horizontal polarization, but with a 3 dBloss due to polarization mismatch [43].
VII. CONCLUSION AND FUTURE WORK
We have seen that a careful utilization of the passive self-interference suppression mechanisms of directional isolation,absorptive shielding, and cross-polarization can significantlyimprove the performance of full-duplex links, but some fun-damental limitations are encountered. The amount of passivesuppression is limited by reflected paths which are difficultto suppress passively. Moreover, because passive suppressioneliminates the once-dominant direct self-interference path, theresidual self-interference channel can be much more frequencyselective. We have shown that a design that takes thesecapabilities and limitations into account can achieve a full-duplex link that outperforms a comparable half-duplex linkeven a ranges exceed 100 m.
A future step in this research direction is to develop ageneral theory for passive suppression. For example, givena size constraint, a coverage requirement, and a descriptionof the scattering/reflection environment, one would like tosolve for the antenna design and placement of absorbers whichoptimizes system capacity. Such a theory will require not onlynew analysis but new models, and we hope the results in thispaper are a first step towards developing the models requiredfor a general theory of passive suppression.
APPENDIX AMEASUREMENT DETAILS AND UNCERTAINTY ANALYSIS
As mentioned in Section II the frequency response ofthe self-interference channel was measured using a networkanalyzer. We now discuss details how the measurement setup,and discuss the associated uncertainty.
A. Measurement Details
A two-port network analyzer, such as the the AgilentE8364B [23] used in our study, measures the S-parameters ofan arbitrary two-port RF network by sweeping a continuouswave at the input(s) and measuring the amplitude and phaseof the output(s). In our case, the two ports of interest arethe ports of the infrastructure node antennas, and S21, thetransmission coefficient, gives the amplitude and phase of thechannel. A full two-port calibration was performed with theAgilent N4691B [44] calibration kit connected after the cablesand connectors, thus correcting for any cable loss or coupling,and placing the phase and amplitude reference directly at

15
the intended antenna ports. An intermediate frequency (IF)bandwidth of 20 kHz was used, as this provided a good balancebetween noise floor and frequency sweep time. To lessen theeffect of noise, each frequency point was averaged over 20repeated measurements.
0.01
0.1
1
10
-90-80-70-60-50-40-30-20-10010
Un
ce
rta
inty
(d
B)
Transmission Coefficient (dB)
S21 Magnitude Accuracy
E8364B Full Two Port Cal Using N4691B
IF Bandwidth = 20 KHz; Average Factor = 20
S11 = S22 = 0; Cal power = -12 dBm; Meas power = -12 dBm
Fig. 13: Uncertainty curve for the network analyzer measure-ment setup presented in Section II
.
B. Uncertainty Discussion
Assessing uncertainty by merely computing empirical stan-dard deviation over the 20 points measured would only quan-tify noise and not quantify the uncertainty due to imperfectcalibration. Thankfully, Agilent provides a software tool calledUncertainty Calculator [45] that computes the uncertaintyassociated with a measurement setup from the following keyparameters: the IF bandwidth (20 kHz in our case) whichaffects the thermal noise, the averaging factor (20 in our case),and the calibration instrument used. Uncertainty Calculatoruses proprietary statistical characterizations of Agilent hard-ware to perform a root sum square uncertainty analysis andcompute uncertainty as a function of the power of the quantitymeasured. Figure 13 plots the uncertainty curve generated forour setup, from which the uncertainty entries in Table I aretaken.
REFERENCES
[1] D. W. Bliss, P. A. Parker, and A. R. Margetts, “Simultaneous trans-mission and reception for improved wireless network performance,” inProceedings of the 2007 IEEE/SP 14th Workshop on Statistical SignalProcessing. Washington, DC, USA: IEEE Computer Society, 2007, pp.478–482.
[2] A. K. Khandani, “Methods for spatial multiplexing of wireless two-waychannels,” US Patent US 7 817 641, October 19, 2010.
[3] B. Radunovic, D. Gunawardena, P. Key, A. P. N. Singh, V. Balan, andG. Dejean, “Rethinking indoor wireless: Low power, low frequency, fullduplex,” Microsoft Technical Report, Tech. Rep., 2009.
[4] M. Duarte and A. Sabharwal, “Full-duplex wireless communicationsusing off-the-shelf radios: Feasibility and first results,” in Proc. 2010Asilomar Conference on Signals and Systems, 2010.
[5] J. I. Choi, M. Jain, K. Srinivasan, P. Levis, and S. Katti, “Achievingsingle channel, full duplex wireless communication,” in MobiCom 2010.
[6] M. Jain, J. I. Choi, T. Kim, D. Bharadia, S. Seth, K. Srinivasan,P. Levis, S. Katti, and P. Sinha, “Practical, real-time, full duplexwireless,” in Proceedings of the 17th annual international conferenceon Mobile computing and networking, ser. MobiCom ’11. NewYork, NY, USA: ACM, 2011, pp. 301–312. [Online]. Available:http://doi.acm.org/10.1145/2030613.2030647
[7] M. Duarte, C. Dick, and A. Sabharwal, “Experiment-drivencharacterization of full-duplex wireless systems,” May 2011, toappear in Wireless Communications, IEEE Transactions on. [Online].Available: http://warp.rice.edu/trac/wiki/TransWireless2011 FullDuplex
[8] A. Sahai, G. Patel, and A. Sabharwal, “Pushing the limits of full-duplex: Design and real-time implementation,” Rice Univeristy, Tech.Rep. TREE1104, 2011.
[9] M. A. Khojastepour, K. Sundaresan, S. Rangarajan, X. Zhang,and S. Barghi, “The case for antenna cancellation for scalablefull-duplex wireless communications,” in Proceedings of the 10thACM Workshop on Hot Topics in Networks, ser. HotNets-X. NewYork, NY, USA: ACM, 2011, pp. 17:1–17:6. [Online]. Available:http://doi.acm.org/10.1145/2070562.2070579
[10] E. Aryafar, M. A. Khojastepour, K. Sundaresan, S. Rangarajan, andM. Chiang, “Midu: enabling mimo full duplex,” in Proceedings ofthe 18th annual international conference on Mobile computing andnetworking, ser. Mobicom ’12. New York, NY, USA: ACM, 2012,pp. 257–268. [Online]. Available: http://doi.acm.org/10.1145/2348543.2348576
[11] M. Duarte, A. Sabharwal, V. Aggarwal, R. Jana, K. Ramakrishnan,C. Rice, and N. Shankaranayanan, “Design and characterization ofa full-duplex multi-antenna system for wifi networks,” submitted toIEEE Transactions on Vehicular Technology, October 2012. [Online].Available: http://warp.rice.edu/trac/wiki/DesignFDWiFi
[12] M. Duarte, “Full-duplex wireless: Design, implementation andcharacterization,” Ph.D. dissertation, Rice University, April 2012.[Online]. Available: http://warp.rice.edu/trac/wiki/DuartePhDThesis
[13] A. Sahai, G. Patel, C. Dick, and A. Sabharwal, “On the impact ofphase noise on active cancelation in wireless full-duplex,” VehicularTechnology, IEEE Transactions on, vol. 62, no. 9, pp. 4494–4510, 2013.
[14] B. Day, A. Margetts, D. Bliss, and P. Schniter, “Full-duplex MIMOrelaying: Achievable rates under limited dynamic range,” Selected Areasin Communications, IEEE Journal on, vol. 30, no. 8, pp. 1541 –1553,september 2012.
[15] ——, “Full-duplex bidirectional MIMO: Achievable rates under limiteddynamic range,” Signal Processing, IEEE Transactions on, vol. 60, no. 7,pp. 3702 –3713, july 2012.
[16] WARPLab framework. [Online]. Available: http://warp.rice.edu/trac/wiki/WARPLab
[17] W. Slingsby and J. McGeehan, “Antenna isolation measurements for on-frequency radio repeaters,” in Antennas and Propagation, 1995., NinthInternational Conference on (Conf. Publ. No. 407), apr 1995, pp. 239–243 vol.1.
[18] C. Anderson, S. Krishnamoorthy, C. Ranson, T. Lemon, W. Newhall,T. Kummetz, and J. Reed, “Antenna isolation, wideband multipathpropagation measurements, and interference mitigation for on-frequencyrepeaters,” in SoutheastCon, 2004. Proceedings. IEEE, mar 2004, pp.110 – 114.
[19] K. Haneda, E. Kahra, S. Wyne, C. Icheln, and P. Vainikainen, “Mea-surement of loop-back interference channels for outdoor-to-indoor full-duplex radio relays,” in Antennas and Propagation (EuCAP), 2010Proceedings of the Fourth European Conference on, April 2010, pp.1 –5.
[20] L-Com. 2.4 GHz 90 degree dual-polarized antenna. [Online]. Available:http://www.l-com.com/item.aspx?id=22078
[21] ——. HGV-2406 2.4 GHz 6 dBi omnidirectionalantenna. [Online]. Available: http://www.l-com.com/wireless-antenna-24-ghz-6-dbi-omnidirectional-antenna-n-female-connector
[22] Emmerson and Cuming Microwave. Eccosorb free-space absorber.[Online]. Available: http://www.eccosorb.com/products-eccosorb-an.htm
[23] A. Technologies. (June, 2013) E8364B network analyzer data sheet. [On-line]. Available: http://www.home.agilent.com/en/pd-72337-pn-E8364B
[24] A. Goldsmith, Wireless Communications. Cambridge University Press,2005.
[25] W. Lee, Mobile Cellular Telecommunication. McGraw Hill, 1989.[26] D. N. C. Tse and P. Viswanath, Fundamentals of Wireless Communica-
tion. Cambridge University Press, 2005.[27] T. M. Cover and J. A. Thomas, Elements of Information Theory. John
Wiley and Sons Inc., 2006.[28] A. Sahai, G. Patel, and A. Sabharwal, “Pushing the limits of full-duplex:
Design and real-time implementation,” CoRR, vol. abs/1107.0607, 2011.

16
[29] H. Arslan and H. Mahmoud, “Error vector magnitude to SNR conversionfor nondata-aided receivers,” Wireless Communications, IEEE Transac-tions on, vol. 8, no. 5, pp. 2694 –2704, May 2009.
[30] E. Aryafar, N. Anand, T. Salonidis, and E. W. Knightly, “Designand experimental evaluation of multi-user beamforming in wirelesslans,” in Proceedings of the sixteenth annual international conferenceon Mobile computing and networking, ser. MobiCom ’10. NewYork, NY, USA: ACM, 2010, pp. 197–208. [Online]. Available:http://doi.acm.org/10.1145/1859995.1860019
[31] M. Duarte, A. Sabharwal, C. Dick, and R. Rao, “Beamforming inMISO systems: Empirical results and EVM-based analysis,” WirelessCommunications, IEEE Transactions on, vol. 9, no. 10, pp. 3214 –3225,october 2010.
[32] T. S. Rappaport, Wireless Communications: principles and practice.Prentice Hall, 1996.
[33] N. Singh, D. Gunawardena, A. Proutiere, B. Radunovic, H. Balan,and P. Key, “Efficient and fair mac for wireless networks with self-interference cancellation,” in Modeling and Optimization in Mobile, AdHoc and Wireless Networks (WiOpt), 2011 International Symposium on,2011, pp. 94–101.
[34] J. Bai and A. Sabharwal, “Decode-and-cancel for interference for can-cellation in full-duplex networks,” in Asilomar Conference on Signals,Systems and Computers, 2012.
[35] R. Ramanathan, J. Redi, C. Santivanez, D. Wiggins, and S. Polit, “Adhoc networking with directional antennas: a complete system solution,”Selected Areas in Communications, IEEE Journal on, vol. 23, no. 3, pp.496 – 506, march 2005.
[36] Y.-B. Ko, V. Shankarkumar, and N. Vaidya, “Medium access controlprotocols using directional antennas in ad hoc networks,” in INFOCOM2000. Nineteenth Annual Joint Conference of the IEEE Computer andCommunications Societies. Proceedings. IEEE, vol. 1, 2000, pp. 13–21vol.1.
[37] R. R. Choudhury, X. Yang, R. Ramanathan, and N. H. Vaidya,“Using directional antennas for medium access control in ad hocnetworks,” in Proceedings of the 8th annual international conferenceon Mobile computing and networking, ser. MobiCom ’02. NewYork, NY, USA: ACM, 2002, pp. 59–70. [Online]. Available:http://doi.acm.org/10.1145/570645.570653
[38] Xirrus Inc., “Sectored Wi-Fi benefits,” Xirrus Inc., Tech. Rep., Novem-ber 2007.
[39] ——. XN and XR series wireless arrays. [Online]. Available:http://www.xirrus.com/Products/Wireless-Arrays.aspx
[40] C. Perez-Vega and J. L. G. Garcia, “A simple approach to a statis-tical path loss model for indoor communications,” in 27th EuropeanMicrowave Conference, vol. 1, sept. 1997, pp. 617 –623.
[41] Y. Liu, Y. Yuan, and K. Contractor, “A method to achieve a dual-polarized planar inverted f antenna (pifa),” in Mobile Technology,Applications and Systems, 2005 2nd International Conference on, nov.2005, pp. 1 –5.
[42] A. Amiri Sani, L. Zhong, and A. Sabharwal, “Directional antenna diver-sity for mobile devices: characterizations and solutions,” in MobiCom2010. New York, NY, USA: ACM, 2010, pp. 221–232.
[43] D. M. Pozar, Microwave and RF Design of Wireless System. JohnWiley and Sons Inc., 2000.
[44] Agilent N4691B calibration kit. [Online]. Available: http://www.home.agilent.com/en/pd-491095-pn-N4691B
[45] Agilent. (June, 2013) Network analyzer uncertainty calculator. [Online].Available: http://www.home.agilent.com/agilent/software.jspx?cc=US&lc=eng&ckey=1000000418:epsg:sud&nid=-536902639.350794.02&id=1000000418:epsg:sud&cmpid=93648
Evan Everett (S’06) received the B.Eng degree inWireless Engineering and the B.S degree in Physicsfrom Auburn University in 2010. He received theM.S. degree in Electrical Engineering from RiceUniversity in 2012, where he is currently pursuinga Ph.D. His research focus is theory and design forfull-duplex wireless communication. He received the2010 Comer Award for Excellence in Physical Sci-ence from Auburn University, and he is a NationalScience Foundation Graduate Research Fellow.
Achaleshwar Sahai received a Dual Degree (B.Techand M.Tech) in Electrical Engineering from theIndian Institute of Technology Madras, Chennai in2008. Currently he is pursuing a Ph.D. in Electricaland Computer Engineering at Rice University, Hous-ton, TX. His research interests include informationtheory and design of wireless communication sys-tems.
Ashutosh Sabharwal (S’91-M’99-SM’04) receivedthe B. Tech. degree from the Indian Institute ofTechnology, New Delhi, India, in 1993 and the M.S.and Ph.D. degrees from The Ohio State University,Columbus, in 1995 and 1999, respectively. He is cur-rently a Professor with the Department of Electricaland Computer Engineering, Rice University, Hous-ton, TX. His research interests include informationtheory, communication algorithms and experiment-driven design of wireless networks. He received the1998 Presidential Dissertation Fellowship Award.


![An Inter-Node Interference Suppression Approach in …arXiv:1610.03667v3 [cs.IT] 23 May 2017 1 An Inter-Node Interference Suppression Approach in Full-Duplex Wireless Communications](https://img.dokumen.tips/doc/110x75/5e7cd1e41829b61c4e20c965/an-inter-node-interference-suppression-approach-in-arxiv161003667v3-csit-23.jpg)