Embed Size (px)
Citation preview
PartnerRe Ltd. Reports Second Quarter and Half Year 2021 Results
▪ Net income available to common shareholders of $314 million for the second quarter and $248million for the half year
▪ Operating income of $151 million for the second quarter and $192 million for the half year,which provided an operating income return on equity of 8.8% and 5.6%, respectively
▪ Net premiums written were up 29% at $1,794 million for the quarter, with growth in lines ofbusiness that experienced strong rate increases, compared to the prior year premiums whichwere impacted by the COVID-19 economic downturn
▪ Non-life underwriting result of $150 million or 32.7 points of improvement on the combinedratio of 88.6% year-over-year, and Life and Health underwriting profit, including allocated netinvestment income, of $23 million for the second quarter
▪ In Q2 2021, the Company fully redeemed the Series G, H and I Preferred Shares at aredemption value of $637 million and finalized the refinancing of our balance sheet with a run-rate saving of $18 million per annum
PEMBROKE, Bermuda, July 26, 2021 - PartnerRe Ltd. ("the Company") today reported net income available to common shareholder of $314 million for the second quarter of 2021, compared to income of $229 million for the same period of 2020. Net income available to common shareholder was $248 million for the half year 2021, compared to a loss of $204 million for the same period of 2020.
Operating income was $151 million for the second quarter of 2021, compared to an operating loss of $256 million for the same period of 2020. Operating income for the half year 2021 was $192 million compared to an operating loss of $226 million for the same period of 2020. Operating income for the second quarter and half year 2021 improved over the same periods of 2020 as a result of improvements in current accident year attritional loss ratios and lower levels of adverse prior year development, and also the effects that COVID-19 reserves had on the second quarter of 2020.
Operating income (loss) is a non-GAAP financial measure defined by the Company as net income or loss available to common shareholder and excludes after-tax net realized and unrealized investment gains and losses, foreign exchange gains and losses, interest in results of equity method investments, and loss on redemption of preferred shares. The Company calculates annualized operating ROE using Operating income (loss) for the period divided by the average common shareholder's equity outstanding for the period. See "Non-GAAP Financial Measures - Regulation G" for a reconciliation of non-GAAP measures.
News Release
PartnerRe Ltd.Wellesley House, 5th Floor90 Pitts Bay RoadPembroke, Bermuda HM 08
Telephone +1 441 292 0888Fax +1 441 292 6080www.partnerre.com
1

PartnerRe President and Chief Executive Officer Jacques Bonneau commented, “We delivered strong results in the second quarter with an annualized operating ROE of 8.8%, and I am pleased to see the positive impacts of our portfolio actions begin to show through our financial result. Our Non-life combined ratio of 88.6% includes improvements in the current accident year loss ratio from business mix changes and overall favorable pricing conditions across most lines of business, as well as improvements in prior years' reserve development as older underwriting years run off. Our Life and Health segment also significantly improved its underwriting profit compared to the prior year. Third party capital currently stands at $1.1b of assets under management and provided us the ability to increase underwriting capacity and line sizes. These underwriting results, combined with good investment performance, helped produce solid profitability for the second quarter of 2021.”
Highlights for the second quarter and half year 2021 compared to the same periods of 2020 are included below.
Non-Life:
▪ Non-life net premiums written were up 37% for the second quarter of 2021 and were up 20% for the half year 2021 compared to the same periods of 2020. The increase in the second quarter of 2021 was driven by a 47% increase in the P&C segment. The current year included favorable premium adjustments from prior underwriting years, compared to the prior year which included adverse premium exposure adjustments related to the economic downturn.
▪ The Non-life underwriting profit was $150 million (combined ratio of 88.6%) for the second quarter of 2021 and $190 million (combined ratio of 92.4%) for the half year 2021. This compares to a Non-life underwriting loss of $260 million (combined ratio of 121.3%) and $306 million (combined ratio of 112.6%) for the second quarter and half year 2020, respectively.
▪ There were no significant changes to the Company's total Non-life net loss estimate of $371 million established for the COVID-19 pandemic in 2020. For the second quarter and half year 2021, the Company's P&C segment incurred an increase in COVID-19 related losses, related primarily to refinements of estimates for business interruption exposures as more information has been received from cedants. This was offset by a decrease in estimated losses for Specialty financial risk lines for credit related exposures.
▪ The P&C segment reported a combined ratio of 93.5% and 95.5% for the second quarter and half year 2021, respectively, compared to 113.5% and 103.5% for the second quarter and half year 2020, respectively. The half year 2021 included catastrophic losses of $92 million (5.6 points) for Winter Storm Uri, net of retrocession and reinstatement premiums. The prior year included COVID-19 related losses, net of retrocession and reinstatement premiums, of $159 million for the second quarter and half year 2020 (22.0 points and 10.7 points, respectively). Excluding the impacts of COVID-19 and large catastrophic losses, there was an improvement in the current
News Release
PartnerRe Ltd.Wellesley House, 5th Floor90 Pitts Bay RoadPembroke, Bermuda HM 08
Telephone +1 441 292 0888Fax +1 441 292 6080www.partnerre.com
2

accident year loss ratio and prior year development for the second quarter and half year 2021, compared to the same periods of 2020. The improvement in the current accident year loss ratio was driven primarily by business mix changes and rate improvements.
▪ The Specialty segment reported a combined ratio of 79.5% and 86.9% for the second quarter and half year 2021, respectively, compared to 132.8% and 127.5% for the second quarter and half year 2020, respectively. The half year 2021 included catastrophic losses of $28 million (3.2 points) for Winter Storm Uri, net of retrocession and reinstatement premiums. The prior year included COVID-19 related losses, net of retrocession and reinstatement premiums, of $146 million (29.8 points) and $164 million (17.9 points) for the second quarter and half year 2020, respectively. Excluding the impacts of COVID-19, the improvement in the combined ratio was driven by changes in prior years' reserve development, favorable business mix changes and rate improvements. Prior years' reserve development contributed to a decrease of 17.1 points and 15.2 points on the combined ratio compared to the second quarter and half year 2020, respectively.
Life and Health:
▪ Net premiums written were up 8% for the second quarter and up 10% for the half year 2021, compared to the same periods of 2020, reflecting growth in long-term life business.
▪ The underwriting result, including allocated net investment income, was a profit of $23 million and $43 million in the second quarter and half year 2021, respectively, compared to a profit of $5 million and $23 million in the second quarter and half year 2020, respectively. This included COVID-19 losses on protection products of $14 million and $26 million for the second quarter and half year 2021, respectively, compared to $15 million for the second quarter and half year 2020. The allocated underwriting result for the quarter and half year reflected improvements in short-term business and positive results in longevity business compared to the same periods of 2020. The half year 2021 result also benefited from improvements in the guaranteed minimum death benefits (GMDB) line of business performance as a result of equity market increases in 2021, partially offset by a higher level of COVID-19 losses on protection products and the impact of a lower level of gains related to recaptures of business compared to half year 2020.
Investments:
▪ Net investment return in the second quarter of 2021 was $321 million, or 1.6% and included net investment income of $95 million, net realized and unrealized investment gains of $216 million, and interest in earnings of equity method investments of $10 million. This compares to a net investment return of $627 million, or 3.5%, for the second quarter of 2020, which included net investment income of $72 million, net realized and unrealized investment gains of $549 million after recovering the unrealized loss of $610 million in the first quarter of 2020 and interest in earnings of equity method investments of $6 million.
News Release
PartnerRe Ltd.Wellesley House, 5th Floor90 Pitts Bay RoadPembroke, Bermuda HM 08
Telephone +1 441 292 0888Fax +1 441 292 6080www.partnerre.com
3
▪ Net investment return for the half year 2021 was $302 million, or 1.5%, which included net investment income of $182 million, net realized and unrealized investment gains of $80 million, and interest in earnings of equity method investments of $40 million. This compares to a net investment return of $124 million, or 0.7%, for the half year 2020 which included net investment income of $175 million and interest in earnings of equity method investments of $2 million, partially offset by net realized and unrealized investment losses of $53 million.
▪ Net investment income of $95 million was up $23 million, or 31%, for the second quarter of 2021 compared to the same period of 2020, primarily due to the impact of higher reinvestment rates, driven by the significant widening in worldwide risk-free rates and the impact of portfolio re-allocations to U.S. bank loans, U.S. investment grade credit and Asia high yield credit. Net investment income of $182 million was up $7 million, or 4%, for the half year 2021 compared to the same period of 2020, primarily due to the reasons discussed for the quarter; partially offset by the significant decrease in reinvestment rates experienced in Q1 2020 and the decision in Q1 2020 to sell higher yielding U.S. bank loan investments.
▪ Net realized and unrealized investment gains of $216 million for the second quarter of 2021 (2020: $549 million gain) included:
◦ Net realized and unrealized investment gains of $84 million (2020: $238 million gain) on fixed maturities and short-term investments, which were primarily unrealized, were driven by the narrowing of U.S. and Canadian risk-free rates.
◦ Net realized and unrealized investment gains on equities of $76 million (2020: $225 million gain), which were primarily unrealized, were driven by increases in worldwide equity markets that benefited public equity funds.
◦ Net realized and unrealized investment gains of $57 million (2020: $86 million gain) on other invested assets, which were primarily unrealized, were driven by investment gains on private equity investments.
▪ Net realized and unrealized investment gains of $80 million for the half year 2021 (2020: $53 million loss) included:
◦ Net realized and unrealized investment losses of $255 million (2020: $211 million gain) on fixed maturities and short-term investments, which were primarily unrealized, were driven by a significant increase in worldwide risk-free rates.
◦ Net realized and unrealized investment gains on equities of $228 million (2020: $137 million loss), which were also primarily unrealized, were driven by increases in worldwide equity markets that benefited public equity funds.
◦ Net realized and unrealized investment gains of $107 million (2020: $127 million loss) on other invested assets were driven by realized and unrealized investment gains on private equity investments.
News Release
PartnerRe Ltd.Wellesley House, 5th Floor90 Pitts Bay RoadPembroke, Bermuda HM 08
Telephone +1 441 292 0888Fax +1 441 292 6080www.partnerre.com
4
▪ Interest in earnings of equity method investments of $10 million and $40 million in the second quarter and half year 2021, respectively, primarily reflects realized and unrealized gains on UK and New York real estate funds. This compared to interest in earnings of equity method investments of $6 million and $2 million in the second quarter and half year 2020, respectively.
▪ As of June 30, 2021, reinvestment rates were 2.2% compared to the Company's fixed income investment portfolio yield of 2.5% for the second quarter of 2021.
Other Income Statement Items:
▪ Other expense ratio of 5.4% and 5.5% for the second quarter and half year 2021, respectively, were comparable to the same periods of 2020, which had expense ratios of 5.2% and 5.4%, respectively.
▪ Net foreign exchange losses were $30 million for the second quarter of 2021 and $35 million for the second quarter of 2020, driven by the depreciation of the U.S. dollar against certain major currencies (primarily the Canadian dollar) and the cost of hedging. Net foreign exchange losses of $59 million for the half year 2021 were driven primarily by U.S. dollar depreciation against the Canadian dollar and appreciation against the Euro, and the cost of hedging, while net foreign exchange gains were $95 million for the second half of 2020, driven by the appreciation of the U.S. dollar against the British pound and Canadian dollar, partially offset by the cost of hedging.
▪ Interest expense was $14 million and $28 million for the second quarter and half year 2021, respectively, compared to $8 million and $16 million for the same periods of 2020. The increase was driven by the issuance of $500 million 4.50% Fixed-Rate Reset Junior Subordinated Notes due 2050 during the third quarter of 2020.
▪ Preferred dividends of $7 million and $18 million for the second quarter and half year 2021, respectively, compared to $12 million and $23 million for the same periods of 2020. In May 2021, the Company fully redeemed its Series G, H and I preferred shares for a liquidation value of $637 million. The Company also incurred a loss on redemption of $21 million, related to the preferred share issuance costs that were included in Additional paid-in-capital at issuance, and upon redemption were expensed, with no net impact to Common shareholder's equity.
▪ Income tax expense was $38 million on pre-tax income of $380 million in the second quarter of 2021 compared to an expense of $17 million on pre-tax income of $257 million for the same period of 2020. Income tax expense was $23 million on pre-tax income of $310 million for the half year 2021 compared to a benefit of $28 million on pre-tax losses of $209 million for the same period of 2020.
News Release
PartnerRe Ltd.Wellesley House, 5th Floor90 Pitts Bay RoadPembroke, Bermuda HM 08
Telephone +1 441 292 0888Fax +1 441 292 6080www.partnerre.com
5
Balance Sheet, Capitalization and Cash Flows:
▪ Total investments and cash and cash equivalents were $19.9 billion at June 30, 2021, down 1.1% compared to December 31, 2020. The decrease was primarily driven by the redemption of Series G, H and I Preferred Shares at an aggregate liquidation value of $637 million and premium paid for a loss portfolio transfer and adverse development cover described below. This was partially offset by the issuance of 8 million 4.875% Fixed Rate Non-Cumulative Redeemable Perpetual Preferred Shares (the Series J Preferred Shares) at a liquidation value per share of $25 for total gross proceeds of $200 million, a $302 million net investment return for the first six months of 2021 and other operating cash flows.
▪ Cash provided by operating activities was $62 million and $431 million for the second quarter and half year 2021, respectively, compared to $242 million and $479 million for the second quarter and half year 2020, respectively. The decreases were driven by cash flows from underwriting operations, including the impact of premium paid for the loss portfolio transfer and adverse development cover agreement entered into during the second quarter of 2021 related to prior underwriting years on the Company's U.S. casualty and auto business. This resulted in a cash transfer for the premium at inception of the agreement, and a related increase in Reinsurance recoverables of $321 million as at June 30, 2021.
▪ Cash and cash equivalents, fixed maturities, and short-term investments, which are government issued or investment grade fixed income securities, were $14.1 billion at June 30, 2021, representing 71% of the total investments and cash and cash equivalents.
▪ The average credit rating of the fixed income portfolio was AA as of June 30, 2021. The expected average duration of the public fixed income portfolio at June 30, 2021 was 3.9 years, while the average duration of the Company’s liabilities was 4.2 years.
▪ Common shareholder's equity (or book value) of $7.0 billion and tangible book value of $6.5 billion at June 30, 2021 increased by 4.9% and 5.4%, respectively, compared to December 31, 2020, due to the comprehensive income for the half year 2021, partially offset by preferred dividends and issuance costs incurred for the Series J preferred shares in the first half of 2021.
▪ Total capital was $9.2 billion at June 30, 2021, down 1.4% compared to December 31, 2020, primarily due to the redemption of Series G, H and I preferred shares and a decrease in the U.S dollar value of the Company's Euro denominated debt, as the U.S dollar strengthened against the Euro during the first six months of 2021. This was partially offset by issuance of the Series J Preferred Shares and the increase in common shareholder's equity.
News Release
PartnerRe Ltd.Wellesley House, 5th Floor90 Pitts Bay RoadPembroke, Bermuda HM 08
Telephone +1 441 292 0888Fax +1 441 292 6080www.partnerre.com
6
PartnerRe Ltd. is a leading global reinsurer that helps insurance companies reduce their earnings volatility, strengthen their capital and grow their businesses through reinsurance solutions. Risks are underwritten on a worldwide basis through the Company’s three segments: P&C, Specialty, and Life and Health. For the year ended December 31, 2020, total revenues were $7.4 billion. At June 30, 2021, total assets were $28.3 billion, total capital was $9.2 billion and total shareholders’ equity was $7.2 billion. PartnerRe maintains strong financial strength ratings as follows: A.M. Best A+ / Moody’s A1 / Standard & Poor’s A+.
PartnerRe on the Internet: www.partnerre.com
Please refer to the "Financial Information - Annual Reports" section of the Company's website for a copy of the Company's Annual Report on Form 20-F at: www.partnerre.com/financial-information/annual-reports/
Forward-looking statements contained in this press release, such as those related to company performance, including the impact of the ongoing COVID-19 pandemic (including the related impact on the U.S. and global economies), are based on the Company’s assumptions and expectations concerning future events and financial performance and are made pursuant to the safe harbor provisions of the Private Securities Litigation Reform Act of 1995. Such statements are subject to significant business, economic and competitive risks and uncertainties that could cause actual results to differ materially from those reflected in the forward-looking statements. PartnerRe’s forward-looking statements could be affected by numerous foreseeable and unforeseeable events and developments such as exposure to catastrophe, pandemic or other large property and casualty losses, credit, interest, currency and other risks associated with the Company’s investment portfolio, adequacy of reserves, levels and pricing of new and renewal business achieved, changes in accounting policies, risks associated with implementing business strategies, and other factors identified in the Company’s reports filed or furnished with the Securities and Exchange Commission. In light of the significant uncertainties inherent in the forward-looking information contained herein, readers are cautioned not to place undue reliance on these forward-looking statements, which speak only as of the dates on which they are made. The Company disclaims any obligation to publicly update or revise any forward-looking information or statements.
The Company’s estimate for COVID-19 pandemic losses and recent catastrophic events, is based on a preliminary analysis of the Company’s exposures, the current assumption of total insured industry losses and preliminary information received from certain cedants to date. There is material uncertainty associated with the Company's loss estimates given the nature, magnitude and recency of these loss events and the limited claims information received to date. The ultimate loss therefore may differ materially from the current preliminary estimate.
Contacts: PartnerRe Ltd.(441) 292-0888Investor Contact: Ryan LipschutzMedia Contact: Celia Powell
News Release
PartnerRe Ltd.Wellesley House, 5th Floor90 Pitts Bay RoadPembroke, Bermuda HM 08
Telephone +1 441 292 0888Fax +1 441 292 6080www.partnerre.com
7
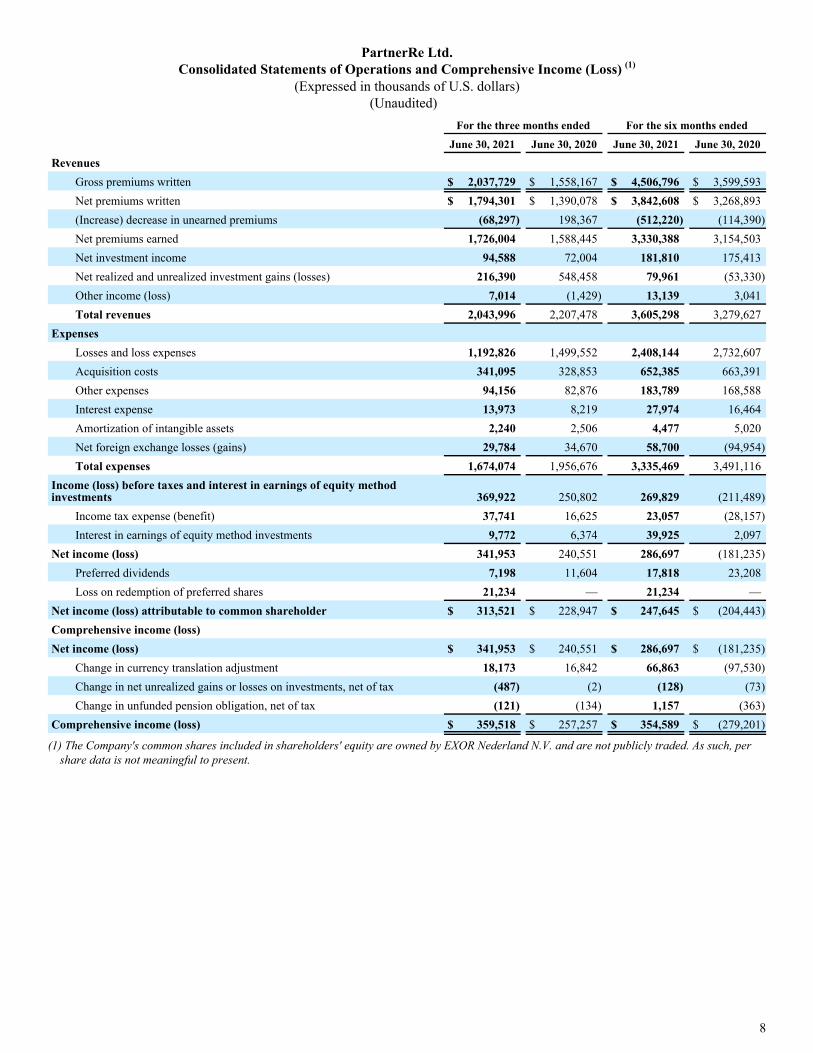
PartnerRe Ltd. Consolidated Statements of Operations and Comprehensive Income (Loss) (1)
(Expressed in thousands of U.S. dollars) (Unaudited)
For the three months ended For the six months ended
June 30, 2021 June 30, 2020 June 30, 2021 June 30, 2020
RevenuesGross premiums written $ 2,037,729 $ 1,558,167 $ 4,506,796 $ 3,599,593 Net premiums written $ 1,794,301 $ 1,390,078 $ 3,842,608 $ 3,268,893 (Increase) decrease in unearned premiums (68,297) 198,367 (512,220) (114,390) Net premiums earned 1,726,004 1,588,445 3,330,388 3,154,503 Net investment income 94,588 72,004 181,810 175,413 Net realized and unrealized investment gains (losses) 216,390 548,458 79,961 (53,330) Other income (loss) 7,014 (1,429) 13,139 3,041 Total revenues 2,043,996 2,207,478 3,605,298 3,279,627
ExpensesLosses and loss expenses 1,192,826 1,499,552 2,408,144 2,732,607 Acquisition costs 341,095 328,853 652,385 663,391 Other expenses 94,156 82,876 183,789 168,588 Interest expense 13,973 8,219 27,974 16,464 Amortization of intangible assets 2,240 2,506 4,477 5,020 Net foreign exchange losses (gains) 29,784 34,670 58,700 (94,954) Total expenses 1,674,074 1,956,676 3,335,469 3,491,116
Income (loss) before taxes and interest in earnings of equity method investments 369,922 250,802 269,829 (211,489)
Income tax expense (benefit) 37,741 16,625 23,057 (28,157) Interest in earnings of equity method investments 9,772 6,374 39,925 2,097
Net income (loss) 341,953 240,551 286,697 (181,235) Preferred dividends 7,198 11,604 17,818 23,208 Loss on redemption of preferred shares 21,234 — 21,234 —
Net income (loss) attributable to common shareholder $ 313,521 $ 228,947 $ 247,645 $ (204,443) Comprehensive income (loss)Net income (loss) $ 341,953 $ 240,551 $ 286,697 $ (181,235)
Change in currency translation adjustment 18,173 16,842 66,863 (97,530) Change in net unrealized gains or losses on investments, net of tax (487) (2) (128) (73) Change in unfunded pension obligation, net of tax (121) (134) 1,157 (363)
Comprehensive income (loss) $ 359,518 $ 257,257 $ 354,589 $ (279,201)
(1) The Company's common shares included in shareholders' equity are owned by EXOR Nederland N.V. and are not publicly traded. As such, per share data is not meaningful to present.
8

PartnerRe Ltd.Consolidated Balance Sheets
(Expressed in thousands of U.S. dollars, except parenthetical share data)(Unaudited)
June 30, 2021 December 31, 2020
AssetsInvestments:Fixed maturities, at fair value $ 13,663,347 $ 12,786,380 Short-term investments, at fair value 167,593 416,350 Equities, at fair value 1,805,718 1,496,441 Investments in real estate 69,341 67,980 Other invested assets 3,229,156 2,967,738 Total investments 18,935,155 17,734,889 Cash and cash equivalents 923,268 2,350,833 Accrued investment income 103,164 92,058 Reinsurance balances receivable 3,832,301 3,118,870 Reinsurance recoverable on paid and unpaid losses 1,209,844 901,063 Prepaid reinsurance premiums 437,397 115,986 Funds held by reinsured companies 599,982 704,768 Deferred acquisition costs 907,856 819,971 Deposit assets 123,749 139,818 Net tax assets 143,215 182,077 Goodwill 456,380 456,380 Intangible assets 103,292 107,669 Other assets (1) 483,016 174,193
Total assets $ 28,258,619 $ 26,898,575 Liabilities
Non-life reserves $ 11,651,070 $ 11,395,321 Life and health reserves 2,736,043 2,704,229 Unearned premiums 3,084,903 2,265,214 Other reinsurance balances payable 764,548 482,468 Debt 1,947,467 1,974,731 Deposit liabilities 5,598 5,925 Net tax liabilities 104,319 131,621 Accounts payable, accrued expenses and other (2) 744,257 612,069
Total liabilities 21,038,205 19,571,578 Shareholders’ Equity
Common shares (par value $0.00000001; issued and outstanding: 100,000,000 shares) — — Preferred shares (par value $1.00; issued and outstanding: 2021, 8,000,000 shares; 2020, 25,489,636 shares; aggregate liquidation value: 2021, $200,000; 2020, $637,241) 8,000 25,490 Additional paid-in capital 1,929,934 2,334,564 Accumulated other comprehensive loss (28,113) (96,005) Retained earnings 5,310,593 5,062,948
Total shareholders’ equity 7,220,414 7,326,997 Total liabilities and shareholders’ equity $ 28,258,619 $ 26,898,575
(1) Includes receivables for securities sold of $315 million as at June 30, 2021 compared to $24 million as at December 31, 2020.
(2) Includes payables for securities purchased of $420 million as at June 30, 2021 compared to $286 million as at December 31, 2020.
9

PartnerRe Ltd.Condensed Consolidated Statements of Cash Flows
(Expressed in thousands of U.S. dollars)(Unaudited)
For the three months ended For the six months ended
June 30, 2021 June 30, 2020 June 30, 2021 June 30, 2020
Net cash provided by operating activities $ 62,217 $ 242,436 $ 431,365 $ 479,436 Net cash used in investing activities (441,977) (672,562) (1,387,543) (501,588) Net cash used in financing activities (644,439) (61,604) (461,753) (72,291) Effect of foreign exchange rate changes on cash 2,059 6,468 (9,634) 819 Decrease in cash and cash equivalents (1,022,140) (485,262) (1,427,565) (93,624) Cash and cash equivalents - beginning of period 1,945,408 1,876,101 2,350,833 1,484,463 Cash and cash equivalents - end of period $ 923,268 $ 1,390,839 $ 923,268 $ 1,390,839
10

PartnerRe Ltd.Segment Information
(Expressed in millions of U.S. dollars, except percentages)(Unaudited)
For the three months ended June 30, 2021
P&C
segment Specialty segment
TotalNon-life
Life and Health
segmentCorporateand Other Total
Gross premiums written $ 1,126 $ 502 $ 1,628 $ 410 $ — $ 2,038 Net premiums written $ 971 $ 421 $ 1,392 $ 402 $ — $ 1,794 (Increase) decrease in unearned premiums (108) 35 (73) 5 — (68) Net premiums earned $ 863 $ 456 $ 1,319 $ 407 $ — $ 1,726 Losses and loss expenses (573) (257) (830) (363) — (1,193) Acquisition costs (217) (97) (314) (27) — (341) Technical result $ 73 $ 102 $ 175 $ 17 $ — $ 192 Other income — — — 7 — 7 Other expenses (17) (8) (25) (21) (48) (94) Underwriting result $ 56 $ 94 $ 150 $ 3 n/a $ 105 Net investment income 20 75 95 Allocated underwriting result $ 23 n/a n/aNet realized and unrealized investment gains 216 216 Interest expense (14) (14) Amortization of intangible assets (2) (2) Net foreign exchange losses (30) (30) Income tax expense (38) (38) Interest in earnings of equity method investments 10 10 Net income n/a $ 342 Loss ratio (1) 66.4 % 56.4 % 62.9 %Acquisition ratio (2) 25.1 21.3 23.8 Technical ratio (3) 91.5 % 77.7 % 86.7 %Other expense ratio (4) 2.0 1.8 1.9 Combined ratio (5) 93.5 % 79.5 % 88.6 %
For the three months ended June 30, 2020
P&C
segmentSpecialty segment
TotalNon-life
Life and Health
segmentCorporateand Other Total
Gross premiums written $ 769 $ 413 $ 1,182 $ 376 $ — $ 1,558 Net premiums written $ 660 $ 359 $ 1,019 $ 371 $ — $ 1,390 Decrease in unearned premiums 64 131 195 3 — 198 Net premiums earned $ 724 $ 490 $ 1,214 $ 374 $ — $ 1,588 Losses and loss expenses (636) (511) (1,147) (353) — (1,500) Acquisition costs (172) (134) (306) (22) — (328) Technical result $ (84) $ (155) $ (239) $ (1) $ — $ (240) Other (loss) income (1) — (1) 5 (5) (1) Other expenses (14) (6) (20) (17) (46) (83) Underwriting result $ (99) $ (161) $ (260) $ (13) n/a $ (324) Net investment income 18 54 72 Allocated underwriting result $ 5 n/a n/aNet realized and unrealized investment gains 549 549 Interest expense (8) (8) Amortization of intangible assets (2) (2) Net foreign exchange losses (35) (35) Income tax expense (17) (17) Interest in earnings of equity method investments 6 6 Net income n/a $ 241 Loss ratio (1) 87.8 % 104.3 % 94.5 %Acquisition ratio (2) 23.8 27.3 25.2 Technical ratio (3) 111.6 % 131.6 % 119.7 %Other expense ratio (4) 1.9 1.2 1.6 Combined ratio (5) 113.5 % 132.8 % 121.3 %
(1) Loss ratio is obtained by dividing losses and loss expenses by net premiums earned. (2) Acquisition ratio is obtained by dividing acquisition costs by net premiums earned. (3) Technical ratio is defined as the sum of the loss ratio and the acquisition ratio. (4) Other expense ratio is obtained by dividing other expenses by net premiums earned. (5) Combined ratio is defined as the sum of the technical ratio and the other expense ratio.
11

PartnerRe Ltd. Segment Information
(Expressed in millions of U.S. dollars, except percentages)(Unaudited)
For the six months ended June 30, 2021
P&C
segmentSpecialty segment
TotalNon-life
Lifeand Health
segmentCorporateand Other Total
Gross premiums written $ 2,643 $ 1,033 $ 3,676 $ 831 $ — $ 4,507 Net premiums written $ 2,124 $ 901 $ 3,025 $ 818 $ — $ 3,843 Increase in unearned premiums (489) (20) (509) (4) — (513) Net premiums earned $ 1,635 $ 881 $ 2,516 $ 814 $ — $ 3,330 Losses and loss expenses (1,110) (578) (1,688) (720) — (2,408) Acquisition costs (417) (175) (592) (60) — (652) Technical result $ 108 $ 128 $ 236 $ 34 $ — $ 270 Other income — — — 13 — 13 Other expenses (34) (12) (46) (43) (95) (184) Underwriting result $ 74 $ 116 $ 190 $ 4 n/a $ 99 Net investment income 39 143 182 Allocated underwriting result $ 43 n/a n/aNet realized and unrealized investment gains 80 80 Interest expense (28) (28) Amortization of intangible assets (4) (4) Net foreign exchange losses (59) (59) Income tax expense (23) (23) Interest in earnings of equity method investments 40 40 Net income n/a $ 287 Loss ratio 67.9 % 65.6 % 67.1 %Acquisition ratio 25.5 19.9 23.5 Technical ratio 93.4 % 85.5 % 90.6 %Other expense ratio 2.1 1.4 1.8 Combined ratio 95.5 % 86.9 % 92.4 %
For the six months ended June 30, 2020
P&C
segmentSpecialty segment
TotalNon-life
Lifeand Health
segmentCorporateand Other Total
Gross premiums written $ 1,906 $ 936 $ 2,842 $ 758 $ — $ 3,600 Net premiums written $ 1,690 $ 835 $ 2,525 $ 744 $ — $ 3,269 (Increase) decrease in unearned premiums (201) 80 (121) 7 — (114) Net premiums earned $ 1,489 $ 915 $ 2,404 $ 751 $ — $ 3,155 Losses and loss expenses (1,147) (900) (2,047) (686) — (2,733) Acquisition costs (364) (254) (618) (45) — (663) Technical result $ (22) $ (239) $ (261) $ 20 $ — $ (241) Other (loss) income (1) — (1) 3 1 3 Other expenses (32) (12) (44) (34) (91) (169) Underwriting result $ (55) $ (251) $ (306) $ (11) n/a $ (407) Net investment income 34 141 175 Allocated underwriting result $ 23 n/a n/aNet realized and unrealized investment losses (53) (53) Interest expense (16) (16) Amortization of intangible assets (5) (5) Net foreign exchange gains 95 95 Income tax benefit 28 28 Interest in earnings of equity method investments 2 2 Net loss n/a $ (181) Loss ratio 77.0 % 98.4 % 85.1 %Acquisition ratio 24.4 27.8 25.7 Technical ratio 101.4 % 126.2 % 110.8 %Other expense ratio 2.1 1.3 1.8 Combined ratio 103.5 % 127.5 % 112.6 %
12
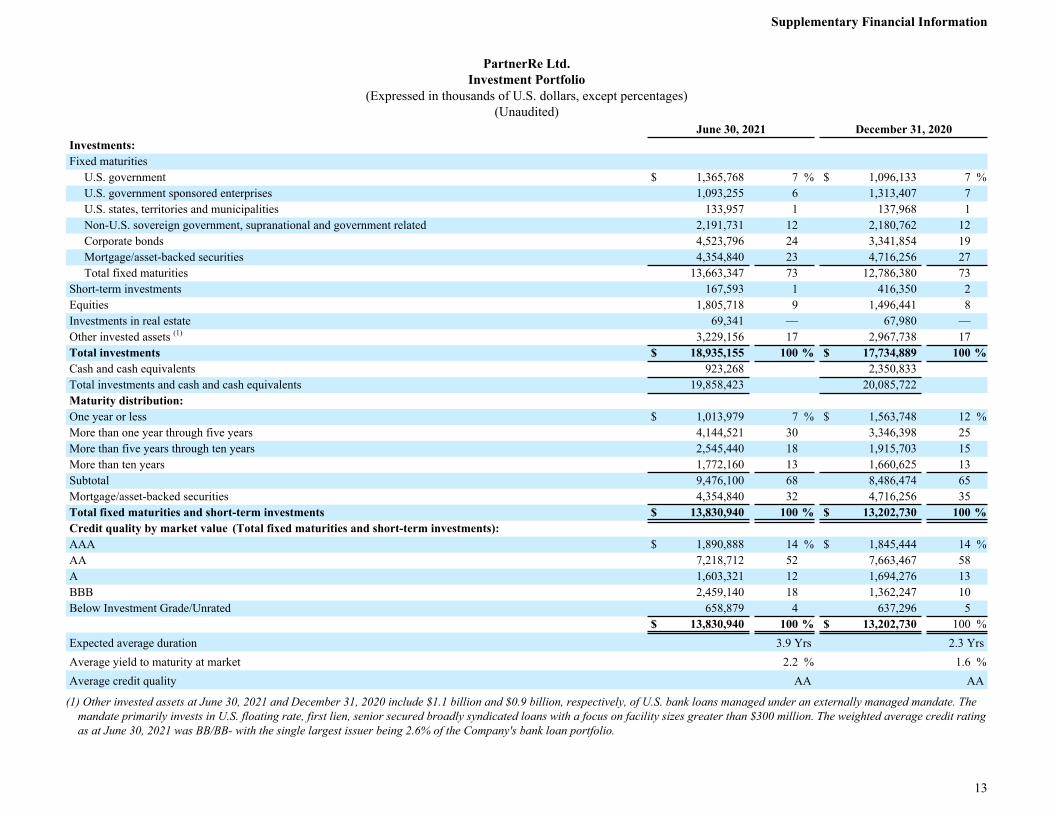
PartnerRe Ltd.Investment Portfolio
(Expressed in thousands of U.S. dollars, except percentages)(Unaudited)
June 30, 2021 December 31, 2020Investments:Fixed maturities
U.S. government $ 1,365,768 7 % $ 1,096,133 7 %U.S. government sponsored enterprises 1,093,255 6 1,313,407 7 U.S. states, territories and municipalities 133,957 1 137,968 1 Non-U.S. sovereign government, supranational and government related 2,191,731 12 2,180,762 12 Corporate bonds 4,523,796 24 3,341,854 19 Mortgage/asset-backed securities 4,354,840 23 4,716,256 27 Total fixed maturities 13,663,347 73 12,786,380 73
Short-term investments 167,593 1 416,350 2 Equities 1,805,718 9 1,496,441 8 Investments in real estate 69,341 — 67,980 — Other invested assets (1) 3,229,156 17 2,967,738 17 Total investments $ 18,935,155 100 % $ 17,734,889 100 %Cash and cash equivalents 923,268 2,350,833 Total investments and cash and cash equivalents 19,858,423 20,085,722 Maturity distribution:One year or less $ 1,013,979 7 % $ 1,563,748 12 %More than one year through five years 4,144,521 30 3,346,398 25 More than five years through ten years 2,545,440 18 1,915,703 15 More than ten years 1,772,160 13 1,660,625 13 Subtotal 9,476,100 68 8,486,474 65 Mortgage/asset-backed securities 4,354,840 32 4,716,256 35 Total fixed maturities and short-term investments $ 13,830,940 100 % $ 13,202,730 100 %Credit quality by market value (Total fixed maturities and short-term investments):AAA $ 1,890,888 14 % $ 1,845,444 14 %AA 7,218,712 52 7,663,467 58 A 1,603,321 12 1,694,276 13 BBB 2,459,140 18 1,362,247 10 Below Investment Grade/Unrated 658,879 4 637,296 5
$ 13,830,940 100 % $ 13,202,730 100 %Expected average duration 3.9 Yrs 2.3 YrsAverage yield to maturity at market 2.2 % 1.6 %Average credit quality AA AA
(1) Other invested assets at June 30, 2021 and December 31, 2020 include $1.1 billion and $0.9 billion, respectively, of U.S. bank loans managed under an externally managed mandate. The mandate primarily invests in U.S. floating rate, first lien, senior secured broadly syndicated loans with a focus on facility sizes greater than $300 million. The weighted average credit rating as at June 30, 2021 was BB/BB- with the single largest issuer being 2.6% of the Company's bank loan portfolio.
Supplementary Financial Information
13
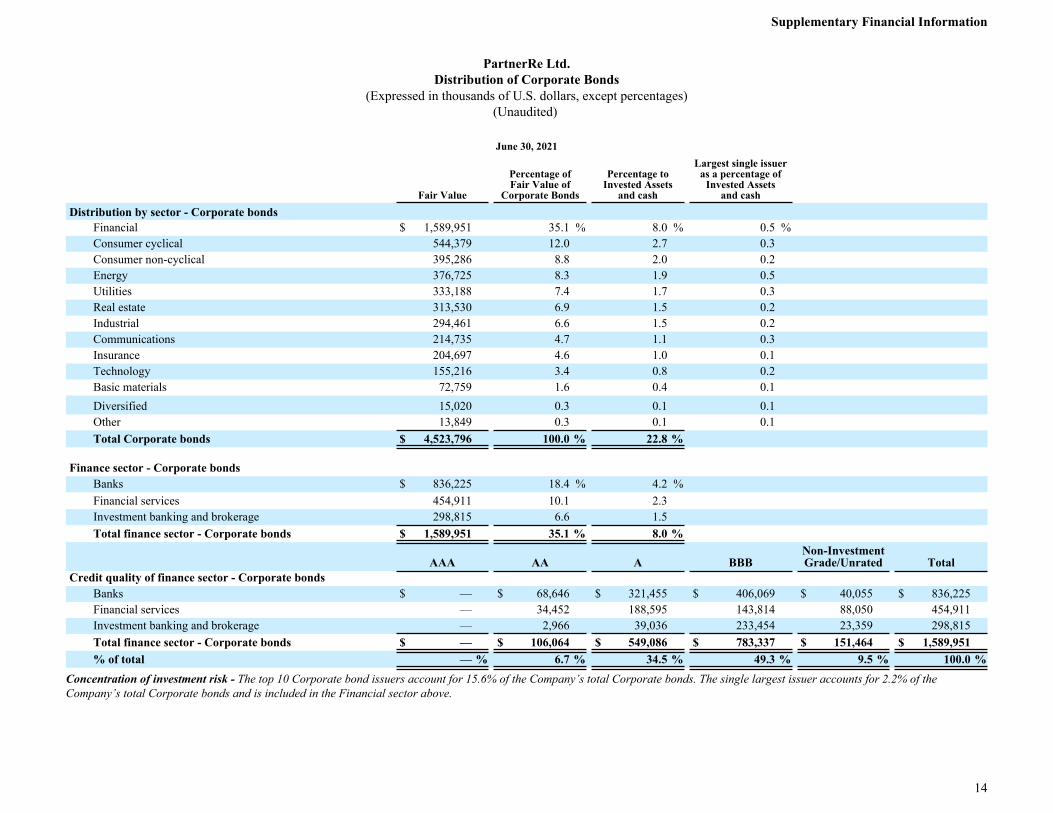
PartnerRe Ltd.Distribution of Corporate Bonds
(Expressed in thousands of U.S. dollars, except percentages)(Unaudited)
June 30, 2021
Fair Value
Percentage ofFair Value of
Corporate Bonds
Percentage toInvested Assets
and cash
Largest single issueras a percentage of
Invested Assetsand cash
Distribution by sector - Corporate bondsFinancial $ 1,589,951 35.1 % 8.0 % 0.5 %Consumer cyclical 544,379 12.0 2.7 0.3 Consumer non-cyclical 395,286 8.8 2.0 0.2 Energy 376,725 8.3 1.9 0.5 Utilities 333,188 7.4 1.7 0.3 Real estate 313,530 6.9 1.5 0.2 Industrial 294,461 6.6 1.5 0.2 Communications 214,735 4.7 1.1 0.3 Insurance 204,697 4.6 1.0 0.1 Technology 155,216 3.4 0.8 0.2 Basic materials 72,759 1.6 0.4 0.1 Diversified 15,020 0.3 0.1 0.1 Other 13,849 0.3 0.1 0.1 Total Corporate bonds $ 4,523,796 100.0 % 22.8 %
Finance sector - Corporate bondsBanks $ 836,225 18.4 % 4.2 %Financial services 454,911 10.1 2.3 Investment banking and brokerage 298,815 6.6 1.5 Total finance sector - Corporate bonds $ 1,589,951 35.1 % 8.0 %
AAA AA A BBBNon-InvestmentGrade/Unrated Total
Credit quality of finance sector - Corporate bondsBanks $ — $ 68,646 $ 321,455 $ 406,069 $ 40,055 $ 836,225 Financial services — 34,452 188,595 143,814 88,050 454,911 Investment banking and brokerage — 2,966 39,036 233,454 23,359 298,815 Total finance sector - Corporate bonds $ — $ 106,064 $ 549,086 $ 783,337 $ 151,464 $ 1,589,951 % of total — % 6.7 % 34.5 % 49.3 % 9.5 % 100.0 %
Concentration of investment risk - The top 10 Corporate bond issuers account for 15.6% of the Company’s total Corporate bonds. The single largest issuer accounts for 2.2% of the Company’s total Corporate bonds and is included in the Financial sector above.
Supplementary Financial Information
14

PartnerRe Ltd.Composition of Net Investment Income and Net Realized and Unrealized Investment Gains (Losses)
(Expressed in thousands of U.S. dollars, except percentages)(Unaudited)
For the three months ended For the six months ended
June 30, 2021 June 30, 2020 June 30, 2021 June 30, 2020Fixed maturities $ 78,167 $ 67,950 $ 149,646 $ 146,627 Short-term investments and cash and cash equivalents 2,006 1,646 2,811 8,003 Equities, investments in real estate, funds held and other 31,372 14,346 58,798 53,938 Investment expenses (16,957) (11,938) (29,445) (33,155) Net investment income $ 94,588 $ 72,004 $ 181,810 $ 175,413 Net realized investment gains (losses) on fixed maturities and short-term investments $ 10,538 $ (10,314) $ 15,401 $ 6,145 Net realized investment gains (losses) on equities 3,257 (2,264) 16,048 (3,702) Net realized investment gains (losses) on other invested assets 9,684 (27,380) 92,264 (33,905) Net realized investment gains (losses) $ 23,479 $ (39,958) $ 123,713 $ (31,462) Change in net unrealized investment gains (losses) on fixed maturities and short-term investments $ 73,242 $ 248,025 $ (270,293) $ 204,926 Change in net unrealized investment gains (losses) on equities 72,792 227,106 212,077 (133,474) Change in net unrealized investment gains (losses) on other invested assets 46,217 116,835 13,702 (91,446) Net other realized and unrealized investment gains (losses) 660 (3,550) 762 (1,874) Change in net unrealized investment gains (losses) $ 192,911 $ 588,416 $ (43,752) $ (21,868) Net realized and unrealized investment gains (losses) $ 216,390 $ 548,458 $ 79,961 $ (53,330)
Supplementary Financial Information
15

PartnerRe Ltd.Analysis of Non-Life Reserves
(Expressed in thousands of U.S. dollars)(Unaudited)
As at and for the three months ended As at and for the six months ended
June 30, 2021 June 30, 2020 June 30, 2021 June 30, 2020
Reconciliation of beginning and ending non-life reserves:Gross liability at beginning of period $ 11,507,329 $ 10,366,263 $ 11,395,321 $ 10,363,383 Reinsurance recoverable at beginning of period (841,404) (717,654) (782,330) (754,795) Net liability at beginning of period 10,665,925 9,648,609 10,612,991 9,608,588 Net incurred losses related to:
Current year 830,781 1,097,151 1,652,014 1,928,370 Prior years (645) 49,720 35,890 118,746
830,136 1,146,871 1,687,904 2,047,116 Net losses paid (683,883) (845,847) (1,381,968) (1,561,534) Retroactive reinsurance recoverable (1) (321,245) — (321,245) — Effects of foreign exchange rate changes and other 40,703 54,516 (66,046) (90,021) Net liability at end of period 10,531,636 10,004,149 10,531,636 10,004,149 Reinsurance recoverable at end of period 1,119,434 754,698 1,119,434 754,698 Gross liability at end of period $ 11,651,070 $ 10,758,847 $ 11,651,070 $ 10,758,847 Breakdown of gross liability at end of period:Case reserves $ 4,721,688 $ 4,427,454 $ 4,721,688 $ 4,427,454 Additional case reserves 128,287 138,656 128,287 138,656 Incurred but not reported reserves 6,801,095 6,192,737 6,801,095 6,192,737 Gross liability at end of period $ 11,651,070 $ 10,758,847 $ 11,651,070 $ 10,758,847 Gross liability at end of period by non-life segment:P&C 8,066,460 7,425,549 8,066,460 7,425,549 Specialty 3,584,610 3,333,298 3,584,610 3,333,298 Gross liability at end of period $ 11,651,070 $ 10,758,847 $ 11,651,070 $ 10,758,847 Unrecognized time value of non-life reserves (2) $ 253,954 $ 114,778 $ 253,954 $ 114,778
(1) In the second quarter of 2021, the Company entered into a loss portfolio transfer and adverse development cover agreement in relation to prior underwriting years on the Company's U.S. casualty and auto business.
(2) The unrecognized time value, or discount, is the difference between the undiscounted liability for non-life reserves recorded and the discounted amount of these reserves. This discount is calculated by applying appropriate risk-free rates by currency and duration to the underlying non-life reserves.
Supplementary Financial Information
16

PartnerRe Ltd.Analysis of Life and Health Reserves(Expressed in thousands of U.S. dollars)
(Unaudited) As at and for the three months ended As at and for the six months ended June 30, 2021 June 30, 2020 June 30, 2021 June 30, 2020
Reconciliation of beginning and ending life and health reserves:Gross liability at beginning of period $ 2,727,411 $ 2,302,155 $ 2,704,229 $ 2,417,044 Reinsurance recoverable at beginning of period (30,701) (17,435) (35,662) (16,183) Net liability at beginning of period 2,696,710 2,284,720 2,668,567 2,400,861 Net incurred losses 362,690 352,681 720,240 685,491 Net losses paid (375,965) (318,703) (673,588) (620,971) Effects of foreign exchange rate changes and other 26,098 68,906 (5,686) (77,777) Net liability at end of period 2,709,533 2,387,604 2,709,533 2,387,604 Reinsurance recoverable at end of period 26,510 18,556 26,510 18,556 Gross liability at end of period $ 2,736,043 $ 2,406,160 $ 2,736,043 $ 2,406,160
Life value in force (1) $ 504,600 $ 219,400 $ 504,600 $ 219,400 (1) The life value in force (Life VIF) is the value that will emerge from life policies over time that is not recognized in the Company's tangible book value. The Company’s Life VIF is calculated
on a going concern basis and is the sum of: (i) present value of future profits which represents the net present value of projected after-tax cash flows net of Life reserves, net of deferred acquisition costs and gross of value of business acquired; (ii) cost of economic capital; (iii) frictional costs; (iv) time value of options and guarantees; and (v) cost of non-economic excess encumbered capital.
Supplementary Financial Information
17
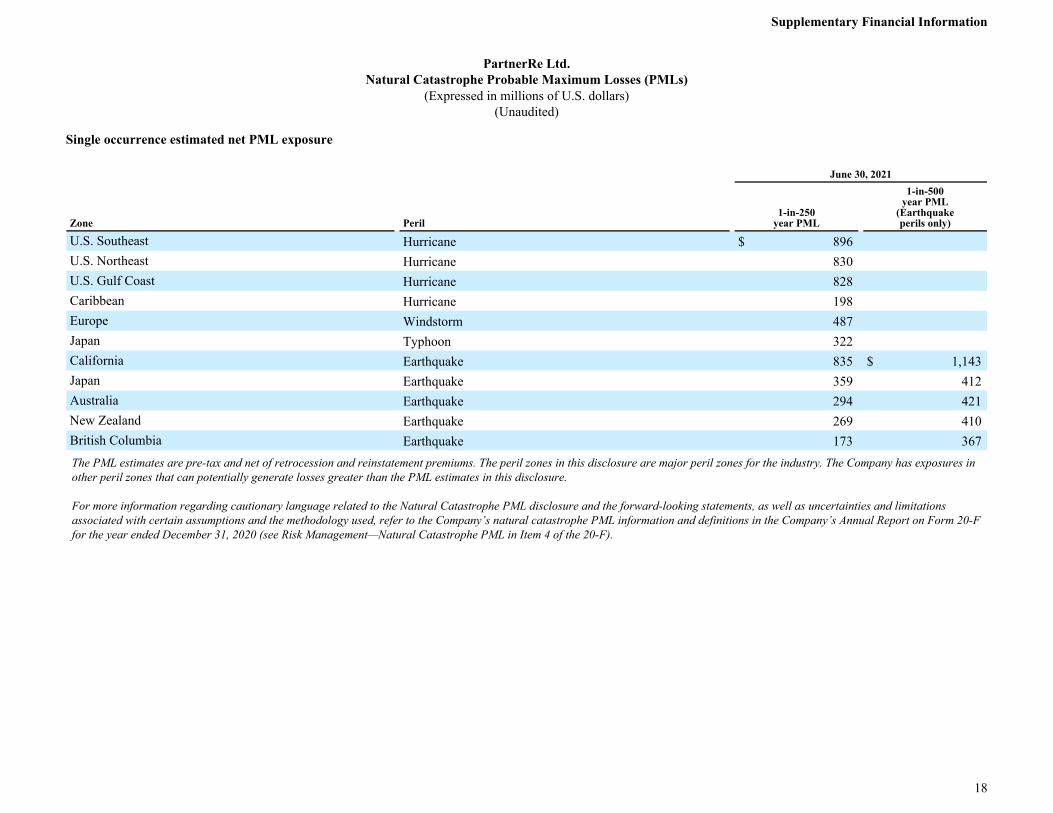
PartnerRe Ltd.Natural Catastrophe Probable Maximum Losses (PMLs)
(Expressed in millions of U.S. dollars)(Unaudited)
Single occurrence estimated net PML exposure June 30, 2021
Zone Peril1-in-250
year PML
1-in-500year PML
(Earthquakeperils only)
U.S. Southeast Hurricane $ 896 U.S. Northeast Hurricane 830 U.S. Gulf Coast Hurricane 828 Caribbean Hurricane 198 Europe Windstorm 487 Japan Typhoon 322 California Earthquake 835 $ 1,143 Japan Earthquake 359 412 Australia Earthquake 294 421 New Zealand Earthquake 269 410 British Columbia Earthquake 173 367 The PML estimates are pre-tax and net of retrocession and reinstatement premiums. The peril zones in this disclosure are major peril zones for the industry. The Company has exposures in other peril zones that can potentially generate losses greater than the PML estimates in this disclosure.
For more information regarding cautionary language related to the Natural Catastrophe PML disclosure and the forward-looking statements, as well as uncertainties and limitations associated with certain assumptions and the methodology used, refer to the Company’s natural catastrophe PML information and definitions in the Company’s Annual Report on Form 20-F for the year ended December 31, 2020 (see Risk Management—Natural Catastrophe PML in Item 4 of the 20-F).
Supplementary Financial Information
18
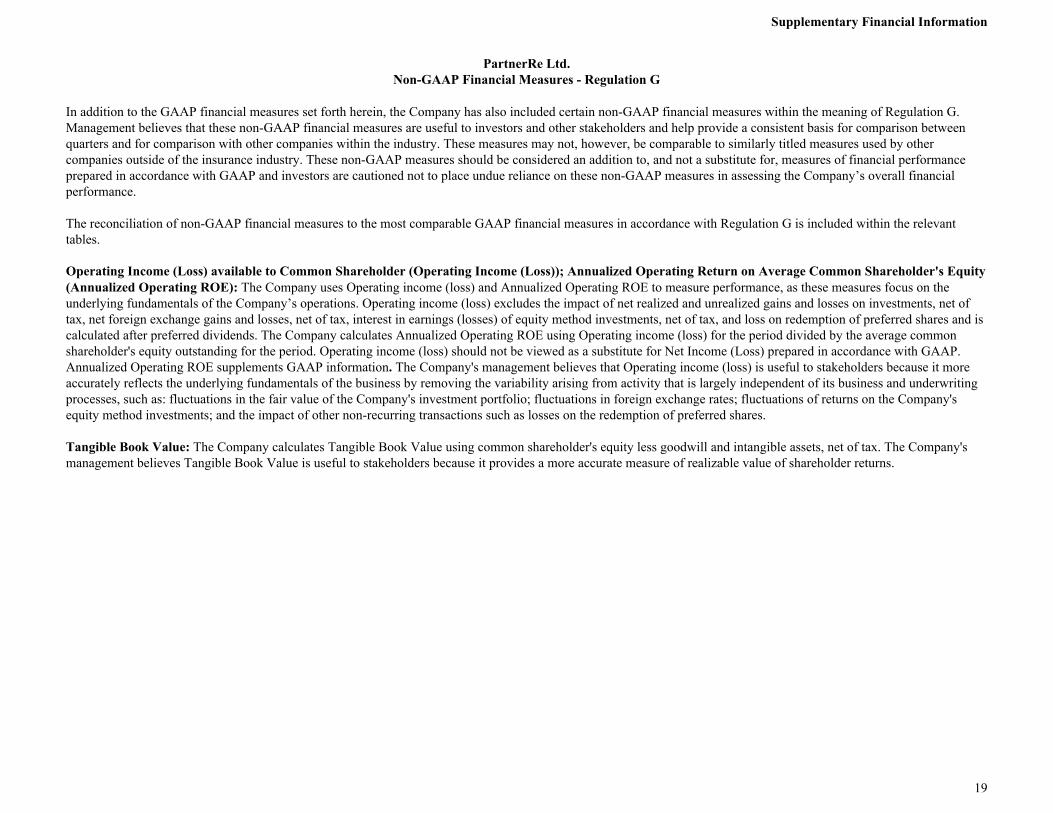
PartnerRe Ltd.Non-GAAP Financial Measures - Regulation G
In addition to the GAAP financial measures set forth herein, the Company has also included certain non-GAAP financial measures within the meaning of Regulation G. Management believes that these non-GAAP financial measures are useful to investors and other stakeholders and help provide a consistent basis for comparison between quarters and for comparison with other companies within the industry. These measures may not, however, be comparable to similarly titled measures used by other companies outside of the insurance industry. These non-GAAP measures should be considered an addition to, and not a substitute for, measures of financial performance prepared in accordance with GAAP and investors are cautioned not to place undue reliance on these non-GAAP measures in assessing the Company’s overall financial performance.
The reconciliation of non-GAAP financial measures to the most comparable GAAP financial measures in accordance with Regulation G is included within the relevant tables.
Operating Income (Loss) available to Common Shareholder (Operating Income (Loss)); Annualized Operating Return on Average Common Shareholder's Equity (Annualized Operating ROE): The Company uses Operating income (loss) and Annualized Operating ROE to measure performance, as these measures focus on the underlying fundamentals of the Company’s operations. Operating income (loss) excludes the impact of net realized and unrealized gains and losses on investments, net of tax, net foreign exchange gains and losses, net of tax, interest in earnings (losses) of equity method investments, net of tax, and loss on redemption of preferred shares and is calculated after preferred dividends. The Company calculates Annualized Operating ROE using Operating income (loss) for the period divided by the average common shareholder's equity outstanding for the period. Operating income (loss) should not be viewed as a substitute for Net Income (Loss) prepared in accordance with GAAP. Annualized Operating ROE supplements GAAP information. The Company's management believes that Operating income (loss) is useful to stakeholders because it more accurately reflects the underlying fundamentals of the business by removing the variability arising from activity that is largely independent of its business and underwriting processes, such as: fluctuations in the fair value of the Company's investment portfolio; fluctuations in foreign exchange rates; fluctuations of returns on the Company's equity method investments; and the impact of other non-recurring transactions such as losses on the redemption of preferred shares.
Tangible Book Value: The Company calculates Tangible Book Value using common shareholder's equity less goodwill and intangible assets, net of tax. The Company's management believes Tangible Book Value is useful to stakeholders because it provides a more accurate measure of realizable value of shareholder returns.
Supplementary Financial Information
19
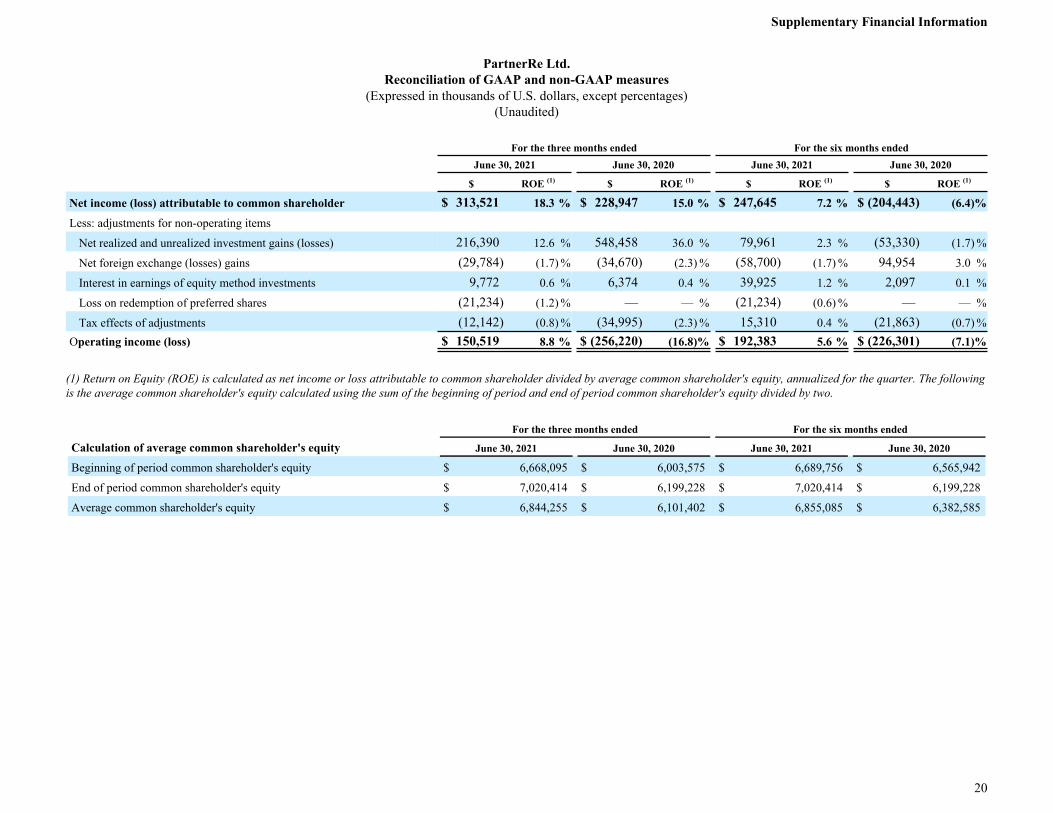
PartnerRe Ltd.Reconciliation of GAAP and non-GAAP measures
(Expressed in thousands of U.S. dollars, except percentages)(Unaudited)
For the three months ended For the six months ended June 30, 2021 June 30, 2020 June 30, 2021 June 30, 2020
$ ROE (1) $ ROE (1) $ ROE (1) $ ROE (1)
Net income (loss) attributable to common shareholder $ 313,521 18.3 % $ 228,947 15.0 % $ 247,645 7.2 % $ (204,443) (6.4) %
Less: adjustments for non-operating items
Net realized and unrealized investment gains (losses) 216,390 12.6 % 548,458 36.0 % 79,961 2.3 % (53,330) (1.7) %
Net foreign exchange (losses) gains (29,784) (1.7) % (34,670) (2.3) % (58,700) (1.7) % 94,954 3.0 %
Interest in earnings of equity method investments 9,772 0.6 % 6,374 0.4 % 39,925 1.2 % 2,097 0.1 %
Loss on redemption of preferred shares (21,234) (1.2) % — — % (21,234) (0.6) % — — %
Tax effects of adjustments (12,142) (0.8) % (34,995) (2.3) % 15,310 0.4 % (21,863) (0.7) %Operating income (loss) $ 150,519 8.8 % $ (256,220) (16.8) % $ 192,383 5.6 % $ (226,301) (7.1) %
(1) Return on Equity (ROE) is calculated as net income or loss attributable to common shareholder divided by average common shareholder's equity, annualized for the quarter. The following is the average common shareholder's equity calculated using the sum of the beginning of period and end of period common shareholder's equity divided by two.
For the three months ended For the six months ended
Calculation of average common shareholder's equity June 30, 2021 June 30, 2020 June 30, 2021 June 30, 2020
Beginning of period common shareholder's equity $ 6,668,095 $ 6,003,575 $ 6,689,756 $ 6,565,942
End of period common shareholder's equity $ 7,020,414 $ 6,199,228 $ 7,020,414 $ 6,199,228
Average common shareholder's equity $ 6,844,255 $ 6,101,402 $ 6,855,085 $ 6,382,585
Supplementary Financial Information
20
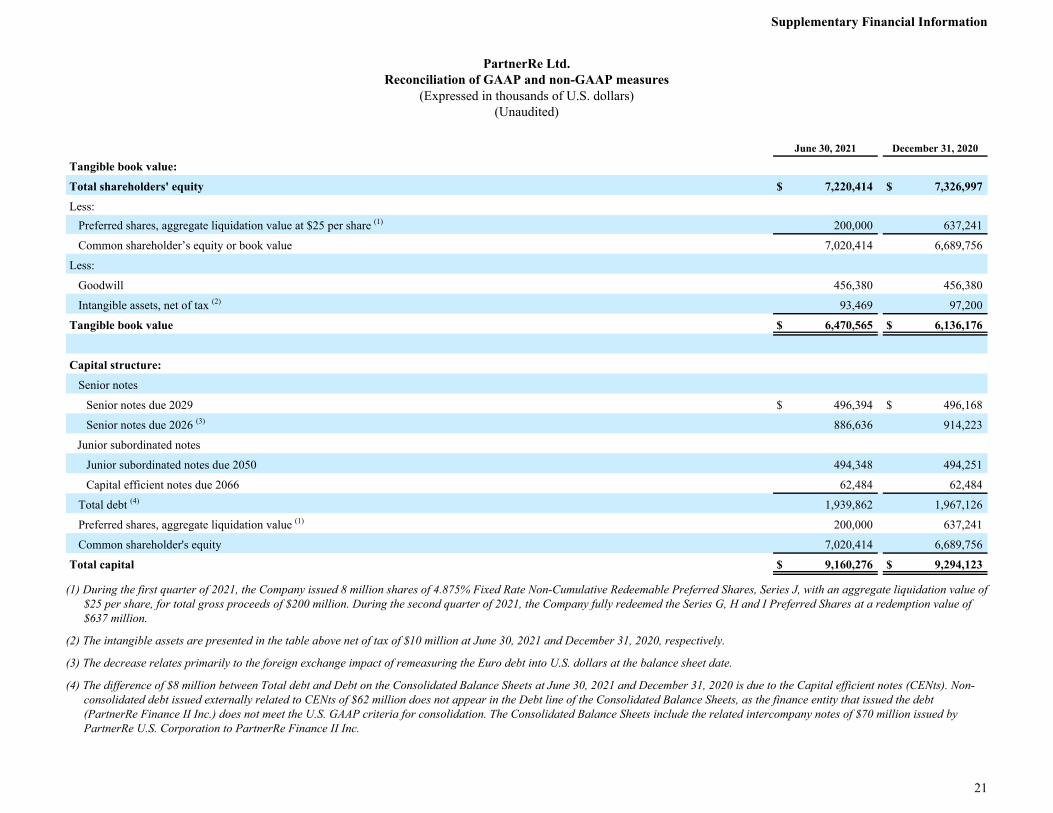
PartnerRe Ltd.Reconciliation of GAAP and non-GAAP measures
(Expressed in thousands of U.S. dollars)(Unaudited)
June 30, 2021 December 31, 2020
Tangible book value:
Total shareholders' equity $ 7,220,414 $ 7,326,997
Less:Preferred shares, aggregate liquidation value at $25 per share (1) 200,000 637,241
Common shareholder’s equity or book value 7,020,414 6,689,756
Less:
Goodwill 456,380 456,380
Intangible assets, net of tax (2) 93,469 97,200
Tangible book value $ 6,470,565 $ 6,136,176
Capital structure:
Senior notes
Senior notes due 2029 $ 496,394 $ 496,168
Senior notes due 2026 (3) 886,636 914,223
Junior subordinated notes
Junior subordinated notes due 2050 494,348 494,251
Capital efficient notes due 2066 62,484 62,484
Total debt (4) 1,939,862 1,967,126
Preferred shares, aggregate liquidation value (1) 200,000 637,241
Common shareholder's equity 7,020,414 6,689,756
Total capital $ 9,160,276 $ 9,294,123
(1) During the first quarter of 2021, the Company issued 8 million shares of 4.875% Fixed Rate Non-Cumulative Redeemable Preferred Shares, Series J, with an aggregate liquidation value of $25 per share, for total gross proceeds of $200 million. During the second quarter of 2021, the Company fully redeemed the Series G, H and I Preferred Shares at a redemption value of $637 million.
(2) The intangible assets are presented in the table above net of tax of $10 million at June 30, 2021 and December 31, 2020, respectively.
(3) The decrease relates primarily to the foreign exchange impact of remeasuring the Euro debt into U.S. dollars at the balance sheet date.
(4) The difference of $8 million between Total debt and Debt on the Consolidated Balance Sheets at June 30, 2021 and December 31, 2020 is due to the Capital efficient notes (CENts). Non-consolidated debt issued externally related to CENts of $62 million does not appear in the Debt line of the Consolidated Balance Sheets, as the finance entity that issued the debt (PartnerRe Finance II Inc.) does not meet the U.S. GAAP criteria for consolidation. The Consolidated Balance Sheets include the related intercompany notes of $70 million issued by PartnerRe U.S. Corporation to PartnerRe Finance II Inc.
Supplementary Financial Information
21