Embed Size (px)
Citation preview

Massachusetts 2019
Second Quarter/First Half
Housing Report

What Lessons Can We Learn from Booming 18-Hour Cities?
1
Forget cities that don’t sleep, Americans today want a little rest
By John Tarducci, MIRM, Senior Vice President, New Development Services Division, William Raveis Real Estate, Mortgage & Insurance
The prototypical American city never sleeps. New York, Boston, Chicago, Los Angeles, San Francisco and Washington, DC are 24/7 gateway cities, historically seen as safe real estate investments because they attract people and businesses, making them lucrative in the long term. But what happens when these cities become too populated, driving the cost of living up so high that it is unsustainable for the average person?
Enter the 18-hour city: a second-tier city that offers comparable services, amenities, and job opportunities of a 24-hour city, but without operating on a 24-hour basis. These cities have strong infrastructure, widespread urban development, a robust economy and, the key factor, a lower cost of living. Examples of 18-hour cities include Raleigh, Denver, Seattle, Portland, Nashville, Tampa, Charlotte, and Atlanta. For several years, 18-hour cities have emerged as cost-effective alternatives to traditional gateway cities, leading to an urban revitalization driven
mainly by the millennial generation. In 2019, according to PwC’s Emerging Trends in Real Estate® report, nine of the top 10 and 17 of the top 20 real estate markets in the county fall into this non-gateway, 18-hour city category.
However, as the 80-million plus millennial generation ages, their eyes could be turning towards the suburbs of the cities they’ve made home. As the older end of this generation reaches their mid-to-late 30s, millennials are forming families, having children and making decisions more in line with generations before them. While some of the attractions of suburban life remain (large homes, good school districts and green space) the millennial generation is adding their own “must-haves” to the traditional list of amenities. Easy access to mass transit, walkable neighborhoods with easy access to downtown spaces--essentially all the charm of a traditional suburban neighborhood with the convenience of an urban city center.
Massachusetts | 2019 Second Quarter / First Half Housing Report

What Lessons Can We Learn from Booming 18-Hour Cities? (cont.)
2
Other than choosing the right suburban markets, how can builders capitalize on this growing trend when building new construction? Just as concierge desks, historically found in hotel lobbies, have become staples in apartment buildings, offices and retail stores, the real estate industry needs to consider how to attract clients based on more than just traditional amenities. What value-added services can we provide that will set us apart from the competition?
In multi-family units, while an onsite fitness center and laundry rooms were once seen as going above and beyond, now tenants and buyers are looking for pet care, community gardens and staffed mailrooms to accommodate not only the constant influx of Amazon Prime packages, but
also refrigerated spaces to keep grocery deliveries fresh. With the rise of the gig economy, co-working spaces integrated into living areas has become increasingly common, providing individuals who work from home a public space to separate their work lives and home lives.
The key to all of these amenities is that it isn’t just about physical additions, it is the level of personal service they provide. If you have a gym, do you offer yoga classes? Is there someone available to walk my dogs during the workday? And for the industry, once these types of amenities are offered, it is nearly impossible to scale them back. Consumers feel the loss of these types of amenities much more acutely than they enjoy the satisfaction of having them.
Massachusetts | 2019 Second Quarter / First Half Housing Report

Connecticut | 2015 Full Year Housing Report 3
In single-family neighborhoods, amenities are just as important, although harder to come by. One of the most intangible, but most sought after? Identity. For former city-dwellers, used to being surrounded by the culture of their neighborhood, moving to a cookie-cutter suburban development just won’t cut it. Today’s consumers are looking for something unique that sets their neighborhood apart. WIth more and more mixed-use developments cropping up across the country, this identity is established by curating the types of businesses that will live side-by-side residential homes.
When developing communities for today’s new buyers, builders have to think outside the traditional master-planned community box. Millennials want an urban feel to their suburban home--they want many (many, many) layout
options, parks, green space, high-speed internet, usable community spaces, and all of this for an affordable price. They value quality over quantity, and would, for the most part, rather see a smaller square-footage designed with renewable materials than a giant home of a lower standard.
What Lessons Can We Learn from Booming 18-Hour Cities? (cont.)
Massachusetts | 2019 Second Quarter / First Half Housing Report

3Massachusetts | 2019 Second Quarter / First Half Housing Report
Housing Permits Increase Throughthe First Half of 2019
In the Commonwealth of Massachusetts through the First Half of 2019, permits saw a 1 percent increase. The total number of permits rose from 8,011 through the end of the second quarter of 2018 to 8,091 through the end of the second quarter of 2019. The largest increase was in 3 &4 Unit permits, which rose 57.8 percent and 5+ Unit permits, that rose 8.7 percent. Meanwhile, 1-Unit
permits dropped 15.6 percent and 2-Unit permits fell 14.2 percent.
By MSA, Worcester, MA increased 56 percent, Springfield, MA increased 38.9 percent and Boston-Cambridge-Quincy, MA-NH increased 0.5 percent, while Barnstable Town, MA decreased 38.3 percent and Pittsfield, MA decreased 16.7 percent.
State of MassachusettsHousing Permits Issued by MSAFirst Half 2018 vs. 2019
MSA 1 Unit 2 Unit 3 & 4 Unit 5+ Unit Total H1 2019
Barnstable Town 29 0 0 0 29
Boston/Cambridge/Quincy 2022 236 229 5403 7,890
Pittsfield 5 0 0 0 5
Springfield 18 4 3 0 25
Worcester 99 2 0 41 142
Totals 2,173 242 232 5,444 8,091
% Change 2019 vs 2018 -15.6% -14.2% +57.8% +8.7% +1.0%
MSA 1 Unit 2 Unit 3 & 4 Unit 5+ Unit Total H1 2018
Barnstable Town 41 0 6 0 47
Boston/Cambridge/Quincy 2,424 280 138 5,007 7,849
Pittsfield 6 0 0 0 6
Springfield 16 2 0 0 18
Worcester 88 0 3 0 91
Totals 2,575 282 147 5,007 8,011

4Massachusetts | 2019 Second Quarter / First Half Housing Report
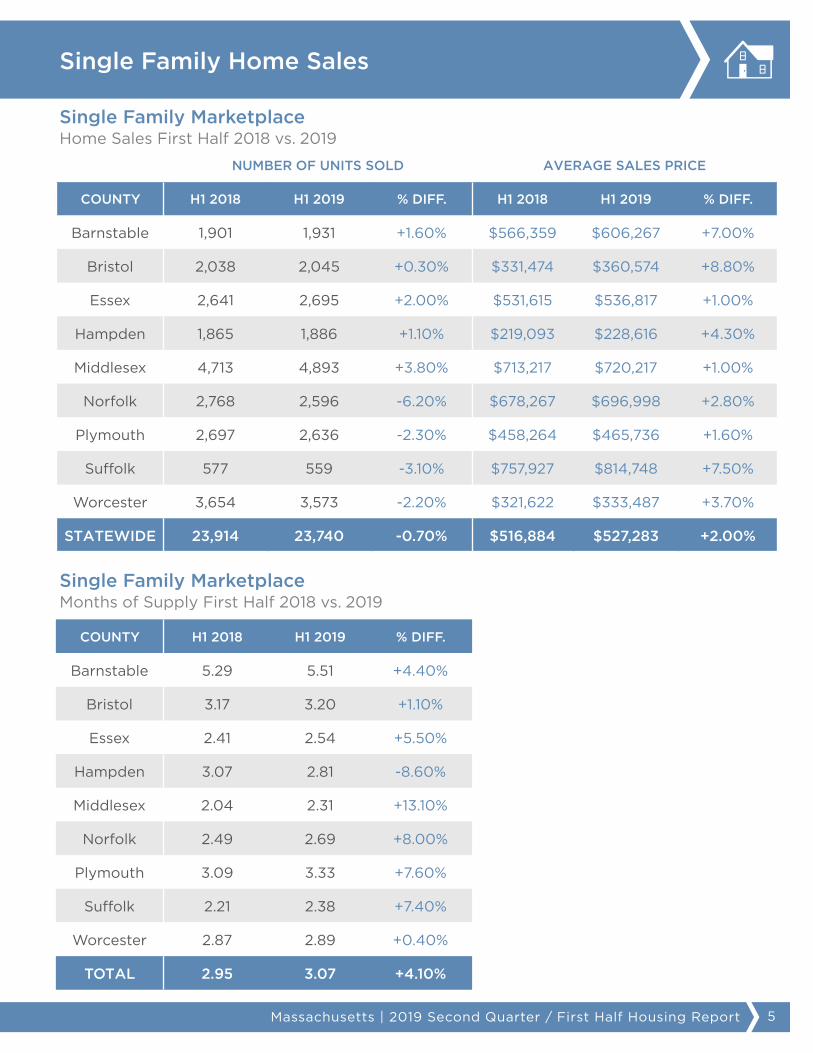
Through the first half of 2019, Single-Family Home Sales in the Commonwealth of Massachusetts decreased 0.7 percent, from 23,914 to 23,740 year-over-year. On a county-by-county basis, increases were seen across the Commonwealth, including: Middlesex County at 3.8 percent, Essex County at 2 percent, Barnstable County at 1.6 percent, Hampden County at 1.1 percent and Bristol County at 0.3 percent. Losses were seen in Norfolk County at
6.2 percent, Suffolk County at 3.1 percent, Plymouth County at 2.3 percent and Worcester County at 2.2 percent.
Average Sales Price for single-family homes in Massachusetts increased 2 percent through the first half of 2019, from $516,884 to $527,283. Increases were seen in Bristol County (8.8 percent), Suffolk County (7.5 percent), Barnstable County (7 percent), Hampden County (4.3 percent), Worcester County (3.7 percent), Norfolk County (2.8 percent), Plymouth County (1.6 percent), Middlesex County (1 percent) and Essex County (1 percent.)
To round out the quarter, Average List Price increased 3.7 percent, Months of Supply increased 4.1 percent and Price Per Square Foot increased 1.2 percent.
Single Family Unit Sales FallThrough the First Half of 2019
First Half 2019 vs. 2018
Unit Sales 0.7%
Avg. List Price 3.7%
Months of Supply 4.1%
5Massachusetts | 2019 Second Quarter / First Half Housing Report
NUMBER OF UNITS SOLD AVERAGE SALES PRICE
COUNTY H1 2018 H1 2019 % DIFF. H1 2018 H1 2019 % DIFF.
Barnstable 1,901 1,931 +1.60% $566,359 $606,267 +7.00%
Bristol 2,038 2,045 +0.30% $331,474 $360,574 +8.80%
Essex 2,641 2,695 +2.00% $531,615 $536,817 +1.00%
Hampden 1,865 1,886 +1.10% $219,093 $228,616 +4.30%
Middlesex 4,713 4,893 +3.80% $713,217 $720,217 +1.00%
Norfolk 2,768 2,596 -6.20% $678,267 $696,998 +2.80%
Plymouth 2,697 2,636 -2.30% $458,264 $465,736 +1.60%
Suffolk 577 559 -3.10% $757,927 $814,748 +7.50%
Worcester 3,654 3,573 -2.20% $321,622 $333,487 +3.70%
STATEWIDE 23,914 23,740 -0.70% $516,884 $527,283 +2.00%
Single Family Home Sales
Single Family MarketplaceMonths of Supply First Half 2018 vs. 2019
COUNTY H1 2018 H1 2019 % DIFF.
Barnstable 5.29 5.51 +4.40%
Bristol 3.17 3.20 +1.10%
Essex 2.41 2.54 +5.50%
Hampden 3.07 2.81 -8.60%
Middlesex 2.04 2.31 +13.10%
Norfolk 2.49 2.69 +8.00%
Plymouth 3.09 3.33 +7.60%
Suffolk 2.21 2.38 +7.40%
Worcester 2.87 2.89 +0.40%
TOTAL 2.95 3.07 +4.10%
Single Family MarketplaceHome Sales First Half 2018 vs. 2019

6
To finish the first half of 2019, we saw Units Sold for condominiums in the Commonwealth of Massachusetts down 2.4 percent, from 10,093 through the first half of 2018 to 9,852 through the first half of 2019. Decreases were seen in Bristol County at 14.1 percent, Barnstable County at 10.8 percent, Worcester County at 8 percent, Suffolk County at 5.8 percent, Essex County at 3.7 percent and Middlesex County at 1.7 percent. Meanwhile, increases were seen
in Hampden County at 16.9 percent, Plymouth County at 15.8 percent and Norfolk County at 2.9 percent.
Average Sales Price of condominiums in Massachusetts increased 4.4 percent, from $504,567 to $526,980. On a county-by-county basis, Plymouth County increased 11.4 percent, Essex County increased 5.8 percent, Middlesex County increased 5.6 percent, Suffolk County increased 4.4 percent, Norfolk County increased 4.1 percent, Worcester County increased 3.4 percent, Bristol County increased 1.6 percent and Barnstable County decreased 1.1 percent.
To round out the quarter, Average List Price increased 8.1 percent, Months of Supply increased 21.8 percent and Price Per Square Foot increased 4.4 percent.
Massachusetts Condominium Sales Decrease in the First Half of 2019
First Half 2019 vs. 2018
Unit Sales 2.4%
Avg. List Price 8.1%
Months of Supply 21.8%
Massachusetts | 2019 Second Quarter / First Half Housing Report

NUMBER OF UNITS SOLD AVERAGE SALES PRICE
COUNTY H1 2018 H1 2019 % DIFF. H1 2018 H1 2019 % DIFF.
Barnstable 493 440 -10.80% $346,491 $342,729 -1.10%
Bristol 404 347 -14.10% $228,272 $232,019 +1.60%
Essex 1,347 1,297 -3.70% $329,350 $348,453 +5.80%
Hampden 237 277 16.90% $164,785 $166,201 +0.90%
Middlesex 2,659 2,615 -1.70% $511,809 $540,460 +5.60%
Norfolk 1,072 1,103 2.90% $496,900 $517,134 +4.10%
Plymouth 543 629 15.80% $340,314 $378,966 +11.40%
Suffolk 2,396 2,256 -5.80% $852,912 $890,226 +4.40%
Worcester 796 732 -8.00% $235,453 $243,422 +3.40%
STATEWIDE 10,093 9,852 -2.40% $504,567 $526,980 +4.40%
COUNTY H1 2018 H1 2019 % DIFF.
Barnstable 4.76 5.92 +24.50%
Bristol 2.22 3.03 +36.30%
Essex 2.03 2.39 +17.30%
Hampden 3.57 2.62 -26.70%
Middlesex 1.55 2.10 +35.70%
Norfolk 2.12 2.85 +34.40%
Plymouth 3.14 3.35 +6.70%
Suffolk 2.33 3.01 +29.20%
Worcester 2.44 2.50 +2.96%
TOTAL 2.29 2.79 +21.80%
7
Condominium Sales
Condominium MarketplaceMonths of Supply 2018 vs. 2019
Condominium MarketplaceHome Sales 2018 vs. 2019
Massachusetts | 2019 Second Quarter / First Half Housing Report

8
It seems like every quarter we are discussing the moment
millennials will flock to the housing market. The truth is, their
entry is going to be more like a slow trickle. With over 80 million
in the millennial generation, ranging in age from 20-40, the fact
is they will be “entering” the housing market for the next 20
years. Instead of anticipating a giant wave, we need to rethink
our overall approach to housing, and evolve our mindset to meet
this generation’s expectations. In terms of development, this
means looking toward urban/suburban crossover communities
that provide the space and separation they crave while still
providing a sense of culture and identity.
This evolution also extends to how we market and sell real
estate. Millennials won’t be impressed by traditional direct
mailers or enticed by newspaper ads. Instead, this generation
turns to technology--meaning that incorporating social media
advertising and innovative digital strategies like virtual reality,
have become imperatives. As a builder, it’s important to work
with a team who develops custom designed sales and marketing
plans for you from the start. Williams Raveis New Development
Services has sold over 10,000 units (over $ 6.5 B in volume)
doing just that--designing custom, turn-key programs to sell
properties right from the start.
Credits and Resources1. Information contained herein is based on information obtained from MLSPIN and is deemed accurate but not guaranteed2. Metro Service Area (MSA) housing permit data source: U.S. Census Bureau Compiled by HUD Research3. Not all Massachusetts counties are made part of this report. This report focuses on the eight eastern counties (Bristol, Essex, Hampden, Middlesex, Norfolk, Plymouth, Suffolk, and Worcester).
John Tarducci, MIRM, CMP, CRBSenior Vice President
William Raveis New Development Services
o: 203.925.4587c: 203.640.6930
Conclusion
Massachusetts | 2019 Second Quarter / First Half Housing Report


