Embed Size (px)
Citation preview

News Release
PartnerRe Ltd. Wellesley House, 5th Floor 90 Pitts Bay Road Pembroke, Bermuda HM 08
Telephone +1 441 292 0888 Fax +1 441 292 6080 www.partnerre.com 1
PartnerRe Ltd. Reports Second Quarter and Half Year 2018 Results
▪ Second Quarter Net income available to common shareholder of $125 million, resulting in an Annualized Net Income ROE of 8.4%
▪ Non-life combined ratio of 93.8% during the quarter, driven by P&C combined ratio of 95.6% and Specialty combined ratio of 92.0%
▪ Total investment return of $42 million (or 0.9% annualized) for the quarter, driven by net investment income and gains on public equities and real estate, partially offset by lower fair value of fixed income securities linked to increase in risk-free rates and credit spreads
PEMBROKE, Bermuda, July 27, 2018 - PartnerRe Ltd. ("the Company") today reported a net income available to common shareholder of $125 million for the second quarter of 2018, which includes net unrealized investment losses on fixed income securities of $79 million. This compared to a net income of $191 million for the same period of 2017, which included net unrealized investment gains on fixed income securities of $95 million. Net income available to common shareholder was $5 million for the half year 2018, which includes net unrealized investment losses on fixed income securities of $312 million. This compared to a net income of $229 million for the half year 2017, which included net unrealized investment gains on fixed income securities of $137 million. The unrealized investment losses on fixed income securities in 2018 were driven by an increase in risk-free rates and credit spreads and the unrealized investment gains on fixed income securities in 2017 were driven by a narrowing of credit spreads. The majority of the Company's investments, including all standard fixed income investments such as government bonds and investment grade corporate debt, are accounted for at fair value with changes in the fair value recorded in the Consolidated Statements of Operations.
Underwriting profits, including both Non-life and Life and Health operations and corporate expenses, were $36 million for the second quarter of 2018 compared to $37 million for the same period of 2017, and $46 million for the half year 2018 compared to $11 million for the same period of 2017.
Commenting on the results, PartnerRe President and Chief Executive Officer Emmanuel Clarke said, “We delivered an annualized Net Income ROE of 8.4% in this quarter, driven by solid underwriting profits in both our Non-Life and Life and Health segments and a 20% increase in net premium written compared to last year’s second quarter. I am pleased to see our results reflect the efforts we have made, over the past

News Release
PartnerRe Ltd. Wellesley House, 5th Floor 90 Pitts Bay Road Pembroke, Bermuda HM 08
Telephone +1 441 292 0888 Fax +1 441 292 6080 www.partnerre.com 2
two years, to gain relevance with our key clients and brokers, and to find new attractive business opportunities.
Notwithstanding a competitive reinsurance market, we achieved a positive July 1 renewal where we continued to see increases in business margins. These results, in conjunction with continued improved efficiency in operating expenses, and the impact of higher reinvestment yields on our Investment portfolio, position our company well to deliver improved underwriting and financial results during the remainder of 2018.”
Highlights for the second quarter of 2018 compared to the same period of 2017 and for the half year 2018 compared to the same period of 2017 are included below: Non-Life:
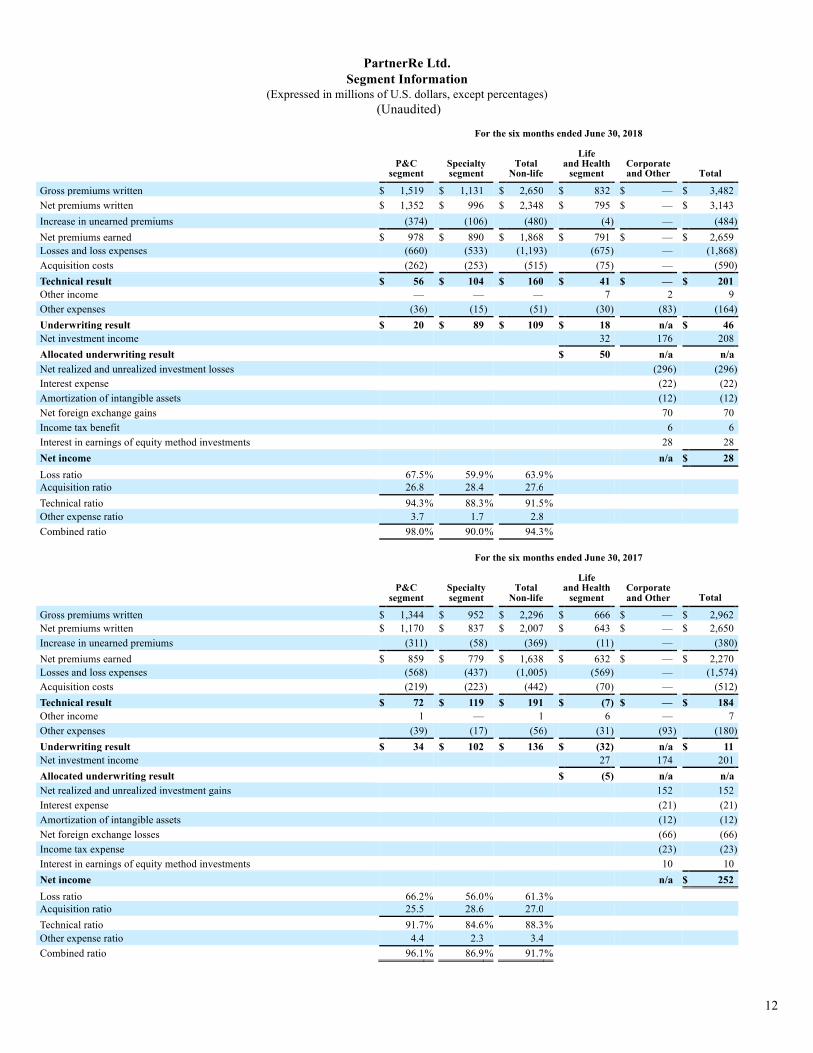
▪ Non-life net premiums written were up 21% for the second quarter of 2018 and 17% for the half year 2018 compared to the same periods of 2017. These increases were primarily due to new business written in both the P&C and Specialty segments.
▪ The Non-life underwriting profit was $65 million (combined ratio of 93.8%) for the second quarter of 2018 compared to $108 million (combined ratio of 87.7%) for the same period of 2017, and $109 million (combined ratio of 94.3%) for the half year 2018 compared to $136 million (combined ratio of 91.7%) for the same period of 2017, primarily reflecting lower prior years' reserve development and improved current accident year technical ratios.
▪ Net favorable prior years' reserve development of $29 million (2.7 points) for the second quarter of 2018 was lower compared to $110 million (12.6 points) for the same period of 2017. Net favorable prior year development of $70 million (3.7 points) for the half year 2018 was lower compared to $196 million (12.0 points) for the same period of 2017. Net favorable reserve development on Harvey, Irma and Maria 2017 events was $5 million during the second quarter of 2018 ($25 million during the half year 2018) and was offset by $5 million negative development on the California wildfires ($11 million during the half year 2018). Both the P&C and Specialty segments experienced net favorable development in the first half of 2018 and 2017.
Life and Health:
▪ Net premiums written were up 19% in the second quarter of 2018 and 24% for the half year 2018 compared to the same periods of 2017, driven primarily by organic growth in the Life business, a favorable foreign exchange impact and higher rates in the Health business. The increase for the half year also reflects the inclusion of the Aurigen life premiums for two quarters in 2018 compared to only one quarter in 2017, following the acquisition of Aurigen on April 2, 2017.

News Release
PartnerRe Ltd. Wellesley House, 5th Floor 90 Pitts Bay Road Pembroke, Bermuda HM 08
Telephone +1 441 292 0888 Fax +1 441 292 6080 www.partnerre.com 3
▪ Allocated underwriting result was a gain of $20 million in the second quarter of 2018 compared to a loss of $13 million in the second quarter of 2017, driven by a $23 million improvement in Health and a $10 million improvement in Life business.
▪ Allocated underwriting result for the half year 2018 was a gain of $50 million compared to a loss of $5 million in 2017, driven by a $31 million improvement in Health and a $24 million improvement in Life business.
Investments:
▪ Net investment total return in the second quarter of 2018 was $42 million, or 0.2%, and included net investment income of $105 million, net realized and unrealized investment losses of $74 million and interest in earnings of equity method investments of $11 million. This compares to a positive total return of $234 million, or 1.4%, for the second quarter of 2017, which included net investment income of $103 million, net realized and unrealized investment gains of $129 million, and interest in earnings of equity method investments of $2 million. Net investment return for the half year 2018 was negative $60 million, or 0.4%, and included net investment income of $208 million, net realized and unrealized investment losses of $296 million and interest in earnings of equity method investments of $28 million. This compares to a positive return of $363 million, or 2.1%, for the half year 2017, which included net investment income of $201 million, net realized and unrealized investment gains of $152 million and interest in earnings of equity method investments of $10 million.
▪ Net investment income of $105 million for the second quarter of 2018 was up $2 million, or 2%, compared to the same period of 2017. Net investment income of $208 million for the half year 2018 was up $7 million, or 3%, compared to the same period of 2017.
▪ Net realized and unrealized investment losses of $74 million in the second quarter of 2018 and $296 million for the half year 2018, were driven by an increase in risk-free rates in the U.S. coupled with a widening of credit spreads in the U.S. and Europe. Financial assets (mainly alternative credit, public and private equity) and real estate reported a $32 million gain for the quarter and $57 million for the half year 2018. The net realized and unrealized investment gains of $129 million in the second quarter of 2017 and $152 million for the half year 2017 were primarily generated by fixed income securities, driven by a narrowing of investment grade corporate spreads, and a positive contribution from financial assets and real estate ($38 million in the second quarter of 2017 and $49 million for the half year 2017).
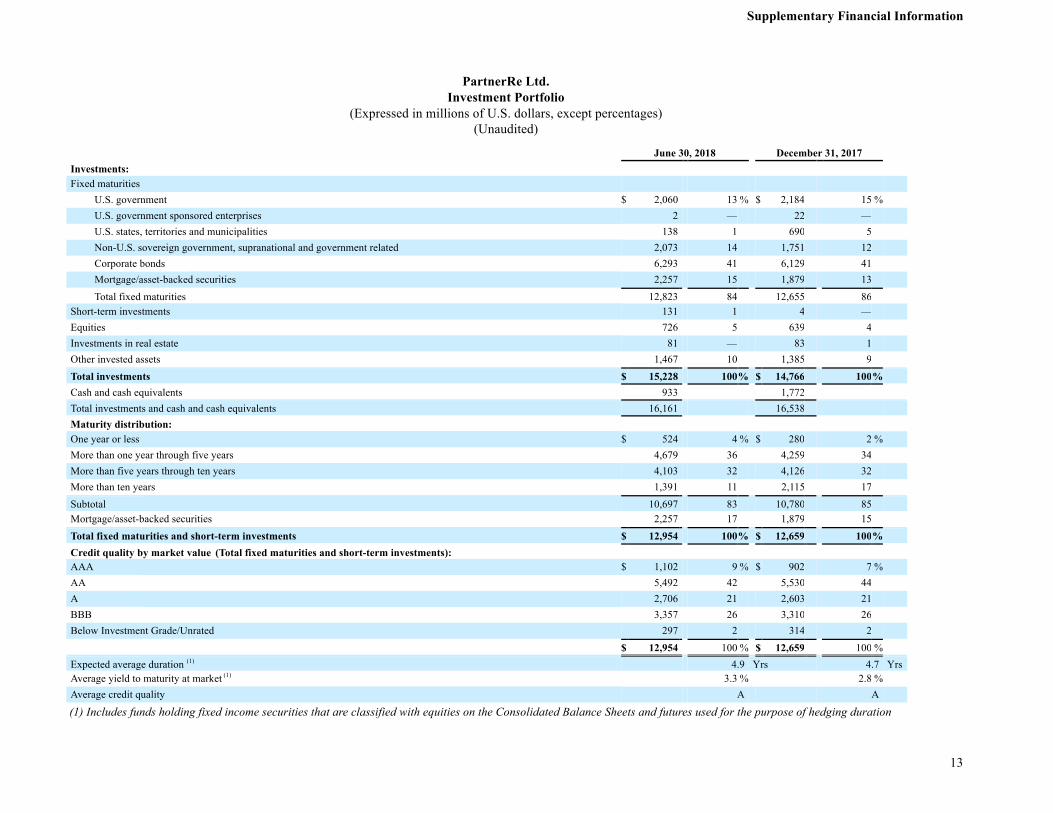
▪ Reinvestment rates are currently 3.3%, compared to the existing Company's fixed income investment portfolio yield of 2.8%.
News Release
PartnerRe Ltd. Wellesley House, 5th Floor 90 Pitts Bay Road Pembroke, Bermuda HM 08
Telephone +1 441 292 0888 Fax +1 441 292 6080 www.partnerre.com 4
Other Income Statement Items:
▪ Other expenses of $77 million in the second quarter of 2018 were down $13 million, or 15%, compared to $90 million for the same period of 2017. This decrease in other expenses was primarily due to lower personnel costs, lower facilities expenses and transaction and reorganization costs incurred in the second quarter of 2017. Excluding the impact of foreign exchange, other expenses were down $18 million, or 20%, compared to the second quarter of 2017. Other expenses of $164 million for the half year 2018 were down $16 million, or 9%, compared to $180 million in the same period of 2017, primarily due to the same drivers as for the quarter. Excluding the impact of foreign exchange, other expenses were down $25 million, or 14%, compared to the half year 2017.
▪ Net foreign exchange gains were $84 million in the second quarter of 2018 ($70 million in the half year 2018) compared to $29 million loss in the second quarter of 2017 ($66 million loss in half year 2017) driven by appreciation of the U.S. dollar during the course of 2018 (depreciation during the course of 2017) and hedging costs (mostly related to the U.S. dollar vs Euro hedging).
▪ Interest expense was $11 million and $22 million in the second quarter and half year 2018, respectively, while preferred dividends were $12 million and $23 million in the second quarter and half year 2018, respectively, and were comparable to the same periods of 2017.
▪ Income tax expense was $9 million on pre-tax earnings of $146 million in the second quarter of 2018 compared to $22 million income tax expense on pre-tax earnings of $224 million for the same period of 2017. Income tax benefit was $6 million on pre-tax earnings of $22 million for the half year 2018 compared to $23 million tax expense on pre-tax earnings of $276 million in the same period of 2017.
Balance Sheet and Capitalization:
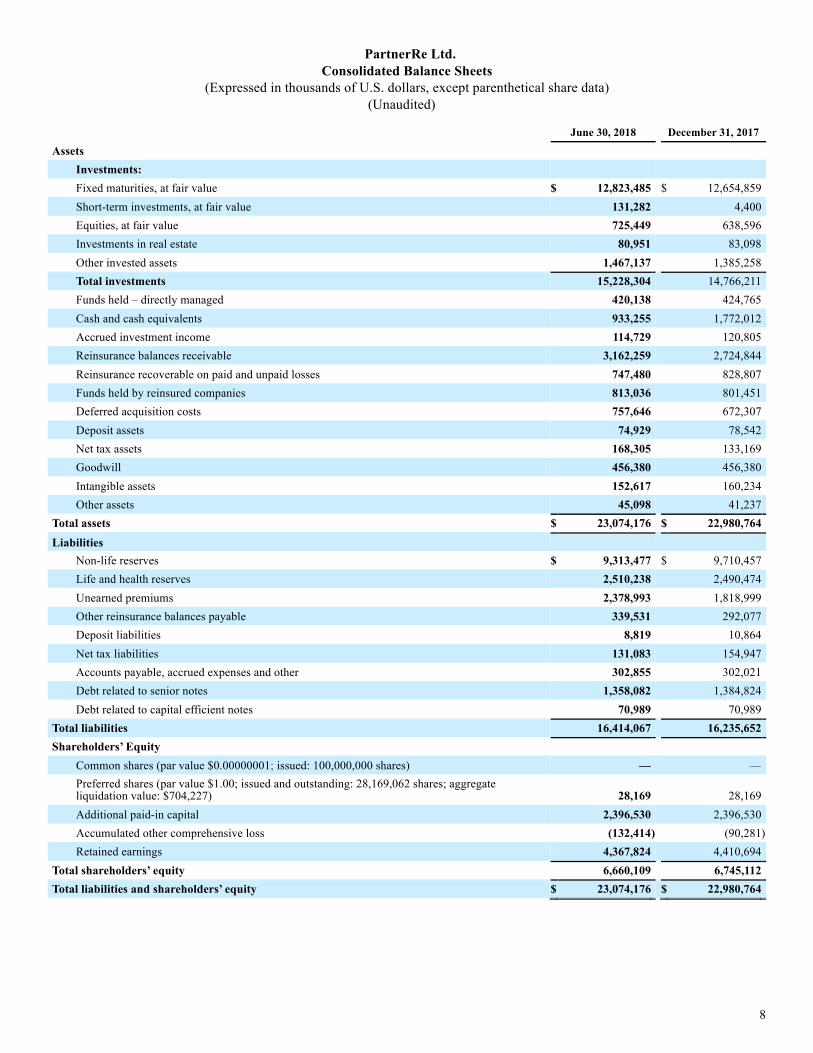
▪ Total investments, funds held–directly managed and cash and cash equivalents were $16.6 billion at June 30, 2018, down 2.2% compared to December 31, 2017.
▪ Cash and cash equivalents and fixed maturities, which are government issued or investment grade fixed income securities, were $13.6 billion at June 30, 2018, representing 84% of the cash and cash equivalents and total investments.
▪ The average credit rating and expected average duration of the fixed income portfolio at June 30, 2018 was A and 4.9 years, respectively, while the average duration of the Company’s liabilities was 4.8 years.
▪ No dividends were declared to common shareholders in the second quarter of 2018. Dividends declared to common shareholders in the half year 2018 were $48 million.

News Release
PartnerRe Ltd. Wellesley House, 5th Floor 90 Pitts Bay Road Pembroke, Bermuda HM 08
Telephone +1 441 292 0888 Fax +1 441 292 6080 www.partnerre.com 5
▪ Total capital was $8.1 billion at June 30, 2018, down 1.4% compared to December 31, 2017, primarily due to dividends on common and preferred shares and the impact of the foreign currency translation adjustment.
▪ Common shareholder's equity (or book value) of $6.0 billion and tangible book value of $5.4 billion at June 30, 2018, were down 1.4% and 1.5%, respectively, compared to December 31, 2017 primarily due to dividends on common shares and the foreign currency translation adjustment. Book value at June 30, 2018, excluding dividends on common shares, was down 0.6% compared to December 31, 2017.
▪ On May 31, 2018, the Company submitted its required Financial Condition Report (FCR) for the year ended December 31, 2017 to the Company’s Group regulator, the Bermuda Monetary Authority. The FCR includes, among other disclosures, the Group’s required and available statutory capital. The Company uses the standard Bermuda Solvency Capital Requirement (BSCR) model to assess the Enhanced Capital Requirement (ECR), the required statutory capital and surplus. In the FCR, the Company reported an ECR of $2,476 million, Available Statutory Economic Capital and Surplus of $8,784 million, and a BSCR ratio of 355% as of December 31, 2017. Effective January 1, 2016, Bermuda was deemed Solvency II equivalent under the European Union’s (EU) Solvency II initiative.
Cash Flows:
▪ Cash provided by operating activities was $127 million in the second quarter of 2018 compared to $129 million in the same period of 2017. The positive cash flow was primarily driven by investment income.
▪ Cash used in investing activities was $853 million in the second quarter of 2018 compared to $637 million in the same period in 2017. The cash outflows primarily reflect purchases of fixed maturity securities. The cash outflows in the second quarter of 2017 were primarily due to the acquisition of Aurigen Capital Ltd. (Aurigen) and investments in public equity funds.
▪ Cash used in financing activities was $12 million in the second quarter of 2018 compared to $244 million in the same period in 2017. The cash outflows in the second quarter of 2018 were driven by the dividends paid to preferred shareholders. The cash outflows in the second quarter of 2017 were driven by a redemption of debt acquired in the Aurigen acquisition ($207 million) as well as dividends paid to common and preferred shareholders.
_______________________________________
PartnerRe Ltd. is a leading global reinsurer that helps insurance companies reduce their earnings volatility, strengthen their capital and grow their businesses through reinsurance solutions. Risks are underwritten on a

News Release
PartnerRe Ltd. Wellesley House, 5th Floor 90 Pitts Bay Road Pembroke, Bermuda HM 08
Telephone +1 441 292 0888 Fax +1 441 292 6080 www.partnerre.com 6
worldwide basis through the Company’s three segments: P&C, Specialty, and Life and Health. For the year ended December 31, 2017, total revenues were $5.7 billion. At June 30, 2018, total assets were $23.1 billion, total capital was $8.1 billion and total shareholders’ equity was $6.7 billion. PartnerRe enjoys strong financial strength ratings as follows: A.M. Best A / Moody’s A1 / Standard & Poor’s A+.
PartnerRe on the Internet: www.partnerre.com
Forward-looking statements contained in this press release are based on the Company’s assumptions and expectations concerning future events and financial performance and are made pursuant to the safe harbor provisions of the Private Securities Litigation Reform Act of 1995. Such statements are subject to significant business, economic and competitive risks and uncertainties that could cause actual results to differ materially from those reflected in the forward-looking statements. PartnerRe’s forward-looking statements could be affected by numerous foreseeable and unforeseeable events and developments such as exposure to catastrophe or other large property and casualty losses, credit, interest, currency and other risks associated with the Company’s investment portfolio, adequacy of reserves, levels and pricing of new and renewal business achieved, changes in accounting policies, risks associated with implementing business strategies, and other factors identified in the Company’s reports filed or furnished with the Securities and Exchange Commission. In light of the significant uncertainties inherent in the forward-looking information contained herein, readers are cautioned not to place undue reliance on these forward-looking statements, which speak only as of the dates on which they are made. The Company disclaims any obligation to publicly update or revise any forward-looking information or statements.
Contacts: PartnerRe Ltd. (441) 292-0888 Investor Contact: Ryan Lipschutz Media Contact: Celia Powell

7
PartnerRe Ltd.
Consolidated Statements of Operations and Comprehensive Income (Loss) (1) (Expressed in thousands of U.S. dollars)
(Unaudited)
For the three months ended For the six months ended
June 30, 2018 June 30, 2017 June 30, 2018 June 30, 2017
Revenues Gross premiums written $ 1,677,106 $ 1,459,689 $ 3,481,947 $ 2,962,357 Net premiums written $ 1,561,103 $ 1,297,781 $ 3,142,756 $ 2,649,881 Increase in unearned premiums (106,069 ) (81,055 ) (483,694 ) (380,178 ) Net premiums earned 1,455,034 1,216,726 2,659,062 2,269,703 Net investment income 105,239 102,811 207,638 201,381 Net realized and unrealized investment (losses) gains(2) (73,609 ) 129,389 (296,169 ) 152,257 Other income 3,993 4,028 9,173 7,437 Total revenues 1,490,657 1,452,954 2,579,704 2,630,778
Expenses Losses and loss expenses 1,039,594 806,416 1,868,489 1,573,565 Acquisition costs 306,392 287,600 590,013 512,300 Other expenses (3) 76,784 90,198 163,517 179,841 Interest expense 10,885 11,121 21,632 21,374 Amortization of intangible assets 5,853 6,322 11,754 12,026 Net foreign exchange (gains) losses (83,733 ) 28,479 (69,902 ) 66,130 Total expenses 1,355,775 1,230,136 2,585,503 2,365,236
Income (loss) before taxes and interest in earnings of equity method investments 134,882
222,818
(5,799 ) 265,542
Income tax expense (benefit) 9,274 21,673 (5,798 ) 22,960 Interest in earnings of equity method investments 10,710 1,623 28,173 9,989
Net income 136,318 202,768 28,172 252,571 Preferred dividends 11,604 11,604 23,208 23,208
Net income available to common shareholder $ 124,714 $ 191,164 $ 4,964 $ 229,363 Comprehensive income (loss) $ 110,479 $ 189,558 $ (13,961 ) $ 225,014
(1) On March 18, 2016, Exor N.V. acquired 100% of the Company's common shares. As such, per share data is no longer meaningful and has been
excluded. PartnerRe common shares are no longer traded on the NYSE. (2) Net realized and unrealized investment (losses) gain include net unrealized losses of $51 million and $273 million for the three months and six
months ended June 30, 2018, respectively, and net unrealized gains of $131 million and $169 million for the three months and six months ended June 30, 2017, respectively.
(3) Other expenses for the three and six months ended June 30, 2018 include $nil and $9 million of reorganization related costs, respectively. Other
expenses for the three and six months ended June 30, 2017 include $7 million and $16 million, respectively, of transaction and reorganization related costs. Other expenses for the three months and six months ended June 30, 2018 also include Aurigen's expenses of $5 million and $8 million, respectively following the acquisition of Aurigen on April 2, 2017. Other expenses for the six months ended June 30, 2017 included $3 million of Aurigen expenses.
8
PartnerRe Ltd. Consolidated Balance Sheets
(Expressed in thousands of U.S. dollars, except parenthetical share data) (Unaudited)
June 30, 2018 December 31, 2017
Assets Investments: Fixed maturities, at fair value $ 12,823,485 $ 12,654,859
Short-term investments, at fair value 131,282 4,400
Equities, at fair value 725,449 638,596
Investments in real estate 80,951 83,098
Other invested assets 1,467,137 1,385,258
Total investments 15,228,304 14,766,211 Funds held – directly managed 420,138 424,765
Cash and cash equivalents 933,255 1,772,012
Accrued investment income 114,729 120,805
Reinsurance balances receivable 3,162,259 2,724,844
Reinsurance recoverable on paid and unpaid losses 747,480 828,807
Funds held by reinsured companies 813,036 801,451
Deferred acquisition costs 757,646 672,307
Deposit assets 74,929 78,542
Net tax assets 168,305 133,169
Goodwill 456,380 456,380
Intangible assets 152,617 160,234
Other assets 45,098 41,237
Total assets $ 23,074,176 $ 22,980,764 Liabilities
Non-life reserves $ 9,313,477 $ 9,710,457
Life and health reserves 2,510,238 2,490,474
Unearned premiums 2,378,993 1,818,999
Other reinsurance balances payable 339,531 292,077
Deposit liabilities 8,819 10,864
Net tax liabilities 131,083 154,947
Accounts payable, accrued expenses and other 302,855 302,021
Debt related to senior notes 1,358,082 1,384,824
Debt related to capital efficient notes 70,989 70,989
Total liabilities 16,414,067 16,235,652 Shareholders’ Equity
Common shares (par value $0.00000001; issued: 100,000,000 shares) — —
Preferred shares (par value $1.00; issued and outstanding: 28,169,062 shares; aggregate liquidation value: $704,227) 28,169
28,169
Additional paid-in capital 2,396,530 2,396,530
Accumulated other comprehensive loss (132,414 ) (90,281 ) Retained earnings 4,367,824 4,410,694
Total shareholders’ equity 6,660,109 6,745,112 Total liabilities and shareholders’ equity $ 23,074,176 $ 22,980,764

9
PartnerRe Ltd. Condensed Consolidated Statements of Cash Flows
(Expressed in thousands of U.S. dollars) (Unaudited)
For the three months ended For the six months ended
June 30, 2018 June 30, 2017 June 30, 2018 June 30, 2017 Net cash provided by operating activities $ 127,036 $ 128,492 $ 91,354 $ 127,600
Net cash used in investing activities (852,764 ) (637,574 ) (883,905 ) (552,059 ) Net cash used in financing activities (11,604 ) (243,734 ) (71,043 ) (255,337 ) Effect of foreign exchange rate changes on cash 15,461 19,455 24,837 24,597
Decrease in cash and cash equivalents (721,871 ) (733,361 ) (838,757 ) (655,199 ) Cash and cash equivalents - beginning of period 1,655,126 1,851,490 1,772,012 1,773,328
Cash and cash equivalents - end of period $ 933,255 $ 1,118,129 $ 933,255 $ 1,118,129

10
PartnerRe Ltd. Consolidated Statements of Comprehensive Income (Loss)
(Expressed in thousands of U.S. dollars) (Unaudited)
For the three months ended For the six months ended
June 30, 2018 June 30, 2017 June 30, 2018 June 30, 2017
Net income $ 136,318 $ 202,768 $ 28,172 $ 252,571
Change in currency translation adjustment (27,125 ) (11,775 ) (42,099 ) (25,142 ) Change in net unrealized gains or losses on investments, net of tax (73 ) (76 ) (148 ) (153 ) Change in unfunded pension obligation, net of tax 1,359 (1,359 ) 114 (2,262 ) Comprehensive income (loss) $ 110,479 $ 189,558 $ (13,961 ) $ 225,014

11
PartnerRe Ltd. Segment Information
(Expressed in millions of U.S. dollars, except percentages) (Unaudited)
For the three months ended June 30, 2018
P&C
segment Specialty segment
Total Non-life
Life and Health
segment Corporate and Other Total
Gross premiums written $ 623 $ 627 $ 1,250 $ 427 $ — $ 1,677 Net premiums written $ 579 $ 571 $ 1,150 $ 411 $ — $ 1,561 Increase in unearned premiums (80 ) (24 ) (104 ) (2 ) — (106 ) Net premiums earned $ 499 $ 547 $ 1,046 $ 409 $ — $ 1,455 Losses and loss expenses (336 ) (349 ) (685 ) (355 ) — (1,040 ) Acquisition costs (124 ) (146 ) (270 ) (36 ) — (306 ) Technical result $ 39 $ 52 $ 91 $ 18 $ — $ 109 Other income — — — 3 1 4 Other expenses (17 ) (9 ) (26 ) (17 ) (34 ) (77 ) Underwriting result $ 22 $ 43 $ 65 $ 4 n/a $ 36 Net investment income 16 89 105 Allocated underwriting result $ 20 n/a n/a Net realized and unrealized investment losses (74 ) (74 ) Interest expense (11 ) (11 ) Amortization of intangible assets (6 ) (6 ) Net foreign exchange gains 84 84 Income tax expense (9 ) (9 ) Interest in earnings of equity method investments 11 11 Net income n/a $ 136 Loss ratio (1) 67.3 % 63.7 % 65.5 % Acquisition ratio (2) 24.9 26.7 25.8 Technical ratio (3) 92.2 % 90.4 % 91.3 % Other expense ratio (4) 3.4 1.6 2.5 Combined ratio (5) 95.6 % 92.0 % 93.8 % For the three months ended June 30, 2017
P&C
segment Specialty segment
Total Non-life
Life and Health
segment Corporate and Other Total
Gross premiums written $ 618 $ 484 $ 1,102 $ 358 $ — $ 1,460 Net premiums written $ 526 $ 428 $ 954 $ 344 $ — $ 1,298 Increase in unearned premiums (74 ) (6 ) (80 ) (1 ) — (81 ) Net premiums earned $ 452 $ 422 $ 874 $ 343 $ — $ 1,217 Losses and loss expenses (281 ) (208 ) (489 ) (317 ) — (806 ) Acquisition costs (129 ) (121 ) (250 ) (38 ) — (288 ) Technical result $ 42 $ 93 $ 135 $ (12 ) $ — $ 123 Other income — — — 3 1 4 Other expenses (19 ) (8 ) (27 ) (18 ) (45 ) (90 ) Underwriting result $ 23 $ 85 $ 108 $ (27 ) n/a $ 37 Net investment income 14 89 103 Allocated underwriting result $ (13 ) n/a n/a Net realized and unrealized investment gains 129 129 Interest expense (11 ) (11 ) Amortization of intangible assets (6 ) (6 ) Net foreign exchange losses (29 ) (29 ) Income tax expense (22 ) (22 ) Interest in earnings of equity method investments 2 2 Net income n/a $ 203 Loss ratio (1) 62.2 % 49.4 % 56.0 % Acquisition ratio (2) 28.6 28.5 28.6 Technical ratio (3) 90.8 % 77.9 % 84.6 % Other expense ratio (4) 4.1 2.0 3.1 Combined ratio (5) 94.9 % 79.9 % 87.7 %
(1) Loss ratio is obtained by dividing losses and loss expenses by net premiums earned. (2) Acquisition ratio is obtained by dividing acquisition costs by net premiums earned. (3) Technical ratio is defined as the sum of the loss ratio and the acquisition ratio. (4) Other expense ratio is obtained by dividing other expenses by net premiums earned. (5) Combined ratio is defined as the sum of the technical ratio and the other expense ratio.
12
PartnerRe Ltd. Segment Information
(Expressed in millions of U.S. dollars, except percentages) (Unaudited)
For the six months ended June 30, 2018
P&C
segment Specialty segment
Total Non-life
Life and Health
segment Corporate and Other Total
Gross premiums written $ 1,519 $ 1,131 $ 2,650 $ 832 $ — $ 3,482 Net premiums written $ 1,352 $ 996 $ 2,348 $ 795 $ — $ 3,143 Increase in unearned premiums (374 ) (106 ) (480 ) (4 ) — (484 ) Net premiums earned $ 978 $ 890 $ 1,868 $ 791 $ — $ 2,659 Losses and loss expenses (660 ) (533 ) (1,193 ) (675 ) — (1,868 ) Acquisition costs (262 ) (253 ) (515 ) (75 ) — (590 ) Technical result $ 56 $ 104 $ 160 $ 41 $ — $ 201 Other income — — — 7 2 9 Other expenses (36 ) (15 ) (51 ) (30 ) (83 ) (164 ) Underwriting result $ 20 $ 89 $ 109 $ 18 n/a $ 46 Net investment income 32 176 208 Allocated underwriting result $ 50 n/a n/a Net realized and unrealized investment losses (296 ) (296 ) Interest expense (22 ) (22 ) Amortization of intangible assets (12 ) (12 ) Net foreign exchange gains 70 70 Income tax benefit 6 6 Interest in earnings of equity method investments 28 28 Net income n/a $ 28 Loss ratio 67.5 % 59.9 % 63.9 % Acquisition ratio 26.8 28.4 27.6 Technical ratio 94.3 % 88.3 % 91.5 % Other expense ratio 3.7 1.7 2.8 Combined ratio 98.0 % 90.0 % 94.3 % For the six months ended June 30, 2017
P&C
segment Specialty segment
Total Non-life
Life and Health
segment Corporate and Other Total
Gross premiums written $ 1,344 $ 952 $ 2,296 $ 666 $ — $ 2,962 Net premiums written $ 1,170 $ 837 $ 2,007 $ 643 $ — $ 2,650 Increase in unearned premiums (311 ) (58 ) (369 ) (11 ) — (380 ) Net premiums earned $ 859 $ 779 $ 1,638 $ 632 $ — $ 2,270 Losses and loss expenses (568 ) (437 ) (1,005 ) (569 ) — (1,574 ) Acquisition costs (219 ) (223 ) (442 ) (70 ) — (512 ) Technical result $ 72 $ 119 $ 191 $ (7 ) $ — $ 184 Other income 1 — 1 6 — 7 Other expenses (39 ) (17 ) (56 ) (31 ) (93 ) (180 ) Underwriting result $ 34 $ 102 $ 136 $ (32 ) n/a $ 11 Net investment income 27 174 201 Allocated underwriting result $ (5 ) n/a n/a Net realized and unrealized investment gains 152 152 Interest expense (21 ) (21 ) Amortization of intangible assets (12 ) (12 ) Net foreign exchange losses (66 ) (66 ) Income tax expense (23 ) (23 ) Interest in earnings of equity method investments 10 10 Net income n/a $ 252 Loss ratio 66.2 % 56.0 % 61.3 % Acquisition ratio 25.5 28.6 27.0 Technical ratio 91.7 % 84.6 % 88.3 % Other expense ratio 4.4 2.3 3.4 Combined ratio 96.1 % 86.9 % 91.7 %
Supplementary Financial Information
13
PartnerRe Ltd.
Investment Portfolio (Expressed in millions of U.S. dollars, except percentages)
(Unaudited)
June 30, 2018 December 31, 2017 Investments: Fixed maturities
U.S. government $ 2,060 13 % $ 2,184 15 % U.S. government sponsored enterprises 2 — 22 — U.S. states, territories and municipalities 138 1 690 5 Non-U.S. sovereign government, supranational and government related 2,073 14 1,751 12 Corporate bonds 6,293 41 6,129 41 Mortgage/asset-backed securities 2,257 15 1,879 13 Total fixed maturities 12,823 84 12,655 86
Short-term investments 131 1 4 — Equities 726 5 639 4 Investments in real estate 81 — 83 1 Other invested assets 1,467 10 1,385 9 Total investments $ 15,228 100 % $ 14,766 100 % Cash and cash equivalents 933 1,772 Total investments and cash and cash equivalents 16,161 16,538 Maturity distribution: One year or less $ 524 4 % $ 280 2 % More than one year through five years 4,679 36 4,259 34 More than five years through ten years 4,103 32 4,126 32 More than ten years 1,391 11 2,115 17 Subtotal 10,697 83 10,780 85 Mortgage/asset-backed securities 2,257 17 1,879 15 Total fixed maturities and short-term investments $ 12,954 100 % $ 12,659 100 % Credit quality by market value (Total fixed maturities and short-term investments): AAA $ 1,102 9 % $ 902 7 % AA 5,492 42 5,530 44 A 2,706 21 2,603 21 BBB 3,357 26 3,310 26 Below Investment Grade/Unrated 297 2 314 2 $ 12,954 100 % $ 12,659 100 % Expected average duration (1) 4.9 Yrs 4.7 Yrs Average yield to maturity at market (1) 3.3 % 2.8 % Average credit quality A A
(1) Includes funds holding fixed income securities that are classified with equities on the Consolidated Balance Sheets and futures used for the purpose of hedging duration

Supplementary Financial Information
14
PartnerRe Ltd. Distribution of Corporate Bonds
(Expressed in thousands of U.S. dollars, except percentages) (Unaudited)
June 30, 2018
Fair Value Percentage of Fair Value of
Corporate Bonds Percentage to
Invested Assets and cash
Largest single issuer as a percentage of
Invested Assets and cash
Distribution by sector - Corporate bonds Consumer noncyclical $ 1,392,705 22.1 % 8.6 % 1.4 % Finance 1,183,479 18.8 7.3 0.9 Industrials 628,653 10.0 3.9 0.3 Energy 573,698 9.1 3.6 0.3 Consumer cyclical 515,663 8.2 3.2 0.7 Insurance 502,547 8.0 3.1 0.7 Communications 446,159 7.1 2.8 0.6 Real estate investment trusts 297,995 4.7 1.3 0.4 Utilities 273,607 4.3 2.2 0.1 Basic materials 267,148 4.2 1.7 0.3 Technology 117,921 1.9 0.7 0.2 Government guaranteed corporate debt 66,789 1.1 0.4 0.4 Longevity and mortality bonds 21,615 0.4 0.1 0.1 Catastrophe bonds 3,555 0.1 — — Diversified 1,081 — — — Total Corporate bonds $ 6,292,615 100.0 % 38.9 %
Finance sector - Corporate bonds Banks $ 678,321 10.8 % 4.2 % Investment banking and brokerage 273,706 4.3 1.7 Financial services 141,853 2.3 0.9 Other 89,599 1.4 0.5 Total finance sector - Corporate bonds $ 1,183,479 18.8 % 7.3 %
AAA AA A BBB Non-Investment Grade/Unrated Total
Credit quality of finance sector - Corporate bonds Banks $ — $ 9,282 $ 402,230 $ 266,809 $ — $ 678,321 Investment banking and brokerage — 13,087 65,871 194,747 1 273,706 Financial services 1,180 70,045 19,477 50,010 1,141 141,853 Other — 3,588 43,101 42,910 — 89,599 Total finance sector - Corporate bonds $ 1,180 $ 96,002 $ 530,679 $ 554,476 $ 1,142 $ 1,183,479 % of total 0.1 % 8.1 % 44.8 % 46.9 % 0.1 % 100.0 %
Concentration of investment risk - The top 10 Corporate bond issuers account for 18.8% of the Company’s total corporate bonds. The single largest issuer accounts for 3.6% of the Company’s total Corporate bonds and is included in the consumer noncyclical sector above.

Supplementary Financial Information
15
PartnerRe Ltd. Analysis of Non-Life Reserves
(Expressed in thousands of U.S. dollars) (Unaudited)
As at and for the three months ended As at and for the six months ended
June 30, 2018 June 30, 2017 June 30, 2018 June 30, 2017
Reconciliation of beginning and ending non-life reserves: Gross liability at beginning of period $ 9,613,443 $ 9,044,854 $ 9,710,457 $ 8,985,434
Reinsurance recoverable at beginning of period (611,612 ) (273,860 ) (688,680 ) (266,742 ) Net liability at beginning of period 9,001,831 8,770,994 9,021,777 8,718,692 Net incurred losses related to:
Current year 713,232 599,822 1,263,117 1,200,895
Prior years (28,668 ) (110,123 ) (69,730 ) (196,185 )
684,564 489,699 1,193,387 1,004,710 Change in reserve agreement (1) — (6 ) 6,572 7,494
Net losses paid (686,725 ) (564,735 ) (1,331,024 ) (1,136,297 ) Effects of foreign exchange rate changes (243,391 ) 173,086 (134,433 ) 274,439
Net liability at end of period 8,756,279 8,869,038 8,756,279 8,869,038 Reinsurance recoverable at end of period 557,198 327,428 557,198 327,428
Gross liability at end of period $ 9,313,477 $ 9,196,466 $ 9,313,477 $ 9,196,466 Breakdown of gross liability at end of period: Case reserves $ 4,114,821 $ 4,063,374 $ 4,114,821 $ 4,063,374
Additional case reserves 170,978 159,895 170,978 159,895
Incurred but not reported reserves 5,027,678 4,973,197 5,027,678 4,973,197
Gross liability at end of period $ 9,313,477 $ 9,196,466 $ 9,313,477 $ 9,196,466 Gross liability at end of period by Non-life segment: P&C 6,500,456 6,305,478 6,500,456 6,305,478
Specialty 2,813,021 2,890,988 2,813,021 2,890,988
Gross liability at end of period $ 9,313,477 $ 9,196,466 $ 9,313,477 $ 9,196,466 Unrecognized time value of non-life reserves (2) $ 662,901 $ 472,683 $ 662,901 $ 472,683 Non-life paid loss ratio data: Non-life paid losses to incurred losses ratio 100.3 % 115.3 % 111.5 % 113.1 % Non-life paid losses to net premiums earned ratio 65.6 % 64.6 % 71.3 % 69.4 %
(1) The change in the reserve agreement is due to (adverse) favorable development on Paris Re’s reserves which are guaranteed by Axa under the reserve agreement. (2) The unrecognized time value, or discount, is the difference between the undiscounted liability for non-life reserves recorded and the discounted amount of these reserves. This discount is
calculated by applying appropriate risk-free rates by currency and duration to the underlying non-life reserves.

Supplementary Financial Information
16
PartnerRe Ltd. Analysis of Life and Health Reserves (Expressed in thousands of U.S. dollars)
(Unaudited)
As at and for the three months ended As at and for the six months ended
June 30, 2018 June 30, 2017 June 30, 2018 June 30, 2017
Reconciliation of beginning and ending life and health reserves: Gross liability at beginning of period $ 2,571,678 $ 2,069,083 $ 2,490,474 $ 1,984,096
Reinsurance recoverable at beginning of period (37,969 ) (29,585 ) (40,605 ) (31,372 ) Net liability at beginning of period 2,533,709 2,039,498 2,449,869 1,952,724
Liability acquired related to the acquisition of Aurigen — 67,916 — 67,916
Net incurred losses 355,030 316,717 675,102 568,855
Net losses paid (312,603 ) (263,802 ) (599,129 ) (472,405 ) Effects of foreign exchange rate changes (115,159 ) 75,953 (64,865 ) 119,192
Net liability at end of period 2,460,977 2,236,282 2,460,977 2,236,282
Reinsurance recoverable at end of period 49,261 35,041 49,261 35,041
Gross liability at end of period $ 2,510,238 $ 2,271,323 $ 2,510,238 $ 2,271,323
Life value in force(1) $ 331,000 $ 255,500
$ 331,000
$ 255,500
(1) The life value in force (Life VIF) is the present value of the profits that will emerge from life policies over time and is comprised of the present value of future after-tax profits, and takes into
consideration the cost of capital. The Company’s Life VIF is calculated on a going concern basis and is the sum of (i) present value of future profits on a U.S. GAAP basis which represents the net present value of projected after-tax cash flows based on Life reserves, net of deferred acquisition costs and gross of value of business acquired; (ii) cost of non-hedgeable risks; (iii) frictional costs; (iv) time value of options and guarantees; and (v) cost of non-economic excess encumbered capital.
Supplementary Financial Information
17
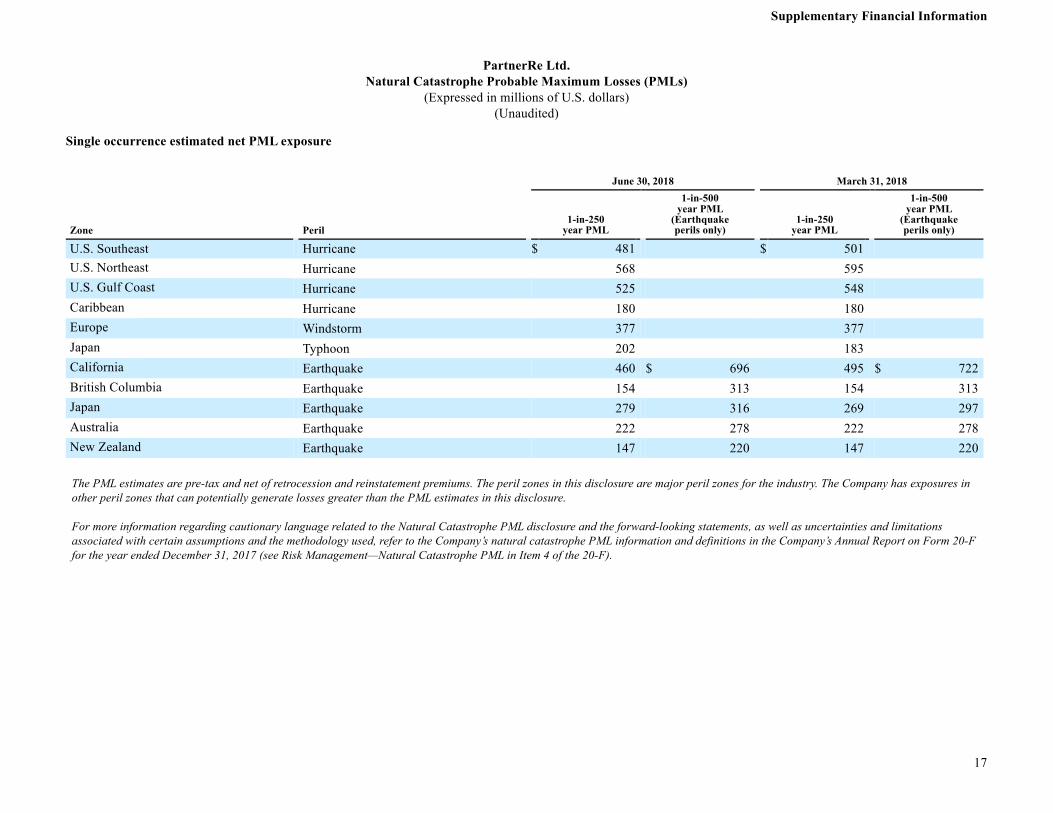
PartnerRe Ltd. Natural Catastrophe Probable Maximum Losses (PMLs)
(Expressed in millions of U.S. dollars) (Unaudited)
Single occurrence estimated net PML exposure
June 30, 2018 March 31, 2018
Zone Peril 1-in-250
year PML
1-in-500 year PML
(Earthquake perils only)
1-in-250 year PML
1-in-500 year PML
(Earthquake perils only)
U.S. Southeast Hurricane $ 481 $ 501 U.S. Northeast Hurricane 568 595 U.S. Gulf Coast Hurricane 525 548 Caribbean Hurricane 180 180 Europe Windstorm 377 377 Japan Typhoon 202 183 California Earthquake 460 $ 696 495 $ 722
British Columbia Earthquake 154 313 154 313
Japan Earthquake 279 316 269 297
Australia Earthquake 222 278 222 278
New Zealand Earthquake 147 220 147 220
The PML estimates are pre-tax and net of retrocession and reinstatement premiums. The peril zones in this disclosure are major peril zones for the industry. The Company has exposures in other peril zones that can potentially generate losses greater than the PML estimates in this disclosure. For more information regarding cautionary language related to the Natural Catastrophe PML disclosure and the forward-looking statements, as well as uncertainties and limitations associated with certain assumptions and the methodology used, refer to the Company’s natural catastrophe PML information and definitions in the Company’s Annual Report on Form 20-F for the year ended December 31, 2017 (see Risk Management—Natural Catastrophe PML in Item 4 of the 20-F).

Supplementary Financial Information
18
PartnerRe Ltd. Return on Common Shareholder's Equity (ROE)
(in thousands of U.S. dollars, except percentages) (Unaudited)
For the three months ended For the six months ended
June 30, 2018 June 30, 2017 June 30, 2018 June 30, 2017
$ ROE(1) $ ROE(1) $ ROE(1) $ ROE(1)
Net income available to common shareholder 124,714 8.4 % 191,164 12.6 % 4,964 0.2 % 229,363 7.6 %
(1) ROE is calculated as net income or loss attributable to common shareholder divided by average common shareholder's equity, annualized for the period. Average common shareholder's equity is calculated using the sum of the beginning of period and end of period common shareholder's equity divided by two.
For the three months ended For the six months ended
Calculation of average common shareholder's equity June 30, 2018 June 30, 2017 June 30, 2018 June 30, 2017
Beginning of period common shareholder's equity 5,857,007 6,007,536 6,040,885 5,983,685
End of period common shareholder's equity 5,955,882 6,160,491 5,955,882 6,160,491
Average common shareholder's equity 5,906,445 6,084,014 5,998,384 6,072,088
Supplementary Financial Information
19
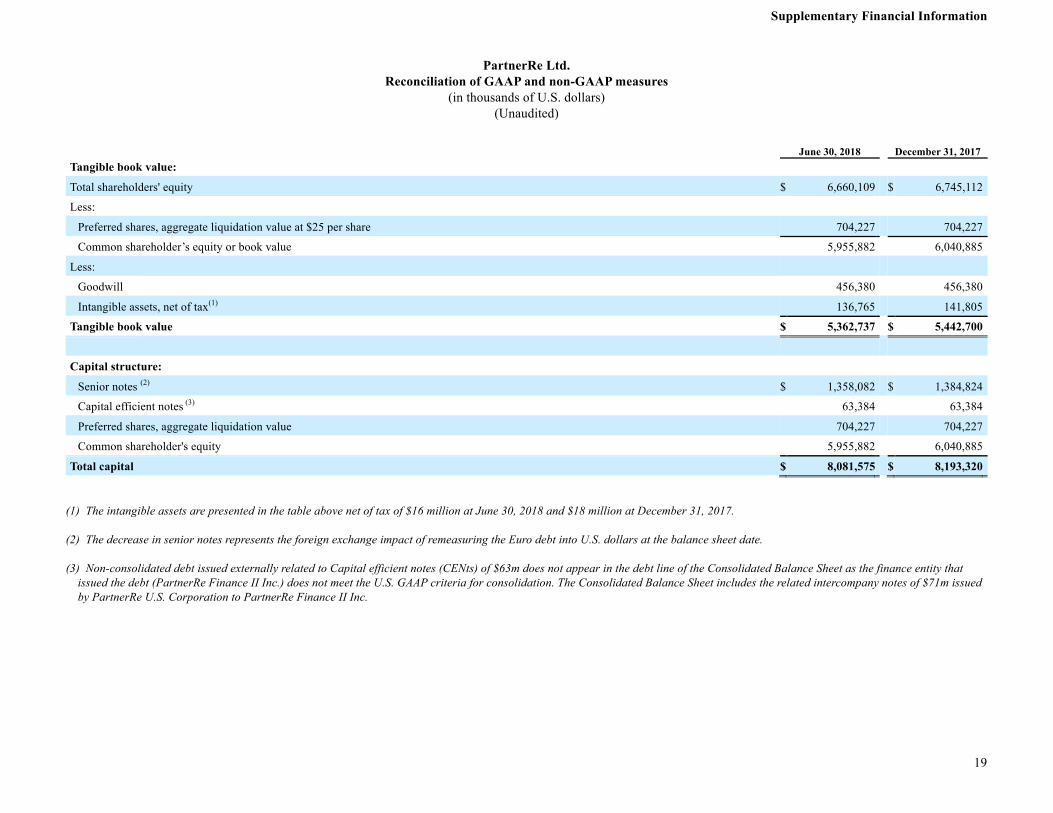
PartnerRe Ltd. Reconciliation of GAAP and non-GAAP measures
(in thousands of U.S. dollars) (Unaudited)
June 30, 2018 December 31, 2017 Tangible book value: Total shareholders' equity $ 6,660,109 $ 6,745,112
Less: Preferred shares, aggregate liquidation value at $25 per share 704,227 704,227
Common shareholder’s equity or book value 5,955,882 6,040,885
Less: Goodwill 456,380 456,380
Intangible assets, net of tax(1) 136,765 141,805
Tangible book value $ 5,362,737 $ 5,442,700
Capital structure:
Senior notes (2) $ 1,358,082 $ 1,384,824
Capital efficient notes (3) 63,384 63,384
Preferred shares, aggregate liquidation value 704,227 704,227
Common shareholder's equity 5,955,882 6,040,885
Total capital $ 8,081,575 $ 8,193,320 (1) The intangible assets are presented in the table above net of tax of $16 million at June 30, 2018 and $18 million at December 31, 2017. (2) The decrease in senior notes represents the foreign exchange impact of remeasuring the Euro debt into U.S. dollars at the balance sheet date. (3) Non-consolidated debt issued externally related to Capital efficient notes (CENts) of $63m does not appear in the debt line of the Consolidated Balance Sheet as the finance entity that
issued the debt (PartnerRe Finance II Inc.) does not meet the U.S. GAAP criteria for consolidation. The Consolidated Balance Sheet includes the related intercompany notes of $71m issued by PartnerRe U.S. Corporation to PartnerRe Finance II Inc.