Embed Size (px)
Citation preview

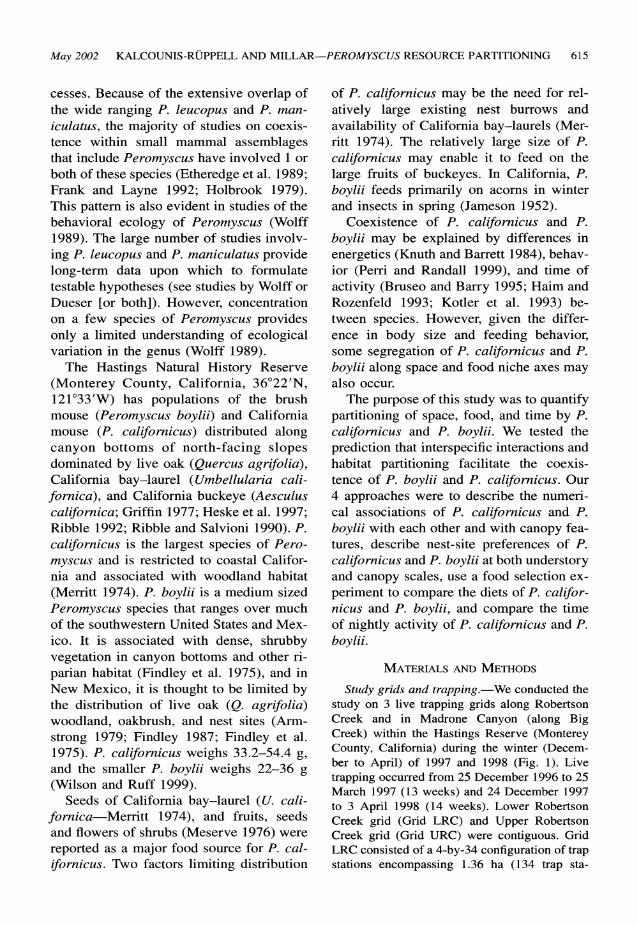
Journal of Mammalogy, 83(2):614-625, 2002
PARTITIONING OF SPACE, FOOD, AND TIME BY SYNTOPIC PEROMYSCUS BOYLII AND P. CALIFORNICUS
MATINA C. KALCOUNIS-ROPPELL* AND JOHN S. MILLAR
Ecology and Evolution Group, Zoology Department, University of Western Ontario, London, Ontario N6A 5B7
Present address of MCK-R: Museum of Vertebrate Zoology, 3101 Valley Life Sciences Building, University of California, Berkeley, CA 94720
We used trap associations, nest-site preferences, a food selection experiment, and measure- ments of nightly activity to describe resource partitioning by syntopic Peromyscus califor- nicus and P. boylii in Monterey County, California. P. californicus and P. boylii were active over the same range of time during the night. P. boylii was caught frequently near Quercus agrifolia, nested under canopies with high densities of Q. agrifolia, and consumed more Q. agrifolia acorns than P. californicus. Relative to P. boylii, P. californicus was a habitat generalist that did not discriminate among canopy plants for nest sites and had a broad diet. At high densities of P. californicus, the 2 species were negatively numerically associated. Both interspecific interactions and habitat partitioning (canopy level), via the specialization of P. boylii on Q. agrifolia, appear to facilitate the coexistence of P. boylii and P. californicus.
Key words: coexistence, diet, habitat, nest sites, Peromyscus californicus, P. boylii, resource par- titioning, scale, time of activity
Ecological niches of coexisting animals may be separated in 3 principal dimensions, time, space, and food (Pianka 1973; Schoe- ner 1974). In general, studies of resource partitioning within vertebrate guilds attempt to determine mechanisms underlying com- munity structure by quantifying niche di- mensions and overlap of component species (e.g., reptiles-Pianka 1973; mammals-- Grant 1972; birds-Cody 1985).
Related sympatric species are especially valuable in studies of resource partitioning because they are the most likely to be cur- rent or past competitors. Several studies of Peromyscus have quantified variation in re- source use between and among congeneric and confamilial species within a community (reviewed in Kaufman and Kaufman 1989). Although some studies have failed to find partitioning of resources among species
(Graves et al. 1988; Knuth and Barrett 1984; Newton et al. 1980; Wolff et al. 1985), the majority have demonstrated that Peromyscus species partition resources among each other or with other small mam- mals in the community along axes of food (Smartt 1978; Wolff and Dueser 1986) and space (Barry et al. 1990; Dooley and Dues- er 1996; Dueser and Hallett 1980; Ether- edge et al. 1989; Frank and Layne 1992; Galindo and Krebs 1985; Garman et al. 1994; Hallett et al. 1983; Harney and Dues- er 1987; Holbrook 1979; Morris 1983, 1984; Wolff and Dueser 1986; Wolff and Hurlbutt 1982; and those cited in Kaufman and Kaufman 1989).
Resource partitioning can be mediated by interspecific competition or differential habitat preference resulting from evolved preferences or results of past competitive exclusions. Studies that include Peromyscus have shown evidence of both of these pro- * Correspondent: [email protected]
614
***Reprinted with permission. No further reproduction is authorized without written permission from Allen Press and American Society of Mammalogists . This version of the document is not the version of record. Figures and/or pictures may be missing from this format of the document.*** *** Note: http://allenpress.com/ and http://www.mammalogy.org/
May 2002 KALCOUNIS-RUPPELL AND MILLAR-PEROMYSCUS RESOURCE PARTITIONING 615
cesses. Because of the extensive overlap of the wide ranging P. leucopus and P. man- iculatus, the majority of studies on coexis- tence within small mammal assemblages that include Peromyscus have involved 1 or both of these species (Etheredge et al. 1989; Frank and Layne 1992; Holbrook 1979). This pattern is also evident in studies of the behavioral ecology of Peromyscus (Wolff 1989). The large number of studies involv- ing P. leucopus and P. maniculatus provide long-term data upon which to formulate testable hypotheses (see studies by Wolff or Dueser [or both]). However, concentration on a few species of Peromyscus provides only a limited understanding of ecological variation in the genus (Wolff 1989).
The Hastings Natural History Reserve (Monterey County, California, 36022'N, 121'33'W) has populations of the brush mouse (Peromyscus boylii) and California mouse (P. californicus) distributed along canyon bottoms of north-facing slopes dominated by live oak (Quercus agrifolia), California bay-laurel (Umbellularia cali- fornica), and California buckeye (Aesculus californica; Griffin 1977; Heske et al. 1997; Ribble 1992; Ribble and Salvioni 1990). P. californicus is the largest species of Pero- myscus and is restricted to coastal Califor- nia and associated with woodland habitat (Merritt 1974). P. boylii is a medium sized Peromyscus species that ranges over much of the southwestern United States and Mex- ico. It is associated with dense, shrubby vegetation in canyon bottoms and other ri-
parian habitat (Findley et al. 1975), and in New Mexico, it is thought to be limited by the distribution of live oak (Q. agrifolia) woodland, oakbrush, and nest sites (Arm- strong 1979; Findley 1987; Findley et al. 1975). P. californicus weighs 33.2-54.4 g, and the smaller P. boylii weighs 22-36 g (Wilson and Ruff 1999).
Seeds of California bay-laurel (U. cali- fornica-Merritt 1974), and fruits, seeds and flowers of shrubs (Meserve 1976) were reported as a major food source for P. cal- ifornicus. Two factors limiting distribution
of P. californicus may be the need for rel-
atively large existing nest burrows and
availability of California bay-laurels (Mer- ritt 1974). The relatively large size of P. californicus may enable it to feed on the large fruits of buckeyes. In California, P. boylii feeds primarily on acorns in winter and insects in spring (Jameson 1952).
Coexistence of P. californicus and P. boylii may be explained by differences in energetics (Knuth and Barrett 1984), behav- ior (Perri and Randall 1999), and time of activity (Bruseo and Barry 1995; Haim and Rozenfeld 1993; Kotler et al. 1993) be- tween species. However, given the differ- ence in body size and feeding behavior, some segregation of P. californicus and P. boylii along space and food niche axes may also occur.
The purpose of this study was to quantify partitioning of space, food, and time by P. californicus and P. boylii. We tested the prediction that interspecific interactions and habitat partitioning facilitate the coexis- tence of P. boylii and P. californicus. Our 4 approaches were to describe the numeri- cal associations of P. californicus and P. boylii with each other and with canopy fea- tures, describe nest-site preferences of P. californicus and P. boylii at both understory and canopy scales, use a food selection ex- periment to compare the diets of P. califor- nicus and P. boylii, and compare the time of nightly activity of P. californicus and P. boylii.
MATERIALS AND METHODS
Study grids and trapping.-We conducted the study on 3 live trapping grids along Robertson Creek and in Madrone Canyon (along Big Creek) within the Hastings Reserve (Monterey County, California) during the winter (Decem- ber to April) of 1997 and 1998 (Fig. 1). Live trapping occurred from 25 December 1996 to 25 March 1997 (13 weeks) and 24 December 1997 to 3 April 1998 (14 weeks). Lower Robertson Creek grid (Grid LRC) and Upper Robertson Creek grid (Grid URC) were contiguous. Grid LRC consisted of a 4-by-34 configuration of trap stations encompassing 1.36 ha (134 trap sta-

616 JOURNAL OF MAMMALOGY Vol. 83, No. 2
Madrone 6an2
62'"N, 18 3~46
e n
Gr
it erson
FIG. 1.-Topographic map of study area showing layout of Madrone Canyon and Rob- ertson Creek grids at the Hastings Reserve, Monterey County, California. Topographic lines show elevation in feet (1,600 feet is about 490 m; 1,800 feet about 550 m).
tions). Grid URC consisted of a 6-by-13 trap configuration and encompassed 0.78 ha (54 trap stations). One Sherman trap and one Longworth trap were used at each trap station on grids LRC and URC. The grids were trapped separately be- cause their topography and relief differed (Fig. 1), but despite these differences, some mice were trapped on both grids. Therefore, these 2
grids were treated as a single Robertson Creek
grid in some analyses. The Madrone Canyon grid (Grid MC) consisted of a 7-by-20 configu- ration of trap stations encompassing 1.40 ha (100 trap stations). One Sherman trap was used at each trap station on Grid MC. Thus, we had 3 study grids, 2 along Robertson Creek and 1 in Madrone Canyon along Big Creek.
All grid configurations had 10 m spacing, al-
though not every grid intersection was dry enough for a trap. Traps were baited with rolled oats and set at least weekly during the study to collect demographic and population data using standard individual mark and recapture tech-
niques. We sampled some grids twice weekly and occasionally trapped small portions of grids to recapture specific individuals for other studies (Table 1; Kalcounis-Riippell 2000). Because Grid RC was large, it was often trapped over 2
consecutive nights (half the grid sampled on each night).
We defined residents as individuals caught more than once with at least 7 days between 1st and last capture. We expressed density as the total number of residents during the trapping pe- riod divided by the area of the trapping grid. Trap saturation was the number of mice caught divided by the number of traps set on any given night.
Normality assumptions of parametric statistics were tested for all variables using the Kolmo-
gorov-Smirnov test for normality (Zar 1984) and Levene's test for homogeneity of variance (StatSoft, Inc. 1995). For all statistical analyses we used Statistica? 1998 edition software (StatSoft, Inc. 1995). Differences between
groups were considered to be statistically sig- nificant at P < 0.05 unless otherwise specified.
To determine species associations we used a
Spearman rank correlation (r) to correlate the number of captures of P. californicus and P. boylii at each trapping station (Barry et al. 1990) for each grid to test the null hypothesis that the
presence of one species does not affect the pres- ence of the other. We also used trap captures to test for canopy-level habitat associations. We
mapped and identified every canopy plant that reached >75% of canopy height (about 20 m) within the trapping grids. We determined the
canopy plant closest to each trap site. We used a contingency analysis (with a Bonferroni-cor- rected at = 0.008) to test the null hypothesis that the number of captures of P. californicus and P. boylii was not contingent on the species of can-
opy plant nearest to the trap station. The ex- pected number of captures for the analysis (null distribution) was the relative frequency of P.
californicus to P. boylii captures on a given grid in a given year (i.e., grid-level population fre-
quency). Locating and measuring nest sites.-We lo-
cated nest sites using radio telemetry on resident mice that were outfitted with a 1.15-g radiocollar (MD-2C, Holohil Systems Ltd., Carp, Ontario, Canada). We attempted to locate nest sites with- in 3 days of attaching radiocollars. In 1997 we outfitted 19 P. boylii (13 females, 6 males) and 11 P. californicus (7 females, 4 males). In 1998 we outfitted 29 P. boylii (18 females, 11 males) and 24 P. californicus (16 females, 8 males). If a radiocollared mouse nested at >1 site, we con- sidered these nests to be independent nest selec-
May 2002 KALCOUNIS-RUPPELL AND MILLAR-PEROMYSCUS RESOURCE PARTITIONING 617
tion events. In addition to nest sites found in 1997 and 1998, we included all known P. cali-
fornicus nest sites recorded by Gubernick and Teferi (2000) in 1996.
It was impossible to determine exact locations of the below-ground nests and exact type of nest these species used without disturbing the site. Therefore, nest sites were recorded as the sur- face point directly above the radiocollared mouse. Nest sites located and marked during 1996, 1997, and 1998 were measured from 15 March to 7 April 1998 to minimize variation caused by vegetation phenology and variation in eye calibration estimates of understory charac- teristics. We measured nest characteristics at 2
spatial scales, 1 of structure and cover, 1 m3 around the nest site (understory), and 1 of tree species and tree density, 12 m2 around the nest site (canopy).
We placed a 1-m2 quadrat, divided into 4 equal quadrants, on top of each nest site with the nest site in the center of the quadrat. In each quadrant, we estimated (to the nearest 5%) the percentage ground cover of leaf litter, branch lit- ter, rock, roots, dirt, sand, live vegetation, and the amount of physical cover 1 m above the nest site. Percentages were estimated by eye calibra- tion by the senior author. We also identified live plant species. The total number of plant species constituted species richness (S) for each site. At each nest site, we also determined the distance (m) to water and to the nearest tree of canopy height (about 20 m). Means of the 4 quadrants were used for all analyses involving understory variables.
For all grids, we mapped every canopy plant and nest site. We used this map to count the number and types of trees within 12 m2 of each nest site.
To test the prediction that mice select nest habitat, a random site, defined as any piece of ground potentially suitable for a mouse nest, within the defined trapping grid was selected for every nest site measured. A random site was identified as the nearest available site from a given nest site at a distance (0-50 m) and direc- tion (0-360') dictated from a table of random numbers. We measured characteristics of ran- dom sites in the same way as we measured nest- site characteristics.
We used multivariate analysis of variance (MANOVA; Wilks' h test statistic) to test for differences between nest and random sites and
canonical discriminant analysis to describe dif- ferences in habitat characteristics between nest and random sites of the mice (Green 1971; Ka- chigan 1991). Both canopy and understory var- iables were included in the canonical discrimi- nant analysis. Because sample size is important for ensuring stability of the canonical discrimi- nant analysis axes and we had relatively few P. californicus sites, we minimized the number of variables included in the canonical discriminant analysis (Williams and Titus 1988) by including only those variables that had the highest overall variation within and between groups. To illus- trate patterns of habitat characteristics for each group, 95% confidence ellipses were drawn around each group's mean on the first 2 canon- ical variates (Krzanowski 1989). Mahalanobis distance between each pair of groups in canon- ical variate space was used to illustrate differ- ences in average habitat characteristics between the groups.
Food selection behavior.-To investigate food selection patterns between P. californicus and P. boylii we conducted a food selection ex- periment (Knuth and Barrett 1984; Reese et al. 1997). Ten P. californicus and 12 P. boylii in- dividuals were involved in three to eight 5-day (X ? 1 SD = 5.5 + 1.4) trials during March- April 1998. The analyses were conducted on the mean trial values for each individual. The ex- periment took place in an outdoor enclosure at the study site using subjects and food collected from the study grids. Mice were housed individ- ually in plastic cages (12.5 by 17.0 by 28.0 cm) with hard-chip bedding, cotton, and water ad lib. Food reflected food types found cached in or around the openings of nest sites. Fruits of Q. agrifolia, A. californica, Heteromeles arbutifol- ia, and various mushroom species were found in or around P. californicus nest sites, whereas only fruits of Q. agrifolia were found in caches of P. boylii nests. No evidence of fruits of U. californica was found in or around P. califor- nicus nest sites or on the study grids. Thus, we presented mice with an excess of fruits of Q. agrifolia (about 60 g), A. californica (about 60 g), and H. arbutifolia (about 10 g) that we col- lected daily from the study grids. In addition, we presented mice with leaves of Ribes speciosum (about 20 leaves), commercially available mush- rooms (Agaricus, about 10 g), and as a source of protein, cat food (AvoCat" Irwindale, Cali- fornia, about 10 g).

618 JOURNAL OF MAMMALOGY Vol. 83, No. 2
For each 5-day trial, all food types were dried at room temperature for 5 days, weighed, mixed, and placed in a petri dish in the cage. At the end of each trial, food was removed, dried for 5 days at room temperature, and weighed. During each trial, 1-3 dishes of food were set in cages with- out mice to determine loss of mass because of
evaporation. Mice were weighed at the begin- ning and end of the experiment, and initial and final weights were compared with a paired t-test (Zar 1984). After correcting for mass loss due to evaporation, we calculated mass-specific daily intake by dividing the average total dry matter intake of each individual by body mass (Reese et al. 1997). We also calculated diet breadth (B-Levins 1968), diversity (H'-Shannon and Weaver 1949), evenness (J'-Pielou 1966), and
preference (I-Ivlev 1961) for each individual on uncorrected values of dry matter intake. Non- normal data and all indices were transformed with square-root (B, H', J') and arcsine (I) trans- formations. Differences between species for all indices were tested with a single-factor analysis of variance (ANOVA), and differences between mass-corrected consumption of food types be- tween species were tested with a 2-factor AN- OVA. Although the assumption of independence of observations is violated in food preference experiments (Lockwood 1998), we used ANO- VA to facilitate between species comparison.
Time of nightly activity.-Time of nightly ac- tivity was determined for P. californicus and P.
boylii using radio telemetry. In 1997 nightly ac- tivity of 10 P. boylii (7 female, 3 male) and 9 P. californicus (5 female, 4 male) was measured. In 1998 nightly activity of 23 (12 female, 11 male) P. boylii and 15 P. californicus (9 female, 6 male) was measured. We used departure time (the time when a mouse first left the nest in the evening), return time (the last time when the mouse returned to the nest in the morning), and activity range (total time elapsed from departure to return time on a given night) to define time of nightly activity. To record these parameters, we documented when the mice were present or absent at the nest by automated reception of ra- dio-transmitter signals. We used 3 Lotek SRX- 400 telemetry receivers with Event Log Version 3.6x W14 or W21 firmware and an ASP antenna switcher (Lotek Wireless, Newmarket, Ontario, Canada). We placed a 5-element Yagi antenna on each nest site and set the lowest possible gain that received the transmitter signal to ensure that
signals would be recorded only when the mouse was in the nest. We attempted to record a min- imum of 3 consecutive nights for each individ- ual. Receivers were set in the early afternoon before the 1st night of recording, and at mid- morning after the last night of recording logged data were downloaded to a laptop computer us- ing Host e3 software (Lotek Engineering Inc.).
We standardized departure and return times to time after sunset because the activity of noctur- nal mammals is correlated with nautical twilight (Bruseo and Barry 1995; Harland and Millar 1980), and absolute times change with sunset time over the period of study. All data were cor- rected to minutes after sunset for each day of the study with sunset times for the village of Carmel Valley, California (36029'N, 121'44'W), obtained from the United States Naval Obser- vatory Department of Astronomical Applica- tions. All data referring to absolute times are
presented as minutes after sunset. We used AN- OVA to test for differences between P. califor- nicus and P. boylii in time of nightly activity. Protocols were approved by the Animal Care and Use Committee of the University of Western Ontario.
RESULTS
We captured P. boylii 940 and 1,651 times and P. californicus 784 and 704 times in 1997 and 1998, respectively. The differ- ence in the number of captures between
years can be attributed to differences in the number of resident P. boylii between years, 42 versus 89 individuals/ha in 1997 and
1998, respectively. The number of resident P. californicus was 30 individuals/ha in 1997 and 29 individuals/ha in 1998. With the removal of those captures that were not
part of a grid census, the total number of
captures was 3,884 over 17,308 trap nights (Table 1). Overall, the pattern of trap satu- ration was similar in both years (Table 1). Differences in trap saturation between
years, especially on Grid LRC, can be at- tributed to the difference in the number of resident P. boylii.
Associations from trap captures.-The mean proportion of resident mice that were P. boylii on Grids LRC, UaRC, and MC were 0.80, 0.56, and 0.55, respectively.
May 2002 KALCOUNIS-RUPPELL AND MILLAR-PEROMYSCUS RESOURCE PARTITIONING 619
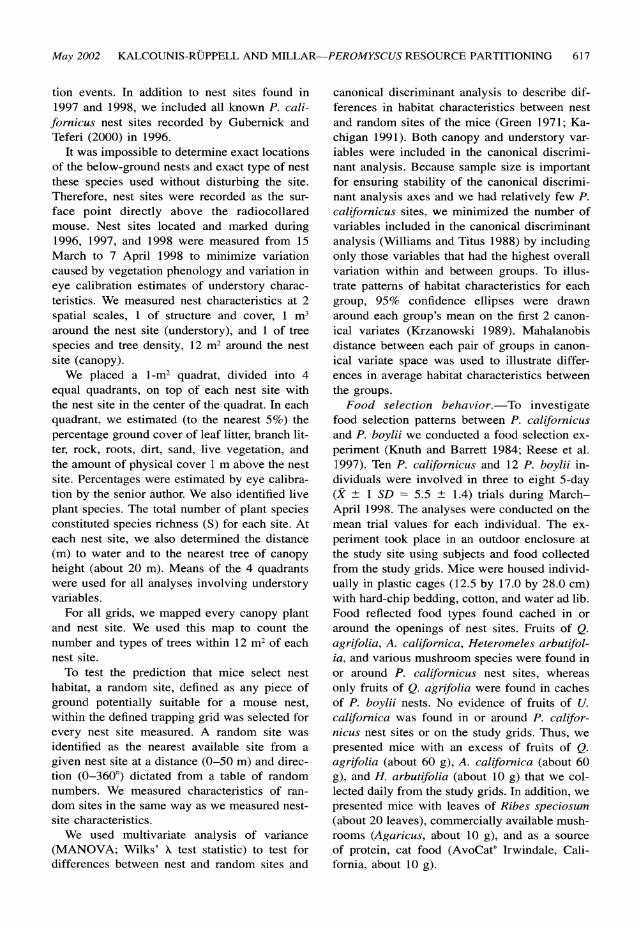
TABLE 1.-Peromyscus trapping details, by grid, during 1997 and 1998 at the Hastings Reserve (Monterey County, California). Percent saturation reflects the mean percent saturation over all nights that the grid was trapped. Nights when only small portions of the grid were trapped are excluded.
Percent saturation Percent saturation
Times Trap Total Percent saturation with P. boylii with P. californicus
Grid trapped nights captures X SD Range f SD Range X SD Range
1997
MC 18 1,800 457 25.4 10.0 11-40 5.9 3.8 0-12 19.8 8.2 5-32 LRC 18.5 5,044 935 20.7 9.2 4-48 14.5 7.0 3-33 6.2 3.7 1-15 URC 14 1,456 249 17.1 5.6 7-30 8.4 3.2 5-14 8.7 3.8 1-13
1998
MC 19 1,900 493 25.9 13.4 11-55 11.1 8.0 1-25 14.9 6.8 1-30 LRC 19.5 5,236 1,394 27.6 11.2 10-60 23.2 9.6 8-53 4.3 2.4 0-9 URC 18 1,872 356 19.0 5.2 11-34 10.5 3.9 4-23 8.5 7.7 2-18
Mean (+1 SD) times of residence on grids for P. boylii, the species more likely to ex- hibit population turnover, were 39.4 ? 25.0 days in 1997 and 47.0 ? 25.5 days in 1998. In addition, 78.1% in 1997 and 75.1% in 1998 of all new adult recaptures occurred in the 1st one-third of the field season. These values suggest a low rate of popu- lation turnover.
Patterns of association were similar be- tween years for each grid. A negative cor- relation was found in both years between species on Grid MC (r,997 = -0.42, d.f. =
90, P < 0.001; r1998 = -0.51, d.f = 95, P < 0.001) and Grid URC (r,997 = -0.40, d.f. = 52, P < 0.005; r,998 = -0.46, d.f = 52, P < 0.001), but no association existed in either year between P. californicus and P. boylii on Grid LRC (r,997 = -0.06, d.f =
124, P > 0.05; r1998 = -0.001, d.f = 126, P > 0.05).
The proportion of P. boylii and P. cali- fornicus captured at each trap station was contingent on the nearest tree species to the trap station on all 3 grids during both years, although patterns differed among grids and between years (Fig. 2). In general, the cap- ture of P. boylii was contingent on nearness to Quercus species, especially Q. agrifolia, whereas the capture of P. californicus was contingent on nearness to a relatively large range of tree species.
Nest sites.-Of the 61 P. boylii nest sites
(belonging to 43 individuals), 59 were lo- cated on Grid RC and 2 on Grid MC. Of the 32 P. californicus nest sites (belonging to 32 pairs of individuals) 14 were located on Grid RC and 18 on Grid MC. Because only 2 P. boylii nest sites were found on Grid MC, we only tested for differences be- tween P. californicus nest sites and random sites.
Nest sites of the 2 species on Grid RC were different (Wilks' X = 0.32, P < 0.0001). The first 2 canonical variates ac- counted for 96% of the among-group vari- ation (Table 2). The magnitude-of-structure coefficients on canonical variate 1 and ca- nonical variate 2 suggest that canonical var- iate 1 is an axis that describes understory characteristics, whereas canonical variate 2 describes canopy characteristics (Table 2; Fig. 3). We found no difference between the centroids of random sites of P. boylii and P. californicus (squared Mahalanobis dis- tance = 1.52, F = 1.51, d.f. = 10, 133, P > 0.05). Random sites of P. boylii and P. californicus overlapped in canonical habitat space, had a relatively open understory with little vegetation or ground cover by branch- es and moss, and a canopy of relatively low density of Q. agrifolia (Fig. 3). Relative to random sites, P. californicus nest sites had high vegetation and ground cover by branches and moss (squared Mahalanobis distance = 7.31, F = 12.48, d.f. = 10, 133,

620 JOURNAL OF MAMMALOGY Vol. 83, No. 2
500 -a 250 -
Qa d Pr Ac Pb Uc
Qa Bd Pr Ac Pb Uc
b 80
C Qa Bd Pb Am Uc Ac
O
c200 100 -
-
0- il no na .n nlI
Qa Ac Qi Pi Ha Uc
Tree species FIG. 2.-Number of captures of Peromyscus
boylii (black) and P. californicus (white) on a) Lower Robertson Creek, b) Upper Robertson Creek, and c) Madrone Canyon grids relative to the tree species nearest the trap stations at the Hastings Reserve, Monterey County, California. The 1st pair of bars for a tree species refers to 1997 and the 2nd pair to 1998. A single line above a bar indicates significant bias toward P. boylii and a double line significant bias toward P. californicus. Qa = Quercus agrifolia, Bd = Baccaris douglasii, Pr = Platanus racemosa, Ac = Aesculus californica, Pb = Populus balsam- ifera, Uc = Umbellularia californica, Am = Ar- butus menziesii, Ql = Q. lobata, Pi = Prunus ilicifolia, Ha = Heteromeles arbutifolia.
P < 0.001; Fig. 3). P. boylii nest sites were found under canopies with relatively high densities of Q. agrifolia (squared Mahal- anobis distance = 2.85, F = 7.73, d.f =
10, 133, P < 0.001; Fig. 3). Centroids of nest sites differed between the species (squared Mahalanobis distance = 9.36, F =
9.31, d.f = 10, 133, P < 0.001). In canon- ical habitat space, P. californicus nests were
TABLE 2.-Pooled within-class structure co- efficients for ecological variables from canonical discriminant analysis of nest and random sites for P. boylii and P. californicus on Grid RC (Monterey County, California). Relatively large coefficients are italicized. Relatively large nega- tive structure coefficients on canonical variate 1
corresponded to sites that had relatively high veg- etation and ground cover by branches and moss (S. bigelovii). Positive structure coefficients on canonical variate 2 corresponded to sites with rel- atively high densities of Q. agrifolia.
Canonical Canonical Variable variate 1 variate 2
Cover -0.36 0.43 Leaves 0.26 0.27 Branches -0.38 0.27 Rock 0.05 0.00 Sand 0.26 -0.32 Water -0.17 0.09 Tree 0.23 -0.25 Selaginella bigelovii -0.44 -0.01 Rubus ursinus 0.10 0.15 Quercus agrifolia 0.13 0.85
Eigenvalue 0.986 0.514
Proportion of variance 0.637 0.332
4 P. boyliinest CN 3 CS
- - - - - - - - - t
%,- P.
ca~fromcws o0 P. calffornicw random
0 -2
U•- 3 ' P. boylii random
-4 Moss, cover, branches/i m2
-5 -7 -6 -5 -4 -3 -2 -1 0 1 2 3 4 5
Canonical variate 1
FIG. 3.-Plot of the first 2 canonical variate axes for Peromyscus boylii and P. californicus nest sites (solid lines) and random sites (dotted lines) on Robertson Creek, Hastings Reserve, Monterey County, California. Ellipses represent the 95% confidence ellipses for the group's mean in canonical habitat space. The proportion of among-group variance explained by each axis is 63% for canonical variate 1 and 33% for ca- nonical variate 2 (Table 2). The ecological var- iables with relatively large structure coefficients (Table 2) are labeled on each axis with an arrow indicating the direction along the axis that they increase.

May 2002 KALCOUNIS-RUPPELL AND MILLAR--PEROMYSCUS RESOURCE PARTITIONING 621
TABLE 3.-Pooled within-class structure co- efficients for 7 habitat variables from canonical discriminant analysis of nest and random sites for P. californicus on Grid MC (Monterey County, California). Relatively large coefficients are italicized.
Canonical Variable variate 1
Cover -0.26 Leaves 0.40 Branches -0.46 Rock 0.37 Dirt 0.20 Selaginella bigelovii -0.54
Symphoricarpos albus -0.09
Eigenvalue 0.843 Proportion of variance 1.000
associated with canopies of relatively low Q. agrifolia density and had an understory with more vegetation and ground cover by branches and moss than P. boylii nests (Fig. 3).
We used the same variables in the Grid MC canonical discriminant analysis as in Grid RC, (Table 2), except for the exclusion of the uncommon sand and Rubus ursinus variables. We found no significant differ- ence on Grid MC between nest and random sites of P. californicus (Wilks' X = 0.59, P > 0.05). However, we observed a signifi- cant difference between nest and random sites of P. californicus (Wilks' X = 0.54, P < 0.01) when we included only variables that had relatively high overall variation within and between random and nest sites (Table 3). Negative scores on canonical var- iate 1 corresponded to sites that had rela- tively high vegetation and ground cover by branches and moss (Selaginella bigelovii). The means of the canonical variables for random and nest sites were 0.89 and -0.89, respectively, suggesting that P. californicus on Grid MC, like P. californicus on Grid RC, had nest sites with high vegetation and ground cover by branches and moss.
In our food selection experiment, both species of mice were maintained on the diet provided. No difference was observed be-
- 0.30
- 0.25
l P. boylii 0.25
--0- P. californicus to 0.20
0.15
S0.10 0.05
0.00 Q. agrifolia cat food H. arbutifolia
Agaricus A. californica Food item
FIG. 4.-Interaction plot of mass-specific food intake (gram of food per gram of mouse per day) of all diet items for Peromyscus boylii and P. californicus at the Hastings Reserve in Monte- rey County, California.
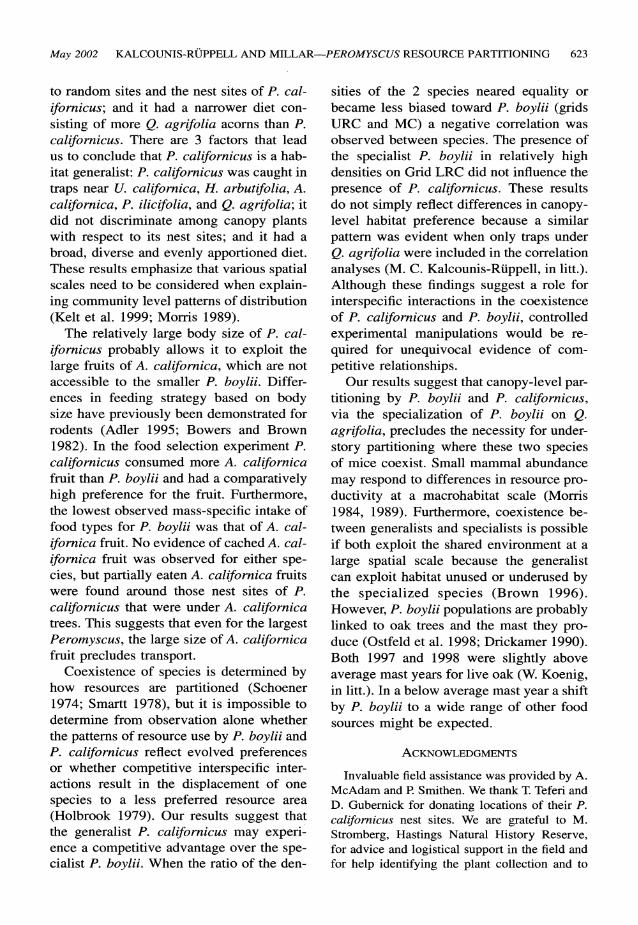
tween the 1st (X ? 1 SD = 24.8 ? 4.0 g) and last (26.5 ? 3.0 g) weights of 10 P. boylii in the experiment (2 individuals es- caped before being weighed at the end of the experiment; t = -1.24, d.f = 9, P > 0.05). Similarly, no difference was ob- served between the 1st (39.1 ? 4.2 g) and last (42.3 ? 4.1 g) weights of the 10 P. californicus (t = -3.28, d.f = 9, P < 0.01). Mice ate all food types presented, except the leaves of R. speciosum, which was not included in the diet analysis. We observed a significant interaction between species and mass-specific consumption of food type (F = 21.64, d.f = 4, 100, P < 0.001), with P. boylii consuming more Q. agrifolia than P. californicus and P. californicus consum- ing more A. californica than P. boylii (Fig. 4). P. californicus had a broader (F =
23.12, d.f = 1, 20, P < 0.001), more di- verse (F = 12.80, d.f = 1, 20, P < 0.005), and more evenly apportioned (F = 12.80, d.f = 1, 20, P < 0.005) diet than did P. boylii (Table 4). P. californicus had a com- paratively high preference for cat food (F = 18.67, d.f = 1, 20, P < 0.001) and fruit of A. californica (F = 9.83, d.f = 1, 20, P < 0.01).
In total, we recorded time of nightly ac- tivity on 237 nights from 57 radiocollared individuals (33 P. boylii and 24 P. califor- nicus). In 1997 and 1998, time of activity was recorded on 62 and 175 nights, respec-

622 JOURNAL OF MAMMALOGY Vol. 83, No. 2
TABLE 4.-Differences between diet indices of P. californicus (n = 10) and P. boylii (n = 12) as shown by the food selection experiment at the Hastings Reserve, Monterey County, California in 1998. Mean breadth (B), diversity (H'), evenness (J'), and preference (I) values for each food type are shown.
P. boylii P. californicus
Index X SD X SD
Breadth 1.63 0.30 2.41 0.47 Diversity 0.73 0.21 1.06 0.21 Evenness 0.55 0.16 0.80 0.16 Preference for Q. agrifolia 0.37 0.12 0.28 0.12 Preference for A. californica -0.72 0.28 -0.34 0.29 Preference for H. arbutifolia -0.05 0.58 -0.09 0.49 Preference for mushroom -0.18 0.48 0.08 0.34 Preference for cat food 0.29 0.15 0.53 0.10
tively. On average (?1 SD), 4.2 ? 1.8 nest attendance nights were recorded per indi- vidual (range 1-8). We observed no differ- ence between P. boylii and P. californicus in the range of time spent active during the night (F = 0.42, d.f = 1, 55, P > 0.05; 651.28 ? 86.51 min and 637.58 ? 67.51 min, respectively) or the time after sunset that mice finally returned from being active in the morning (F = 0.05, d.f = 1, 55, P > 0.05; 691.56 ?_ 71.83 min and 695.52 ? 57.99 min, respectively). In the evening, P. boylii departed approximately 18 min ear- lier than P. californicus (F = 4.11, d.f = 1, 55, P = 0.047; 40.28 ? 27.35 min and 57.93 ? 38.48 min after sunset, respective- ly).
DIscusSION
The coexistence of P. californicus and P. boylii is not facilitated by differences along the niche axis of time, as has been dem- onstrated for other rodents (Haim and Roz- enfeld 1993; Kotler et al. 1993). Apart from an earlier emergence by P. boylii, the tim- ing of the nocturnal activity of these 2 spe- cies is remarkably similar. These similari- ties probably reflect biotic constraints (pre- dation pressure, optimal foraging, and hor- mone-mediated activity levels) on activity that are similar for both species and likely affect the timing of activity of all Peromys- cuS.
Our results suggest that the coexistence of P. californicus and P. boylii is facilitated by differences along the niche axes of space and food. As predicted, interspecific inter- actions and habitat partitioning via the spe- cialization of P. boylii on Q. agrifolia fa- cilitate the coexistence of P. boylii and P. californicus at the Hastings Reserve. It is probable that the ability of P. californicus to eat the fruit of A. californica also facil- itates the coexistence of these two Pero- myscus species; however, this was not di- rectly tested and deserves further investi- gation.
At an understory scale, P. californicus and P. boylii preferred nest sites that had relatively high vegetation and ground cover. Densities of P. maniculatus and P. leucopus have been positively correlated with cover, such as logs and stumps because these pro- vide protection from predation and nesting sites (Bendell 1961; Crowell and Pimm 1976; Smith and Speller 1970), which translates into greater survival of both ju- veniles and adults (Van Horne 1982).
Despite similarity in nest requirements, P. californicus and P. boylii partition re- sources at the canopy level. There are 3 fac- tors that lead us to conclude that P. boylii is a specialist on Q. agrifolia: P. boylii was caught most frequently in traps that were near Q. agrifolia; it nested under canopies with high densities of Q. agrifolia relative
May 2002 KALCOUNIS-RUPPELL AND MILLAR--PEROMYSCUS RESOURCE PARTITIONING 623
to random sites and the nest sites of P. cal- ifornicus; and it had a narrower diet con- sisting of more Q. agrifolia acorns than P. californicus. There are 3 factors that lead us to conclude that P. californicus is a hab- itat generalist: P. californicus was caught in traps near U. californica, H. arbutifolia, A. californica, P. ilicifolia, and Q. agrifolia; it did not discriminate among canopy plants with respect to its nest sites; and it had a broad, diverse and evenly apportioned diet. These results emphasize that various spatial scales need to be considered when explain- ing community level patterns of distribution (Kelt et al. 1999; Morris 1989).
The relatively large body size of P. cal- ifornicus probably allows it to exploit the large fruits of A. californica, which are not accessible to the smaller P. boylii. Differ- ences in feeding strategy based on body size have previously been demonstrated for rodents (Adler 1995; Bowers and Brown 1982). In the food selection experiment P. californicus consumed more A. californica fruit than P. boylii and had a comparatively high preference for the fruit. Furthermore, the lowest observed mass-specific intake of food types for P. boylii was that of A. cal- ifornica fruit. No evidence of cached A. cal- ifornica fruit was observed for either spe- cies, but partially eaten A. californica fruits were found around those nest sites of P. californicus that were under A. californica trees. This suggests that even for the largest Peromyscus, the large size of A. californica fruit precludes transport.
Coexistence of species is determined by how resources are partitioned (Schoener 1974; Smartt 1978), but it is impossible to determine from observation alone whether the patterns of resource use by P. boylii and P. californicus reflect evolved preferences or whether competitive interspecific inter- actions result in the displacement of one species to a less preferred resource area (Holbrook 1979). Our results suggest that the generalist P. californicus may experi- ence a competitive advantage over the spe- cialist P. boylii. When the ratio of the den-
sities of the 2 species neared equality or became less biased toward P. boylii (grids URC and MC) a negative correlation was observed between species. The presence of the specialist P. boylii in relatively high densities on Grid LRC did not influence the presence of P. californicus. These results do not simply reflect differences in canopy- level habitat preference because a similar pattern was evident when only traps under Q. agrifolia were included in the correlation analyses (M. C. Kalcounis-Riippell, in litt.). Although these findings suggest a role for interspecific interactions in the coexistence of P. californicus and P. boylii, controlled experimental manipulations would be re- quired for unequivocal evidence of com- petitive relationships.
Our results suggest that canopy-level par- titioning by P. boylii and P. californicus, via the specialization of P. boylii on Q. agrifolia, precludes the necessity for under- story partitioning where these two species of mice coexist. Small mammal abundance may respond to differences in resource pro- ductivity at a macrohabitat scale (Morris 1984, 1989). Furthermore, coexistence be- tween generalists and specialists is possible if both exploit the shared environment at a large spatial scale because the generalist can exploit habitat unused or underused by the specialized species (Brown 1996). However, P. boylii populations are probably linked to oak trees and the mast they pro- duce (Ostfeld et al. 1998; Drickamer 1990). Both 1997 and 1998 were slightly above average mast years for live oak (W. Koenig, in litt.). In a below average mast year a shift by P. boylii to a wide range of other food sources might be expected.
ACKNOWLEDGMENTS
Invaluable field assistance was provided by A. McAdam and P. Smithen. We thank T. Teferi and D. Gubernick for donating locations of their P. californicus nest sites. We are grateful to M. Stromberg, Hastings Natural History Reserve, for advice and logistical support in the field and for help identifying the plant collection and to

624 JOURNAL OF MAMMALOGY Vol. 83, No. 2
W. Koenig for providing unpublished data. This study benefited from discussion with the Small Mammal Ecology Discussion Group at the Uni- versity of Western Ontario, and the manuscript was improved with comments from D. Ankney, R. Bailey, O. Riippell, and an anonymous re- viewer. This work was supported by Natural Sci- ence and Engineering Research Council of Can- ada (NSERC) operating and equipment grants to J. S. Millar and a NSERC Postgraduate schol- arship to M. C. Kalcounis-Riippell. Additional
support for M.C. Kalcounis-Riippell was provid- ed by Ontario Graduate Scholarships, the Uni- versity of Western Ontario, the Senior Women Academic Administrators of Canada, the Lums- den Fellowship, the Ontario Ministry of Training and Education, and the Ferguson Award in Life Sciences. This research complied with the Ca- nadian Council on Animal Care, and all field- work was completed under a California Fish and Game permit.
LITERATURE CITED
ADLER, G. H. 1995. Habitat relations within lowland grassland rodent communities in Taiwan. Journal of Zoology (London) 237:563-576.
ARMSTRONG, D. M. 1979. Ecological distribution of ro- dents in Canyonlands National Park, Utah. Great Basin Naturalist 39:199-205.
BARRY, R. E., JR., A. A. HEFT, AND T. E. BAUMMER. 1990. Spatial relationships of syntopic white-footed mice, Peromyscus leucopus, deer mice, P. manicu- latus, and red-backed voles, Clethrionomys gapperi. Canadian Field Naturalist 104:387-393.
BENDELL, J. F 1961. Some factors affecting the habitat selection of the white footed mouse. Canadian Field Naturalist 75:244-255.
BOWERS, M. A., AND J. H. BROWN. 1982. Body size and coexistence in desert rodents: chance or com- munity structure? Ecology 63:391-400.
BROWN, J. S. 1996. Co-evolution and community or- ganization in three habitats. Oikos 75:193-206.
BRUSEO, J. A., AND R. E. BARRY, JR. 1995. Temporal activity of syntopic Peromyscus in the central Ap- palachians. Journal of Mammalogy 76:78-82.
CODY, M. L. (ED.). 1985. Habitat selection in birds. Academic Press, San Diego, California.
CROWELL, K. L., AND S. L. PIMM. 1976. Competition and niche shifts of mice introduced onto small is- lands. Oikos 27:251-258.
DOOLEY, J. L., JR., and R. D. DUESER. 1996. Experi- mental tests of nest site competition in two Pero- myscus species. Oecologia 105:81-86.
DRICKAMER, L. D. 1990. Microhabitat preferences of two species of deermice (Peromyscus) in a north- eastern United States deciduous hardwood forest. Acta Theriologica 35:241-252.
DUESER, R. D., AND J. G. HALLETT. 1980. Competition and habitat selection in a forest-floor mammal fauna. Oikos 35:293-297.
ETHEREDGE, D. R., M. D. ENGSTROM, AND R. C. STONE, JR. 1989. Habitat discrimination between sympatric populations of Peromyscus attwateri and Peromys- cus pectoralis in west-central Texas. Journal of Mammalogy 70:300-307.
FINDLEY, J. S. 1987. The natural history of New Mex- ico mammals. University of New Mexico Press, Al- buquerque.
FINDLEY, J. S., A. H. HARRIS, D. E. WILSON, AND C. JONES. 1975. Mammals of New Mexico. University of New Mexico Press, Albuquerque.
FRANK, P. A., AND J. N. LAYNE. 1992. Nest and daytime refugia of cotton mice (Peromyscus gossypinus) and golden mice (Ochrotomys nuttalli) in South-central Florida. American Midland Naturalist 127:21-30.
GALINDO, C., AND C. J. KREBS. 1985. Habitat use and abundance of deer mice: interactions with meadow voles and red-backed voles. Canadian Journal of Zo- ology 63:1870-1879.
GARMAN, S. L., A. F O'CONNELL, JR., AND J. H. CON- NERY. 1994. Habitat use and distribution of the mice Peromyscus leucopus and P. maniculatus on Mount Desert Island, Maine. Canadian Field Naturalist 108: 67-71.
GRANT, P. R. 1972. Interspecific competition among rodents. Annual Review of Ecology and Systematics 3:79-106.
GRAVES, S., J. MALDONADO, AND J. O. WOLFF. 1988. Use of ground and arboreal microhabitats by Pero- myscus leucopus and Peromyscus maniculatus. Ca- nadian Journal of Zoology 66:277-278.
GREEN, R. H. 1971. A multivariate statistical approach to the Hutchinsonian niche: bivalve molluscs of cen- tral Canada. Ecology 52:543-556.
GRIFFIN, J. R. 1977. Oak woodland. Pp. 383-414 in Terrestrial vegetation of California (M. G. Barbour and J. Major, eds.). John Wiley & Sons, Inc., New York.
GUBERNICK, D. J., AND T TEFERI. 2000. Adaptive sig- nificance of male parental care in a monogamous mammal. Proceedings of the Royal Society of Lon- don Series, B. Biological Sciences 267:147-150.
HAIM, A., AND E M. ROZENFELD. 1993. Temporal seg- regation in coexisting Acomys species: the role of odour. Physiology and Behavior 54:1159-1161.
HALLETr, J. G., M. A. O'CONNELL, AND R. L. HONEY- cuTT. 1983. Competition and habitat selection: test of a theory using small mammals. Oikos 40:175- 181.
HARLAND, R. M., AND J. S. MILLAR. 1980. Activity of breeding Peromyscus leucopus. Canadian Journal of Zoology 58:313-316.
HARNEY, B. A., AND R. D. DUESER. 1987. Vertical strat- ification of activity of two Peromyscus species: an experimental analysis. Ecology 68:1084-1091.
HESKE, E. J., D. L. ROSENBLATT, AND D. W. SUGG. 1997. Population dynamics of small mammals in an oak woodland-grassland-chaparral habitat mosaic. Southwestern Naturalist 42:1-12.
HOLBROOK, S. J. 1979. Habitat utilization, competitive interactions, and co-existence of three species of cri- cetine rodents in east-central Arizona. Ecology 60: 758-769.
IVLEV, V. A. 1961. Experimental ecology of the feed-

May 2002 KALCOUNIS-RUPPELL AND MILLAR-PEROMYSCUS RESOURCE PARTITIONING 625
ing of fishes. Yale University Press, New Haven, Connecticut.
JAMESON, E. W., JR. 1952. Food of deermice Peromys- cus maniculatus and Peromyscus boylii, in the Northern Sierra Nevada, California. Journal of Mammalogy 33:50-60.
KACHIGAN, S. K. 1991. Multivariate statistical analysis: a conceptual introduction. Radius Press, New York.
KALCOUNIS-ROPPELL, M. C. 2000. Breeding systems, habitat overlap, and activity patterns of monoga- mous and promiscuous mating in Peromyscus cali- fornicus and P. boylii. Ph.D. dissertation, University of Western Ontario, London, Canada.
KAUFMAN, D. W., AND G. A. KAUFMAN. 1989. Popu- lation biology. Pp. 233-271 in Advances in the study of Peromyscus (Rodentia) (G. Kirkland, JR. and J. Layne, eds.). Texas Tech University Press, Lubbock.
KELT, D. A., P. L. MESERVE, B. D. PATTERSON, AND B. K. LANG. 1999. Scale dependence and scale inde- pendence in habitat associations of small mammals in southern temperate rainforest. Oikos 85:320-334.
KNUTH, B. A., AND G. W. BARRETT. 1984. A compar- ative study of resource partitioning between Och- rotomys nuttalli and Peromyscus leucopus. Journal of Mammalogy 65:576-583.
KOTLER, B. P., J. S. BROWN, AND A. SUBACH. 1993. Mechanisms of species coexistence of optimal for- agers: temporal partitioning by two species of sand dune gerbils. Oikos 67:548-556.
KRZANOWSKI, W. J. 1989. On confidence regions in ca- nonical variate analysis. Biometrika 76:107-116.
LEVINS, R. 1968. Evolution in changing environments. Princeton University Press, Princeton, New Jersey.
LOCKWOOD, J. R., III. 1998. On the statistical analysis of multiple-choice feeding preference experiments. Oecologia 116:475-481.
MERRITT, J. F 1974. Factors influencing the local dis- tribution of Peromyscus californicus in Northern California. Journal of Mammalogy 55:102-113.
MESERVE, P. L. 1976. Food relationships of a rodent fauna in a California sage scrub community. Journal of Mammalogy 57:300-319.
MORRIS, D. W. 1983. Field tests of competitive inter- ference for space among temperate-zone rodents. Canadian Journal of Zoology 61:1517-1523.
MORRIS, D. W. 1984. Microhabitat separation and co- existence of two temperate-zone rodents. Canadian Field Naturalist 98:215-218.
MORRIS, D. W. 1989. The effect of spatial scale on pattern of habitat use: red-backed voles as an em- pirical model of local abundance for northern mam- mals. Pp. 23-32 in Patterns in the structure of mam- malian communities (D. Morris, Z. Abramsky, B. Fox, and M. Willig, eds.). Texas Tech University Press, Special Publication 28:1-266.
NEWTON, S. L., T. D. NUDDS, AND J. S. MILLAR. 1980.
Importance of arboreality in Peromyscus leucopus and Microtus pennsylvanicus interactions. Canadian Field Naturalist 94:167-170.
OSTFELD, R. S., M. P. RICHARD, E. M. SCHAUBER, AND J. O. WOLFF. 1998. Chain reactions linking acorns to gypsy moth outbreaks and Lyme disease risk. Sci- ence 279:1023-1026.
PERRI, L. M., AND J. A. RANDALL. 1999. Behavioral
mechanisms of coexistence in sympatric species of desert rodents, Dipodomys ordii and D. merriami. Journal of Mammalogy 80:1297-1310.
PIANKA, E. R. 1973. The structure of lizard commu- nities. Annual Review of Ecology and Systematics 4:53-74.
PIELOU, E. C. 1966. The measurement of diversity in different types of biological collections. Journal of Theoretical Biology 13:131-144.
REESE, E. O., J. C. BARNARD, AND T. A. HANLEY. 1997. Food preference and ad libitum intake of wild-cap- tured sitka mice, Peromyscus keeni sitkensis. Cana- dian Field Naturalist 111:223-226.
RIBBLE, D. O. 1992. Dispersal in a monogamous ro- dent Peromyscus californicus. Ecology 73:859-866.
RIBBLE, D. O., AND M. SALVIONI. 1990. Social orga- nization and nest co-occupancy in Peromyscus cal- ifornicus, a monogamous rodent. Behavioral Ecol- ogy and Sociobiology 26:9-16.
SCHOENER, T. W. 1974. Resource partitioning in eco- logical communities. Science 185:164-168.
SHANNON, C., AND W. WEAVER. 1949. The mathemat- ical theory of communication. University of Illinois Press, Urbana.
SMARTT, R. A. 1978. A comparison of ecological and morphological overlap in a Peromyscus community. Ecology 59:216-220.
SMITH, D. A., AND S. W. SPELLER. 1970. The distribu- tion of Peromyscus maniculatus gracilus and Pero- myscus leucopus noveboracensis (Rodentia: Crice- tidae) in a southeastern Ontario woodlot. Canadian Journal of Zoology 48:1187-1199.
STATSOFT, INC. 1995. STATISTICA for Windows (computer program manual). StatSoft, Inc., Tulsa, Oklahoma.
VAN HORNE, B. 1982. Niches of adult and juvenile deer mice (Peromyscus maniculatus) in seral stages of coniferous forest. Ecology 63:992-1003.
WILLIAMS, B. K., AND K. TITus. 1988. Assessment of sampling stability in ecological applications of dis- criminant analysis. Ecology 69:1275-1285.
WILSON, D. O., AND S. RUFF. 1999. The Smithsonian book of North American mammals. Smithsonian In- stitution Press, Washington, D.C.
WOLFF, J. O. 1989. Social behavior. Pp. 271-291 in Advances in the study of Peromyscus (G. Kirkland and J. Layne, eds.). Texas Tech University Press, Lubbock.
WOLFF, J. O., AND R. D. DUESER. 1986. Non-compet- itive coexistence between Peromyscus species and Clethrionomys gapperi. Canadian Field Naturalist 100:186-191.
WOLFF, J. O., R. D. DUESER, AND K. S. BERRY. 1985. Food habits of sympatric Peromyscus leucopus and Peromyscus maniculatus. Journal of Mammalogy 66:795-798.
WOLFF, J. O., AND B. HURLBUTT. 1982. Day refuges of Peromyscus leucopus and Peromyscus maniculatus. Journal of Mammalogy 63:666-668.
ZAR, J. H. 1984. Biostatistical analysis. 2nd ed. Pren- tice Hall, Englewood Cliffs, New Jersey.
Submitted 26 July 2000. Accepted 13 August 2001.
Associate Editor was Ronald E. Barry.