Embed Size (px)
Citation preview

Completion Report
Project Number: 32359 Loan Number: 2064-INO(SF) and 2065-INO Grant TA Number: 4299-INO June 2014
Indonesia: Participatory Irrigation Sector Project
This document is being disclosed to the public in accordance with ADB's Public Communications Policy 2011.

CURRENCY EQUIVALENTS
Currency Unit – rupiah (Rp)
At Appraisal At Project Completion (3 November 2003) (25 March 2013)
Rp1.00 = $0.0001174674 $0.00010309278 $1.00 = Rp8,513 Rp9,700
ABBREVIATIONS
ADB – Asian Development Bank ADF – Asian Development Fund ATD – agricultural training and demonstration AWP – annual work plan BAPPEDA – Badan Perencanaan Pembangunan Daerah
(Regional Planning and Development Agency) BAPPENAS – Badan Perencanaan Pembangunan Nasional
(National Planning and Development Agency) BSR – brief subproject report CPFPG – compensation policy framework and procedural guidelines DGAFI – Directorate General of Agriculture Facilities and Infrastructure DGRD – Directorate General of Regional Development DGWR – Directorate General of Water Resources DWRS – district water resources services EIRR – economic internal rate of return FMIS – financial management information system ha – Hectare IMP – irrigation management plan KOMIR – irrigation commission KPCMO – kabupaten (district) project coordination and monitoring office MOA – Ministry of Agriculture MOHA – Ministry of Home Affairs MPW – Ministry of Public Works NPCMO – National Project Coordination and Monitoring Office NPMU – national project management unit NSC-WR – National Steering Committee for Water Resources O&M – operation and maintenance PAI – Pengelolaan Aset Irigasi (asset management system) PCR – project completion report PIMA – participatory irrigation management agreement PPCMO – provincial project coordination and monitoring office PPMS – project performance management system PPSIP – Pengembangan dan Pengelolaan Sistem Irigasi Partisipatif (participatory
irrigation development and management) PSETK – Profil Sosial, Ekonomi, Kelembagaan, dan Teknik (social, economic,
institutional, and technical profile) RBO – river basin organization RP2I – Rencana Pengembangan dan Pengelolaan Irigasi (district irrigation
management plan) SDR – special drawing right SI-PAI – irrigation asset management information system

SI-RP2I – RP2I information system SRR – sustainable replacement of rehabilitation SSR – summary subproject report t – ton WRDC – water resources data center WUA – water users association WUAF – water users association federation
NOTES
(i) The fiscal year (FY) of the government ends on 31 December.
(ii) In this report, “$” refers to US dollars. (iii) For an explanation of rating descriptions used in ADB evaluation reports, see: ADB. 2006.
Guidelines for Preparing Performance Evaluation Reports for Public Sector Operations. Manila.
Vice-President S. Groff, Operations 2 Director General J. Nugent, Southeast Asia Department (SERD) Country Director A. Ruthenberg, Indonesia Resident Mission Team leader T. Panella, Principal Water Resources Specialist, Indonesia Resident
Mission Team member P.P. Wardani, Senior Project Officer, Indonesia Resident Mission
In preparing any country program or strategy, financing any project, or by making any designation of or reference to a particular territory or geographic area in this document, the Asian Development Bank does not intend to make any judgments as to the legal or other status of any territory or area.

CONTENTS
Page
BASIC DATA ii
MAP ix
I. PROJECT DESCRIPTION 1
II. EVALUATION OF DESIGN AND IMPLEMENTATION 1
A. Relevance of Design and Formulation 1
B. Project Outputs 2
C. Project Costs 6
D. Disbursements 8
E. Project Schedule 8
F. Implementation Arrangements 9
G. Conditions and Covenants 9
H. Consultant Recruitment and Procurement 10
I. Performance of Consultants, Contractors, and Suppliers 10
J. Performance of the Borrower and the Executing Agency 10
K. Performance of the Asian Development Bank 11
III. EVALUATION OF PERFORMANCE 11
A. Relevance 11
B. Effectiveness in Achieving Outcome 11
C. Efficiency in Achieving Outcome and Outputs 11
D. Preliminary Assessment of Sustainability 12
E. Impact 12
IV. OVERALL ASSESSMENT AND RECOMMENDATIONS 13
A. Overall Assessment 13
B. Lessons 13
C. Recommendations 14
APPENDIXES
1. Project Performance against Design Framework 16
2. List of Irrigation Regulations Issued in Project District and Provinces 24
3. Training for Government Staff and Water Users Associations 25
4. List of District Irrigation Management Plans Prepared 26
5. Strengthening of Water Users Associations and Federations 27
6. Summary of Improvement Works Completed 28
7. Detailed Project Cost 30
8. Annual Disbursements 31
9. Project Implementation Schedule 32
10. Status of Compliance with Loan Covenants 34
11. Summary of Gender Equality Results and Achievements 39
12. Financial and Economic Analysis 50

ii
BASIC DATA
A. Loan Identification 1. Country 2. Loan Number Grant Number 3. Project Title 4. Borrower 5. Executing Agency 6. Amount of Loan Amount of Grant 7. Project Completion Report Number
Indonesia 2064-INO and 2065-INO 4299-INO Participatory Irrigation Sector Project Republic of Indonesia Ministry of Public Works Ministry of Home Affairs Ministry of Agriculture $19,000,000 or SDR13,270,000 (Asian Development Fund) $54,000,000 (ordinary capital resources) $15,000,000 (Government of the Netherlands) PCR: INO 1443
B. Loan Data 1. Appraisal – Date Started – Date Completed 2. Loan Negotiations – Date Started – Date Completed 3. Date of Board Approval 4. Date of Loan Agreement 5. Date of Loan Effectiveness – In Loan Agreement – Actual – Number of Extensions 6. Closing Date – In Loan Agreement – Actual – Number of Extensions 7. Terms of Loan (ADF) – Interest Rate – Maturity (number of years) – Grace Period (number of years) Terms of Loan (OCR) – Interest Rate – Maturity (number of years) – Grace Period (number of years) 8. Terms of Relending (if any)
28 October 2002 21 November 2002 12 November 2003 12 November 2003 19 December 2003 2 February 2005 2 May 2005 2 June 2005 1 30 June 2011 31 December 2012 1 1.0% per annum during the grace period and 1.5% per annum thereafter 32 8 LIBOR-based lending facility, commitment charge of 0.75% per annum, front-end fee of 0.5% 22 7 None

iii
9. Disbursements a. Dates Initial Disbursement
Loan 2064-INO: 19 March 2007 Loan 2065-INO: 02 June 2005 Grant 4299-INO: 06 March 2007
Final Disbursement 08 January 2014 13 January 2014 10 January 2014
Time Interval 81.5 months 103.4 months 82.0 months
Effective Date
02 June 2005
Original Closing Date
30 June 2011
Time Interval
73.0 months
b. Amount
Loan 2064-INO(SF) (SDR million) Category
Original Allocation
Last Revised Allocation
Amount Canceled
Net Amount Available
Amount Disbursed
Undisbursed Balance
01 Civil Works 6.405 1.009 0.000 1.009 1.009 0.000 01A Civil Works 5.570 0.003 5.567 5.567 0.000 01B Civil Works (Financial share from Loan 2065-INO)
0.122 0.004 0.118 0.118 0.000
01C Civil Works (Financial share from Grant 4299-INO)
0.258 0.001 0.257 0.257 0.000
02 Vehicles 0.018 0.014 0.000 0.014 0.014 0.000 03 Equipment and Materials
0.449 0.322 0.000 0.322 0.322 0.000
04 Capacity Building 2.649 2.430 (0.001) 2.431 2.431 0.000 04A Capacity Building 0.207 0.000 0.207 0.207 0.000 (Financial share from Loan 2065-INO)
04B Capacity Building 0.098 0.001 0.097 0.097 0.000 (Financial share from Grant 4299-INO)
05 Studies, Surveys, and Audit
0.328 0.707 0.000 0.707 0.707 0.000
05A Studies, Surveys, and Audit (Financial share from Grant 4299-INO)
0.013 0.002 0.011 0.011 0.000
06A Consulting Services – International
0.688 0.410 0.000 0.410 0.410 0.000
06B Consulting Services – Domestic
0.902 1.544 0.000 1.544 1.544 0.000
06C Consulting Services – Domestic (Financial share from Grant 4299-INO)
0.012 0.002 0.010 0.010 0.000
07 NGO Services 0.170 0.233 0.000 0.233 0.233 0.000 08 Service Charges 0.321 0.321 0.000 0.321 0.321 0.000 09 Front-end Fee 0.000 0.000 0.000 0.000 0.000 0.000 10 Unallocated 2.000 0.000 0.000 0.000 0.000 0.000 99 Imprest Account 0.000 0.000
Total 13.270 13.270 0.012 13.258 13.258 0.000 ( ) = negative, NGO = nongovernment organization, SDR = special drawing right, SF = Special Funds. Source: Asian Development Bank Loan Financial Information System.

iv
Loan 2064-INO(SF) ($ million) Category
Original Allocation
Last Revised Allocation
Amount Canceled
Net Amount Available
Amount Disbursed
Undisbursed Balance
01 Civil Works 9.838 1.566 0.000 1.566 1.566 0.000 01A Civil Works 8.527 0.005 8.522 8.522 0.000 01B Civil Works (Financial share from Loan 2065-INO)
0.185 0.007 0.178 0.178 0.000
01C Civil Works (Financial share from Grant 4299-INO)
0.386 0.000 0.386 0.386 0.000
02 Vehicles 0.028 0.021 0.000 0.021 0.021 0.000 03 Equipment and Materials
0.689 0.493 0.000 0.493 0.493 0.000
04 Capacity Building 3.051 3.741 (0.001) 3.742 3.742 0.000 04A Capacity Building 0.314 0.000 0.314 0.314 0.000 (Financial share from Loan 2065-INO)
04B Capacity Building 0.149 0.001 0.148 0.148 0.000 (Financial share from Grant 4299-INO)
05 Studies, Surveys, and Audit
0.504 1.092 0.000 1.092 1.092 0.000
05A Studies, Surveys, and Audit (Financial share from Grant 4299-INO)
0.020 0.003 0.017 0.017 0.000
06A Consulting Services – International
1.056 0.635 0.000 0.635 0.635 0.000
06B Consulting Services – Domestic
1.385 2.375 0.000 2.375 2.375 0.000
06C Consulting Services – Domestic (Financial sha- re from Grant 4299-INO)
0.018 0.003 0.015 0.015 0.000
07 NGO Services 0.261 0.359 0.000 0.359 0.359 0.000 08 Service Charges 0.493 0.495 0.000 0.495 0.495 0.000 09 Front-end Fee 0.000 0.000 0.000 0.000 0.000 0.000 10 Unallocated 3.071 0.000 0.000 0.000 0.000 0.000 99 Imprest Account 0.000 0.000
Total 20.376 20.376 0.018 20.358 20.358 0.000 ( ) = negative, NGO = nongovernment organization, SDR = special drawing right, SF = Special Funds.
Source: Asian Development Bank Loan Financial Information System (14 February 2014), except for the original allocation which used an exchange rate of SDR1,536 = $1.00.

v
Loan 2065-INO ($ million) Category
Original Allocation
Last Revised Allocation
Amount Canceled
Net Amount Available
Amount Disbursed
Undisbursed Balance
01 Civil Works 25.985 4.534 0.007 4.527 4.527 0.000 01A Civil Works 23.300 0.010 23.290 23.290 0.000 02 Vehicles 0.070 0.058 0.000 0.058 0.058 0.000 03 Equipment and Materials
1.785 1.167 0.000 1.167 1.167 0.000
04 Capacity Building 10.516 9.844 (0.009) 9.853 9.853 0.000 05 Studies, Surveys, and Audit
1.304 3.079 0.001 3.078 3.078 0.000
06A Consulting Services – International
2.730 1.871 0.000 1.871 1.871 0.000
06B Consulting Services – Domestic
3.582 6.003 0.000 6.003 6.003 0.000
07 NGO Services 0.674 0.986 0.000 0.985 0.985 0.000 08 Interest During Construction
5.347 2.888 0.004 2.884 2.884 0.000
09 Front-end Fee 0.270 0.270 0.000 0.270 0.270 0.000 10 Unallocated 1.737 0.000 0.000 0.000 0.000 0.000 99 Imprest Account 0.000 0.000
Total 54.000 54.000 0.013 53.987 53.987 0.000 ( ) = negative, NGO = nongovernment organization. Source: ADB Loan Financial Information System.
Grant 4299-INO ($ million) Category
Original Allocation
Last Revised Allocation
Amount Canceled
Net Amount Available
Amount Disbursed
Undisbursed Balance
01 Civil Works 7.133 1.227 0.000 1.227 1.227 0.000 01A Civil Works 6.091 0.000 6.091 6.091 0.000 02 Vehicles 0.020 0.017 0.000 0.017 0.017 0.000 03 Equipment and Materials
0.497 0.429 0.000 0.429 0.429 0.000
04 Capacity Building 2.931 3.253 0.000 3.253 3.253 0.000 05 Studies, Surveys, and Audit
0.363 0.854 0.000 0.854 0.854 0.000
06A Consulting Services – International
0.761 0.930 0.000 0.930 0.930 0.000
06B Consulting Services – Domestic
0.998 1.780 0.000 1.780 1.780 0.000
07 NGO Services 0.188 0.265 0.000 0.265 0.265 0.000 08 Service Charges 0.000 0.154 0.000 0.154 0.154 0.000 09 Front-end-fee 0.000 0.000 0.000 0.000 0.000 0.000 10 Unallocated 2.109 0.000 0.000 0.000 0.000 0.000
Total 15.000 15.000 0.000 15.000 15.000 0.000 NGO = nongovernment organization. Note: Numbers may not sum precisely because of rounding. Source: Controller’s Department Loan Administration Division and Indonesia Resident Mission’s record (14 February 2014).
10. Local Costs (ADB Financed) - Amount ($ million) 49.8 - Percent of Local Costs 50.6% - Percent of Total Cost 39.1%

vi
C. Project Data
1. Project Cost ($ million)
Cost Appraisal Estimate Actual
Foreign Exchange Cost 30.6 29.1 Local Currency Cost 95.4 98.4 Total 126.0 127.5
2. Financing Plan ($ million)
Cost Appraisal Estimate Actual
Foreign Local Total Foreign Local Total
Implementation Costs Government Financed 25.5 25.5 31.9 31.9 ADB Financed Asian Development Fund 5.2 13.3 18.5 5.6 14.3 19.9 Ordinary Capital Resources 15.0 33.5 48.5 15.1 35.7 50.8 Government of the Netherlands 4.4 10.6 15.0 4.6 10.3 14.9 Community Financing 12.5 12.5 6.2 6.2
Total 24.6 95.4 120.0 25.3 98.4 123.7
IDC Cost and Service Charges ADB Financed Asian Development Fund 0.5 0.5 0.5 0.5 Ordinary Capital Resources 5.5 5.5 3.2 3.2 Government of the Netherlands Grant Fund
0.1
0.1
Total Cost 30.6 95.4 126.0 29.1 98.4 127.5
ADB = Asian Development Bank, IDC = interest during construction.
3. Cost Breakdown by Project Component ($ million)
Component Appraisal Estimate Actual
A. Irrigation Management 1. Capacity Building of Districts and Provinces 8.0 8.9 2. Capacity Building of Water Users Associations 12.4 14.1 3. Sustainable Operations of Irrigation Infrastructure 60.0 71.6 4. Irrigated Agriculture Support 6.8 12.9
B. Water Resources Information and Asset Management
2.0 3.4
C. Project Coordination and Monitoring 7.5 12.9 Subtotal A+B+C 96.6 123.7 D. Contingencies 23.4 0.0 E. Interest During Construction and other charges 6.0 3.8
Total 126.0 127.5

vii
4. Project Schedule
Item Appraisal Estimate
Actual
Date of Contract with Consultants Package 1: Irrigation and Water Resources Management Package 2: Institutional Development Package 3: National Project and Financial Management Independent Monitoring and Evaluation
July 2006 July 2006 July 2006
September 2008
November 2006 January 2007
December 2006 September 2008
Completion of Engineering Designs December 2006 April 2007 Civil Works Contract Date of Award of First Contract July 2007 November 2007 Completion of Work of Last Contract June 2011 December 2011 Equipment and Supplies Dates First Procurement July 2007 November 2007 Last Procurement June 2010 August 2010 Completion of Equipment Installation October 2010 December 2010 Start of Operations Completion of Rehabilitation 30 June 2011 31 December 2011 Beginning of First Rehabilitated Schemes
1 January 2008 1 January 2008
5. Project Performance Report Ratings
Implementation Period
Ratings
Development Objectives
Implementation Progress
From 20 December 2003 to 31 May 2005 Satisfactory Unsatisfactory From 2 June 2005 to 31 March 2007 From 1 April 2007 to 31 December 2009 From 1 January 2010 to 31 December 2011
Satisfactory Satisfactory Satisfactory
Satisfactory Satisfactory
Highly Satisfactory From 1 January 2012 to 31 December 2012 Satisfactory Satisfactory

viii
D. Data on Asian Development Bank Missions
Name of Mission
Date
No. of Persons
No. of Person-Days
Specialization of Members
Fact-Finding 11–19 Sep 2001 3 36 a,b,c Appraisal 28 Oct–21 Nov 2002 2 50 a,d Inception 23 May–16 Jun 2005 2 38 a,c Review 1 13–28 Jul 2006 1 16 E Special Project Administration 1 10–12 Oct 2006 1 3 E Review 2 11 Jun–10 Jul 2007 4 36 f,i,j,e Review 3 14 Nov–19 Dec 2007 2 24 f,i Review 4 31 Mar–24 Apr 2008 2 24 f,i Midterm Review 27 Aug–23 Sep 2008 3 32 f,i,j Review 5 13 Apr–22 May 2009 3 24 i,g,j Review 6 10–30 Nov 2009 3 24 i,g,j Review 7 20 Apr–20 May 2010 3 36 h,I,j Review 8 18 Nov–20 Dec 2010 4 32 h,i,j,k Review 9 2 May–22 Jun 2011 2 24 h,i Review 10 5 Dec 2011–19 Jan 2012 2 24 h,i Review 11 15 Jun–26 Jul 2012 2 24 h,i Special Project Administration 2 13–14 Dec 2012 2 4 h,i Project Completion Review 25 Feb–17 Apr 2013 4 48 h,I,l,l
a = principal project specialist, b = counsel, c = programs economist, d = financial specialist, e = senior water resources engineer, f = environmental economist, g = lead water resources specialist, h = principal water resources specialist, i = senior project officer, j = gender specialist, k = project implementation officer, l = consultant.

ix

I. PROJECT DESCRIPTION
1. The Asian Development Bank (ADB) approved the Participatory Irrigation Sector Project1 on 19 December 2003, consisting of two loans for SDR13.27 million ($19.00 million equivalent) from the Asian Development Fund (ADF) under 2064-INO and $54.00 million from ordinary capital resources under 2065-INO. The Government of the Netherlands provided a $15.00 million grant for the project and signed the Administration Arrangement with ADB on 9 May 2005. The project became effective on 2 June 2005 with an original closing date of 30 June 2011, which was extended once to 31 December 2012. 2. The project’s impact was to increase economic growth and reduce poverty in 25 districts in six provinces—Lampung, Banten, West Java, Central Java, East Java, and South Sulawesi. The project’s outcomes were to decentralize management of irrigation systems on a sustainable basis and increase yields of irrigated crops. The project’s scope included (i) Part A: Irrigation Management (Part A-1: Capacity Building of Districts and Provinces, Part A-2: Capacity Building of Water User Associations [WUAs], Part A-3: Sustainable Operations of Irrigation Infrastructure, and Part A-4: Irrigated Agriculture Support); (ii) Part B: Water Resources Information and Asset Management; and (iii) Part C: Project Coordination and Monitoring. The project used a demand-driven approach to participatory irrigation development and management (PPSIP), 2 accommodating districts’ varying degrees of institutional, financial, technical, and management capacities. 3. The project was executed by the Directorate General of Water Resources (DGWR) of the Ministry of Public Works (MPW) as the lead executing agency. The two other executing agencies for the project are the Directorate General of Agriculture Facilities and Infrastructure (DGAFI) of the Ministry of Agriculture (MOA) and the Directorate General of Regional Development (DGRD) of the Ministry of Home Affairs (MOHA). Project implementation was the responsibility of district and provincial agencies under the technical guidance of (i) DGWR for irrigation, water resource, and asset management; (ii) DGAFI for agricultural support services and WUA development from 2008 onward; and (iii) DGRD for WUA formation and strengthening from 2006 to 2007, public consultation, socioeconomic and technical system profile surveys, legal and policy development, and coordination. The project was guided by the National Steering Committee for Water Resources (NSC-WR), established in 2005, chaired by the director for water resources and irrigation of the National Planning and Development Agency.3 The National Project Coordination and Monitoring Office (NPCMO) was established in 2005 to serve as the secretariat for the NSC-WR, chaired by the director of irrigation and lowlands of DGWR.
II. EVALUATION OF DESIGN AND IMPLEMENTATION
A. Relevance of Design and Formulation
4. The project was consistent with the (i) government’s National Development Program, 2000–2004, which included goals to increase community empowerment through strengthening local institutions and community organizations, poverty reduction, and social protection; and (ii) the National Water Resources Policy, adopted by the government in December 2001. Project implementation was timely since it (i) introduced the new Water Law 7/2004 and the new
1 ADB. 2003. Report and Recommendation of the President to the Board of Directors: Proposed Loans to the Republic of Indonesia for the Participatory Irrigation Sector Project. Manila.
2 Policy regulation issued by the Minister of Public Works in September 2007 (PERMEN No. 30/PRT/M/2007).
3 Badan Perencanaan Pembangunan National (BAPPENAS).

2
participatory irrigation principles in the Government Regulation 20/2006 from the MPW, and (ii) it came after six years (1998–2004) of little irrigation maintenance resulting from recent economic and political challenges. 5. At completion, the project remained relevant to the government’s National Medium-Term Development Plan, 2010–2014, which aims to increase the incomes and well-being of farmers and to develop infrastructure. It specifically targets increases in national rice production to reach a surplus of 10 million tons of rice by 2014, as stated in Presidential Decree 5 of 2011. 6. At preparation, the project was consistent with ADB’s Indonesia country strategy and program, 2003–2005, which had the main objectives of reducing poverty, improving governance and supporting decentralization, managing natural resources and the environment, and strengthening the economy through infrastructure investments.4 The project is still aligned with ADB’s Indonesia country partnership strategy, 2012–2014, which supports inclusive growth and development of water resources infrastructure. 5 The project was designed and prepared under project preparatory technical assistance.6 The appraisal mission, fielded from 28 October to 21 November 2002, reached an agreement with the government on technical, financial, and implementation aspects of the project. 7. The project’s scope and implementation arrangements were changed in October 2009. Initially, the project’s (i) sustainable replacement of rehabilitation (SRR) works covered 625,000 hectares (ha), and (ii) rehabilitation and upgrading works (rehabilitation works) covered 137,000 ha. The targeted coverage of SRR works was reduced from 625,000 ha to 319,000 ha because of initial delays, but mainly owing to significant increases in unit costs for civil works resulting from reduced fuel subsidies and higher fuel costs in 2005 and 2008. The targeted coverage for rehabilitation works remained the same (137,000 ha). In addition, the Government’s Regulation on Financial Management and Responsibility in the Implementation of De-concentration and Co-administration (PP 7/2008) no longer required local governments to allocate funds for national projects since line ministries were to provide the funds. In response, the project’s civil works contracting arrangements were amended, so that ADB-financed contracts (originally 83% of total civil works financing) had 100% ADB financing and government-financed contracts (originally 17% of total civil works financing) had 100% government financing. There was no joint contract financing with ADB and government funds. B. Project Outputs
8. The project achieved the majority of its targets although some were revised during implementation. Appendix 1 provides the performance of the project against the project design framework. Achievement of outputs is described in the following paragraphs.
1. Part A: Irrigation Management
9. Part A-1: Capacity building of districts and provinces. The project strengthened 27 district and six provincial governments to implement their tasks and responsibilities effectively for participatory irrigation management in accordance with the National Regulation
4 ADB. 2002. Country Strategy and Program, 2003-2005, Indonesia. Manila.
5 ADB. 2012. Country Partnership Strategy, Indonesia, 2012-2014. Manila.
6 ADB. 2001. Technical Assistance to the Republic of Indonesia for the Participatory Irrigation Sector Project. Manila.

3
PP 20/2006 on irrigation management.7 The project started with five core districts8 under the project preparatory technical assistance; the remaining districts were selected from March to April 2007. The project assisted the 27 districts and six provinces to enact improved irrigation regulations, compared with the targeted 25 irrigation regulations (Appendix 2), and established and supported 33 irrigation commissions (KOMIRs) in project districts and provinces. In line with government regulation PP 20/2006, the KOMIRs, which consist of 50% local government officials and 50% stakeholders (including WUAs), are responsible for decision making on irrigation operation and maintenance (O&M) improvements, management, and development. 10. A total of 8,311 government staff from (i) district and provincial regional planning development agencies, water resources agencies, and agricultural agencies participated in training in all aspects of participatory planning and coordination, design, construction, O&M, and irrigated agriculture; and (ii) central, provincial, and district staff participated in overseas training on water management (exceeded targeted 5,000 staff). Training outputs for government staff are in Appendix 3. 11. The project assisted district governments to formulate district irrigation management plans (RP2Is)9, which include management plans for existing schemes as well as development plans for new irrigated areas. The RP2Is were designed to be the basis for a long-term sector investment program (5 years) that would use a participatory approach to irrigation management and development. They include (i) programs to strengthen WUAs; (ii) budgeting requirements for a satisfactory level of O&M; and (iii) asset management, with periodic replacement and rehabilitation. They are approved by the district head and should be reviewed and updated every year. 12. All but one district completed RP2Is to address the management of existing schemes. The project was designed with no development of new irrigated schemes. Eighteen districts included an irrigation development plan for new areas in their RP2Is, which were endorsed by the district head (Appendix 4). The NPCMO and project consultants provided guidelines to include development of new schemes. The guidelines include the analysis of district spatial planning information to identify potential development areas and limited land availability resulting from land conversion. The development plan was challenging for some districts with limited capacity, but was an important element of the RP2I for long-term development of the irrigation sector. The RP2I, along with the project, raised awareness of irrigation priority and facilitated the allocation of additional funds and resources for irrigation in project districts.10 13. DGWR initiated the mechanisms to allocate an irrigation management fund for local governments to support irrigation system management in an optimal and sustainable way, for O&M funding in particular. The provision of such a fund is regulated under PP 20/2006 on irrigation management. It should be provided by central, provincial, and district governments for O&M, rehabilitation, and improvements. At project closing, the Ministry of Finance had not issued the regulation.
7 The number of districts increased from 25 to 27 due to establishment of Pesawaran District, a new district split in 2006 from Lampung Selatan District, Lampung Province and Toraja Utara District split from Tanah Toraja District in 2009 in South Sulawesi Province.
8 The five core districts were Garut in West Java province, Banyumas in Central Java province, Lampung Selatan in
Lampung province, Madiun in East Java province, and Sinjai in South Sulawesi province. 9 Rencana Pengembangan dan Pengelolaan Irigasi.
10 Although the approved local government funds did not always meet the amounts requested in RP2I budgets, there was a positive trend for increased allocations. Cilacap District increased allocation of district funds for O&M from an average of Rp500 million over 2007–2011 to Rp4.75 billion in 2012, which was attributed to the project.

4
14. Part A-2: Capacity building of water users associations. The project strengthened and empowered WUAs and WUA federations (WUAFs) through (i) their participation in system reviews, civil works, and O&M; (ii) the formation, revitalization, and legalization of WUAs and WUAFs; and (iii) training. A total of 5,076 WUAs, against the revised target of 5,000 WUAs 11 and 643 WUAFs, were developed and/or revitalized, equipped, and trained. Of these, 4,553 WUAs and all WUAFs were legalized (Appendix 5). DGRD, through regional planning and development agency (BAPPEDA), provided capacity building of WUAs and WUAFs in 2006 and 2007. To respond to the new regulation on the assignment of government tasks (PP 38/2007), capacity building of WUAs and WUAFs was transferred to DGAFI in 2008 and implemented through local government agriculture services. The legalized WUAs and WUAFs obtained a better understanding of their rights and responsibilities under the new policies through these activities. 15. A total of 3,421 WUA members participated in irrigation systems review for socioeconomic, institutional, and technical profiles (PSETK), guided by BAPPEDA; 1,712 WUA members received training in participatory design, construction, and O&M from district water resources services; and 34,502 WUA members, including women farmers, received training in institutional management and agriculture from district agricultural services or MOA. The training of WUAs and WUAFs is shown in Appendix 3. In addition to participating in irrigation systems review through PSETK, WUAs and WUAFs entered into contracts with (i) district governments for civil works implementation for SRR through direct contracting; (ii) local contractors on civil works implementation for rehabilitation of larger irrigation systems through a work-sharing agreement; (iii) district agriculture services for rehabilitation of tertiary canal systems;12 and (iv) local business partners such as village cooperatives, processing factories, and local shops to market irrigated agriculture products. 16. Part A-3: Sustainable operation of irrigation infrastructure. The project supported infrastructure rehabilitation through (i) SRR works for schemes with minor rehabilitation needs, and (ii) rehabilitation works for schemes that had never been rehabilitated. In each system, the district BAPPEDA and WUA or WUAF prepared PSETKs of each system, and the systems’ conditions were documented in feasibility reports—brief summary reports (BSRs) for SRR schemes and summary subproject reports (SSRs) for rehabilitation schemes.13 Two initial BSR samples in a district or province and all SSRs required ADB approval. 17. A total of 1,614 irrigation systems was rehabilitated, covering 457,220 ha—exceeding the revised project target of 456,000 ha (Appendix 6). The irrigation systems were selected based on WUA or WUAF requests from systems larger than 30 ha, for 1,317,000 ha of irrigated area in project districts. The selections were confirmed with district and provincial water resources agencies and DGWR, and outlined in an overall work plan. Project implementation was based on this work plan. About 314,777 ha were rehabilitated through SRR works and 142,443 ha through rehabilitation works. The SRR works, which normally required unskilled labor, were carried out by trained and legalized WUAs or WUAFs through direct contracting. Rehabilitation works, which were beyond the capacity of WUAs and WUAFs, were implemented by local contractors who were required to assign part of the easier works to WUAs and/or WUAFs through a work-sharing agreement.
11
The target for WUA capacity building was revised from 6,250 to 5,000 WUAs following the reduction of the targeted coverage for scheme rehabilitation from 625,000 ha to 456,000 ha.
12 Under National Law No. 7/2004, WUAs are responsible for the construction and O&M of the tertiary canal systems.
13 An improvement of rehabilitation scheme in an SSR was subject to economic analysis of the cost of improvement while SRR schemes were subject to a simple comparison of costs and expected benefits in financial terms.

5
18. At the primary and secondary canal level of district systems, WUAs and/or WUAFs participated in O&M through a joint management that was formalized in a participatory irrigation management agreement (PIMA) with the district water resources agency.14 The PIMA sets out the cooperation between the farmers and the district to operate the system in accordance with the district or province technical guidelines on irrigation management. WUAs or WUAFs and the district water resources agency prepared an O&M plan that the WUAs or WUAFs implemented. The PIMA was also the basis for a needs-based budget request for O&M to district or provincial governments through the KOMIR. Funding for O&M was the responsibility of the local water resources agency, but WUAs or WUAFs provided O&M funding in accordance with their financial capacity.15 The budgeting for O&M was prepared the district water resources agency and agreed annually. Generally, the PIMA was valid for two or three years. During the survey conducted for the project completion report (PCR), a wide range of WUA participation in O&M of rehabilitated systems was observed. In Cilacap District, the O&M of the entire scheme, including operation of the weir, was formally granted to the WUAF in a PIMA agreement. 19. Part A-4: Irrigated agriculture support. For agriculture support, the project (i) established 112 agriculture training and demonstration (ATD) units, (ii) rehabilitated on-farm (tertiary) canals, and (iii) provided agricultural training programs. The MOA requested a change from classroom training in the original project design to field-oriented activities in 2007. In the 112 ATD units, which were operational for 2 to 3 years, 511 crop intensification, diversification, and water management system training sessions were provided to 11,794 farmers; and 413 WUA training sessions were provided to 1,168 farmers to promote improved agricultural practices. The project and WUAs rehabilitated 946 tertiary blocks over 86,418 ha, which improved on-farm water management. The project provided the construction materials and WUA members provided labor. The project also supported workshops on agriculture information and access to credit for 2,375 farmers; field schools, mainly on system rice intensification, for 5,908 farmers; and cultivation of high value crops and agriculture food processing that help improve domestic income for 2,950 women farmers (Appendix 3).
2. Part B: Water Resources Information and Asset Management
20. Part B was comprised of (i) improvement and expansion of the operation of the water resources information management system and facilities executed through DGWR, and (ii) strengthening of effective asset management system (PAI) executed at the district level. In June 2006, the project’s Water Resources Data Unit was established. However, with the formation of regional river basin organizations (RBOs) under DGWR in 2008, the collection of hydrological data was mostly assigned to these units and the central level was more involved in management and coordination. After the establishment of the RBOs, the focus of the project’s Part B program was shifted to training the districts in geographical information system, hydrology, and related topics necessary for the assessment of water resource information at provincial and district level. 21. Under Part B, the project developed an irrigation asset management information system (SI-PAI). The SI-PAI provided an estimate of investment needs for each scheme for 25 years divided over 5-year periods. SI-PAI information was an important input to prepare the RP2I. In
14
For national schemes under the project, the responsibility to manage its O&M tasks is delegated to the district water resources services. For provincial schemes, the O&M arrangements are guided by an agreement between the province and the district concerned.
15 In cases where O&M funds have not been made available from local government, WUAs/WUAFs provide labor in cooperation with the district water resources agencies.

6
early 2009, the SI-PAI was extended to become the RP2I information system (SI-RP2I). By August 2009, all project district and province governments received training in the application of SI-RP2I. At the end of the project, inventory of about 431,111 ha of irrigation infrastructure were surveyed for the SI-PAI as the basis for RP2I programming. Activities for SI-PAI in the districts of Bojonegoro (2,699 ha), Madiun (782 ha), and Toraja Utara (2,020 ha), and the provinces of East Java (13,196 ha) and South Sulawesi (7,412 ha), were to be completed using government funds. The PAI approach was updated and formalized under MPW Ministerial Decree 13/2012. Further efforts were needed to improve the SI-PAI in accordance with the new regulation and incorporate spatial planning to the SI-RP2I.
3. Part C: Project Coordination and Monitoring
22. Part C supported (i) operation of the NSC-WR; (ii) establishment and operation of the NPCMO; (iii) development of a financial management information system (FMIS) of the project; and (iv) development of a project performance management system (PPMS) at national, provincial, and district levels. 23. The NSC-WR (i) provided policy guidance for the project; (ii) assigned role-sharing arrangements among project stakeholders; (iii) approved project district selection in 2007, annual work plans (AWPs) for the project, and the concept of RP2I; (iv) requested project reallocations and extension; and (v) oversaw project implementation. The NSC-WR chaired all kick-off and wrap-up meetings of all missions. 24. The NPCMO comprised BAPPENAS, MPW, MOA, and MOHA; and was supported by technical and accounting staff. The NPCMO (i) was responsible for overall planning and coordination of project activities, (ii) reviewed and consolidated AWPs and budget estimates from executing and implementing agencies, (iii) managed the FMIS for withdrawal applications, (iv) monitored and coordinated consultants, (v) operated the PPMS, 16 and (vi) managed reporting to government and ADB. The NPCMO coordinated project activities, with provincial and district BAPPEDA as project coordination offices—provincial project coordination and management offices (PPCMOs) and kabupaten (district) project coordination and management offices (KPCMOs). The FMIS was originally developed by the consultant services package 3. However, by the end of the consultant’s contract in December 2009, the FMIS was still under development. In early 2010, the NPCMO reassigned the support for FMIS to the consultant services package 1. The consultant completed the development of the FMIS and supported the NPCMO in processing withdrawal applications and financial management. The PPMS was implemented by the PPCMOs and KPCMOs. Provincial and district PPMS reports were used as inputs for the government’s project completion report. C. Project Costs
25. At appraisal, project costs were estimated at $126.0 million, comprising $30.6 million in foreign currency and $95.4 million in local currency. ADB was to finance $26.2 million of the foreign exchange cost and $46.8 million of the local currency cost, the Government of the Netherlands was to finance $4.4 million of the foreign exchange cost and $10.6 million of the local currency cost, and the Government of Indonesia was to finance $25.5 million of the local currency cost and the beneficiaries were to contribute $12.5 million of the local currency cost. The actual project cost at loan closing was $127.5 million, comprising $29.1 million in foreign exchange and $98.4 million in local currency. ADB financed $24.4 million of the foreign
16
The project consultant developed the PPMS.

7
exchange and $49.9 million of the local currency, the Government of the Netherlands financed $4.6 million of the foreign cost and $10.4 million of the local currency cost, while the Government of Indonesia covered $31.9 million of the local currency cost. The beneficiaries contributed $6.2 million to the local currency cost (basic data section C2 and Appendix 7). 26. The project’s extension by 18 months and change in approach to more intensive capacity building for participatory irrigation management resulted in higher capacity building activities, surveys, consulting services expenditures, and salaries and allowances of project staff. No land acquisition budget was used, as the project focused on rehabilitation of existing irrigation systems. Farmers’ full involvement in SRR works and work sharing in rehabilitation works resulted in their less contribution to civil works than envisaged. Farmers’ change of responsibility under the new law to O&M of tertiary systems only also caused their less contribution to O&M than envisaged. 27. The project’s allocations and financing percentage of the loan and grant proceeds proposed by the executing agency and approved by ADB on 21 September 2006, which used prorated financing percentages across the three fund sources for all expenditure categories increased administrative challenges. This arrangement was more difficult since no computerized financial information system was in place for the Government of the Netherlands’ grant. Unlike the two loans, under ADB’s Loan Financial Information System, the grant used a manual system with a spreadsheet to record contract awards and disbursements. 28. The initial deposits of $750,000 for each of the three imprest accounts, as directed by the loan agreement, were inadequate. This required substantial pre-financing by the government to cover project expenditures. The pre-financing was significantly reduced in 2009 when the imprest account advance was increased to 10% of the respective loan and grant amounts. The increase of the advances helped speed up disbursements. 29. Three reallocations were made during project implementation. The government requested the first reallocation of loan and grant proceeds in May 2009 to accommodate a change in the financing percentage for civil works categories to respond to the Government Regulation on Financial Management and Responsibility in the Implementation of De-concentration and Co-administration (PP 7/2008), where national projects no longer required districts and/or provinces to allocate funds for project implementation since national line ministries were to provide these funds. The contribution from the government was provided in parallel to the loan proceeds, and this required a revision of the loan allocation table. The civil works category was divided into two: (i) category 01 to cover civil works contracts implemented during 2006–2008, with 83% ADB financing and 17% government financing; and (ii) category 01A to cover civil works contracts for 2009 activities and onward, with 100% ADB financing, while contracts with a total value of 17% of the overall value of civil works were 100% financed by the government. 30. The second reallocation was in October 2011 to cover (i) the extension of the consulting services contracts for packages 1 and 2 associated with the project extension from 1 July 2011 to 31 December 2012; and (ii) the increase in $ costs caused by appreciation of the rupiah. Savings from the category of civil works, nongovernment organization services, interest during construction, and unallocated were reallocated to the consulting services category. 31. The third reallocation was approved in December 2012 to reconcile over-commitments that resulted in negative balances for civil works and capacity building cost categories in OCR loan and grant. All project contracts were supposed to use the following prorated financing

8
percentages: 22% for the ADF loan, 61% for the ordinary capital resources loan, and 17% for the Government of the Netherlands grant. However, misalignments between projected and actual expenditures occurred due to (i) the contract financing percentages that were based on the loan and grant total amounts (including services charges for the ADF loan and interest during construction for the ordinary capital resources loan) rather than net expenditure amounts; (ii) the front-loading disbursement arrangement for the grant at the project start; and (iii) the continuous fluctuation of special drawing rights for the ADF loan against the US dollar. The uncommitted balance under ADF loan was used to cover over-commitments under OCR loan and the grant. New categories under the ADF loan were created, which corresponded to the civil works and capacity building categories under the OCR loan and grant to cover the over-commitments. D. Disbursements
32. Annual disbursements were low at the start of the project but increased significantly in 2009 after the ceilings of the imprest accounts increased from (i) $750,000 to $1,900,000 for Loan 2064-INO, (ii) $750,000 to $5,400,000 for Loan 2065-INO, and (iii) $750,000 to $1,500,000 for Grant 4299-INO. The increased ceilings also reduced government pre-financing expenditures. Thereafter, disbursements accelerated and reached their highest achievement in 2011. Annual disbursements of loan and grant funds are in Appendix 8. 33. The project had a cost overrun of about $0.916 million, as 10 withdrawal applications under Loan 2065-INO worth $0.693 million and 12 withdrawal applications under Grant 4299-INO worth $0.223 million could not be paid. This was due to (i) disbursement delays, resulting in differences in conversion rates between the dates of actual expenditures and dates of disbursement; (ii) higher capacity building and surveys associated with the change in approach for participatory irrigation management; and (iii) cost increases associated with the extension of consulting services packages 1 and 2 as the project extended by 18 months. The loan and grant proceeds were fully utilized. Following refund of the unused imprest advances from the government in January 2014,17 the project disbursed $89.4 million: (i) $20.4 million or SDR13.3 million from Loan 2064-INO, (ii) $54.0 million from Loan 2065-INO and (iii) $15.0 million from Grant 4299-INO. 34. During the project period, the Government of the Netherlands advanced $15.0 million to the grant’s account in ADB in 10 remittances for implementation of the project. The first remittance was made on 24 June 2005 and the last on 23 November 2012. Full utilization of the grant was $14,846,374.14 for project expenditures and $153,555.51 for the administration service charge to ADB. The Government of the Netherlands did not require refund of the fund balance of $70.35 as this amount was far below the threshold amount for refund of project funds as defined by the Government of the Netherlands. E. Project Schedule
35. At appraisal, the implementation schedule planned project completion within 7 years. However, loan signing was delayed for more than 1 year until issuance of the Water Law No. 7 in 2004 and the project only became effective on 2 June 2005, 1.5 years after ADB approval on 19 December 2003. The project became operational in the second half of 2006 after the
17
ADB received from the Government of Indonesia a refund of $170.46 on 8 January 2014 for Loan 2064-INO, $8,241.67 and $180.00 on 13 January 2014 for Loan 2065-INO, and $11.63 on 10 January 2014 for Grant 4299-INO.

9
issuance of Government Regulation 20/2006 on irrigation management. During 2007 and 2008, project implementation was slow because of the late availability of DGRD funds which were only made available in the third quarter. In 2010, the available project funds for the irrigation program were below the approved AWP amounts and the carry-over facility was discontinued. As a result, the completion of all remaining works within the original loan closing date of 30 June 2011 was not possible. To mitigate these delays and ensure full realization of project outcomes, the loan closing date was extended for 18 months from 1 July 2011 to 31 December 2012. Appendix 9 shows the planned and actual implementation schedule. F. Implementation Arrangements
36. The project was implemented under the same arrangements as designed at appraisal. At the national level, the project was guided by the NSC-WR, chaired by the director for water resources and irrigation of BAPPENAS, with membership of MPW, MOHA, and MOA. Day-to-day implementation was guided by the NPCMO, under the chair of the director of irrigation and lowlands at DGWR, with DGRD and DGAFI as members, and by provincial and district level coordination units (PPCMOs and KPCMOs) under the chair of the regional planning development agencies (BAPPEDA). Project implementation units were established at DGWR, DGRD, DGAFI, BAPPENAS, provincial and district BAPPEDA, water resources agencies, and agriculture agencies. The only change was resulted from the government’s PP 38/2007, which reassigned capacity building for the development and strengthening of WUAs and WUAFs from the MOHA to the MOA. G. Conditions and Covenants
37. All 19 loan covenants have been fulfilled. The submission of the government’s project completion report, due in June 2013, was delayed because of government reconciliation of the over-commitment of funds until submission of the last withdrawal applications to ADB in September 2013. All audited financial reports were submitted in a timely manner on or before 30 September. The audited financial reports for FY2006–FY2012 were all unqualified. Although the covenant on the provision of counterpart funds was fulfilled, the provision of funds for DGRD’s activities in districts and provinces was late throughout project implementation. In 2007 and 2008, the funds for BAPPEDA’s profiling of irrigation systems, provision of facilitators for farmers, and WUA strengthening and empowering were significantly delayed—delaying implementation. Compliance with loan covenants is detailed in Appendix 10. 38. Gender action plan. The project introduced the importance of women’s participation and representation in irrigation management through training and workshops to 8,311 government staff and 34,502 farmers. In addition, 26 regional irrigation management regulations, 32 regulations and decrees for KOMIRs, and 32 regulations to redefine the tasks and functions of government staff included the requirement of women’s participation (against a target of 25 irrigation regulations). About 931 out of 5,076 WUAs strengthened and 235 out of 643 WUAFs established have at least one out of typically five board members in a WUA or WUAF, meeting the target of 15% women’s representation. Training for 2,950 members of women farmer groups on the cultivation of high-value crops and agriculture food processing was also provided. Sex-disaggregated data for the government staff and farmers who participated in training and workshops are in Appendix 3, and the updated gender action plan is in Appendix 11. 39. Environment. The project focused on the rehabilitation of existing irrigation systems and the development of institutional capacity at both government and WUA level. No land acquisition or conversion was undertaken that resulted in loss of income, livelihoods, or farmer assets; and

10
no compensatory payments were needed. The environmental impact was minimal and mostly positive because of improved water and land management through the project. The district environment agency used a checklist system for rapid environmental appraisal of each subproject scheme before project interventions. The results of the rapid environmental appraisal were included in the profile and preparation reports for each scheme. The environmental agencies confirmed that all interventions had no significant adverse environmental impacts. H. Consultant Recruitment and Procurement
40. The project engaged a total of 185 person-months of international consultants (213 person-months estimated at appraisal) and 2,453 person-months of national consultants (1,440 person-months estimated at appraisal) in accordance with ADB’s Guidelines on the Use of Consultants (2006, as amended from time to time). Consultants were recruited in four packages: (i) package 1 by DGWR to support the NPCMO; the national, provincial, and district water resources project management units; DGAFI, the national, provincial, and district agriculture project management units; and all tasks to implement parts A and C of the project; (ii) package 2 by DGRD to support the national, provincial, and district planning and development units with the implementation of parts A and C; (iii) package 3 by the Directorate of Programs and Planning, DGWR to implement part B of the project; and to develop and operate the PPMS and financial accounting systems; and (iv) package 4 by BAPPENAS to support policy review and general coordination. 41. In early 2008, the government and ADB agreed on a set of procurement guidelines and tender documents for the project, based on prevailing ADB procurement guidelines and the government’s Presidential Decree 80/2003 on procurement. The tender documents included ADB anticorruption and governance guidelines. In 2010, the government replaced 80/2003 with Presidential Regulation 54/2010, and the National Public Procurement Agency issued a waiver for the project to keep using the agreed the project procurement guidelines. Even after the project closed, one of the participating districts (Lampung Selatan) has continued to apply direct contracting with WUAs because of the good results regarding national and district use of funds, after permission was granted from the National Public Procurement Agency. I. Performance of Consultants, Contractors, and Suppliers
42. In general, the consultants performed their services satisfactorily and in accordance with their terms of reference. The consulting services were arranged in vertical packages among different levels agencies and were thus more effective in assisting district, provincial, and central government agencies in an integrated way. The performance of civil works contractors was satisfactory. Delays in construction of civil works were usually associated with delays in budget provision, in particular in 2010. The quality of civil works done by WUAs and WUAFs was generally highly satisfactory. J. Performance of the Borrower and the Executing Agency
43. The performance of the Ministry of Finance as the borrower was satisfactory. The ministry provided pre-financing for project activities during periods when the imprest accounts’ balances were insufficient. BAPPENAS was very supportive in project implementation, in particular (i) to issue the participatory irrigation management and development role-sharing matrix in June 2008, which was instrumental in successful project implementation; and (ii) to correct and approve AWPs. It requested project districts and provinces to continue the PPSIP approach after project closure, including direct contracting with WUAs and WUAFs.

11
44. DGWR supported the project in making available sufficient and capable counterpart staff to lead and support the NCPMO and the national project management unit (NPMU). It also ensured implementation as agreed in the project administration memorandum. DGAFI, DGRD, and district and provincial governments generally performed in a satisfactory manner, setting up the required institutions and participating in the project, particularly for project coordination and monitoring. DGWR, DGRD, DGAFI, and the local government agencies (BAPPEDA, water resources, and agriculture) developed good coordination and cooperation both horizontally and vertically, as well as with WUAs and WUAFs through the KOMIRs. K. Performance of the Asian Development Bank
45. The performance of ADB was satisfactory. It fielded 14 review missions (twice yearly) during project implementation to monitor project progress regularly. ADB missions held discussions with the executing agencies, carried out site visits, and met with local government as well as WUAs and WUAFs to assess whether the project was implemented according to design. ADB took the necessary actions to improve project implementation and accelerate disbursement by approving changes in scope and implementation arrangements, and increased the imprest account advance to 10% of the respective loan and grant amounts.
III. EVALUATION OF PERFORMANCE
A. Relevance
46. The project was highly relevant in terms of consistency with ADB’s country strategy and the government’s development objectives, and it remains so. It greatly contributed to the introduction and implementation of new government policies and principles for participatory irrigation enumerated in government regulation PP 20/2006. This included the (i) introduction of WUA direct contracting, (ii) development of the RP2I and PAI, (iii) establishment of KOMIRs, and (iv) support to formulate the irrigation management fund principles for O&M. The project effectively supported the 27 participating districts and the six provinces with development of the overall work plan agreed by all agencies on the list of systems for rehabilitation and activities. It increased food security, contributing to the country’s goal of 10 million tons of rice production surplus, as stated in Presidential Decree 5/2011. B. Effectiveness in Achieving Outcome
47. The project was effective in meeting its outcome. It achieved its revised physical targets and significantly raised rice production in the subprojects. The project target for sustained decentralized management of irrigation systems was satisfactorily achieved through the enactment of local regulations on improved irrigation management, development of RP2Is, establishment of KOMIRs for district and provincial governments, and empowered WUAs and WUAFs. System performance improved in 457,220 ha of rehabilitated schemes. The PCR study (Appendix 12, para. 14) confirmed that at completion, average rice yields in the wet season were estimated to have increased by 0.96 ton (t) from 5.47 t/ha to 6.43 t/ha (17.6%) and in the dry season by 0.91 t from 5.08 t/ha to 5.99 t/ha (18.0%). C. Efficiency in Achieving Outcome and Outputs
48. The project activities were effectively implemented, and the project used its resources efficiently to achieve its revised immediate outcomes and outputs. The weighted average

12
economic internal rate of return (EIRR) for the 15 schemes surveyed and analyzed during the PCR mission is 74%, with Cisiih scheme in Banten Province having the lowest EIRR of 27% (Appendix 12, paras. 12 and 13). If investment costs are expanded to include all project costs and overheads, based on the argument that the benefits could not have been achieved without all investments, the average EIRR is 54%, and the EIRR for Cisiih scheme is reduced to 19%. The average EIRR in the PCR is significantly higher than either the average EIRR of 29% estimated at appraisal or the average of 24% estimated for these schemes in the subproject study. 49. The main reasons for the high EIRRs are that (i) the civil works targeted only the major constraints in the systems with the highest marginal returns from small investments; (ii) the project’s participatory approach with training for WUAs and WUAFs in O&M and water management was very successful in improving production performance; (iii) agricultural support services, including agricultural training and demonstration units contributed to yields; and (iv) severely degraded tertiary canal systems were improved with farmer input. Together, these interventions significantly increased cropping intensity and yields. D. Preliminary Assessment of Sustainability
50. Project sustainability relates to the infrastructure and institutions developed at provincial, district, and subproject level. The availability of routine O&M funds, KOMIR functionality, and support for WUAs and WUAFs are considered important to the sustained improvements to irrigation systems. The level of O&M funding has generally increased. It has reached higher levels in national and provincial schemes, and increasing levels in district schemes even though it is generally not as high as the levels requested in RP2I budgets. However, the RP2I has raised awareness of irrigation and facilitated the allocation of additional district funds for irrigation activities in many cases. 51. Local capacity and institutions for irrigation management improved with the development of KOMIRs, RP2Is, WUAs and WUAFs; and the adoption of a farmer-driven irrigation management approach. This will help ensure project sustainability. Additional resources and support to the KOMIRs affected by frequent staff rotation are necessary to sustain project outcomes. The project developed WUAs and WUAFs to sustain improved district irrigation systems. It supported the participation of WUAs and WUAFs in O&M for the primary and secondary level systems through the joint management PIMA with the district water resources agencies. O&M for the tertiary level systems is the responsibility of WUAs. The sustainability of overall project benefits is rated likely. E. Impact
52. The long-term expected impact of the project was a 15%–20% increase in farm family incomes and a one-third reduction in the incidence of poverty among project beneficiaries by 2012. Average net farm incomes increased from Rp10.2 million before the project to Rp23.4 million with the project or 129.5% increase in nominal values. Poverty rates fell from about 24.8% in 2008 to 6.8% in 2012, well in excess of the target impact of one-third reduction by 2012. This can be largely attributed to significant rice yield increases, which were attributed to a combination of improved infrastructure, better O&M, and improved agricultural practices. 53. The project had a positive impact on farmers by promoting their involvement through WUAs, upgrading irrigation infrastructure, and improving O&M. The project had a positive

13
impact on institutions responsible for irrigated agriculture at the provincial and district levels. Training provided under the project improved institutional capacity. 54. The project successfully enabled more women’s participation in irrigation management. It formalized women’s participation in irrigation management regulations in decrees for KOMIRs and regulations to redefine tasks and functions of staff. Increasing numbers of WUAs formed had one or two women board members.
IV. OVERALL ASSESSMENT AND RECOMMENDATIONS
A. Overall Assessment
55. The project was implemented generally as conceived, although some changes were required, including the reduction of coverage of SRR schemes from 625,000 ha to 319,000 ha, and a change in financing percentage for civil works contracts. The project rehabilitated 457,220 ha of irrigation systems; enacted regulations for improved irrigation management; developed RP2Is to manage existing systems and develop new systems; established KOMIRs; empowered government staff, WUAs, and WUAFs for participatory irrigation management; and enabled greater women’s participation in irrigation management. 56. The project supported the introduction of decentralized management for irrigation on a sustainable basis, and promoted the concept of farmers’ participation in all aspects of irrigation management and development. The experience gained by participants working closely together on the project was instrumental to improved participatory irrigation planning and application of the RP2I by KOMIRs. Farmers and local government officials showed a higher degree of ownership of the participatory concept compared with earlier irrigation management projects in the country. The RP2I has helped to secure necessary funds for O&M at higher amounts than before the project, and farmers were willing to contribute their own funds to WUAs for O&M of tertiary canals. 57. The project was instrumental in developing and implementing the concept of participatory irrigation management and development. Based on the assessment of relevance, effectiveness, efficiency, and sustainability, the project is rated successful. B. Lessons
58. Major lessons drawn from the project include the following: (i) Institutional coordination. The project developed good coordination across the three
executing and implementing agencies both horizontally and vertically, which was essential to deliver project outcomes that relied on an integrated approach.
(ii) Appropriateness of a participatory approach. The project has shown that the
participatory approach in irrigation development and management is a feasible concept and that farmers are eager to be involved with irrigation O&M and management. The involvement of WUAs and WUAFs in the KOMIRs provided a good approach to address irrigation water distribution, cropping patterns, and O&M planning and implementation.
(iii) Farmer involvement in rehabilitation. WUA involvement in rehabilitation works yielded
better quality and more efficient implementation than similar works implemented by

14
contractors. The WUAs and WUAFs were also willing to contribute their own resources to the work program.
(iv) Participative irrigation development and management system. The project was
transformative in developing the national system for participatory irrigation management and development. In most project provinces, this approach is now applied to the government’s own provincial and district programs.
(vi) Roles, tasks, and capacity of water users associations and federations. Further
support is needed at district and provincial level to ensure WUAs and WUAFs develop into effective and sustainable organizations. Sufficient district and provincial level resources should be allocated to ensure that project gains are sustained and enhanced.
(vii) Operation and maintenance of rehabilitated infrastructure. Greater focus should be
placed on O&M arrangements, which should be incorporated into the PIMA with district governments. The RP2I is an effective planning mechanism that provides appropriate O&M for district systems using a needs-based budget approach.
(viii) Agricultural development. The agricultural program was initially limited to classroom
training, but adjusted to promote field level agriculture demonstrations and rehabilitation of tertiary irrigation canals. It was very successful and contributed to the high economic returns of the project.
(ix) Financial management. The use of prorated financing across the three sources of
funds for all expenditure categories should be avoided. Adequate initial advances to imprest accounts should be provided to minimize pre-financing of loan activities through government temporary accounts. The fund flow mechanism adopted by DGRD for regional activities should not be used in future projects.
C. Recommendations
1. Project Related
(i) Further action or follow-up. Project sustainability can be maintained (a) through improved coordination between the main stakeholders in the form of adequate support for and regular meetings of the KOMIRs and WUAs, and (b) updating and continued use of the RP2I in the district financial development planning process.
(ii) Operation and maintenance budgets for rehabilitated district schemes. While
awaiting the Ministry of Finance regulation on irrigation O&M funding, DGWR and DGRD should continue monitoring the O&M needs of systems as calculated in the RP2I using a needs-based approach, and closely coordinate with district and provincial governments and the MOF to ensure sufficient funds for O&M, either from national or local sources.
(iii) Support for involvement of water users associations and federations. Routine
support budget for WUAs and WUAFs, and their involvement in routine local government funded O&M activities, are required to sustain the WUAs and WUAFs formed and strengthened under the project.
(iv) Additional assistance. The project promoted the concept of participatory irrigation
development in 27 districts. However, given the extent of the irrigated areas in the

15
districts (about 1,317,000 ha), the project was only able to support activities on about 33% of the total irrigated area in the districts. Follow-up action is recommended to extend the benefits to the remaining 67% of the irrigated area in these districts.
(v) Improvement of asset management information system (SI-PAI) and district
irrigation management plan information system (SI-RP2I). The PAI approach was updated and is now formalized under the Ministry of Public Works Decree 13/2012. The SI-PAI developed under the project in 2008 needs to be improved to respond to the new regulation and the related SI-RP2I to incorporate the spatial planning aspect. DGWR should implement the improvement of both information systems.
2. General
59. The general recommendations for future irrigated agriculture projects are below. (i) Based on the project experience, three outstanding legal provisions should be enacted:
(a) the government regulation on irrigation management funding by the MOF; (b) a legal basis for the RP2I to be linked to the five-year government development plans and regular budgeting cycles; and (c) a clearer legal basis to allow direct government WUA contracting for O&M and technically appropriate rehabilitation activities.
(ii) With the WUAs and WUAFs developed and legalized, combined with the lack of farmers’ cooperatives, it is possible that the role of WUAs and WUAFs could be expanded into agriculture production and/or marketing functions to help achieve economies of scale and address inefficiencies in the agricultural production value chain.
(iii) The project has proven that technically and administratively trained WUAs and WUAFs
are able to execute effective O&M and light rehabilitation programs through direct contracting. Based on this experience, this contracting modality should be scaled up under government funding.
(iv) The concept of providing infrastructure for irrigated agriculture as a vehicle for
generating income for smallholders remains viable and is supportive of the government’s program to reach 10 million tons rice surplus in 2014.
(v) For future projects in irrigated agriculture, the following aspects should be addressed:
(a) spatial planning in relation to conversion of agricultural land, (b) catchment protection to sustain water sources, and (c) constraints in the agriculture sector outside of irrigation.
(vi) The project has laid a solid foundation for institutional coordination at district and
provincial level between the local agencies involved and the national government agencies DGWR, MOA, and MOHA. In future, this institutional coordination has to be expanded to involve (a) river basin agencies in charge of irrigation schemes larger than 3,000 ha to prepare the strategic plan for water resources in the river basin; and (b) local government agencies responsible for spatial planning to draft the detailed spatial plans. The river basin agencies and local government agencies responsible for spatial planning should be made members of the KOMIR.

16 Appendix 1
PROJECT PERFORMANCE AGAINST DESIGN FRAMEWORK
Design Summary
Performance Targets
Achievement At PCR
ImpactIncreased economic growth in 25 districts of rural Indonesia Reduced rural poverty
1.5 million farm family incomes increase by about 15%–20% by 2012 Incidence of poverty among project beneficiaries reduced by one-third by 2012
Average net farm income increased from Rp10.2 million before the project to Rp23.4 million with the project. This is equivalent to an increase of 129.5% in nominal terms. Incidence of poverty fell from 24.4% in the baseline survey in 2008 to 6.8% in the 2012 survey, well in excess of the target impact of one-third reduction by 2012.
OutcomeSustained decentralized management of irrigation systems Increased yields of irrigated crops
Adequate level of routine operation and maintenance (O&M) of irrigation schemes regularly undertaken for about 456,000 hectares (ha) by 2012
a
Deferred maintenance is avoided for 456,000 ha by 2012 Average paddy yields increase by 0.5 ton (t)/ha from 3.5 t/ha to 4.0 t/ha in 2012
1,614 irrigation schemes covering 457,220 ha were rehabilitated to avoid outstanding maintenance works. O&M funds of national standard of $19 per ha were available for all central and most provincial schemes. O&M allocation for nearly all district schemes was below this standard. Average rice yields in the wet season increased by 0.96 t from 5.47 t/ha to 6.43 t/ha (17.6%) and in the dry season from 5.08 t/ha to 5.99 t/ha (18.0%).
Outputs 1. District capacity for
management of devolved irrigation responsibilities upgraded
25 district governments strengthened and functioning effectively as focal points for irrigation management by 2012 5,000 district staff trained in irrigation planning and management by 2012 District irrigation management plan prepared in participating districts by 2012
27 district
b and 6 provincial
governments strengthened to effectively implement their tasks and responsibility for participatory irrigation management, in accordance with current national policies and regulations on irrigation. 8,311 central, provincial, and district government staff trained in participatory irrigation management during the project. The content of district irrigation management plans (RP2Is), which comprise a management plan for existing systems and a development plan for new systems, was endorsed by the National Steering Committee

Appendix 1 17
Design Summary
Performance Targets
Achievement At PCR
for Water Resources (NSC-WR) of the National Planning and Development Agency (BAPPENAS) in November 2008. 26 RP2Is prepared, of which 18 of them have been endorsed by district heads. The legal basis for RP2Is in Indonesian water legislation is still being drafted.
2. Irrigation performance at scheme level improved
6,250 water users associations (WUAs) on government-managed irrigation schemes either strengthened or established by 2012 WUAs within a scheme or in the schemes on the same river within close proximity are federated into water users association federation (WUAFs) O&M in about 456,000 ha implemented in joint management between government and WUAs as agreed in participatory irrigation management agreement (PIMA) arrangements Full cost of O&M of primary and secondary systems by the government and tertiary systems by the WUA assumed by 2012
The target was revised to 5,000 WUAs following a reduction in the coverage of irrigation schemes from 625,000 ha to 456,000 ha in 2009. 5,076 WUAs were formed or revitalized, of which 4,553 WUAs legalized. 643 WUAFs formed and legalized In 2012, the average O&M allocation was Rp138,000 per ha for district schemes, and Rp180,000 per ha for provincial and central schemes. PIMA arrangements for O&M implemented in 87% of entire project area. O&M of primary and secondary systems are the responsibility of the government, supported by WUAs or WUAFs through the joint management PIMA with the district water resources agencies. Full cost of O&M of tertiary systems is already the responsibility of WUAs since issuance of Regulation 20/2006 on irrigation management.
3. District agricultural services rationalized and developed, WUAs strengthened and empowered,
Adoption of improved irrigation agronomy techniques by members of 5,000 WUAs Adoption of improved
Improved agriculture practices adopted. Some 112 agricultural training and demonstration (ATD) units established provided a range of 9 agricultural topics including system

18 Appendix 1
Design Summary
Performance Targets
Achievement At PCR
farmer access to agricultural services and inputs improved
technology packages developed under other projects are adopted by the farmers belonging to 5,000 WUAs The successful completion of pilot study on using WUAs to improve farmers’ bargaining power and make service/input providers more accountable to farmers in 5 districts by 2011
rice intensification, women participation, water management, and access to credit. The Ministry of Agriculture decided to use the ATDs to disseminate new technologies instead of piloting activities. Farmers were trained through these ATD units. Each ATD serves 4,000 ha implemented in 26 districts. 11,794 WUA members received training in intensification and diversification of enterprises, and water management systems. 2,375 farmers received training in access to credit, marketing, and agribusiness development, and 1,168 farmers received training in new agricultural technology. 5,908 farmers participated in field schools, mainly on system rice intensification. 2,905 women farmers participated in high-value crop cultivation and agriculture food processing training.
4. Water resources management information system improved
Water resources data management unit at Directorate General of Water Resources (DGWR) Central Office institutionalized by June 2010
Water resources information and data gathering, processing, and quality control facilities in project districts improved and integrated into the DGWR Central Office decision support system by 2010
The Water Resources Data Unit was institutionalized in 2005 and equipped in 2007.
With reorganization of the Ministry of Public Works in 2008 and establishment of river basin organization (RBO) offices, the tasks of the central office were diluted. In the new setup, tasks for water resource data gathering for cross-boundary rivers were transferred to the provinces and of cross-province rivers to the RBO offices.
In all project districts and provinces, water resource information centers were set up. A link with the DGWR Central Office’s decision support system is still under construction.

Appendix 1 19
Design Summary
Performance Targets
Achievement At PCR
Activities A-1. Strengthening Irrigation Management Capacity in 25 Districts Initiate public awareness campaign on the irrigation management reform program (IMRP) and Law 77/2001 on Irrigation Prepare policy guidelines and district irrigation regulations (perda) and regional decrees Establish irrigation commissions (KOMIRs) Rationalize and strengthen regional irrigation institutions in accordance with new perda and decrees
Media dissemination and information campaigns completed in 25 districts by the end of 2008 KOMIRs established in 25 districts by 2010 Reorganization to be completed by 2010 and about 5,000 government staff trained in improved delivery of public services by 2012 At least 33% of trainees will be women
Public awareness campaigns in all districts and provinces completed during 2006–2008 on the new Water Law 7/2004 and the new participatory irrigation principles in the Government Regulation 20/2006 on Irrigation. 26 district and 6 provincial irrigation policy documents (perda) issued (4 in 2007, 12 in 2008, 12 in 2009, 1 in 2010, and 3 in 2011) 26 district and 6 provincial KOMIRs established All district and provincial governments were reorganized and streamlined following PP 37/2007 and 41/2007 regulations on redefinition of tasks and functions of staff. The project’s gender action plan was updated in October 2009. Requirement for women’s participation included in irrigation regulations, KOMIRs, and redefinition of tasks for staff. Women’s participation in training and workshops varied from 7% to 34%. 971 women government staff out of 8,311 staff participated in training and workshops on coordination and participatory irrigation management 7,573 women farmers out of 34,502 farmers participated in WUA institutional activities. 2,950 members of women farmer groups received training in cultivation of high-value crops and food processing that lead to increased income.

20 Appendix 1
Design Summary
Performance Targets
Achievement At PCR
Review and update status of existing irrigation schemes in the district Develop district irrigation management plan (DIMP) Implement DIMP—assist WUA develop and implement irrigation management plan (IMP) of individual schemes Establish kabupaten (district) irrigation management fund (KIMF)
Asset management system designed and implemented, and inventory of irrigation infrastructure completed in 26 districts by 2010 DIMPs (RP2Is)developed in 25 districts by 2011 DIMPs are implemented in 25 districts and IMPs are developed and implemented in 6,250 WUAs by 2010 KIMFs are established and made operational by 2011
Inventory of 431,111 ha of irrigation infrastructure completed for asset management system and district programming NSC-WR approved RP2I contents and process in November 2008. Training in RP2Is provided to regional staff in 2009 and 2011. 26 RP2Is developed; 18 endorsed by district heads. Gradual implementation of the RP2I started from 2011 following endorsement of the RP2I by district head. Irrigation management fund mechanisms have not been introduced during project awaiting issuance of the national irrigation management fund guidelines to be issued through a ministerial decree by the Ministry of Finance, which was not issued yet by end of the project
A-2: Strengthening 5,000 Water Users Associations Strengthen and empower WUAs through awareness on Irrigation Management Reform Program (PKPI), community mobilization, and training on irrigation management Assist WUAs in conducting schemes and asset surveys Assist WUAs in preparing draft irrigation management plan (IMP) for individual
5,000 WUAs established and strengthened by the end of 2012 District irrigation regulation will recommend that at least 15% of WUA elected members comprise women Asset surveys completed on irrigation schemes covering 456,000 ha by mid-2011 Draft IMPs completed on irrigation schemes covering 456,000 ha by the end of 2009
The government has replaced the PKPI with the new participatory irrigation principles in the Government Regulation PP 20/2006 from the Ministry of Public Works. 5,076 WUAs and 643 WUAFs established and strengthened 26 district irrigation regulations have recommended women’s participation. 931 WUAs and 235 WUAFs have at least 1 female board member, meeting the target of 15% women’s participation. Asset surveys completed in 431,111 ha. Scheme profiling PSETK activities with WUAs completed in 457,220 ha. IMPs completed in 1,299 (80%) out of the project’s 1,614 schemes 1,299 scheme level IMPs approved

Appendix 1 21
Design Summary
Performance Targets
Achievement At PCR
schemes, and WUAs in submitting draft IMPs to ICs ICs review, revise, and approve IMPs
District concludes a participatory irrigation management agreement (PIMA) with WUA
IMPs approved for irrigation schemes covering 456,000 ha by 2012 PIMAs signed with 5,000 WUAs by 2012
by end of 2012. PIMAs signed with 1,404 WUAs or WUAFs in project’s 1,614 schemes. The PIMAs were largely signed between the district water resources agencies and WUAFs.
A-3: Sustainable Operation of Irrigation Infrastructure Provide assistance in O&M (declining basis for 3 years) and needs-based budgets WUA submits proposal for sustainable replacement of rehabilitation (SRR) to IC WUA implements SRR after approval by IC
IC evaluates and approves proposals for rehabilitation works on selective basis IC assists in construction supervision, quality control, and related training
On the tertiary systems where the project’s capacity building and irrigation improvement program has been implemented, the full cost of O&M is gradually assured in full by 2012 Proposals by 1,450 WUAs are received by IC by 2009 Implementation of SRR in 319,000 ha in around 1,100 schemes completed by 2011 Proposals for rehabilitation works approved 137,000 ha received by the IC by 2008 Rehabilitation activities are completed on 137,000 ha by 2011
Full cost of O&M on tertiary systems is the responsibility of WUAs Tertiary systems involving 947 tertiary blocks covering 85,418 ha were improved under the project WUA proposals for improvement made through PSETK activities in 457,220 ha of irrigation schemes SRR works in 314,777 ha completed by WUAs or WUAFs in 2,142 contracts
Rehabilitation works approved and completed in 142,443 ha by local contractors with work sharing with qualified WUAs or WUAFs
A-4. Providing Support for Irrigated Agriculture Assess the extension and credit needs for irrigated agriculture
Rationalize and strengthen district agriculture services
Assess the performance of past programs aimed at strengthening technical, organizational, managerial, and bargaining capacity of WUAs for better deals with inputs and service providers and making the providers
Participatory needs assessment carried out with 5,000 WUAs
125 trainers trained in 25 districts
Assessment of past programs completed and strategy formulated by 2009
Assessment for irrigated agriculture was made in 2008.
All 125 trainers trained in 26 districts
Assessment completed and strategy formulated in 2009 with 9 programs introduced for the project for irrigated agriculture

22 Appendix 1
Design Summary
Performance Targets
Achievement At PCR
responsive and accountable to clients
Building on past experience, develop and implement a pilot program in 5 districts for strengthening of WUAs Disseminate new technologies that were tested and recommended for field use by the Ministry of Agriculture under various programs including the ADB-assisted Poor Farmers’ Improvement through Innovation Project
Pilot activities on improving farmers’ access to credit and development of agribusiness
Training workshops, field demonstrations, farmer days and farmer exchange visits held for 5,000 WUAs
The Ministry of Agriculture decided to use the approach of using 112 agriculture training and demonstration (ATD) units established in the project to disseminate new technologies instead of piloting activities. Farmers were trained through these ATD units. Each ATD serves 4,000 ha implemented in 26 districts. 11,794 farmers trained on intensification and diversification of enterprises, water management system
2,375 farmers trained in access to credit, marketing, and agribusiness development; 1,168 farmers in new agriculture technology; 10,307 farmers trained in organizational and financial management
B. Improving Water Resources Management Information System DGWR initiates action for structural integration of the Water Resources Data Management Unit (WRDMU) and the required ministerial decree issued
WRDMU provided with adequate number of qualified staff
Water resources data and information management system in the participating districts and provinces assessed, and required hardware together with appropriate generic software models provided
Train district staff on data collection, quality control, and user needs assessment
The ministerial decree issued and integration initiated by 2009
WRDMU operational by 2008
The system design completed by 2007 and 26 districts and 6 provinces equipped with relevant hardware and software by 2009
Staff training for 175 district staff and 30 provincial staff completed
In present legal setup, no ministerial decree on water resource data center is foreseen.
WRDMU operational since 2005 and reorganized in 2008
System design and development completed in 2008
Training of trainers for the project’s 6 provinces and later expanded to other 24 provinces completed. Provinces trained district agencies.

Appendix 1 23
Design Summary
Performance Targets
Achievement At PCR
Based on 2011 project performance monitoring system (PPMS) report, about 49% of the water resources data centers were able to operate independently.
C. Project Coordination and Monitoring Support harmonization of all water resources and irrigation development programs in the country Effective project coordination
The National Steering Committee for water resources (NSC-WR) is operational National project coordination and monitoring office (NPCMO), provincial and district PCMO are operational Consulting services mobilized Project performance management system (PPMS) and financial management information system (FMIS) are operational
NSC-WR established in January 2005 NPCMO established on 23 June 2006. All 6 provincial and 27 district PCMOs were established over 2005–2007 All 3 consulting services packages were mobilized in early 2007. The consultant services package 3 closed in January 2011; package 2 in December 2011, and package 1 on 22 May 2012. PPMS and FMIS developed in 2007 but compilation of data was delayed until 2010 after provincial training was provided. PPMS was implemented by province and district agencies, and NPCMO at central level FMIS was a useful financial information system for the project, implemented by NPCMO to prepare withdrawal applications and monitor disbursements.
a The project performance target to rehabilitate 625,000 ha of irrigation systems was modified to 456,000 ha
approved by ADB on 15 October 2009. At appraisal, the project was expected to undertake SRR works covering about 625,000 ha and rehabilitate 137,000 ha for sustainable operations of irrigation infrastructure. Due to significant increases in unit costs for civil works resulting from increases in fuel costs in 2005 and 2008, the scope of SRR works was reduced to 319,000 ha. With rehabilitation works of 137,000 ha, the performance target was revised to 456,000 ha.
b Including Pesawaran District, a new district split in 2006 from Lampung Selatan District, Lampung Province and
Toraja Utara District split in 2009 from Tanah Toraja District in South Sulawesi Province. IC = Irrigation Commission, PIMA = participatory irrigation management agreement, RP2I = Rencana Pengembangan dan Pengelolaan Irigasi (district irrigation management plan). Source: National Project Coordination and Monitoring Office.

24 Appendix 2
LIST OF IRRIGATION REGULATIONS ISSUED IN PROJECT DISTRICTS AND PROVINCES
No. Province/District Regulation No. Date Issued Title of Regulation
I. Lampung Province 11/2011 27 Sep 2011 Irrigation 1. South Lampung 5/2008 28 Jul 2008 Irrigation 2. East Lampung 4/2008 6 Oct 2008 Development and
Management of Irrigation Systems
3. Central Lampung 6/2009 22 Apr 2009 Irrigation 4. Pesawaran 14/2011 2 Dec 2011 Irrigation II Banten Province 15/2008 30 Dec 2008 Irrigation 5. Lebak 5/2008 30 May 2008 Irrigation 6. Pandeglang 3/2008 23 Jun 2008 Irrigation III East Java Province 3/2009 6 Jul 2009 Irrigation 7. Madiun 7/2008 11 Apr 2008 Irrigation 8. Tulungagung 9/2007 13 Aug 2007 Irrigation 9. Bojonegoro 2/2009 29 Apr 2009 Irrigation Systems in
Bojonegoro 10. Lamongan 14/2007 31 May 2007 Irrigation 11. Ngawi 8/2009 2 Sep 2009 Irrigation 12. Malang 2/2008 29 Feb 2008 Irrigation IV. Central Java Province 8/2009 7 Sep 2009 Irrigation 13. Banyumas 11/2009 1 Jul 2009 Irrigation 14. Purworejo 2/2009 10 March 2009 Irrigation 15. Brebes 13/2008 12 Nov 2008 Irrigation 16. Tegal 4/2008 31 May 2008 Development and
Management of Irrigation Systems
17. Cilacap 1/2009 19 Feb 2009 Irrigation V. West Java Province 4/2008 9 Jul 2008 Irrigation 18. Garut 12/2008 20 Aug 2008 Irrigation 19. Kuningan 14/2007 10 Oct 2007 Irrigation 20. Indramayu 22/2007 29 Dec 2007 Irrigation 21. Cirebon 24/2009 9 Dec 2009 Irrigation VI. South Sulawesi Province 3/2009 11 Mar 2009 Irrigation 22. Sinjai 4/2010 16 Aug 2010 Irrigation 23. Maros 3/2008 17 Apr 2008 Irrigation 24. Bone 12/2009 25 Jun 2009 Irrigation Systems in
Bone 25. Bulukumba 5/2009 14 Aug 2009 Irrigation 26. Tana Toraja 5/2008 11 Oct 2008 Irrigation 27. North Toraja 18/2011 1 Jul 2011 Irrigation Source: National Project Coordination and Monitoring Office

Appendix 3 25
TRAINING FOR GOVERNMENT STAFF AND WATER USERS ASSOCIATIONS
Table A3.1: Training for Government Staff
No. Topic Men Women Total % Women
1. Planning and coordination 3,890 662 4,552 15 2. Participatory design, construction, and operation
and maintenance 2,378 184 2,562 7
3. Participatory agriculture in irrigated land 957 82 1,039 8 4. Overseas training in water management 50 10 60 17 5. Short course in participatory irrigation
management (PPSIP) 65 33 98 34
Total 7,340 971 8,311 PPSIP = Pengembangan dan Pengelolaan Sistim Irigasi Partisipatif (participatory irrigation development and management). Source: National Project Coordination and Monitoring Office.
Table A3.2: Training for Water Users Associations
No. Topic Trainer Men Women Total % Women
1. Training and implementation of scheme profiling PSETK
District BAPPEDA
3,421 0 3,421 0
2. Participative design of irrigation rehabilitation
District Water
Resources
305 0 305 0
3. Participative implementation of irrigation rehabilitation/ construction
District Water
Resources
364 0 364 0
4. Participative operation and maintenance of rehabilitated schemes
District Water
Resources
1,043 0 1,043 0
Subtotal A (Technical) 5,133 0 5,133 5. Institutional and management
of water users associations District
BAPPEDA, Agriculture, and MOA
8,401 1,906 10,307 18
6. Intensification, extensification, diversification, and water management
District Agriculture Services
9,914 1,880 11,794 16
7. Access to information and credit
District Agriculture Services
2,221 154 2,375 7
8. Access to new agriculture technology
District Agriculture Services
1,039 129 1,168 11
9. Field schools, mainly on system rice intensification
District Agriculture Services
5,354 554 5,908 9
10. Cultivation of high economic-value crops and agriculture food processing
District Agriculture Services
0 2,950 2,950 100
Subtotal B (Institutional and Agriculture) 26,929 7,573 34,502 Total (A + B) 32,062 7,573 39,635
BAPPEDA = Badan Perencanaan Pembangunan Daerah (Regional Planning and Development Agency), MOA = Ministry of Agriculture, PSETK = Profil Sosial Ekonomi Tehnis dan Kelembagaan (social, economic, technical, and institutional profile). Source: National Project Coordination and Monitoring Office.

26 Appendix 4
LIST OF DISTRICT IRRIGATION MANAGEMENT PLANS PREPARED
No.
District
Status of Endorsement of RP2I by District Head
Typea Approval Document No. Date
I. Lampung Province
1. South Lampung Management and development plan SK B/432/III.17/HK/ 2012 2012 2. East Lampung Management and development plan SK 649/19/SK/2011 22 Dec 2011 3. Central Lampung Management and development plan Endorsement letter 2012 4. Pasawaran Management and development plan Endorsement letter 2012 II. Banten Province
5. Pandeglang Management and development plan Not available 6. Lebak Management and development plan Endorsement letter 2012 III. West Java Province
7. Garut Management and development plan Endorsement letter 30 Dec 2011 8. Kuningan Management and development plan SK 611/KTPS.407-
BAPPEDA/2011 07 Nov 2011
9. Cirebon Management and development plan Endorsement letter 01 Dec 2011 10. Indramayu Management and development plan Endorsement letter 16 Jan 2012 IV. Central Java Province
11. Cilacap Management and development plan SK 525/529/27/2011 20 Dec 2012 12. Banyumas Management and development plan PerBup 43 of 2012 12 Nov 2012 13. Purworejo Management and development plan SK 188.4/284/2011 11 Apr 2011 14. Tegal Management and development plan SK 050/685/2011 15 Dec 2011 15. Brebes Management and development plan Endorsement letter 2012 V. East Java Province
16. Tulungagung Management and development plan Endorsement letter 2012 17. Malang Management and development plan 180/1822/KEP/421.013/2011 30 Dec 2011 18. Madiun Management and development plan Not available 19. Ngawi Management and development plan Not available 20. Bojonegoro Management and development plan Not available 21. Lamongan Management and development plan Not available VI. South Sulawesi Province
22. Bulukumba Management and development plan Endorsement letter 2012 23. Sinjai Management and development plan PerBup 8 of 2013 27 Feb 2013 24. Maros Management and development plan Not available 25. Bone Management and development plan Nota available 26. Tana Toraja Management and development plan Not available 27. North Toraja Management plan Not available BAPPEDA = Badan Perencanaan Pembangunan Daerah (Regional Planning and Development Agency), RP2I = Rencana Pengelolaan dan Pengembangan Irigasi (district irrigation management plan). a The development plan prepared is based on the overlay of irrigation maps on spatial planning maps.
Source: National Project Coordination and Monitoring Office.

Appendix 5 27
STRENGTHENING OF WATER USERs ASSOCIATIONS AND FEDERATIONS
Table A5.1: Strengthening of Water User Associations
No. Province By BAPPEDA 2006–2007
By District Agriculture 2008–2012
Total
Formation or Revitalization
Legalization Formation or Revitalization
Legalization Formation or Revitalization
Legalization
1. Lampung 86 74 235 235 321 309
2. Banten 70 70 386 369 456 439
3. West Java 237 116 692 683 929 799
4. Central Java 295 212 878 853 1,173 1,065
5. East Java 501 240 595 648 1,096 888
6. South Sulawesi 231 210 870 843 1,101 1,052
Total 1,420 922 3,656 3,631 5,076 4,553
BAPPEDA = Badan Perencanaan Pembangunan Daerah (Regional Planning and Development Agency). Source: National Project Coordination and Monitoring Office.
Table A5.2: Strengthening of Water Users Association Federation (WUAF)
No. Province By BAPPEDA By Water Resources Services
By Agriculture Services
Total
Formation or Revitalization
Formation or Revitalization
Formation or Revitalization
Formation or Revitalization
Legalization
1. Lampung 5 0 24 29 29
2. Banten 16 21 73 110 110
3. West Java 47 34 88 169 169
4. Central Java 25 17 41 83 83
5. East Java 34 0 59 93 93
6. South Sulawesi 40 25 94 159 159
Total 167 97 379 643 643
BAPPEDA = Badan Perencanaan Pembangunan Daerah (Regional Planning and Development Agency). Source: National Project Coordination and Monitoring Office.

28 Appendix 6
SUMMARY OF IMPROVEMENT WORKS COMPLETED No Schemes SRR Works Rehabilitation Works Total
By Project By Govt. By Project By Govt.
Qty Size
(ha) Qty Size
(ha) Qty Size
(ha) Qty Size
(ha) Qty Size
(ha)
I. Lampung Province 114 52,413 57 18,826 171 71,239
1. National schemes to province
2 8,250 0 0 2 8,250
2. National schemes to district
3 17,644 0 0 3 17,644
3. Provincial schemes 4 6,461 3 3,211 7 9,672
4. South Lampung 48 9,339 16 5,601 64 14,940
5. Pesawaran 9 2,591 16 5,191 25 7,782
6. East Lampung 16 845 11 1,428 27 2,273
7. Central Lampung 32 7,283 11 3,395 43 10,678
II. Banten Province 69 21,291 23 13,172 3 944 95 35,407
1. Provincial schemes 4 7,518 2 4.682 6 12,200
2. Lebak 19 4,294 15 6,195 34 10,489
3. Pandeglang 46 9,479 6 2,295 3 944 55 12,718
III. West Java Province 85 61,242 3 480 44 21,427 132 83,149
1. National schemes to province
4 20,339 0 0 4 20,339
2. Provincial schemes 8 12,494 4 5,307 12 17,801
3. Garut 22 7,501 16 7,876 38 15,377
4. Kuningan 34 13,757 8 3,867 42 17,624
5. Cirebon 13 5,875 3 480 11 2,532 30 8,887
6. Indramayu 4 1,276 5 1,845 9 3,121
IV. Central Java Province 416 44,480 6 4,345 196 33,107 618 81,932
1. National schemes to district
2 2,331 0 0 2 2,331
2. Provincial schemes 3 4,910 5 4,218 7 5,621 15 14,749
3. Banyumas 64 3,347 72 8,105 136 11,452
4. Purworejo 22 1,961 30 7,190 52 9,151
5. Brebes 152 12,839 1 127 26 6,292 179 19,258
6. Tegal 68 9,897 21 3,252 89 13,149
7. Cilacap 105 9,195 40 2,647 145 11,842
V. East Java Province 269 62,620 62 29,993 331 92,613
1. National schemes to district
1 10,582 0 0 1 10,582
2. Provincial schemes 7 9,156 14 12,363 21 21,519
3. Madiun 35 2,278 20 5,278 55 7,556
4. Tulungagung 59 6,834 4 831 63 7,665
5. Bojonegoro 58 4,985 5 1,714 63 6,699
6. Lamongan 19 7,581 7 3,023 26 10,604
7. Ngawi 72 14,150 6 2,108 78 16,258
8. Malang 18 7,054 6 4,676 24 11,730
VI. South Sulawesi 187 67,906 80 24,974 267 92,880
1. National schemes 7 36,611 0 0 7 36,611
2. Provincial schemes 2 3,755 6 7,699 8 11,454
3. Sinjai 56 5,994 29 4,248 85 10,242
4. Maros 25 3,785 15 3,753 40 7,538
5. Bulukumba 30 6,697 11 4,554 41 11,251

Appendix 6 29
No Schemes SRR Works Rehabilitation Works Total
By Project By Govt. By Project By Govt.
Qty Size
(ha) Qty Size
(ha) Qty Size
(ha) Qty Size
(ha) Qty Size
(ha)
6. Bone 25 7,601 4 2,160 29 9,761
7. Tana Toraja 30 2,537 9 1,500 39 4,037
8. North Toraja 12 926 6 1,060 18 1,986 Grand Total 1,140 309,952 9 4,825 462 141,499 3 944 1,614 457,220
Total SRR Works 1,149 314,777
Total Rehabilitation Works 465 142,443
Govt. = Government, ha = hectare, Qty = quantity, SRR = sustainable replacement of rehabilitation. Source: National Project Coordination and Monitoring Office.

30 Appendix 7
DETAILED PROJECT COST ($’000)
Component
Project Cost Appraisal Estimate Actual
Foreign Local Total Foreign Local Total
I. Investment Costs
A. Capacity building 4.63 13.31 17.94 4.85 14.97 19.82
B. NGO services 0.30 0.91 1.21 0.45 1.32 1.77
C. Studies, surveys, and audits 0.56 1.77 2.36 1.41 4.14 5.54
D. Consulting services
1. International 3.80 0.67 4.47 3.44 0.34 3.78
2. Domestic 0.98 5.54 6.52 11.19 11.19
E. Equipment and materials 0.81 2.43 3.24 0.59 1.71 2.30
F. Vehicles 0.06 0.04 0.10 0.06 0.04 0.11
G. Land acquisition 0.43 0.43
H. Civil works
1. Construction (rehabilitation, SRR, emergency)
12.13 30.33 42.46 14.52 38.28 52.80
2. Construction (farmer contribution)
6.07 6.07 4.91 4.91
I. Salaries and allowance 2.25 2.25 8.82 8.82
J. Travel allowances and per diem 0.91 0.91 1.05 1.05
K. National level coordination and management
0.95 0.95 0.62 0.62
Total Investment Costs 23.30 65.61 88.91 25.32 87.39 112.70
II. Recurrent Costs
A. O&M by government 1.28 1.28 9.68 9.68
B. O&M by farmers 6.43 6.43 1.33 1.33
Total Recurrent Costs 7.71 7.71 11.01 11.01
Total Baseline Costs 23.30 73.32 96.62 25.32 98.40 123.71
Physical contingencies 0.56 1.46 2.02
Price contingencies 0.70 20.66 21.36
Interest during construction 4.58 4.58 2.89 2.89
Commitment charges 1.15 1.15 0.49 0.49
Front-end fees 0.27 0.27 0.27 0.27
Service charges 0.15 0.15
Total Costs 30.56 95.44 126.00 29.02 98.40 127.52
NGO = nongovernment organization, O&M = operation and maintenance, SRR = sustainable replacement of rehabilitation. Note: Numbers may not sum precisely because of rounding. Source: National Project Coordination and Monitoring Office’ Project File and Loan Financial Information System.

Appendix 8 31
ANNUAL DISBURSEMENTS
Year Actual Disbursement ($)
Actual Cumulative ($)
Percentage of Actual
Disbursement
Loan 2064-INO(SF) 2005 0 0 0.0 2006 0 0 0.0 2007 1,595,215 1,595,215 7.8 2008 1,405,379 3,000,594 6.9 2009 2,845,479 5,846,073 14.0 2010 6,291,251 12,137,324 30.9 2011 5,376,803 17,514,127 26.4 2012 1,581,234 19,095,361 7.8 2013 1,263,267 20,358,628 6.2 2014 ( 170) 20,358,458 0.0 Total 20,358,458 20,358,458 100.0 Loan 2065-INO 2005 0 0 0.0 2006 1,231,409 1,231,409 2.3 2007 2,811,697 4,043,106 5.2 2008 3,790,344 7,833,450 7.0 2009 8,889,304 16,722,754 16.5 2010 18,677,817 35,400,571 34.6 2011 14,070,971 49,471,542 26.1 2012 3,315,964 52,787,506 6.1 2013 1,207,468 53,994,974 2.2 2014 ( 8,422) 53,986,553 0.0 Total 53,986,553 53,986,553 100.0 Grant 4299-INO 2005 0 0 0.0 2006 0 0 0.0 2007 2,354,609 2,354,609 15.7 2008 1,364,412 3,719,021 9.1
2009 1,862,723 5,581,744 12.4 2010 4,565,460 10,147,204 30.4 2011 3,695,982 13,843,186 24.6 2012 375,114 14,218,300 2.5 2013 781,700 15,000,000 5.2 2014 ( 70) 14,999,930 0.0 Total 14,999,930 14,999,930 100.0
( ) = negative. Note: The negative figures represent unused funds. Numbers may not sum precisely because of rounding.
Source: Asian Development Bank Loan Financial Information System and Controller’s Department Loan Administration Division and Indonesia Resident Mission’s record for the Grant.

32 Appendix 9
PROJECT IMPLEMENTATION SCHEDULE
Activities
A. National
1. Disseminate information on Water Law 7/2004 and PP Irrigation 20/2006
2. Prepare policy guidelines and regulations in accordance with PP 20/2006
3. Establish National Steering Committee, NPMUs, and NPCMO
4. Recruitment and Field work of Consulting Services
5. Select 25 subprojects/districts
6. Prepare Annual Work Plan and Budget
7. Coordinate implementation
8. Establish and operate project performance management system (PPMS)
9. Establish and operate financial management system (FMS)
B. Provincial1. Disseminate information on guidelines and regulations of PP 20/2006
2. Establish Provincial PCMOs and PIUs and train staff
3. Prepare and disseminate local regulations on irrigation (PERDA)
4. Train trainers
5. Recruit Community Organizers
6. Establish and operate project performance management system (PPMS)
7. Establish and operate financial management system (FMS)
C. District1. Establish District PCMOs and PIUs and train staff
2. Prepare and disseminate local regulations on irrigation (PERDA)
3. Develop district irrigation management plans (DIMP/RP2I) and review
4. Establish Irrigation Commission (IC) and hold periodic meetings
5. Recruit Community Organizers
Year 8
2012
Year 1
2005
Year 2
2006
Year 7
2011
Year 5
2009
Year 3
2007
Year 4
2008
Year 6
2010

Appendix 9 33
PROJECT IMPLEMENTATION SCHEDULE
Activities
6. Train Water User Associations (WUA)/WUA Federations
7. Assess schemes and asset surveys
8. Develop scheme-level management plans, forward to IC
9. Establish and operate project performance management system (PPMS)
10. Monitor and evaluate standards of irrigation management (audit)
11. Assist in construction supervision, QA and related training
12. Implement agricultural initiatives
13. Training - farmers' access to agriculture credit and agribusiness
14. Establish and operate financial management system (FMS)
D. Irrigation System1. Dissemination of irrigation reform at WUA & village level
2. Form/activate WUA
3. Profile secondary/main system
4. Establish/Strengthen WUA/WUA Federation
5. Evaluate scheme-level management plans
6. Survey, investigation and design of irrigation infrastructure
7. Implement improvements: SRR and Rehabilitation of schemes
8. Implement agriculture initiatives
E. Water Resources Information Management Systems
NPMU = National Project Management Unit; NPCMO = National Project Coordination and Monitoring Unit; PCMO = Project Coordination and Monitoring Unit
PIU = Project Implementation Unit; WUA = Water User Association; SRR is simple rehabilitation implemented by farmers/WUAs
: Original
: Actual
2005 2006 2007 2008 2009
Year 1 Year 2 Year 3 Year 4 Year 5
Closing Date
RevisedOriginal
Closing Date
Year 6 Year 7 Year 8
2010 2011 2012

34 Appendix 10
STATUS OF COMPLIANCE WITH LOAN COVENANTS
No. Covenants Reference Compliance
1. The Borrower shall make available, promptly as needed, the funds, facilities, services, land and other resources which are required, in addition to the proceeds of the Loan, for the carrying out of the Project and for the operation and maintenance of Project facilities.
LA, Art III, Section 4.02 Complied with. In general, the funds of the annual work plan (AWP) were made available in a timely manner, with the exception of the Directorate General of Regional Development (DGRD) regional budgets, which were always delayed. District budgets for regional activities were inadequate.
2. In carrying out of the Project, the Borrower shall cause competent and qualified consultants and contractors, acceptable to the Borrower and Bank, to be employed to an extent and upon terms and conditions satisfactory to the Borrower and ADB.
LA, Art III, Section 4.03(a)
Complied with. Three consulting services were in place since January 2007.
3. The Borrower shall (i) maintain, or cause to be maintained, separate accounts for the Project, (ii) have such accounts and related financial statements audited annually in accordance with appropriate auditing standards consistently applied, by independent auditors whose qualifications, experience and terms of reference are acceptable to ADB, (iii) furnish to ADB, as soon as available but in any event not later than nine (9) months after the end of its related fiscal year, certified copies of such audited accounts and financial statements and report of the auditors relating thereto (including auditors opinion on the use of the loan proceeds and compliance with the covenants of this Loan agreement as well as on the use of the procedures for the imprest account/statement of expenditures), all in English language, and (iv) furnish to ADB such other information concerning such accounts and financial statements and the audit thereof as ADB from time to time shall reasonably request.
LA, Art III, Section 4.06(b)
Complied with. All audited financial reports submitted in a timely manner on or before 30 September. The audited financial reports for FY2006–FY2012 were all unqualified. DGWR will follow up on a few remaining audit findings with related implementing agencies to avoid any consequences in future audits by the government audit agencies.
4. The Borrower shall furnish, or cause to be furnished, to ADB quarterly reports on the carrying out of the Project and the operation and management of the Project facilities.
LA, Art III, Section 4.07(b)
Complied with. Consultant’s final report submitted to the Asian Development Bank (ADB) in August 2012.

Appendix 10 35
No. Covenants Reference Compliance
5. Promptly, after physical completion of the Project, but in any event not later than six (6) months thereafter or such later date as may be agreed for this purpose between the Borrower and Bank, the Borrower shall prepare and furnish to ADB a report, in such form and in such detail as ADB shall reasonably request, on the execution and initial operation of the Project, including its cost, the performance by the Borrower of its obligations under this Loan Agreement and the accomplishment of the purposes of the Loan.
LA, Art III, Section 4.07(c)
Complied with delay. ADB received the government’s Project Completion Report on 20 December 2013, after the government submitted its last withdrawal applications in September 2013 and reconciliation of overcommitment funds.
National Steering Committee
6. The existing National Steering Committee (NSC) consisting of representatives from MOA, MOHA, MPW, BAPPENAS and other relevant level agencies shall be responsible for providing overall guidance for Project implementation and shall be chaired by the Deputy Chairman for Infrastructure of BAPPENAS.
Schedule 6, para 3 Complied with. NSC established in 2005 and chaired by the deputy chairperson for infrastructure of the National Planning and Development Agency (BAPPENAS), assisted by a secretariat in the Directorate of Water Resources and Irrigation of BAPPENAS.
National Project Management Unit
7. Each of the EAs shall establish a National Project Management Unit (National PMU) in Jakarta. Each of the National PMUs shall have a Project Director and adequate number of technical, accounting and financial staff, with qualifications acceptable to ADB.
Schedule 6, para 4 Complied with. National project management unit (NPMU) Directorate General of Water Resources (DGWR) was established on 26 May 2005; NPMU DGRD on 2 May 2005; NPMU Directorate General of Agriculture Facilities and Infrastructure (DGAFI) in June 2006.
National Project Coordination and Monitoring Office (PCMO)
8. A PCMO shall be established and shall serve as the secretariat for the NSC. The National PCMO shall be chaired by the DGWR, and include representatives of MOA, MOHA, and BAPPENAS, and be supported by technical and accounting staff.
Schedule 6, para 5 Complied with. Secretariat of National Project Coordination and Monitoring Office (NPCMO) was established on 22 June 2005, chaired by the director of irrigation of DGWR.

36 Appendix 10
No. Covenants Reference Compliance
Provincial PCMO
9. Each participating province shall establish a Provincial PCMO, which shall comprise of staff from relevant sector agencies at provincial level. The Provincial PCMO shall be chaired by the Head of Provincial BAPPEDA.
Schedule 6, para 6 Complied with. 6 provincial project coordination and management offices (PPCMOs) established from July 2005 to March 2007.
Provincial Project Implementation Unit
10. Each of the participating provinces shall establish two Provincial Project Implementation Units (Provincial PIUs), at the Provincial Water Resources Services and Provincial Agricultural Services (PWRS and PAS).
Schedule 6, para 7 Complied with. Established:
Provincial PIUs (PPIUs) in PWRS
PPIUs in Regional Planning and Development Agency (BAPPEDA)
PPIUs in PAS District PCMO
11. At district level, each of the participating districts shall establish a District PCMO. The District PCMO shall be chaired by the head of the District BAPPEDA. The District Water Resources Services and Agricultural Services (DWRS and DAS) shall serve as district PIUs. AWPs shall be reviewed and approved by irrigation commissions comprising heads of district agencies concerned and representatives of NGOs and WUAs.
Schedule 6, para 8 Complied with. 27 kabupaten (district) project coordination and management offices (KPCMOs) established. District PIUs (KPIUs) also established in:
27 District water resources services’ 27 District BAPPEDA, 27 District agriculture services.
6 provincial PPCMOs established. PPIUs also established in:
6 Provincial water resources services, 6 Provincial BAPPEDA, 6 Provincial agriculture services.
Subproject/District Selection Criteria
12. Selection of subprojects or districts shall be carried out by NSC based on an application submitted by the Provincial PCMO. In order for a Subproject/District to be eligible for financing under the Project, the application must show: (i) commitment to reforms; (ii) commitment to the Project implementation modalities; (iii) a time bound action plan for the establishment of an
Schedule 6, para 9 Complied with. 25 districts were selected on 21 May 2007 Two new districts were included in the project: (i) Pesawaran District

Appendix 10 37
No. Covenants Reference Compliance
irrigation commission and a district irrigation management fund (KIMF); (iv) commitment to meeting the environmental, social, gender, indigenous peoples, and resettlement requirements in implementing the Project; and (v) commitment to allocate budget for First-year activities. Higher priority shall be given to those districts that: (i) have high incidence of poverty; (ii) have been implementing the policies set out under the decentralization laws; (iii) have commenced reviews and capacity building of district institutions; (iv) have started participatory programs with WUAs to maintain irrigation infrastructure; and (v) have a high number of established and active WUAs.
split from the core South Lampung District in 2008; (ii) Toraja Utara District split from Tana Toraja District in 2009
Counterpart Funds
13. The Borrower shall ensure and shall cause each of the participating provinces and districts to ensure that the provision of the funds from the loan proceeds and corresponding counterpart funds, necessary for financing the Project activities would continue throughout the Project implementation.
Schedule 6, para 11 Complied with. In 2012, the central budgets were allocated for loan portion activities and some local government budgets for remaining regional activities.
14. The Borrower shall ensure and shall cause each of the participating provinces and districts to ensure that all counterpart funds for project implementation are provided in a timely manner, and to such end, each of the participating provinces and districts will make timely submissions of annual budgetary appropriation requests and take all other measures necessary or appropriate for prompt disbursement of appropriated funds during each year of project implementation.
Schedule 6, para 12 Complied with. 2012 counterpart funds from local government’s budget or17% government portion of civil works were allocated.
Fund Channeling
15. The Borrower shall ensure that throughout the period of Project implementation, the proceeds of the Loan shall be disbursed to Project provinces and districts, by budgetary transfers of funds earmarked for such purposes.
Schedule 6, para 13 Complied with.
16. The Borrower shall ensure and shall cause each of the participating districts to ensure that by 1 September of each year, each of the implementing agencies submits its Annual Work Plan (AWP) and budget for the ensuing fiscal year.
Schedule 6, para 14 Complied with. AWPs prepared and approved in a timely manner in September by NSC-WR.

38 Appendix 10
No. Covenants Reference Compliance
Environmental Management and Monitoring Systems
17. The Borrower shall ensure and will cause the participating provinces and districts to ensure the establishment of environmental management and monitoring systems at district level and to comply with the requirements as outlined in the environmental management plan (EMP).
Schedule 6, para 15 Complied with. Rapid rural environmental impact assessment carried out during preparation subproject summary reports (SSRs) for rehabilitation schemes, and brief summary reports (BSRs) for sustainable replacement of rehabilitation (SRR) schemes.
Women Participation
18. The Borrower shall ensure and shall cause the participating districts to ensure that (i) the proportion of women participants will be maintained at not less than 33% in the training programs at district level and 15% in training programs at scheme level; and (ii) district irrigation regulations require that the proportion of women in the elected officials of WUAs will not be less than 15%.
Schedule 6, para 16 Complied with. Gender action plan was prepared in 2009. (i) NPCMO has
enforced this requirement in training programs.
(ii) District and province regulations on participatory irrigation management have incorporated the requirement for women’s participation in water users associations (WUAs).
Compensation Policy Framework and Procedural Guidelines (CPFPG)
19. The Borrower shall ensure, and shall cause the participating provinces and districts to ensure, that each of the participating provinces and districts will approve CPFPG, and CPFPG provisions will be adhered to in case there are any land acquisitions and/or resettlements.
Schedule 6, para 17 Complied with. 6 provincial and 25 district governments approved the CPFPG. DGRD consolidated the CPFPG and submitted it to ADB.

Appendix 11 39
SUMMARY OF GENDER EQUALITY RESULTS AND ACHIEVEMENTS
I. PROJECT DESCRIPTION
1. The Participatory Irrigation Sector Project was approved on 19 December 2003 and became effective on 2 June 2005, with an original closing date of 30 June 2011. The revised project closing date was 31 December 2012. The impact of the project was increased economic growth and reduced poverty in 25 districts of rural Indonesia in six provinces—Lampung, Banten, West Java, Central Java, East Java, and South Sulawesi. The expected outcomes were decentralized management of irrigation systems on a sustainable basis and increased yields of irrigated crops. The project outputs are (i) district and province irrigation management capacity upgraded, (ii) water users associations (WUAs) strengthened and empowered, (iii) irrigated agriculture supported, and (iv) water resources management information system improved. No gender mainstreaming category was specified at appraisal. However, a gender plan was prepared as part of the summary poverty reduction and social strategy attached to the report and recommendation of the President, which included various activities and targets to enhance women’s participation in irrigation management institutions and access to project benefits.
II. GENDER ANALYSIS AND PROJECT DESIGN FEATURES A. Gender Issues and Gender Action Plan Features
2. Women usually take active roles in irrigated agriculture. Despite their extensive involvement in irrigated agriculture and water use, their participation and representation in irrigation management, decision making, and training tended to be limited. In WUAs, women’s role in decision making also tended to be limited. Women are not excluded from activities such as WUA meetings. However, the vast majority of participants tend to be men. Empower women in irrigation system management decision making helps build social capital within the irrigation management institutions. 3. The project’s gender action plan (GAP) was developed to (i) increase and broaden women’s participation in irrigation development and management, especially at the decision-making level as well as in planning, implementation, monitoring, and evaluation of projects; and to (ii) increase and broaden women’s participation in the sustainable management of irrigation infrastructure. The project provided suitable opportunities and effective involvement for women to begin participating in irrigation decision making and management. The main activities relevant to women’s participation implemented by the project were (i) capacity building for district and provincial agencies on participative irrigation management, (ii) capacity building for WUA establishment and strengthening, (iii) the agriculture training and demonstration (ATD) program, and (iv) enactment of irrigation management regulations and irrigation commission (KOMIR) decrees. Women’s participation and representation have been mainstreamed in all training programs in participative irrigation management to provide women with equal opportunities in all aspects of project implementation. Key gender targets include (i) female participation at least 33% in training; and (ii) district irrigation regulations on participatory irrigation management will recommend that at least 15% of WUA board members will be women.
B. Overall Assessment of Gender-Related Results and Achievements
4. The GAP implementation was generally successful. In consultation with the Indonesia Resident Mission’s gender specialist, the GAP was updated in 2009 to include (i) socialization and awareness activities regarding gender mainstreaming concepts and the project’s GAP; (ii)

40 Appendix 11
inclusion of gender clauses in various legal documents, including regional irrigation regulations, KOMIR regulations and decrees, decrees and regulations related to redefinition of tasks and functions of irrigation management institutions (KOMIRs, Regional Planning and Development Agencies [BAPPEDA], water resources services, agriculture services, WUAs, and water users association federations [WUAFs]); (iii) promotion of expanded women’s participation in the project’s capacity building and training activities, both at irrigation agency level and scheme level; (iii) promotion of expanded women’s participation in irrigation management institutions (KOMIRs, BAPPEDA, water resources services, and agriculture services); (iv) promotion of expanded women’s participation in scheme level irrigation management and farmer institutions such as WUAs, WUAFs, and women farmer groups (Kelompok Wanita Tani); and (v) collection and monitoring of gender-disaggregated data on women’s participation and their roles in irrigation agency level and scheme level institutions and activities. 5. The project highlighted the importance of women’s participation and representation in participatory irrigation management through training and workshops to 8,311 government staff and 34,502 farmers, and included requirements for women’s participation in irrigation regulations. The project overachieved its target of inclusion of women’s participation in 26 regional irrigation management regulations, 32 regulations and decrees for KOMIR, and 32 regulations for redefinition of staff tasks and functions included the requirement for women’s participation (against a target of 25 irrigation regulations). The requirement for women’s participation in irrigation management regulations led to 931 or 25% of the total 5,076 WUAs having women board members. WUAs or WUAFs typically have five board members: chair, vice chair, secretary, treasurer, and technical section. Of the 931 WUAs, 235 WUAs have two women out of the five board members (40% against the 15% gender target) and 696 WUAs have one woman board member (20% against 15% target). Some 235 or 36% of the 643 WUAFs have women board members, of which 55 WUAFs have two women board members (40% against the 15% target) and 180 WUAFs have one woman board member (20% compared with the 15% gender target). Women’s participation in training and workshops varies from 7% to 34%. Training for women farmer groups held at ATD units were 100% women. Appendix 3 quantifies women’s participation in training and workshops. 6. The National Project Coordination and Monitoring Office (NPCMO), and provincial and district coordination units, were responsible for implementation, monitoring, and reporting of the GAP. The consultant team for the NPCMO supported implementation of the GAP and monitored progress. A national gender specialist was recruited to support GAP implementation, assisted by the resident mission’s gender specialist, from 2009 to 2011. The gender specialist worked under the supervision of an international institutional specialist and the consultant’s team leader.
C. Gender Equality Results
1. Participation, Access to Project Resources, and Practical Benefits
7. The gender mainstreaming activities provided positive impacts for project beneficiaries. The GAP (i) improved the quality and quantity of women’s representation in decision making in the irrigation management institutions (KOMIRs, BAPPEDA, water resources services, and agriculture services); (ii) increased community participation and awareness of gender in the field or at scheme level; (iii) provided women farmers access to training on cultivation of high value crops, food processing, agricultural information and credits, and new agriculture technology; and (iv) provided women with equal opportunities in all aspects of project implementation.

Appendix 11 41
8. A total of 26 irrigation regulations (six provinces and 20 districts) integrated the requirement for women’s participation and representation in irrigation management based on six government regulations. In addition, 32 decrees for KOMIRs and 32 regulations for redefinition of tasks were enacted with the requirement for women’s participation. 9. A total of 931 WUAs achieved or exceeded the 15% target for women’s membership. These WUAs had 1,166 women board members, so 235 WUAs have two women board members (attaining 40% against the 15% gender target) and 696 WUAs have one woman board member (attaining 20% against the 15% gender target). 10. A total of 235 WUAFs achieved or exceeded the 15% women’s representation target. These WUAs had 290 board members, so 55 WUAFs have two women board members (attaining 40% against the 15% target) and 180 WUAFs have one woman board member (attaining 20% against the 15% target). 11. A total of 971 women were among 8,311 (12%) government staff trained in planning, participative design, construction, operation and maintenance, and irrigation management overseas. A total of 2,950 women (100% of the members of 118 women farmer groups) participated in agriculture training and demonstrations (ATD) on cultivating high economic-value crops and agriculture food processing. In addition a number of women also participated in other trainings: 1,906 women (19% of 10,307 participants) were trained in institutional strengthening, including administration and organization of WUAs; 1,880 (16% of 11,794 participants) trained in intensification, diversification, extensification, water management, and agribusiness; 154 (7% of 2,375 participants) participated in workshops on access to information and credit; 129 (11% of 1,168 participants) participated in workshops on access to new technology.
2. Strategic Changes in Gender Relations 12. Women’s participation in trainings on irrigation management and planning has improved their opportunities to be part of management teams or to be appointed in higher technical/management positions in relevant provincial and district agencies. The role of women in the management of existing WUAs has improved significantly by involving women in membership of WUA board and providing opportunities for them to participate in trainings on institutional and financial management of WUA. Gender mainstreaming was integrated in the local irrigation management regulations, irrigation commissions’ regulations and decrees, and WUA composition. The requirement for women’s participation in irrigation management incorporated in irrigation regulations will likely improve women’s membership in WUAs, WUAFs, and other positions related to irrigation planning and management. Data on representation of women in the three regional irrigation and development agencies (BAPPEDA, water resources services, and agriculture services); KOMIRs; and WUAs and WUAFs disaggregated by sex, are shown in Tables A11.1 and A11.2.
Table A11.1: Representation of Women in Regional Agencies
Number of Region
Total Staff Number of Female Staff
% Female Staff
Appointed as Head Secretary Member Secretariat
Staff
BAPPEDA
6 provinces 68 6 8.8 26 districts 408 71 17.4 Total 476 77 16.2 4 2 31 40
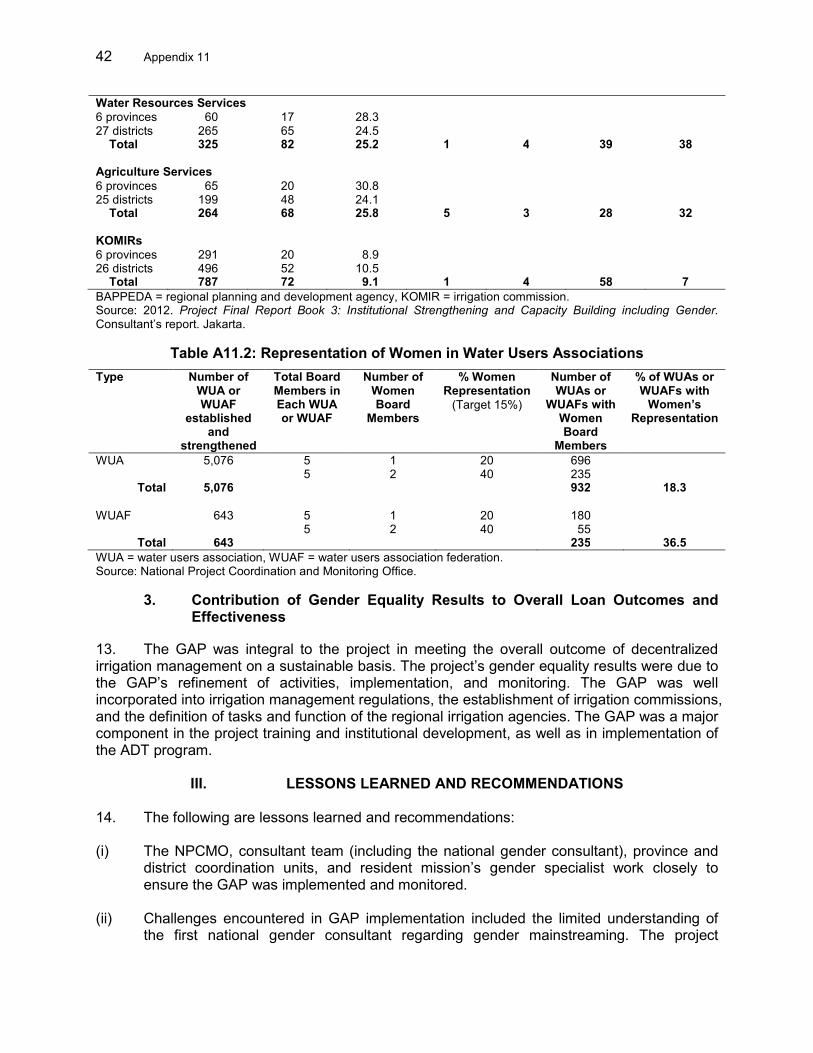
42 Appendix 11
Water Resources Services
6 provinces 60 17 28.3 27 districts 265 65 24.5 Total 325 82 25.2 1 4 39 38
Agriculture Services
6 provinces 65 20 30.8 25 districts 199 48 24.1 Total 264 68 25.8 5 3 28 32
KOMIRs
6 provinces 291 20 8.9 26 districts 496 52 10.5 Total 787 72 9.1 1 4 58 7
BAPPEDA = regional planning and development agency, KOMIR = irrigation commission. Source: 2012. Project Final Report Book 3: Institutional Strengthening and Capacity Building including Gender. Consultant’s report. Jakarta.
Table A11.2: Representation of Women in Water Users Associations
Type Number of WUA or WUAF
established and
strengthened
Total Board Members in Each WUA or WUAF
Number of Women Board
Members
% Women Representation
(Target 15%)
Number of WUAs or
WUAFs with Women Board
Members
% of WUAs or WUAFs with Women’s
Representation
WUA 5,076 5 1 20 696 5 2 40 235
Total 5,076 932 18.3
WUAF 643 5 1 20 180 5 2 40 55
Total 643 235 36.5
WUA = water users association, WUAF = water users association federation. Source: National Project Coordination and Monitoring Office.
3. Contribution of Gender Equality Results to Overall Loan Outcomes and Effectiveness
13. The GAP was integral to the project in meeting the overall outcome of decentralized irrigation management on a sustainable basis. The project’s gender equality results were due to the GAP’s refinement of activities, implementation, and monitoring. The GAP was well incorporated into irrigation management regulations, the establishment of irrigation commissions, and the definition of tasks and function of the regional irrigation agencies. The GAP was a major component in the project training and institutional development, as well as in implementation of the ADT program.
III. LESSONS LEARNED AND RECOMMENDATIONS
14. The following are lessons learned and recommendations: (i) The NPCMO, consultant team (including the national gender consultant), province and
district coordination units, and resident mission’s gender specialist work closely to ensure the GAP was implemented and monitored.
(ii) Challenges encountered in GAP implementation included the limited understanding of the first national gender consultant regarding gender mainstreaming. The project

Appendix 11 43
required two national gender consultants to support GAP implementation in the project’s 27 districts and six provinces. However, because of Indonesia’s limited pool of qualified national gender consultants, the second national gender consultant had to cover all project areas. The first national gender consultant was terminated after about 5 person-months inputs. The second national gender consultant successfully facilitated GAP implementation and worked closely with the resident mission’s gender specialist.
(iii) While representation of women on the boards of 931 WUAs and 235 WUAFs exceeded
the project target (15%), the remaining 4,145 WUAs and 408 WUAFs do not have women on their boards. Several factors contributed to this: (a) local custom in the area where women have not been accustomed to expressing opinions in meetings; (b) WUA meetings held in the evenings, rarely attended by women; and (c) WUAs perceived as a technical organization compared with women agriculture groups. Local governments should continue to encourage women’s representation in WUAs and WUAFs. The Ministry of Agriculture and regional agencies (BAPPEDA and agriculture services) can work together to continue the GAP for WUAs and WUAFs.
(iv) Women were invited to participate in project training, but women’s participation in most
training programs was below the 33% target. Lower attendance of women in training programs for staff was due to limited representation of women at technical level in provincial and district agencies (BAPPEDA, water resources services, and agriculture services). Future projects should consider the existing percentage of women in these positions and base their targets on this. Lower attendance in training programs for farmers was due to (a) women farmers have difficulty in meeting field training and WUA meeting schedules with their daily activities and capacity, and (b) women farmers’ unwillingness to participate in the training where they were not members of the WUA board. Future projects should ensure that women are supported and encouraged to attend trainings by (i) conducting these at times and places convenient for them; (ii) disseminating information about the trainings and its benefits, and that everyone is urged to attend even if they are not WUA members.
(v) Integration of women’s participation into the province and district irrigation management regulations, KOMIRs, local government implementing agencies, WUAs, and WUAFs will contribute to the sustainability of gender-responsive participatory irrigation management, provide gender equality and opportunities to participate in development programs, and provide women with the benefits of equal and fair development.

44 Appendix 11
GENDER ACTION PLAN MONITORING TABLE
Date of Update: 18 September 2013 Project Title: Participatory Irrigation Sector Project Country: Indonesia Project No. 32359 Type of Project (Loan/Grant/TA): Loan 2064(SF), Loan 2065, Grant 4299 Approval and Timeline: Approved on 19 December 2003 with a revised closing
date of 31 December 2012 Gender Category: Mission Leader: T. Panella Project Impact: Increased economic growth and reduction of poverty in
25 districts of rural Indonesia in six provinces—Lampung, Banten, West Java, Central Java, East Java, and South Sulawesi.
Project Outcome: Decentralized management of irrigation systems on a
sustainable basis and increased yields of irrigated crops

Appendix 11 45 Table A11.3: Gender Action Plan
Gender Action Plan (GAP Activities, Indicators and Targets, Time Frame
and Responsibility)
Progress to Date
Issues and Challenges
Component A: Irrigation Management
A-1. Strengthening Irrigation Management Capacity in Districts and Provinces
Media campaigns on Irrigation Management Reform Program will highlight the project provisions for encouraging women’s participation in irrigation management
Special workshops will be held to sensitize relevant government staff on gender and irrigation performance
Responsibility: National Project Coordination and Monitoring Office (NPCMO) Ministry of Home Affairs, provincial and district coordination units, with support from consultants Time: 2008–2011
Achieved.
A total of 8,311 government staff (against a target of 5,000 staff) (911 women) from central, provincial, and district irrigation agencies participated in meetings, training, and workshops, on irrigation management, during which the importance of women’s participation in participatory irrigation management was highlighted.
A total of 34,502 farmers (7,573 women) in project districts participated in trainings and workshops during which women’s participation in participatory irrigation management and agriculture was highlighted.
At least 33% female trainees in capacity building Responsibility: NPCMO, provincial and district coordination units, with support from consultants Time: 2008–2011
33 female staff (34%) out of 98 participated in a workshop on participatory irrigation management.
662 female staff (15%) out of 4,552 attendees were trained in irrigation planning
184 female staff (7%) out of 2,562 attendees were trained in participatory design, construction, and operation and maintenance (O&M)
82 female staff (9%) out of 1,039 attendees were trained in irrigated agriculture.
10 female staff (17%) out of 60 participants attended overseas training on irrigation management.
Lower attendance was due to limited representation of women at the technical level in provincial and district agencies (regional planning and development agencies [BAPPEDA], water resources services, and agriculture services). For future projects, targets for participation of female staff in trainings should be based on data on existing percentage of female staff in relevant positions.

46 Appendix 11
Gender Action Plan (GAP Activities, Indicators and Targets, Time Frame
and Responsibility)
Progress to Date
Issues and Challenges
65 female staff out of 265 staff were appointed in BAPPEDA; 57 female staff out of 285 staff were appointed in water resources services; and 68 female staff out of 264 staff were appointed in agriculture services
District regulations on irrigation management will recommend at least 15% of the water users associations (WUAs) elected members will be women
Responsibility: NPCMO, district coordination units, and district governments, with support from consultants Time: 2009–2011
Achieved.
A total of 26 regional irrigation management regulations, 32 regulations and decrees for KOMIR, and 32 regulations for redefinition of tasks and functions of staff have integrated the requirement for women’s participation (against a target of 25 irrigation regulations).
Female staff of relevant district agencies at district project implementation units Responsibility: NPCMO and district coordination units, with support from consultants Time: 2009–2012
Achieved.
The requirement for women’s participation was included in provincial and district regulations for redefinition of tasks and functions for regional irrigation agencies (BAPPEDA, water resources services, agriculture services, and KOMIRs).

Appendix 11 47
Gender Action Plan (GAP Activities, Indicators and Targets, Time Frame
and Responsibility)
Progress to Date
Issues and Challenges
A-2: Strengthening 5,000 Water Users Associations
At least 15% of women’s representation in the WUAs’ board members Responsibility: NPCMO and district coordination units, with support from consultants Time: 2009–2011
Out of 5,076 WUAs, 931 WUAs have women board members,
a of which 235 WUAs have at
least two women out of 5 board members (40% against the 15% women’s participation target) and 696 WUAs have one woman member (20% against 15% target)
Women WUA heads are rare. Asian Development Bank (ADB) missions met two women WUA chairpersons. Positions held by women on WUA boards: 2.5% vice chair, 24.7% secretary, and 66.8% treasurer 235 WUAFs have women board members, of which 55 WUAs have at least two women board members (40% against the 15% gender target) and 180 WUAs have one woman member (20% against 15% target) In some WUAs, the representation of women in WUA boards is high because the WUA chairpersons have a strong commitment to encouraging female farmers to participate in WUA activities that are compatible with their daily activities and capacity, including economic development activities.
This means that only 18% of the WUAs have at least one woman member and the rest (a total of 4,145) have no women members at all. Considering that the project highlighted in its various trainings and workshops the importance of women’s participation, this does not seem to have successfully translated to improving women’s participation in WUAs.

48 Appendix 11
Gender Action Plan (GAP Activities, Indicators and Targets, Time Frame
and Responsibility)
Progress to Date
Issues and Challenges
A-3. Providing Support for Irrigated Agriculture
Women farmers in agriculture training and demonstration (ATD) units Responsibility: NPCMO and provincial and district agriculture services, with support from consultants Time: 2009–2011
Achieved.
2,950 women farmers (100%) members of 118 women farmer groups were trained in ATD to cultivate high economic-value crops and agriculture food processing
1,906 women farmers (19%) out of 10,307 farmers participated in institutional and financial management of WUAs
1,880 women farmers (16%) out of 11,794 participants were trained in agriculture intensification, diversification, extensification, water management, and agribusiness
154 women farmers (6%) out of 2,375 participants attended workshops for access to agriculture information and credits
129 women farmers (11%) out of 1,168 participants attended workshops on new technology results
554 women trainees (9%) out of 5,908 participants attended agriculture field school
Lower attendance in training programs for farmers was due to (a) women farmers have difficulty in meeting field training and WUA meeting schedules with their daily activities and capacity, and (b) women farmers’ unwillingness to participate in the training where they were not members of the WUA board. Future projects should ensure that women are supported and encouraged to attend trainings by (i) conducting these at times and places convenient for them; (ii) disseminating information about the trainings and its benefits, and that everyone is urged to attend even if they are not WUA members.

Appendix 11 49
a WUAs and WUAFs typically have five board members: chair, vice chair, secretary, treasurer, and technical section.
2012. Project Final Report Book 3: Institutional Strengthening and Capacity Building including Gender. Consultant’s report. Jakarta.
Gender Action Plan (GAP Activities, Indicators and Targets, Time Frame
and Responsibility)
Progress to Date
Issues and Challenges
Component B: Improving Water Resources Management Information System
The design of the project performance monitoring system (PPMS) will require the collection of sex-disaggregated data and reporting on indicators to gauge women’s participation in project activities Responsibility: NPCMO, with support from consultants Time: 2009–2011
Achieved.
The PPMS was developed with the collection of sex-disaggregated data by the regional agencies on training and other output targets, and the consolidated information was reported to the project implementing units of central agencies (Ministry of Public Works, Ministry of Regional Development, and Ministry of Agriculture.

50 Appendix 12
FINANCIAL AND ECONOMIC ANALYSIS A. Economic Analysis
1. Economic reevaluation of the project was based on a sample of 21 schemes surveyed prior to the project completion report (PCR) mission and, to the extent possible, visited during the mission to confirm the findings. While these schemes are not considered a reliable representative sample of all 1,614 schemes rehabilitated under the project, they provide a random stratified sample of the range of investments (rehabilitation and sustainable replacement of rehabilitation [SRR]), conditions, and performance in the six project provinces. The criteria used to select the sample schemes were (i) if possible, they have been included as core subprojects for the project preparatory technical assistance; (ii) the number of schemes for each province should reflect the level of project activities in that province—thus, Banten Province was limited to two sample schemes and Lampung Province to three, while the others had four for each province; and (iii) if possible, each province should include at least one SRR scheme. In each province, the selected schemes were located in one district to improve the efficiency of data collection. The sample survey was conducted during the month preceding the PCR mission. The sample comprised 16 rehabilitation schemes and 5 SRR schemes. Initial analysis suggested that the reported yield and cropping intensity benefits for all of the SRR schemes and one of the rehabilitation schemes 1 were inconsistent with the low levels of investment in infrastructure undertaken by the project. These six schemes were therefore excluded from the analysis.
2. The methodology used for the economic analysis follows ADB’s Guidelines for the Economic Analysis of Projects.2 The analysis is based on the information collected during the sample survey for subsamples of farmers in the head, middle, and tail of each system, together with supplementary information collected during field visits by the PCR mission.
1. Main Assumptions
3. The economic analysis is based on the following assumptions:
(i) The project life for the infrastructure financed by the project will be 15 years, which is considered realistic given the type of investment and takes into account the views of project implementers.
(ii) Infrastructure costs were compiled from project records of the contracts awarded
and the years in which they were implemented. In one case where construction was spread over more than 1 year, the Aparang III scheme in South Sulawesi, investments were assumed to be spread evenly over the construction years.
(iii) During project implementation additional infrastructure investments were incurred
from non-project funds, the value of which was assumed to be the same as the project investments.
(iv) Since all contract costs were in local currency, and foreign exchange and local
currency were not separated, they were adjusted to constant 2013 values by
1 Sareng Scheme in Madiun District, East Java Province where the capital investment was only Rp0.15 million/ha,
similar to the SRR schemes. 2 ADB.1997. Guidelines for the Economic Analysis of Projects. Manila

Appendix 12 51
applying the Indonesian Consumer Price Index.3 Midyear values were used for each year other than 2013, where the value was for February, the latest available month (Table A12.1).
Table A12.1: Data Used to Investment Costs to 2013 Values
Item 2008 2009 2010 2011 2012 2013
Consumer Price Index Indonesia
2007 base 111.59 114.61 121.74 127.35 133.16 137.91 Constant 2013 adjustor 123.6 120.3 113.3 108.3 103.6 100.0
Source: Badan Pusat Statistik (Center Statistics Agency).
(v) Actual and forecast World Bank commodity prices formed the basis for
estimating the economic prices of tradable commodities.4 Constant 2005 prices were adjusted to constant 2013 values using a factor of 1.2289 as derived from the World Bank’s Manufactures Unit Value (MUV) Index of September 2012.
(vi) An exchange rate of $1.00 = Rp9,700 was used for the economic evaluation,
which is an average of the relatively fluctuating exchange rate experience in early 2013.
(vii) Economic farm-gate prices were derived by making adjustments for quality,
transport, and processing costs. These calculations were based on import parity for rice, maize, triple superphosphate (TSP), and potassium chloride (KCl), and export parity for urea (Table A12.7).
(viii) All economic calculations were made on the basis of the world price level
numeraire using a standard conversion factor of 0.9 and an opportunity cost of surplus labor of 0.95, resulting in a specific conversion factor for surplus labor of 0.855.
(ix) Maize was used as a proxy for non-rice (palawija) crops as this was the most
important crop recorded in the survey. (x) All farm labor, family and hired, was assumed to be surplus labor because of the
small farm size, which cannot provide full-time employment. Wage rates for farm labor were derived from the PCR survey.
2. Agricultural Data Sources
4. All crop input and output data, crop areas, and financial prices used in the economic and financial analyses were collected through a survey the month preceding the PCR mission. Data were collected for a total of 21 sample schemes selected from the 1,614 schemes rehabilitated under the project, although only 15 were used in the final analysis. Within each scheme, the enumerators carried out a stratified random sample comprising 10 respondents from each of the head, middle, and tail of the scheme, representing 30% (head), 40% (middle), and 30% (tail) of the cropped area. The survey was implemented during the month preceding the PCR mission and all data was entered into a single data sheet prior to checking for consistency and accuracy. Data were analyzed separately for each of the head, middle, and tail of each of the schemes
3 Badan Pusat Statistik. http://www.bps.go.id.
4 World Bank. The January 2013 Price Forecasts. http://www.worldbank.org

52 Appendix 12
before aggregating it for a total scheme. Three different scenarios were determined for the financial analysis: before subproject, without subproject, and with subproject. The before-subproject and without-subproject scenarios differ in that the former used the input and output prices reported for the year before subproject scheme implementation while the latter used the with-project input and output prices.
3. Economic Benefits
5. Project benefits were estimated as the difference between the value of agricultural production future without project and the production after implementing the scheme improvements (future with project). Based on field observations of non-project schemes in the project areas, the future without-project yields and input use were assumed to be the average of the before and after project data collected, reflecting a general increase in yields. Without project cropping intensities were assumed to remain the same as in the before project scenario. 6. Economic values for the major traded commodities estimated for 4 years (Table A12.7)—2012 actual as well as 2013, 2015, and 2020 projected—suggested a gradual decline in real prices over this period. Since this does not seem reasonable, the economic price for 2013 was used for all years in the analysis. 7. The costs of infrastructure rehabilitation were taken from the project records of contracts awarded for each of the 21 sampled schemes. The records indicated the amount of tax included on the contracts, which was charged on only the government-financed portion, so that these could be deducted directly from the investment cost. Since no information was available, foreign exchange was assumed to be 25% of the investment cost, as at appraisal. Information gathered during field visits indicated that most schemes had received substantial benefits from the project support for improved water users associations (WUAs) and agricultural support services, including agricultural training and demonstration units. To reflect this, a second analysis was conducted, including all project costs allocated pro rata across the schemes. Analysis of the overall project data indicated that infrastructure investments accounted for about 50% of the total, and that the average foreign exchange cost for non-infrastructure investments was about 25%. The second analysis was therefore undertaken with a 100% increase in investment costs. 8. Operation and maintenance (O&M) costs were obtained from the responsible provincial and district offices, with the provincial offices being more able to provide the required amounts. While the O&M allocation ranged from just Rp14,000/ha for Lompoa in South Sulawesi to Rp1.265 million/ha in Aparang III in South Sulawesi, most allocations were from about Rp40,000/ha to Rp310,000/ha. While it was not clear whether these allocations would be maintained throughout the project life, this was assumed to be the case since these investments are necessary to ensure project sustainability.
4. Impact on Farmers’ Income
9. While estimation of the financial internal rate of return (FIRR) for the overall project is not meaningful, given that individual farmers are the only income-generating entity, for whom an FIRR would have no meaning, it is useful to estimate the project’s impact on net farm incomes and to compare this with appraisal estimates. Average net farm incomes before, without, and with project for individual schemes, as well as the weighted averages for the 15 schemes, are shown in Table A12.2. Average net farm income before the project is estimated at Rp10.2 million, while for the without-project scenario, using current prices, it is estimated at Rp19.4

Appendix 12 53
million, 90% higher. With-project average net farm income is Rp23.4 million, 20% higher than the without-project net farm income and 129% higher than the before-project net farm income. 10. By comparison, it was estimated at appraisal that net farm incomes would increase by 26% to 162%, the highest value being in the middle reach of the Serayu-Gambasari scheme in Banyumas, which was not included in the current study. While no overall average is reported, it can be estimated from the available data at about 70%, somewhat higher than the PCR estimate.
Table A12.2: Average Net Farm Income Before, Without, and With the Project (Rp million)
Scheme Location:
(Province/District) Before
Subproject Without
Subproject With
Subproject
Way Pisang I Lampung, South Lampung 8.8 11.5 14.6 Way Made Lampung, South Lampung 11.0 13.3 17.0 Cipeucang Pare Banten, Labek 6.4 14.9 16.7 Cisiih Banten, Labek 4.9 10.1 10.4 Baranangsiang West Java, Garut 7.6 15.5 21.2 Cirompang West Java, Garut 7.4 13.2 18.1 Ciroyom West Java, Garut 8.1 15.1 20.8 Kediri Central Java, Banyumas 5.4 19.8 24.1 Pandak Raden Central Java, Banyumas 10.9 13.6 15.3 Kaliomas Central Java, Banyumas 5.6 16.6 19.5 Sewu East Java, Madiun 16.3 32.6 41.1 Bruwok East Java, Madiun 24.6 56.9 59.0 Balakia I dan II South Sulawesi, Sinjai 10.0 15.9 18.4 Arango 1 South Sulawesi, Sinjai 14.3 20.3 22.9 Lompoa South Sulawesi, Sinjai 8.1 14.9 18.3 Weighted average 10.2 19.4 23.4
Source: Project completion report Mission estimates.
5. Results of Economic Analysis
11. The economic return for each scheme was assessed through estimation of the economic internal rate of return (EIRR) and economic net present value (ENPV) using conventional cost–benefit analysis (Table A12.3). The results were compared with estimates reported at appraisal (for three schemes), and during scheme preparation in the summary subproject reports (SSRs). The weighted average EIRR and ENPV per scheme was estimated for the sample results based on the reported land areas for each scheme. 12. The average EIRR for the sample schemes at PCR was 74% with an average ENPV of Rp19.7 billion. The EIRRs ranged from 27% for Cisiih scheme in Banten Province to 162% for Ciroyom scheme in West Java. The results are higher than expected at appraisal or during preparation of the SSRs but greater yield increases have been achieved.

54 Appendix 12
Table A12.3: Summary of Results for Surveyed Schemes and Overall Analysis Scheme
Location:
Area (ha)
SSR study PCR
(Province/ District) EIRR (%)
ENPV (Rp millions)
EIRR (%)
ENPV (Rp millions)
Way Pisang I Lampung, South Lampung 972 17.3 889 59 22,533
Way Mada a Lampung, South Lampung 674 16.8 551 91 12,416
Cipeucang Pare Banten, Labek 620 56.0 5,246 31 3,321
Cisiih Banten, Labek 850 25.7 2,951 27 3,522
Baranangsiang West Java, Garut 882 19.7 1,520 76 40,176
Cirompang West Java, Garut 847 35.0 6,896 57 25,799
Ciroyom West Java, Garut 762 21.6 1,365 162 32,724
Kediri Central Java, Banyumas 731 23.7 1,535 64 19,236
Pandak Raden Central Java, Banyumas 463 19.4 255 116 11,358
Kaliomas Central Java, Banyumas 331 20.8 397 69 3,234
Sewu East Java, Madiun 1,332 19.6 1,499 121 39,243
Bruwok East Java, Madiun 680 26.9 1,665 69 15,780
Balakia I dan II South Sulawesi, Sinjai 851 16.4 583 44 10,223
Arango 1 South Sulawesi, Sinjai 518 16.5 358 41 5,203
Lompoa South Sulawesi, Sinjai 500 28.0 1,542 48 8,560
Weighted average 23.8 1,922 74 19,668 EIRR = economic internal rate of return, ENPV = economic net present value, ha = hectare, PCR = project completion report, SSR = summary subproject report. a During preparation, the surveyed scheme was identified as Baturaja, which comprised Way Kijing I (264 ha) upstream and Way Kijing II (268 ha) downstream, with a total area of 532 ha. The project preparatory technical assistance consultant’s core subproject appraisal report indicates the total area is about 650 ha and EIRR 54%. The report and recommendation of the President indicates an area of 304 ha.
Source: Project completion report Mission estimates.
a. Economic Analysis Using Full Project Costs
13. Inclusion of the total project costs, rather than just rehabilitation costs, resulted in a significantly lower average EIRR of 54%, and only an ENPV of Rp18.0 billion (Table A12.4). This is a more reasonable and appropriate approach. The lowest EIRR, at 19%, is again for Cisiih scheme, while only Crioyom scheme in West Java has an EIRR in excess of 100%. Although high, these results are reasonable given the benefits that were widely reported to have accrued from the project and the situation observed during field visits.

Appendix 12 55
Table A12.4: Summary of Results of Surveyed Schemes Using Full Project Costs Scheme Location:
Area (ha)
PCR
Province/ District EIRR (%)
ENPV (Rp
millions
Way Pisang I Lampung, South Lampung 972 43 20,168
Way Mada Lampung, South Lampung 674 61 11,228
Cipeucang Pare Banten, Labek 620 22 2,272 Cisiih Banten, Labek 850 19 2,090 Baranangsiang West Java, Garut 882 57 37,431 Cirompang West Java, Garut 847 42 23,033 Ciroyom West Java, Garut 762 119 31,839 Kediri Central Java, Banyumas 731 48 17,516 Pandak Raden Central Java, Banyumas 463 87 10,958 Kaliomas Central Java, Banyumas 331 50 2,942 Sewu East Java, Madiun 1,332 88 37,624 Bruwok East Java, Madiun 680 50 14,309 Balakia I dan II South Sulawesi, Sinjai 851 31 8,299 Arango 1 South Sulawesi, Sinjai 518 29 4,100 Lompoa South Sulawesi, Sinjai 500 35 7,312 Weighted average 54 18,040
EIRR = economic internal rate of return, ENPV = economic net present value, ha = hectare, PCR = project completion report, SSR = summary subproject report. Source: Project completion report Mission estimates.
b. Agricultural Production
14. At appraisal, rice yields were projected to increase only marginally in the wet season from 3.86 ton (t) per hectare (ha) to 4.00 t/ha or 3.6%, while the increase in the dry season was projected to be from 3.24 t/ha to 3.84 t/ha, or 18.5%. The average increase for the three appraisal schemes included in the PCR study is lower (Table A12.5). Data used for the SSR studies indicated an increase in average rice yields from 5.17 t/ha to 5.32 t/ha (equivalent to 2.9%) in the wet season and from 4.89 t/ha to 4.99 t/ha (2.9%) in the dry season. These were sufficient to provide an acceptable EIRR because of the lower than appraisal per ha investment. At completion, average rice yields in the wet season are estimated to have increased from 5.47 t/ha to 6.43 t/ha (17.6%) and in the dry season, from 5.08 t/ha to 5.99 t/ha (18.0%). Field visits confirmed that wet season rice yields are substantially higher than previously observed, and these estimates are considered realistic.

56 Appendix 12
Table A12.5: Summary of Without- and With-Project Paddy Yields Scheme Location: SSR Study PCR
Province/ District Wet Season Dry Season
Wet Season Dry Season
Without With Without With Without With Without With
Way Pisang I Lampung, South Lampung 6.00 6.10 5.00 5.10 6.02 7.35 5.32 6.39
Way Made Lampung, South Lampung 5.00 5.06 3.00 3.06 6.09 7.26 5.29 6.34
Cipeucang Pare Banten, Labek 6.80 7.00 6.80 7.00 5.70 6.25 5.79 6.34
Cisiih Banten, Labek 6.50 6.60 6.30 6.50 5.60 6.02 5.59 6.16
Baranangsiang West Java, Garut 4.67 5.40 5.34 5.50 5.21 6.89 4.94 6.28
Cirompang West Java, Garut 4.12 4.40 4.44 4.70 5.26 6.13 4.81 5.71
Ciroyom West Java, Garut 5.50 5.50 5.00 5.15 4.76 6.48 4.26 5.95
Kediri Central Java, Banyumas 4.50 4.50 4.30 4.30 5.72 6.22 5.69 6.10
Pandak Raden Central Java, Banyumas 6.00 6.10 4.50 4.56 5.86 6.45 6.23 6.74
Kaliomas Central Java, Banyumas 4.70 4.75 4.60 4.70 5.97 6.15 5.93 6.07
Sewu East Java, Madiun 6.55 6.60 6.02 6.20 5.47 6.33 5.30 6.19
Bruwok East Java, Madiun 7.20 7.23 7.00 7.15 6.75 7.20 5.36 5.80
Balakia I and II South Sulawesi, Sinjai 2.62 2.68 2.83 2.85 4.74 5.89 4.18 5.23
Arango 1 South Sulawesi, Sinjai 2.85 2.93 2.74 2.90 4.81 5.89 4.32 5.26
Lompoa South Sulawesi, Sinjai 2.44 2.80 2.77 3.00 4.18 5.33 3.38 4.83
Weighted average 5.17 5.32 4.86 4.99 5.47 6.43 5.08 5.99
PCR = project completion report, SSR = summary subproject report. Source: Project Completion Report Mission estimates.
15. At appraisal, cropping intensity was projected to increase by up to 40%, with an average increase from 159% to 192% (Table A12.6). The average cropping intensity estimated from the SSR studies for the sample schemes was much higher at 234% without the project and 246% with the project, while the average increase in cropping intensity resulting from the project was much less, only 12 percentage points. These projections are similar to the PCR study findings, where the increase was from 233% without the project to 244% with the project, an 11 percentage point increase. Again, this relatively small increase in cropping intensity seems reasonable given the extent of infrastructure rehabilitation.

Appendix 12 57
Table A12.6: Summary of Without- and With-Project Cropping Intensities
Scheme Location: Appraisal SSR/BSR Study PCR
Province/ District Without With Without With Without With
Way Pisang I Lampung, South Lampung
200 217
171 191
Way Made Lampung, South Lampung 130 165
180 196
164 182
Cipeucang Pare Banten, Labek
182 213
200 204
Cisiih Banten, Labek
300 300
206 206
Baranangsiang West Java, Garut
262 280
200 242
Cirompang West Java, Garut
205 237
200 247
Ciroyom West Java, Garut
223 228
301 300
Kediri Central Java, Banyumas
279 285
290 286
Pandak Raden Central Java, Banyumas
279 291
283 299
Kaliomas Central Java, Banyumas
230 230
262 278
Sewu East Java, Madiun 185 211
264 264
300 300
Bruwok East Java, Madiun
300 300
306 312
Balakia I dan II South Sulawesi, Sinjai 150 180
181 202
200 196
Arango 1 South Sulawesi, Sinjai
192 200
200 206
Lompoa South Sulawesi, Sinjai
210 220
200 200
Weighted average 234 246 233 244
BSR = brief subproject report, PCR = project completion report, SSR = summary subproject report. Source: Project Completion Report Mission estimates.

58 Appendix 12
Table A12.7: Derivation of Economic Prices for Traded Inputs and Outputs
Commodity Rice
Parity Import
Source Thailand Quality of Marker Product 5% broken
Item Unit Adjustment 2012 2013 2015 2020
World market price (constant 2005) $/t 439 440 391 350
World market price (constant 2013) $/t 22.9% 539 541 480 430
Quality differential (10%) 54 54 48 43
Equivalent value of Indonesian Product $/t 485 487 432 387
Freight and Insurance Cost to Semarang $/t 33 34 34 34
Value at Indonesian Port 518 521 466 421
Conversion to Rp Rp–$ 9,700
Value at Indonesian Port Rp/kg 5,029 5,049 4,524 4,084
Port handling charges, storage, and loss 5% 251 252 226 204
Internal handling/transport charges Rp/kg 24 25 25 25
Value at wholesale market 5,304 5,327 4,775 4,313
Transport costs: miller to wholesale market 30 30 30 30
Dealer handling and processing costs 50 50 50 50
Value at local market/mill 5,224 5,247 4,695 4,233
Conversion to unmilled rice 62% 3,239 3,253 2,911 2,624
Milling cost 50 50 50 50
Transport cost: farm-gate to local miller 10 10 10 10
Economic value at farm-gate 3,179 3,193 2,851 2,564
Commodity Maize
Parity Import
Source FOB US Gulf Port
Quality of Marker Product No. 2 Yellow
Item Unit Adjustment 2012 2013 2015 2020
World market price (constant 2005) $/t 247 236 195 172
World market price (constant 2013) $/t 22.9% 303 290 240 211
Quality differential 0% (1) 0 0 0
Equivalent value of Indonesian Product $/t 304 290 240 211
Freight and Insurance Cost to Semarang $/t 42 43 43 43
Value at Indonesian Port 346 333 283 254
Conversion to Rp Rp–$ 9,700
Value at Indonesian Port Rp/kg 3,361 3,230 2,741 2,467
Port handling charges, storage, and loss 5% 168 161 137 123
Internal handling, transport costs 19 20 20 20
Value at wholesale market 3,548 3,411 2,898 2,610
Transport costs local to wholesale market 50 50 50 50
Dealer handling and processing costs 50 50 50 50
Value at local market 3,448 3,311 2,798 2,510
Transport costs: farm-gate to local market 9 10 10 10
Economic farm-gate price 3,439 3,301 2,788 2,500

Appendix 12 59
Commodity Urea
Parity Export Marker product location E Europe, bulk Quality of Marker Product 46% N
Item Unit Adjustment 2012 2013 2015 2020
World market price (constant 2005) $/t 336 317 274 232
World market price (constant 2013) $/t 22.9% 413 389 337 285
Quality/price differential 10% 41 39 34 29
Equivalent value of Indonesian product 454 428 370 314
Freight and insurance cost 39 40 40 40
Value at Indonesian Port ex. Palembang 493 468 410 354
Conversion to Rp Rp–$ 9,700
Value at Indonesian Port Rp/kg 4,783 4,544 3,980 3,429
Port charges/internal handling Rp/kg 49 50 50 50
Value at wholesale market Rp/kg 4,832 4,594 4,030 3,479
Transport cost-wholesale to farm-gate Rp/kg 49 50 50 50
Economic value of fertilizer at farm-gate Rp/kg 4,881 4,644 4,080 3,529
Commodity Triple Superphosphate (TSP)
Parity Import Source Northern Europe/Florida Quality of Marker Product 47% P
Item Unit Adjustment 2012 2013 2015 2020
World market price (constant 2005) $/t 383 350 328 242
World market price (constant 2013) $/t 22.9% 471 430 403 297
Freight and Insurance Cost 29 30 30 30
Value at Indonesian Port $/t 500 460 433 327
Conversion to Rp Rp–$ 9,700
Value at Indonesian Port Rp/kg 4,846 4,462 4,200 3,175
Port charges Rp/kg 5% 242 223 210 159
Internal handling/transport costs Rp/kg 49 50 50 50
Value at wholesale market Rp/kg 5,137 4,735 4,460 3,384
Transport cost-wholesale to farm-gate Rp/kg 49 50 50 50
Economic farm-gate price Rp/kg 5,186 4,785 4,510 3,434
Commodity Potassium Chloride (KCl) Parity Import Source Northern Europe/Canada Quality of Marker Product 60% K
Item Unit Adjustment 2012 2013 2015 2020
World market price (constant 2005) $/t 380 350 297 216
World market price (constant 2013) $/t 22.9% 467 430 365 265
Freight and Insurance Cost $/t 29 30 30 30
Value at Indonesian Port $/t 496 460 395 295
Conversion to Rp Rp–$ 9,700
Value at Indonesian Port Rp/kg 4,810 4,462 3,830 2,865
Port charges Rp/kg 5% 240 223 192 143
Internal handling/transport costs Rp/kg 49 50 50 50
Value at wholesale market Rp/kg 5,099 4,735 4,072 3,058
Transport cost-wholesale to farm-gate Rp/kg 49 50 50 50
Economic farm-gate price Rp/kg 5,148 4,785 4,122 3,108 ( ) = negative, FOB = , kg = kilogram, t = ton, US = United States. Source: Asian Development Bank estimates based on World Bank Commodity Price Projections.