Embed Size (px)
Citation preview
TECHNICAL REPORT MI-ACCESS SCIENCE
ASSESSMENTS
Participation, Supported Independence and
Functional Independence
Michigan’s Alternate Assessment ProgramMichigan Department of Education Office of Educational Assessment
and Accountability
August 2008
2 | MI-ACCESS P/SI/FI Science Technical RepoRT | 2 0 0 7 - 2 0 0 8
Copyright© 2008, held by the State Administrative Board, State of Michigan. All rights reserved. Printed in the U.S.A. No part of this publication may be reproduced, stored in a retrieval system, or transmitted, in any forms or by any means, electronic, mechanical, photocopying, recording, or otherwise, without prior written permission. This assessment and its contents are the exclusive property of the State of Michigan. Any use of the assessment outside of its intended use, such as attempts to analyze its contents in any way, will be considered a violation of copyright laws.
MICHIGAN STATE BOARD OF EDUCATION
STATEMENT OF ASSURANCE OF COMPLIANCE WITH FEDERAL LAW
The Michigan State Board of Education complies with all Federal laws and regulations prohibiting discrimination and with all requirements and regulations of the U.S. Department of Education. It is the policy of the Michigan State Board of Education that no person on the basis of race, color, religion, national origin or ancestry, age, sex, marital status, or handicap shall be discriminated against, excluded from participation in, denied the benefits of, or otherwise be subjected to discrimination in any program or activity for which it is responsible or for which it receives financial assistance from the U.S. Department of Education.
Acknowledgements
This Technical Report was compiled by Michael C. Rodriguez and Anthony Albano,
University of Minnesota
and Jeffrey A. Slinde, Questar Assessment Inc.

MI-ACCESS P/SI/FI Science Technical RepoRT | 2 0 0 7 - 2 0 0 8 | i
EXECUTIVE SUMMARY
The demographic profile of the United States is becoming increasingly diverse and as a result K-12 schools are now serving students who are progressively more varied in cultural background, socioeco-nomic status, and disability status. Nearly 6 million children with disabilities between the ages of 6 and 21 receive special education services in the United States. About 12% of all students enrolled in K-12 schools are students with disabilities (Thurlow, Thompson, and Lazarus, 2006).
Federal legislation has had a profound impact on the assessment of students with disabilities by requir-ing that state assessments used for school accountability include students who previously have been under served both instructionally and in the assessment of their achievement. These students include English language learners (ELLs) and students with disabilities.
MI-Access was created out of the need to provide equitable educational opportunities to students with disabilities and to comply with the federal legislative initiatives. For over 30 years, the only statewide as-sessment available to students in Michigan was the Michigan Educational Assessment Program, which even with assessment accommodations is not appropriate for special education students. As a result, the Michigan Department of Education began developing an alternate assessment program, which is now called MI-Access. MI-Access is one component of the Michigan Educational Assessment System, which was adopted by the State Board of Education in November 2001. The MI-Access Participation, Supported Independence, and Functional Independence Science assessments were administered for the first time statewide in fall 2007 and spring 2008.
The purpose of the MI-Access Functional Independence Technical Manual is to provide complete and thorough documentation of the MI-Access Participation, Supported Independence, and Functional In-dependence Science assessment development process. Documentation of the assessment development procedures can be viewed as the foundation necessary for valid interpretation and use of test scores.
The Technical Manual adheres to the highest test development principles, the Standards for Educational and Psychological Testing (1999). In so doing, the manual precisely documents all relevant evidence necessary to establish validity and support and defend a test, including careful test construction, ad-equate score reliability, appropriate test administration and scoring, accurate scaling, equating, and standard setting, and careful attention to examinee fairness issues.
The Technical Manual also addresses and documents all key components that are necessary for techni-cal documentation as outlined in the Standards (1999). The overview and purpose of the assessments are detailed in Chapter 1, including the philosophical and historical basis for the assessments; the nature of the assessments and the population served; along with appropriate and inappropriate uses of test score interpretations. Chapter 2 addresses the entire assessment development process from content selection and specification, item specifications, test blueprints, item development, committee review procedures, item selection, form design, to a description of the operational forms including events such as the Pilot and Tryout. The test administration, scoring, reporting, test score interpreta-tion, and references to numerous other supplemental materials are discussed in Chapter 3. The actual technical characteristics of the assessments: item and test-level statistics; scaling and equating data; standard setting rationale and processes for setting performance standards; and reliability/measure-ment error are completely documented and addressed in Chapters 4-6. Lastly, in Chapter 7 the valida-

i i | MI-ACCESS P/SI/FI Science Technical RepoRT | 2 0 0 7 - 2 0 0 8
tion procedures are discussed; each fundamental decision in the test construction process is discussed, documented, and reported as it contributes to the validity evidence for the test scores resulting from assessments.
The MI-Access Functional Independence Technical Manual thoroughly documents the overall reliability, validity, and quality of the MI-Access Participation, Supported Independence, and Functional Indepen-dence Science assessments and has provided indisputable evidence of meeting the highest standards of assessment and measurement and has been deemed an outstanding assessment program for stu-dents with disabilities.

MI-ACCESS P/SI/FI Science Technical RepoRT | 2 0 0 7 - 2 0 0 8 | i i i
TABLE OF CONTENTS
PageLIST OF TABLES ....................................................................................................................................... vLIST OF FIGURES ................................................................................................................................... viiiINTRODUCTION .....................................................................................................................................1
CHAPTER 1. MI-Access: MIchIgAn’s AlternAte AssessMent ProgrAM .............................................................. 2
1.1 The Origins of MI-Access ........................................................................................................21.2 The Nature of the Assessment & Population ..............................................................................61.3 Intended Uses ........................................................................................................................71.4 Assessment Development Process ............................................................................................8
CHAPTER 2. scIence AssessMent DeveloPMent ............................................................................................ 9
2.1 The MI-Access Science Assessment Design ...............................................................................92.2 Item Development ................................................................................................................102.3 Assessment Blueprints ...........................................................................................................112.4 Spring 2007 Pilot .................................................................................................................172.5 2007-2008 Operational Administration .................................................................................37
CHAPTER 3. test ADMInIstrAtIon, scorIng, scAlIng, & equAtIng ................................................................ 46
3.1 Background ..........................................................................................................................463.2 Determining Participation in MI-Access ...................................................................................493.3 Allowable Accommodations ..................................................................................................493.4 Scoring Rubrics for Participation and Supported Independence . ..............................................503.5 Reporting and Score Use .......................................................................................................513.6 Available Training and MI-Access Administrative Support ........................................................523.7 Scaling Background ..............................................................................................................523.8 Scaling and Equating ............................................................................................................53
CHAPTER 4. stAnDArD settIng .............................................................................................................. 54
4.1 Background ..........................................................................................................................544.2 Initial Considerations ...........................................................................................................544.3 Levels of Performance and Performance Categories ................................................................554.4 The Standard Setting Process .................................................................................................554.5 Standard Setting Results .......................................................................................................56

i v | MI-ACCESS P/SI/FI Science Technical RepoRT | 2 0 0 7 - 2 0 0 8
CHAPTER 5. relIAbIlIty evIDence ............................................................................................................ 59
5.1 Background ..........................................................................................................................595.2 Internal Consistency and Standard Errors of Measurement of Spring 2007 Pilot Forms .............595.3 Internal Consistency and Standard Errors of Measurement of 2007-2008 Operational Assessments ....................................................................................615.4 Standard Errors of Measurement ...........................................................................................625.5 Classification Consistency .....................................................................................................635.6 Rater Consistency .................................................................................................................64
CHAPTER 6. vAlIDIty evIDence ............................................................................................................... 69
6.1 Background ..........................................................................................................................696.2 Relevance of Content (Test Blueprint) ......................................................................................696.3 Field Review of the MI-Access Science Assessment Plan ...........................................................696.4 Results of Item Review Processes ............................................................................................706.5 Evaluation of Standard-Setting Training, Process, and Outcomes .............................................746.6 Intercorrelations Within Tests (section observed scores) ............................................................78
References ........................................................................................................................................ 82

MI-ACCESS P/SI/FI Science Technical RepoRT | 2 0 0 7 - 2 0 0 8 | v
LIST OF TABLES
PageTable 2.1 Spring 2007 Pilot Participation by Grade and Form Participation Science .............................18
Table 2.2 Spring 2007 Pilot Participation by Grade and Form Supported Independence Science ..........18
Table 2.3 Spring 2007 Pilot Participation by Grade and Form Functional Independence Science ..........18
Table 2.4 Spring 2007 Pilot Participation by Grade, Form, and Gender Participation Science ..............19
Table 2.5 Spring 2007 Pilot Participation by Grade, Form, and Gender Supported Independence Science ......................................................................................19
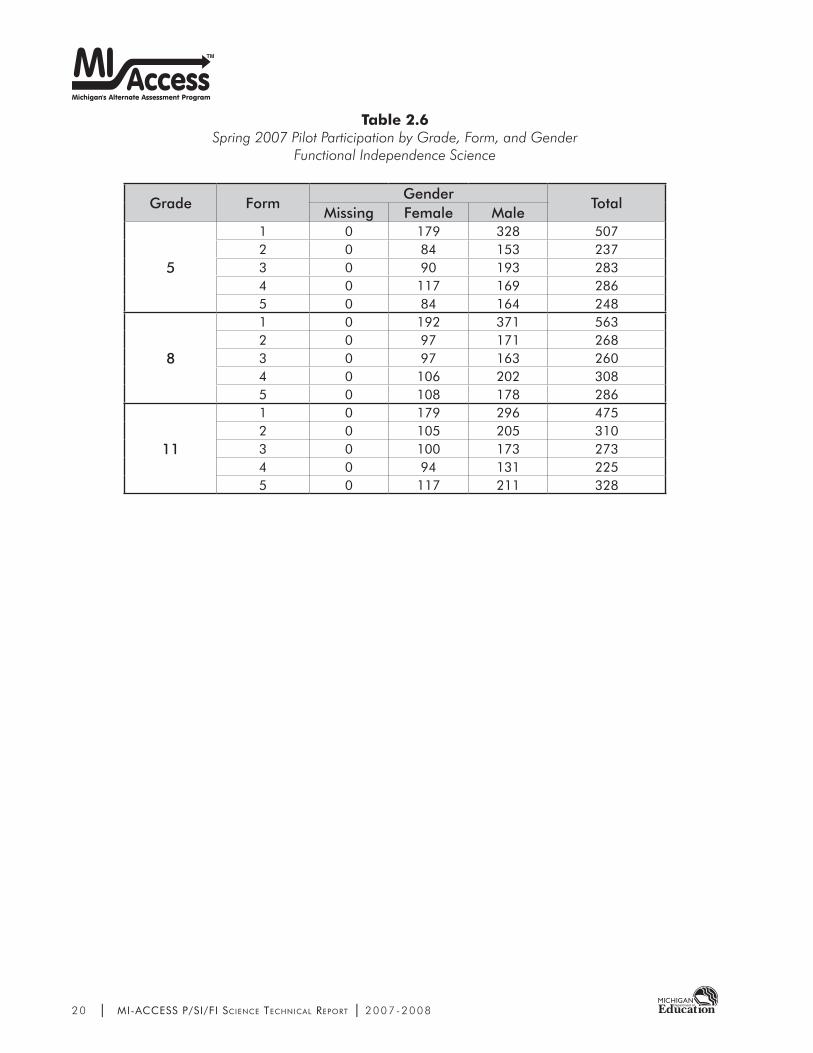
Table 2.6 Spring 2007 Pilot Participation by Grade, Form, and Gender Functional Independence Science ......................................................................................20
Table 2.7 Spring 2007 Pilot Participation by Grade, Form, and Ethnicity Participation Science .........................................................................................................21
Table 2.8 Spring 2007 Pilot Participation by Grade, Form, and Ethnicity Supported Independence Science ......................................................................................22
Table 2.9 Spring 2007 Pilot Participation by Grade, Form, and Ethnicity Functional Independence Science ......................................................................................23
Table 2.10 Spring 2007 Pilot Participation by Ethnicity Across Grades and Assessments ........................24
Table 2.11 Spring 2007 Pilot Item Statistic Summaries.........................................................................25
Table 2.12 Spring 2007 Pilot Form Score Summaries by Gender and Test Form-Participation Science ..........................................................................................26
Table 2.13 Spring 2007 Pilot Form Score Summaries by Ethnicity and Test Form-Participation Science ..........................................................................................26
Table 2.14 Spring 2007 Pilot Form Score Summaries by Gender and Test Form-Supported Independence Science .......................................................................27
Table 2.15 Spring 2007 Pilot Form Score Summaries by Ethnicity and Test Form-Supported Independence Science .......................................................................27
Table 2.16 Spring 2007 Pilot Form Score Summaries by Gender and Test Form-Functional Independence Science .......................................................................28
Table 2.17 Spring 2007 Pilot Form Score Summaries by Ethnicity and Test Form-Functional Independence Science .......................................................................28
Table 2.18 Number and Percent of Items Statistically Flagged for DIF in the Spring 2007 Pilot ...............29
Table 2.19 Summary of SRC and CAC Item Decisions for the Spring 2007 Pilot ....................................30
Table 2.20 Science Blueprint for Participation ......................................................................................38
Table 2.21 Science Blueprint for Supported Independence ...................................................................39
Table 2.22 Science Blueprint for Functional Independence ...................................................................40

v i | MI-ACCESS P/SI/FI Science Technical RepoRT | 2 0 0 7 - 2 0 0 8
Table 2.23 2007-2008 Percent of Students at each Performance Level .................................................41
Table 2.24 2007-2008 N-Counts by Gender and by Special Group ....................................................42
Table 2.25 2007-2008 N-Counts by Ethnicity .....................................................................................43
Table 2.26 2007-2008 Operational Form Score Summaries by Gender ...............................................44
Table 2.27 2007-2008 Operational Form Score Summaries by Ethnicity ..............................................44
Table 2.28 Field Test DIF Summary by Grade ......................................................................................45
Table 3.1 Participation Rubric ...........................................................................................................51
Table 3.2 Supported Independence Rubric ........................................................................................51
Table 3.3 MI-Access Reports by Level of Reporting ............................................................................52
Table 4.1 Summary of Panel Recommendations for MI-Access Participation Science Test: Percentage of Students by Performance Category ...............................................................56
Table 4.2 Summary of Panel Recommendations for MI-Access Participation Science Test: Item Mapping Test Booklet Cuts, Median Scores (Standard Errors) .......................................57
Table 4.3 Summary of Panel Recommendations for MI-Access Supported Independence Science Test: Percentage of Students by Performance Category ...........................................57
Table 4.4 Summary of Panel Recommendations for MI-Access Supported Independence Science Test: Item Mapping Test Booklet Cuts, Median Scores (Standard Errors) ...................57
Table 4.5 Summary of Panel Recommendations for MI-Access Functional Independence Science Test: Percentage of Students by Performance Category ............................................58
Table 4.6 Summary of Panel Recommendations for MI-Access Functional Independence Science Test: Item Mapping Test Booklet Cuts, Median Scores (Standard Errors) ..................58
Table 5.1 Spring 2007 Pilot Form Summaries, including Score Statistics, Sample Size, Coefficient Alpha, and SEM by Form-Participation Science ..................................................60
Table 5.2 Spring 2007 Pilot Form Summaries, including Score Statistics, Sample Size, Coefficient Alpha, and SEM by Form-Supported Independence Science ...............................60
Table 5.3 Spring 2007 Pilot Form Summaries, including Score Statistics, Sample Size, Coefficient Alpha, and SEM by Form-Functional Independence Science ...............................61
Table 5.4 2007-2008 Operational Form Summaries, including Sample Size, Raw Score Statistics, Coefficient Alpha, and SEM-Participation.............................................61
Table 5.5 2007-2008 Operational Form Summaries, including Sample Size, Raw Score Statistics, Coefficient Alpha, and SEM-Supported Independence ..........................62
Table 5.6 2007-2008 Operational Form Summaries, including Sample Size, Raw Score Statistics, Coefficient Alpha, SEM and Scale Score Statistics-Functional Independence .........................62
Table 5.7 Standard Error of Measurement of Cut-Points for FI Science ................................................62
Table 5.8 Estimated Classification Accuracy and Consistency-Science .................................................63

MI-ACCESS P/SI/FI Science Technical RepoRT | 2 0 0 7 - 2 0 0 8 | v i i
Table 5.9 Spring 2007 Pilot Form Percent Perfect Interrater Agreement Rates- Participation Science .........................................................................................................65
Table 5.10 Spring 2007 Pilot Form Percent Perfect Interrater Agreement Rates- Supported Independence Science ......................................................................................66
Table 5.11 2007-2008 Operational Form Percent Perfect Interrater Agreement Rates- Participation Science .........................................................................................................67
Table 5.12 2007-2008 Operational Form Percent Perfect Interrater Agreement Rates- Supported Independence Science ......................................................................................68
Table 6.1 New Development Item Status: SRC Recommendations ......................................................70
Table 6.2 New Development Item Status: CAC Recommendations .....................................................71
Table 6.3 Participant Evaluation of the 2006 New Item and Data Review ............................................72
Table 6.4 Participant Evaluation of the Spring 2007 Pilot Item and Data Review ..................................73
Table 6.5 Panelist Evaluation of the Fall 2007 Standard Setting Process and Outcomes .......................75
Table 6.6 Panelist Evaluation of the Spring 2008 Standard Setting Process and Outcomes ...................76
Table 6.7 2007-2008 Operational Form Intercorrelations Between Section Scores by Grade Participation Science ..........................................................................................78
Table 6.8 2007-2008 Operational Form Intercorrelations Between Section Scores by Grade Supported Independence Science .......................................................................79
Table 6.9 2007-2008 Operational Form Intercorrelations Between Section Scores by Grade Functional Independence Science .......................................................................79
Table 6.10 2007-2008 Operational Form Summary Statistics for Section Scores by Grade Participation Science ..........................................................................................80
Table 6.11 2007-2008 Operational Form Summary Statistics for Section Scores by Grade Supported Independence Science .......................................................................80
Table 6.12 2007-2008 Operational Form Summary Statistics for Section Scores by Grade Functional Independence Science .......................................................................81

v i i i | MI-ACCESS P/SI/FI Science Technical RepoRT | 2 0 0 7 - 2 0 0 8
LIST OF FIGURES
Figure 2.1 Number of Items by Strand and Standard on the Participation Assessments .........................12
Figure 2.2 Number of Core Items and Embedded Field-Test Items on the Participation Assessments ..................................................................................................13
Figure 2.3 Number of Items by Strand and Standard on the Supported Independence Assessments ...............................................................................14
Figure 2.4 Number of Core Items and Embedded Field-Test Items on the Supported Independence Assessments ...............................................................................15
Figure 2.5 Number of Items by Strand and Standard on the Functional Independence Assessments ...............................................................................16
Figure 2.6 Number of Core Items and Embedded Field-Test Items on the Functional Independence Assessments ...............................................................................17
Figure 2.7 Content Advisory Committee Rating Form ..........................................................................35
Figure 2.8 Sensitivity Review Committee Rating Form ..........................................................................36
Figure 3.1 IEP Team State Assessment Decision-Making Flow Chart .....................................................48

MI-ACCESS P/SI/FI Science Technical RepoRT | 2 0 0 7 - 2 0 0 8 | 1
INTRODUCTION
The concept behind the Technical Reports for MI-Access, including Participation and Supported Inde-pendence and Functional Independence for Math and ELA, is to provide a way to communicate with test users. This is the primary purpose of supporting documents of tests as described by the Standards for Educational and Psychological Testing (1999). As suggested by the Standards, the reports should describe (a) the nature of the tests; (b) their intended uses; (c) the processes involved in their develop-ment; (d) technical information related to scoring, interpretation, and evidence of validity and reliabil-ity; (e) scaling and equating; and (f) guidelines for test administration and interpretation (p. 67).
The technical reports for MI-Access are designed to communicate with multiple users, including state policy makers and their staffs, school and district administrators, teachers, and parents and other ad-vocates interested in such documentation. The MI-Access reports are not designed to be inclusive of the volumes of documentation available for MI-Access. At some point, excessive documentation renders such reports inaccessible. To the extent possible, additional existing documentation will be referenced within the reports and made available upon request.
The MI-Access Science Technical Report contains a summary of the quantitative and qualitative evi-dence gathered to support the purposes and uses of the MI-Access Participation, Supported Indepen-dence, and Functional Independence Science assessments (also referred to as Phase 4). The primary purposes of MI-Access assessments are described in the MI-Access Handbooks and Assessment Plan documents provided by MDE (see references). The intent of this technical report is to provide rel-evant technical evidence for the Participation, Supported Independence, and Functional Independence Science assessments specifically.
The technical report uses the Standards for Educational and Psychological Testing (AERA, APA, NCME, 1999) as a guiding framework. The Standards provide guidelines regarding the relevant technical information that test developers need to make available to test users. The Standards provide clear cri-teria for test designers, publishers, and users, as well as guidelines for the evaluation of tests. Specific references to the Standards are made at applicable points throughout the report.
The MI-Access Science Technical Report is organized around the Standards that relate to test develop-ment, reliability, validity, and test administration, with additional attention paid to standards regarding testing individuals with disabilities. It also relies on the recommendations provided in the Standards that address essential supporting documentation for tests. Among the recommended supporting docu-mentation, the report addresses “the nature of the test; its intended use; the processes involved in the test’s development; technical information related to scoring, interpretation, and evidence of validity and reliability; … and guidelines for test administration and interpretation” (p. 67).
The report responds to the first standard on supporting documentation for tests (Standard 6.1), which reads:
Test documents (e.g., test manuals, technical manuals, user’s guides, and supple-mental material) should be made available to prospective test users and other qualified persons at the time a test is published or released for use (p. 68).
Throughout the report, where applicable and appropriate, the corresponding standards to which the documented evidence applies are referenced in footnotes.

2 | MI-ACCESS P/SI/FI Science Technical RepoRT | 2 0 0 7 - 2 0 0 8
CHAPTER 1
MI-ACCESS: MICHIGAN’S ALTERNATE ASSESSMENT PROGRAM
1.1 The Origins of MI-Access
MI-Access, Michigan’s Alternate Assessment Program, is the state’s response to federal and state edu-cational mandates and policies related to inclusion, assessment, and accountability. Relevant man-dates and policies are described below.
Federal Requirements
Federal mandates requiring the inclusion of students with disabilities in assessment programs were strengthened and clarified in the Elementary and Secondary Education Act of 1994 (Title 1) and the Individuals with Disabilities Education Act of 1997 (IDEA). The IDEA contains the most specific require-ments. It stipulates that:
All children with disabilities should have available to them educational programs and services •that will prepare them for employment and independent living.Children with disabilities should be included in general state and district-wide assessment •programs, with appropriate accommodations where necessary.State or local educational agencies must develop guidelines for the participation of children •with disabilities in alternate assessments for those children who cannot participate in the gen-eral assessment program (required to be in place by July 1, 2000).
Furthermore, the recently passed No Child Left Behind Act of 2001 (NCLB) introduced an additional set of mandates requiring the inclusion of every child in state assessment programs with specific grade- and subject-matter requirements.
State Requirements
In 1995, the Michigan State Board of Education (SBE) adopted the Model Content Standards con-tained in the Michigan Curriculum Framework as performance indicators for assessing progress toward achieving goals and standards for Michigan students. In November 1998, the SBE also approved the use of Addressing Unique Educational Needs of Students with Disabilities (AUEN 3.0) performance standards in developing a model for instruction and alternate assessment. The AUEN is not seen as a separate set of standards, but a model of how to operationalize the Model Content Standards for students with disabilities at various levels of cognitive functioning.
In addition, in October 2001, the SBE adopted a policy to include all students in the Michigan Educa-tional Assessment System (MEAS). The MEAS includes the Michigan Educational Assessment Program (the state’s general assessment program), MI-Access (the state’s alternate assessment program), and ELL-Access (for English language learners). MI-Access is the one component of the MEAS designed specifically to assess students with disabilities whose Individualized Education Program (IEP) Teams have determined that the MEAP is inappropriate for them, even with assessment accommodations. The SBE’s policy reads as follows:

MI-ACCESS P/SI/FI Science Technical RepoRT | 2 0 0 7 - 2 0 0 8 | 3
It shall be the policy of the State Board of Education that each local and intermediate school district and public school academy will ensure the participation of all students in the Michigan Educational Assessment System [the MEAP, MEAP with assessment accommodations, MI-Access, or ELL-Access].
MI-Access as a Response to Federal and State Mandates
In response to federal and state policies and mandates, the Michigan Department of Education (MDE), first through the Office of Special Education and Early Intervention Services (OSE/EIS) and now through the newly established Office of Educational Assessment and Accountability (OEAA), undertook the re-sponsibility of developing an alternate assessment program so that students with disabilities could participate meaningfully in the state’s assessment system.
Due to the enormity of the task, the MDE decided to develop and implement MI-Access—its alternate assessment program—in four phases.
First Phase of Development: Participation and Supported Independence
The first generation of MI-Access Participation and Supported Independence assessments were de-veloped in phase one. MI-Access Participation assessments are designed specifically for students who have, or function as if they have, severe cognitive impairment. These students are expected to require ongoing support in adulthood. They may also have both considerable cognitive and physical impair-ments that limit their ability to generalize or transfer learning, and thus may make determining their actual abilities and skills difficult. For that reason, the first generation of the MI-Access Participation assessments focused only on how a student responded to the opportunity to participate in an activity, not on how well he or she carried out that activity.
The MI-Access Supported Independence assessments are designed for students who have, or function as if they have, moderate cognitive impairment. These students are expected to require ongoing sup-port in adulthood. They may also have both cognitive and physical impairments that impact their ability to generalize or transfer learning; however, they usually can follow learned routines and demonstrate independent living skills. The Supported Independence assessments, therefore, are designed to provide students with opportunities to demonstrate their skills. Specifically, they measure how students perform certain tasks while acknowledging that they may require some allowable level of assistance to do so. (See Figure 1 for more information on the characteristics of students who would likely participate in MI-Access Participation and Supported Independence assessments.)
In the first two years of implementation, MI-Access Participation and Supported Independence assess-ments were administered once each year to students who were 9, 10, 13, 14, 17, and 18 years old. These ages were selected because (1) many students taking part in these assessments were not as-signed a grade level, and (2) they ensured that students assessed with MI-Access were assessed with the same frequency as general education students (that is, the ages corresponded with the grades as-sessed by the MEAP).
In 2003/2004, however, MI-Access Participation and Supported Independence were converted from ages to grades in order to comply with NCLB requirements of assessing student once in elementary school, middle school and high school. With that conversion, students in grades 4, 7, 8, and 11 were assessed since these were the grades in which English language arts and/or mathematics were as-sessed by the MEAP.

4 | MI-ACCESS P/SI/FI Science Technical RepoRT | 2 0 0 7 - 2 0 0 8
In 2005/2006, grades 3, 5, and 6 were added as required by federal law. The first generation of the MI-Access Participation and Supported Independence assessments did not meet all of the NCLB criteria for alternate assessments based on alternate achievement standards. As a result, new Participation and Supported Independence v1.5 assessments in the content areas of English language arts and math-ematics are in the third phase of development: MI-Access Participation and Supported Independence v1.5.
Second Phase of Development: MI-Access Functional Independence
The MI-Access Functional Independence assessments are designed for students whose IEP Teams have determined it is not appropriate for them to take part in the MEAP, the MEAP with assessment accom-modations, MI-Access Participation v1.5, or MI-Access Supported Independence v1.5. This primarily involves students who have, or function as if they have, mild cognitive impairment. They also have a limited ability to generalize learning across contexts, their learning rates are significantly slower than those of their age-level peers, they have a restricted knowledge base, they tend not to be very aware of environmental cues or details, and they do not learn incidentally. In adulthood, these students will most likely be able to meet their own needs and live successfully in their communities without overt support from others. It was determined that these students could benefit from an assessment containing a mix of English language arts and mathematics items presented in the contexts of daily living, employment, and community experience.
The MI-Access Functional Independence assessments were implemented for the first time statewide in 2005/2006. They were administered in the fall to students in grades 3 through 8 and in the spring to students in grade 11. As required by federal law, the assessments include the content areas of English language arts and mathematics.
Third Phase of Development: New Participation and Supported Independence v1.5 Assessments in the Content Areas of English Language Arts and Mathematics
The third phase of completing MI-Access, Michigan’s Alternate Assessment Program is to retire the first generation of MI-Access Participation and Supported Independence v1.5 assessments and develop new ones, which meet all of the NCLB criteria for alternate assessments based on alternate achieve-ment standards. These assessments are referred to as the MI-Access Participation and Supported Inde-pendence v1.5 assessments in the content areas of English language arts and mathematics.
Fourth Phase of Development: Development of MI-Access Science Assessments
The fourth phase of completing the MI-Access assessments is the development of science assessments for all three levels of MI-Access. These assessments are required by NCLB to be implemented no later than the 2007/2008 school year. The development of these assessments began during the 2005/2006 school year and assessments were piloted in spring 2007. The science assessments were administered statewide for the first time in fall 2007.
This report provides information only on phase 4 MI-Access (MI-Access Science Assessments).

MI-ACCESS P/SI/FI Science Technical RepoRT | 2 0 0 7 - 2 0 0 8 | 5
Involvement of Michigan Stakeholders
To support the development of MI-Access, the MDE convened numerous committees of Michigan stake-holders.
The Alternate Assessment Advisory Committee (AAAC) was formed to develop specifications for •MI-Access assessments and advise the MDE throughout the development process. The AAAC is comprised of special and general education teachers, other special education professionals, ad-ministrators, higher education staff, assessment experts, and MDE staff. The first AAAC objective was to develop a proposed plan to guide the overall development of MI-Access. To date, the AAAC has provided advice to the MDE on all aspects of development, implementation, and reporting.1
The Phase 4 Assessment Plan Writing Team (APWT) was comprised of approximately 26 educators •and parents experienced in working with learners with special needs. The MDE’s goal in convening the APWT was to establish a well-balanced team of individuals representing a broad spectrum of backgrounds and experience, including general and special education teachers, parents, teacher consultants, administrators, school psychologists, and so forth. The group also was intentionally geographically and demographically diverse. The team was charged with the development of the Assessment Plan (described below), test blueprint, item specifications, and item prototypes. In addition, the team reviewed the Grade Level Content Expectations (GLCE) and benchmarks and ‘extended’ them as necessary for the target population.
The Content Advisory Committee (CAC) was comprised of members of the APWT and additional •practitioners familiar with students at each MI-Access level. It was charged with determining which content standards were assessable at the state level and extending the benchmarks as needed. It reviewed all developed assessment items and materials prior to pilot administration and again following the pilot by reviewing pilot item analysis results. The CAC provided important validity evidence in their reviews, certifying that items (a) accurately reflect intended content standards and GLCE/benchmarks, (b) meet specifications for conceptual accuracy and completeness, and (c) are grade appropriate.
The Sensitivity Review Committee (SRC) consisted of two groups: one for Participation and Sup-•ported Independence, and another for Functional Independence. The SRC was responsible for re-viewing all assessment items and materials for inappropriate language or differential performance based on race/ethnicity and gender. In addition, it looked for topics that, because of their sensitive nature, may not be appropriate for statewide assessment. Following these guidelines the SRC re-viewed each item before and after administration of pilot items. To ensure independent review, SRC members did not participate on any other committees related to MI-Access.
A national Technical Advisory Committee (TAC) provided the MDE with psychometric and technical •advice related to the development, implementation, reporting, and evaluation of all phases of MI-Access. Its members were drawn from a pool of national assessment experts. The TAC met several times during the development and initial implementation of MI-Access and continues to meet to provide advice regarding issues related to reporting, the state’s accountability system, Adequate Yearly Progress, and other federal requirements.
1 Standard 3.5. When appropriate, relevant experts external to the testing program should review the test specifications.

6 | MI-ACCESS P/SI/FI Science Technical RepoRT | 2 0 0 7 - 2 0 0 8
Members of the AAAC, SRC, and CAC are listed in the alternate assessment development plan.2 It should be noted that the MDE selected Beck Evaluation & Testing Associates, Inc./Touchstone Applied Sciences Associates, Inc. (BETA/TASA) as the operational contractor for the MI-Access assessments. As contractor, BETA/TASA provides a wide range of assessment development and support services.
1.2 The Nature of the Assessment & Population
MI-Access is an alternate assessment system that employs a standardized set of instruments covering state content frameworks in English language arts, mathematics, and science, used to ultimately yield an overall classification of student performance into one of three levels: surpassed the performance standard, attained the performance standard, and emerging toward the performance standard.
IEP Teams, through a deliberative process, determine which assessment their students will take. More information regarding the assessment administration process—with a focus on the technical adequacy of the procedures—is provided in Chapter 3.3
Participation (P)
Students that are determined to function at the P Level have, or function as if they have, severe cognitive impairments. These students may have both considerable cognitive and physical impairments that limit their ability to generalize or transfer learning, and thus may make determining their actual abilities and skills difficult. These students are expected to require ongoing support in adulthood.
Supported Independence (SI)
Students that are determined to function at the SI Level have, or function as if they have, moderate cog-nitive impairment. These students may have both cognitive and physical impairments that impact their ability to generalize or transfer learning; however, they usually can follow learned routines and demon-strate independent living skills. These students are expected to require ongoing support in adulthood.
Functional Independence (FI)
Students that are determined to function at the FI Level have or function as if they have mild cognitive impairments that impact their ability to transfer and generalize learning across performance contexts. Learning rate is significantly slower than for their age-level peers (roughly one-half to three-fourths the rate). Students have a restricted knowledge base and tend not be very aware of environmental cues or details. The instructional approach includes authentic experiences in settings in which the student is expected to function. Students at the FI level are expected to achieve a functional level of independence in adulthood. They are capable of meeting their own needs and living successfully in the community without direct support from others (Frey, Burke, Jakwerth, Lynch, & Sumpter, 1999).
2 Standard 1.7. When a validation rests in part on the opinion or decisions of expert judges, observers, or raters, proce-dures for selecting such experts and for eliciting judgments or ratings should be fully described. The qualifications, and experience, of the judges should be presented.
3 Standard 3.6. The type of items, the response formats, scoring procedures, and test administration procedures should be selected based on the purposes of the test, the domain to be measured, and the intended test takers.

MI-ACCESS P/SI/FI Science Technical RepoRT | 2 0 0 7 - 2 0 0 8 | 7
1.3 Intended Uses
Phase 4 MI-Access Science Assessments were developed primarily to allow students with severe, mod-erate, and mild cognitive impairment—who would otherwise not be assessed with the state’s general assessment—to participate in the MEAS.4 Thus, MI-Access is moving the state toward its own goal of including all students in the state’s educational accountability system and toward compliance with fed-eral educational rules and requirements, including the calculation of Adequate Yearly Progress (AYP).
Scores from MI-Access assessments can be used in a variety of meaningful ways by students, programs, schools, districts, and the state. For example, MI-Access results can:
1. Inform parents about their child’s level of performance by (a) providing periodic criterion-related performance information on curriculum-relevant and functional areas of achievement, (b) clarify-ing instructional and behavioral educational targets, and (c) improving parents’ understanding of their child’s learning objectives and achievement.
2. Inform teachers about their students’ level of performance by (a) helping them focus instruction on targets related to important content strands in science, (b) supporting the creation of instruc-tional activities related to developing skills in areas needing improvement, and (c) identifying areas of program-wide instructional strengths and weaknesses.
3. Inform IEP team decision making by helping with the (a) determination of IEP goals and educa-tional targets, (b) assessing the attainment of IEP goals, and (c) writing present level of educa-tional performance statements.
4. Inform district, school, and program accountability by (a) using student performance data for continuous improvement efforts, (b) including students previously exempted from assessments, (c) developing incentives for stronger monitoring of program development, and (d) enhancing the ability of students to participate in and benefit from school experiences.
The following potential uses are not appropriate because they are unsupported by available research evidence.5
1. Teacher quality or merit-based decisions - There is no evidence to suggest that the information obtained through MI-Access could be used to determine teacher quality or provide support for individual teacher merit-based decisions. This is particularly difficult for students at the Participation, Supported Independence, and Functional In-dependence levels as these students rely on special education services in a variety of ways and to different degrees. Uses for information derived from MI-Access should focus instead on curricular content and the opportunities provided to students by programs.
2. A single source for IEP development - MI-Access is based on critical aspects of participation in major life roles. Although the range of outcomes specified within the framework is broad, it is not absolute. There are likely to be impor-tant and meaningful aspects of individual goals that are related to, but not contained within, MI-Access but are relevant to IEP development. MI-Access results should not constrain an IEP Team’s deliberations, but instead should guide, expand, and inform them.
4 Standard 1.1. A rationale should be presented for each recommended interpretation and use of test scores, together with a comprehensive summary of the evidence and theory bearing on the intended use or interpretation.
5 Standard 4.3. If there is sound reason to believe that specific misinterpretations of a score scale are likely, test users should be explicitly forewarned.

8 | MI-ACCESS P/SI/FI Science Technical RepoRT | 2 0 0 7 - 2 0 0 8
1.4 Assessment Development Process
Early in the MI-Access planning stages, multiple phases were defined. Phases I-III include the develop-ment of assessments for Participation, Supported Independence and Functional Independence in Math-ematics and English Language Arts. The technical manuals for these phases have been completed. As stated above, Phase IV MI-Access involves the development and implementation of the Science assess-ment for Levels 1-3: Participation (P), Supported Independence (SI), and Functional Independence (FI). This manual focuses on the P/SI/FI Science assessments.
Plan for the Development of the Alternate Assessment
During the development of MI-Access, the MI-Access Science Assessment Plan was developed by the APWT (described above), a group of approximately 26 educators and parents experienced in working with learners with special needs. The list of team members is in the Appendix of the Assessment Plan. The plan includes
(1) the assumptions underlying the assessment; (2) the population and subject areas assessed; (3) the number of assessment items and their formats; (4) prototype items to guide item writers; and (5) other information clarifying how and why the assessment should be developed. (MDE, 2005b, p.8)
The Plan was made available for statewide review as well as review by critical stakeholders and policy makers in fall 2003. A feedback form was created to obtain formal input from individuals who have had experience working with students receiving special education services. Results from the statewide review are presented in Chapter 7.
The basic time line for the development of the MI-Access FI Assessment includes the following:
April-June 2006: Development of the items/assessments by Questar•July 2006: SRC/CAC item review•Spring 2007: Pilot Administration (grades 5, 8, and 11)•June 25-28, 2007: SRC/CAC data review (grades 5, 8, and 11)•Fall 2007: First operational administration of assessment (grades 5 and 8)•December 2007: Standard setting (grades 5 and 8)•Spring 2008: First operational administration of assessment (grade 11)•April 2008: Standard setting (grade 11)•

MI-ACCESS P/SI/FI Science Technical RepoRT | 2 0 0 7 - 2 0 0 8 | 9
CHAPTER 2
SCIENCE ASSESSMENT DEVELOPMENT
2.1 The MI-Access Science Assessment Design
To meet both the intent and function of state and federal legislation, rules, and policies, MI-Access was designed to parallel the existing MEAP assessment model (MEAP is Michigan’s general state assess-ment program). The ideal alternate assessment program was envisioned as one that would parallel the existing general assessment program in as many ways as practical. Primary design considerations included the timing of the assessment window, the age groups/grades assessed, and the assessment administration burden on teachers and students.
The existing MEAP is (a) structured to assess students in specific grades and specific content areas with the content areas alternating across grades, and is (b) administered in the fall of each school year with students in grades 5 and 8 and in the spring with students in grade 11. These two considerations were emulated in the design of MI-Access to ensure that students with disabilities participating in alternate assessment would have experiences similar to those of students participating in the MEAP.
Constructs Assessed
The MI-Access Participation science assessments assess much of the same content as the MEAP. There are differences, however, in the number of assessment items and the depth, breadth and complexity have been reduced appropriately for the populations being assessed. In addition, many of the standard and nonstandard accommodations that students with disabilities need to participate fully in the MEAP are not needed to participate in MI-Access Participation and Supported Independence assessments. This is because the latter assessments are universally designed, which means they were developed in such a way that the need for accommodations is reduced, if not eliminated, by removing barriers to accessing the assessment to demonstrate what students know related to science.
The Assessment Plan Writing Team (APWT) reviewed several sources of information to identify and select content standards essential for the MI-Access Science assessments. The Michigan Curriculum Framework was viewed as the foundation of local curricula in general education programs. NCLB requires direct links between state assessments and state curriculum. The AUEN documents specify-ing educational performance expectations appropriate for students at the Participation, Supported Independence, and Functional Independence (P/SI/FI) levels provided further guidance regarding the appropriateness of content standards. Finally, the team reviewed alternate assessments from other states.
The Science APWT was divided into four groups by science subject matter/strand – Constructing New Scientific Knowledge, Reflecting on Scientific Knowledge, Using Life Science, Using Physical Science, and Using Earth Science. Each group was composed of 5-8 people and contained at least one gen-eral education content specialist who served as facilitator. Each group studied one domain or cluster of science content standards and benchmarks at a time, and beginning with the first cluster, they an-swered the following questions for each of the three grade-level spans (elementary, middle school, high school):

1 0 | MI-ACCESS P/SI/FI Science Technical RepoRT | 2 0 0 7 - 2 0 0 8
1. “What is the fundamental meaning or content of this cluster of standards and benchmarks?”2. “What are the underlying key concepts and understandings?”3. “What knowledge and skills will be assessed?”
APWT members wrote 1-3 statements which sufficiently captured the content and skills of the bench-mark. Groups were instructed to express this as a measurable and observable student performance.
The MEAP model includes a fall and spring assessment window. Science assessments are administered in the fall of each year to grades 5 and 8, and in the spring of each year to grade 11. These assess-ments were designed to meet NCLB requirements as well as provide information for the Michigan Merit program, which provides scholarships to students based on their high school performance.
To parallel the MEAP, MI-Access administers Science assessments to grades 5 and 8 in the fall and to grade 11 in the spring.
2.2 Item Development
The APWT P/SI/FI science sub-groups recommended that the MI-Access science assessments for each of these levels would be based on the fundamental meaning or content of the existing Michigan Cur-riculum Framework Science Content Benchmarks, 2000 version (MCF v.2000). Appropriate knowledge and skills based on the key concepts and understandings of the framework standards and benchmarks would be assessed. All items would be aligned to extended benchmarks, related to key concepts, re-lated to real-world contexts, and reflect functional life skills.
It is understood that the MI-Access P/SI/FI student populations access information—including scientific information and concepts—in a variety of ways. While some students will read written text, others will use listening, viewing, speaking, and visual representation (such as drawing) skills when respond-ing during the assessment activities. Therefore, the science assessments will pay close attention to the needs of non-reading and non-writing students, and will be designed in such a way that they measure a student’s knowledge of scientific concepts as opposed to his or her reading and/or writing ability.
Science Benchmarks
In the Michigan Curriculum Framework, there are five Science strands. Under each strand there are two to five content standards-or broad curriculum statements common to all grades-that describe what students should know and be able to do by the time they graduate from high school.
Following each of the content standards, there are one to six benchmarks that describe the knowledge and skills students must have in order to achieve particular content standards. The benchmarks are not written at individual grade levels, but instead are written for grade-level clusters, including elementary, middle school, and high school.
Assessment Format
While item difficulty varies on specific grade-level within MI-Access science assessments, they generally are designed the same way.

MI-ACCESS P/SI/FI Science Technical RepoRT | 2 0 0 7 - 2 0 0 8 | 1 1
1. All items are provided in a real-world context.2. Hands-on materials or objects—such as electrical appliances, containers of liquids, and so
forth—may be used as long as the material or object does NOT change the nature of a ques-tion or elicit a different response.
3. Multiple choice/selected response items will have 2 to 3 answer choices in a text and/or picture format, depending on the level of the assessment.a. Functional Independence multiple choice items will have 3 answer choices in a text and/or
picture format. b. Supported Independence selected response items will have 3 answer choices in only a
picture format. c. Participation selected response items will have 2 answer choices in a picture format.d. Observation activities will also be included for Participation.
Universal Design
Throughout the item development phase (including item review following the Pilot), elements of univer-sal design (Thompson, Johnstone, & Thurlow, 2002) were employed. The elements that were empha-sized during item development included:
1. Simple, clear, commonly-used words should be used, and any unnecessary words should be eliminated;
2. When technical terms must be used, they should be clearly defined;3. Compound complex sentences should be broken down into several short sentences, stating the
most important ideas first;4. Only one idea, fact, or process should be introduced at a time, then develop the ideas logi-
cally;5. All noun-pronoun relationships should be made clear;6. When time and setting are important to the sentence, place them at the beginning of the sen-
tence;7. When presenting instructions, sequence steps in the exact order of the occurrence; and 8. If processes are being described, they should be simply illustrated, labeled, and placed close to
the text they support.
2.3 Assessment Blueprints
The purpose of a blueprint is to show how many assessment items are included in an assessment, in this case, by strand and topic. Two tables were created for each level to provide this information as it relates to science.
The science assessments include both core and embedded assessment activities. Core items are those upon which students’ scores are based. Embedded items are those that are placed in the assessment for field testing purposes to gather statistical data; performance on these items does not impact a stu-dent’s score.
Participation
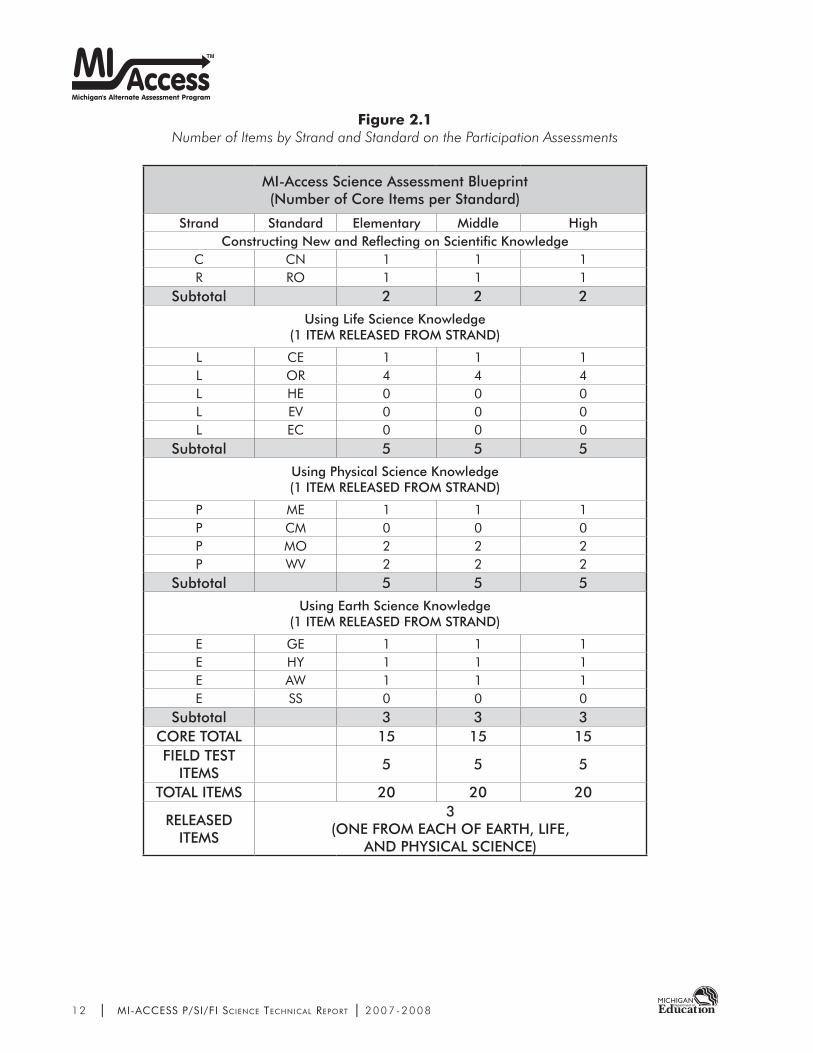
Figure 2.1 lists the number of core items on each Participation assessment. The number of items per strand and per standard within a strand is shown for each grade level.
1 2 | MI-ACCESS P/SI/FI Science Technical RepoRT | 2 0 0 7 - 2 0 0 8
Figure 2.1 Number of Items by Strand and Standard on the Participation Assessments
MI-Access Science Assessment Blueprint (Number of Core Items per Standard)
Strand Standard Elementary Middle HighConstructing New and Reflecting on Scientific Knowledge
C CN 1 1 1R RO 1 1 1
Subtotal 2 2 2
Using Life Science Knowledge (1 ITEM RELEASED FROM STRAND)
L CE 1 1 1L OR 4 4 4L HE 0 0 0L EV 0 0 0L EC 0 0 0
Subtotal 5 5 5
Using Physical Science Knowledge (1 ITEM RELEASED FROM STRAND)
P ME 1 1 1P CM 0 0 0P MO 2 2 2P WV 2 2 2
Subtotal 5 5 5
Using Earth Science Knowledge (1 ITEM RELEASED FROM STRAND)
E GE 1 1 1E HY 1 1 1E AW 1 1 1E SS 0 0 0
Subtotal 3 3 3CORE TOTAL 15 15 15FIELD TEST
ITEMS5 5 5
TOTAL ITEMS 20 20 20
RELEASED ITEMS
3 (ONE FROM EACH OF EARTH, LIFE,
AND PHYSICAL SCIENCE)

MI-ACCESS P/SI/FI Science Technical RepoRT | 2 0 0 7 - 2 0 0 8 | 1 3
Figure 2.2 indicates the number of core items on the assessment, as well as the number of field-test items that will be embedded on the operational assessment at each grade level. The embedded items will be distributed in a manner similar to the core items, that is, approximately 7% will come from Strand I, 7% will come from Strand II, 33% will come from Strand III, 33% from Strand IV, and 20% from Strand V.
Student scores will be based on their performance on the core items. Ten of the core items will be selected response. Five of the core items will be performance observation. Each item will yield up to six points. Data will be collected about student performance on the embedded field test items, but will not count toward student’s overall performance scores used for accountability purposes.
Figure 2.2 Number of Core Items and Embedded
Field-Test Items on the Participation Assessments
Science Assessment
Number of Core Items
Scored Points
Number of Embedded
Field-Test Items
Total Number of Items on Assessment
Number of Items Released
each Year
Elementary15 (10 SR, 5 Observation)
905 (3 SR, 2
Observation)25 3
Middle15 (10 SR, 5 Observation)
905 (3 SR, 2
Observation)25 3
High15 (10 SR, 5 Observation)
905 (3 SR, 2
Observation)25 3

1 4 | MI-ACCESS P/SI/FI Science Technical RepoRT | 2 0 0 7 - 2 0 0 8
Supported Independence
Figure 2.3 lists the number of core items on each SI assessment. The number of items per strand and per standard within a strand is shown for each grade level.
Figure 2.3 Number of Items by Strand and
Standard on the Supported Independence Assessments
MI-Access Science Assessment Blueprint (Number of Core Items per Standard)
Strand Standard Elementary Middle High
Constructing New and Reflecting on Scientific Knowledge
C CN 1 1 1R RO 1 1 1
Subtotal 2 2 2
Using Life Science Knowledge
L CE 1 1 1L OR 5 5 5L HE 0 0 0L EV 0 0 0L EC 1 1 1
Subtotal 7 7 7
Using Physical Science Knowledge
P ME 1 1 1P CM 0 0 0P MO 1 1 1P WV 1 1 1
Subtotal 3 3 3
Using Earth Science Knowledge
E GE 1 1 1E HY 2 2 2E AW 1 1 1E SS 1 1 1
Subtotal 5 5 5CORE TOTAL 17 17 17FIELD TEST
ITEMS5 5 5
TOTAL ITEMS 22 22 22
RELEASED ITEMS
3 (ONE FROM EACH OF EARTH, LIFE,
AND PHYSICAL SCIENCE)

MI-ACCESS P/SI/FI Science Technical RepoRT | 2 0 0 7 - 2 0 0 8 | 1 5
Figure 2.4 indicates the number of core items on the assessment, as well as the number of field-test items that will be embedded on the operational assessment at each grade level. The embedded items will be distributed in a manner similar to the core items, that is, approximately 10% will come from Strand I, 10% will come from Strand II, 40% will come from Strand III, 15% from Strand IV, and 25% from Strand V.
Student scores will be based on their performance on the core items. Each of the core items will be selected response and yield 4 points per item. Data will be collected about student performance on the embedded field test items, but will not count toward student’s overall performance scores used for accountability purposes.
Figure 2.4 Number of Core Items and Embedded
Field-Test Items on the Supported Independence Assessments
Science Assessment
Number of Core Items
Scored Points
Number of Embedded
Field-Test Items
Total Number of Items on Assessment
Number of Items Released
each Year
Elementary 17 SR 88 5 22 3
Middle 17 SR 88 5 22 3
High 17 SR 88 5 22 3

1 6 | MI-ACCESS P/SI/FI Science Technical RepoRT | 2 0 0 7 - 2 0 0 8
Functional Independence
Figure 2.5 lists the number of core items on each FI assessment. The number of items per strand and per standard within a strand is shown for each grade level.
Figure 2.5 Number of Items by Strand and Standard
on the Functional independence Assessments
MI-Access Science Assessment Blueprint (Number of Core Items per Standard)
Strand Standard Elementary Middle HighConstructing New and Reflecting on Scientific Knowledge
C CN 2 2 2R RO 2 2 2
Subtotal 4 4 4Using Life Science Knowledge
(1 ITEM RELEASED FROM STRAND)L CE 0 1 2L OR 7 7 8L HE 2 0 0L EV 1 2 0L EC 3 4 4
Subtotal 13 14 14Using Physical Science Knowledge (1 ITEM RELEASED FROM STRAND)
P ME 3 7 7P CM 4 3 3P MO 2 3 2P WV 3 1 3
Subtotal 12 14 15Using Earth Science Knowledge
(1 ITEM RELEASED FROM STRAND)E GE 2 2 5 E HY 2 2 3E AW 2 2 3E SS 0 2 1
Subtotal 6 8 12CORE TOTAL 35 40 45FIELD TEST
ITEMS8 10 10
TOTAL ITEMS 43 50 55
RELEASED ITEMS
3 (ONE FROM EACH OF EARTH, LIFE,
AND PHYSICAL SCIENCE)

MI-ACCESS P/SI/FI Science Technical RepoRT | 2 0 0 7 - 2 0 0 8 | 1 7
Figure 2.6 indicates the number of core items on the assessment, as well as the number of field-test items that will be embedded on the operational assessment at each grade level. The embedded items will be distributed in a manner similar to the core items, that is, approximately 6% will come from Strand I, 6% will come from Strand II, 37% will come from Strand III, 34% from Strand IV, and 17% from Strand V.
Student scores will be based on their performance on the core items. Data will be collected about student performance on the embedded field test items, but will not count toward student’s overall per-formance scores used for accountability purposes.
Figure 2.6 Number of Core Items and Embedded
Field-Test Items on the Functional Independence Assessments
Science Assessment
Number of Core Items
Number of Embedded Field
Test Items
Total Number of Items on Assessment
Number of Items Released each Year
Elementary 35 8 43 3
Middle 40 10 50 3
High 45 10 55 3
2.4 Spring 2007 Pilot
Form Development
Implementation booklets were constructed for the Spring 2007 Pilot administration of MI-Access Sci-ence assessments. Four forms were developed at each grade for Participation and Supported Indepen-dence, and five forms were developed for Functional Independence. The TAC reviewed the assessment blueprints.
Implementation
In spring 2007, the MI-Access coordinators received the Coordinator and Assessment Administrator Manual for the Spring 2007 Science Pilot for Participation, Supported Independence, and Functional Independence. The manual provided information regarding the purpose of the Pilot, students to be as-sessed, information about eligible accommodations, and specific administration information.
Tables 2.1 through 2.9 contain summary information regarding demographics of Pilot participants for all three levels of MI-Access, including the number of students assessed at each grade level on each form, as well as gender and race breakdowns by grade and form. Table 2.10 shows the percent of students by racial/ethnic group across all grades and assessment levels.

1 8 | MI-ACCESS P/SI/FI Science Technical RepoRT | 2 0 0 7 - 2 0 0 8
Table 2.1Spring 2007 Pilot Participation by Grade and Form
Participation Science
GradeForm
Total1 2 3 4
5 36 89 83 61 2698 41 79 84 66 27011 45 61 68 58 232
Total 122 229 235 185 771
Table 2.2Spring 2007 Pilot Participation by Grade and Form
Supported Independence Science
GradeForm
Total1 2 3 4
5 104 104 109 131 4488 147 128 142 140 55711 139 162 110 136 547
Total 390 394 361 407 1552
Table 2.3Spring 2007 Pilot Participation by Grade and Form
Functional Independence Science
GradeForm
Total1 2 3 4 5
5 475 310 273 225 328 16118 563 268 260 308 286 1685
11 507 237 283 286 248 1561Total 1545 815 816 819 862 4857

MI-ACCESS P/SI/FI Science Technical RepoRT | 2 0 0 7 - 2 0 0 8 | 1 9
Table 2.4Spring 2007 Pilot Participation by Grade, Form, and Gender
Participation Science
Grade FormGender
TotalMissing Female Male
5
1 3 14 19 362 2 37 50 893 1 37 45 834 1 22 38 61
8
1 0 20 21 412 3 30 46 793 9 32 43 844 3 27 36 66
11
1 3 16 26 452 1 18 42 613 2 28 38 684 0 24 34 58
Table 2.5Spring 2007 Pilot Participation by Grade, Form, and Gender
Supported Independence Science
Grade FormGender
TotalMissing Female Male
5
1 4 31 69 1042 12 35 57 1043 9 26 74 1094 4 46 81 131
8
1 13 44 90 1472 15 41 72 1283 3 45 94 1424 10 57 73 140
11
1 9 39 91 1392 8 67 87 1623 0 44 66 1104 11 56 69 136
2 0 | MI-ACCESS P/SI/FI Science Technical RepoRT | 2 0 0 7 - 2 0 0 8
Table 2.6Spring 2007 Pilot Participation by Grade, Form, and Gender
Functional Independence Science
Grade FormGender
TotalMissing Female Male
5
1 0 179 328 5072 0 84 153 2373 0 90 193 2834 0 117 169 2865 0 84 164 248
8
1 0 192 371 5632 0 97 171 2683 0 97 163 2604 0 106 202 3085 0 108 178 286
11
1 0 179 296 4752 0 105 205 3103 0 100 173 2734 0 94 131 2255 0 117 211 328

MI-ACCESS P/SI/FI Science Technical RepoRT | 2 0 0 7 - 2 0 0 8 | 2 1
Tab
le 2
.7Sp
ring
2007
Pilo
t Par
ticip
atio
n by
Gra
de, F
orm
, and
Eth
nici
ty
Parti
cipa
tion
Scie
nce
Gra
deFo
rm
Ethn
icity
Tota
lA
mer
ican
In
dian
or
Ala
skan
N
ativ
e
Asi
an o
r Pa
cific
Is
land
er
Blac
k,
Not
of
His
pani
c O
rigi
n
His
pani
c
Whi
te,
Not
of
His
pani
c O
rigi
n
Mul
ti-
raci
alO
ther
Unk
now
nM
issi
ng
5
10
210
020
10
03
362
00
284
500
41
289
30
224
351
00
21
834
03
101
421
30
161
8
11
18
030
01
00
412
02
181
532
00
379
31
233
034
11
39
844
11
133
441
00
366
11
11
010
228
00
13
452
03
262
290
00
161
31
319
043
00
02
684
00
181
381
00
058

2 2 | MI-ACCESS P/SI/FI Science Technical RepoRT | 2 0 0 7 - 2 0 0 8
Tab
le 2
.8Sp
ring
2007
Pilo
t Par
ticip
atio
n by
Gra
de, F
orm
, and
Eth
nici
ty
Supp
orte
d In
depe
nden
ce S
cien
ce
Gra
deFo
rm
Ethn
icity
Tota
lA
mer
ican
In
dian
or
Ala
skan
N
ativ
e
Asi
an o
r Pa
cific
Is
land
er
Blac
k,
Not
of
His
pani
c O
rigi
n
His
pani
c
Whi
te,
Not
of
His
pani
c O
rigi
n
Mul
ti-
raci
alO
ther
Unk
now
nM
issi
ng
5
11
126
364
01
44
104
22
228
653
10
012
104
30
223
567
21
09
109
42
835
771
22
04
131
8
10
237
686
00
313
147
20
225
479
03
015
128
30
237
692
11
03
142
41
441
380
01
010
140
11
11
656
364
00
09
139
21
151
891
20
08
162
30
29
297
00
00
110
41
323
393
20
011
136

MI-ACCESS P/SI/FI Science Technical RepoRT | 2 0 0 7 - 2 0 0 8 | 2 3
Tab
le 2
.9Sp
ring
2007
Pilo
t Par
ticip
atio
n by
Gra
de, F
orm
, and
Eth
nici
ty
Func
tiona
l Ind
epen
denc
e-Sc
ienc
e
Gra
deFo
rm
Ethn
icity
Tota
lA
mer
ican
In
dian
or
Ala
skan
N
ativ
e
Asi
an o
r Pa
cific
Is
land
er
Blac
k,
Not
of
His
pani
c O
rigi
n
His
pani
c
Whi
te,
Not
of
His
pani
c O
rigi
n
Mul
ti-
raci
alO
ther
Unk
now
nM
issi
ng
5
14
612
620
342
51
30
507
22
454
1315
93
11
023
73
42
768
188
50
00
283
42
111
010
160
21
00
286
54
554
817
13
30
024
8
8
114
618
618
336
21
00
563
25
569
1617
02
01
026
83
76
7313
160
01
00
260
43
262
822
83
20
030
85
21
789
193
20
10
286
11
15
586
1436
32
00
047
52
11
7612
210
100
00
310
31
258
620
51
00
027
34
21
3813
170
10
00
225
54
278
823
41
01
032
8

2 4 | MI-ACCESS P/SI/FI Science Technical RepoRT | 2 0 0 7 - 2 0 0 8
Table 2.10Spring 2007 Pilot Participation by Ethnicity
Across Grades and Assessments
Ethnicity PercentWhite 65.3Black 25.5
Hispanic 3.5Multiracial 0.8All Other 4.9
Total 100.0
Data Preparation
For Participation, Supported Independence, and Functional Independence, the total number of scanned documents across forms and grades was 815, 1584, and 5534, respectively. Prior to analysis, the re-sponses for each form were reviewed for form, grade, and non-response sets (missing item responses). Students were deleted from the analysis with missing form, grade, form-grade mismatch, or where responses to all items were blank. This resulted in 44, 32, and, 677 students deleted from the Partici-pation, Supported Independence, and Functional Independence databases, respectively, yielding 771, 1552, and 4857 students used in the analyses.
Distractor and Item Analysis
Table 2.11 provides a summary of the item analysis results for the science pilot. The table shows the minimum, maximum, mean, and standard deviation of the item means and item-total correlations across all items within each grade for each assessment level.

MI-ACCESS P/SI/FI Science Technical RepoRT | 2 0 0 7 - 2 0 0 8 | 2 5
Table 2.11Spring 2007 Pilot Item Statistic Summaries
Grade Statistic N Minimum Maximum Mean SD
Participation
5item mean 80 0.80 3.69 2.10 0.55
r-pbs 80 0.50 0.81 0.69 0.08
8item mean 80 1.43 3.66 2.48 0.55
r-pbs 80 0.41 0.84 0.70 0.09
11item mean 80 1.41 3.55 2.26 0.53
r-pbs 80 0.59 0.85 0.73 0.07
Supported Independence
5item mean 100 1.37 3.54 2.65 0.49
r-pbs 100 0.27 0.73 0.56 0.11
8item mean 100 1.30 3.55 2.45 0.51
r-pbs 100 0.20 0.73 0.52 0.11
11item mean 100 1.13 3.66 2.73 0.52
r-pbs 100 0.19 0.78 0.53 0.13
Functional Independence
5p-value 188 0.21 0.98 0.66 0.20r-pbs 188 -0.13 0.49 0.28 0.12
8p-value 222 0.21 0.97 0.63 0.19r-pbs 222 -0.12 0.52 0.26 0.12
11p-value 230 0.15 0.97 0.64 0.19r-pbs 230 -0.20 0.56 0.29 0.13

2 6 | MI-ACCESS P/SI/FI Science Technical RepoRT | 2 0 0 7 - 2 0 0 8
Subgroup Analysis
Item analyses were also completed based on subgroup membership for gender and ethnicity. Because of the small number of students in most ethnic groups, only results for White and Black students were reviewed. Tables 2.12, 2.14, and 2.16 contain results by gender; Tables 2.13, 2.15, and 2.17 contain results by race.
Table 2.12Spring 2007 Pilot Form Score Summaries by Gender and Test Form -
Participation Science
TEST FORM GradeMale Female
Mean SD N Mean SD NPP-S51 5 48.68 36.68 19 48.36 39.18 14PP-S52 5 35.12 34.36 50 26.24 35.49 37PP-S53 5 42.58 39.64 45 37.57 38.20 37PP-S54 5 52.08 37.03 38 28.09 37.52 22PP-S81 8 50.24 34.44 21 57.50 42.07 20PP-S82 8 51.52 45.64 46 52.27 39.98 30PP-S83 8 41.67 34.51 43 34.56 40.55 32PP-S84 8 47.11 37.41 36 52.15 39.66 27
PP-S111 11 37.04 37.81 26 56.94 38.77 16PP-S112 11 39.88 40.07 42 21.50 34.98 18PP-S113 11 56.63 41.12 38 45.96 39.11 28PP-S114 11 49.82 44.24 34 42.75 39.99 24
Table 2.13Spring 2007 Pilot Form Score Summaries by Ethnicity and Test Form -
Participation Science
TEST FORM GradeWhite Black
Mean SD N Mean SD NPP-S51 5 53.85 36.13 20 31.40 39.07 10PP-S52 5 32.94 33.97 50 27.68 36.30 28PP-S53 5 35.94 36.49 51 48.58 44.56 24PP-S54 5 44.98 38.35 42 43.40 43.50 10PP-S81 8 62.63 33.98 30 35.25 45.24 8PP-S82 8 51.02 40.61 53 62.67 51.44 18PP-S83 8 33.32 36.53 34 41.30 37.97 33PP-S84 8 50.02 38.57 44 5.67 9.81 13
PP-S111 11 42.46 40.35 28 61.60 35.00 10PP-S112 11 36.62 36.66 29 31.69 42.53 26PP-S113 11 46.19 41.10 43 63.37 39.53 19PP-S114 11 50.11 41.87 38 41.22 45.09 18

MI-ACCESS P/SI/FI Science Technical RepoRT | 2 0 0 7 - 2 0 0 8 | 2 7
Table 2.14Spring 2007 Pilot Form Score Summaries by Gender and Test Form -
Supported Independence Science
TEST FORM GradeMale Female
Mean SD N Mean SD NPSI-S51 5 68.93 23.89 69 68.94 20.29 31PSI-S52 5 62.96 28.45 57 65.29 27.28 35PSI-S53 5 63.64 27.36 74 72.38 21.65 26PSI-S54 5 64.94 27.61 81 63.20 25.99 46PSI-S81 8 59.07 24.89 90 59.14 21.37 44PSI-S82 8 63.25 25.73 72 52.05 25.74 41PSI-S83 8 60.34 26.62 94 60.40 23.74 45PSI-S84 8 64.47 24.49 73 69.44 21.02 57
PSI-S111 11 68.80 26.43 91 71.72 26.16 39PSI-S112 11 63.71 21.18 87 64.42 20.57 67PSI-S113 11 69.83 25.42 66 73.16 21.62 44PSI-S114 11 69.74 22.11 69 66.07 21.90 56
Table 2.15Spring 2007 Pilot Form Score Summaries by Ethnicity and Test Form -
Supported Independence Science
TEST FORM GradeWhite Black
Mean SD N Mean SD NPSI-S51 5 69.11 22.72 64 69.85 23.26 26PSI-S52 5 66.92 26.12 53 61.39 29.22 28PSI-S53 5 67.94 22.80 67 64.83 31.88 23PSI-S54 5 69.13 26.47 71 58.20 26.35 35PSI-S81 8 59.09 24.67 86 60.22 21.41 37PSI-S82 8 58.57 26.61 79 63.32 25.54 25PSI-S83 8 62.72 25.37 92 52.32 25.85 37PSI-S84 8 68.09 21.58 80 66.00 25.83 41
PSI-S111 11 74.80 22.54 64 63.84 29.60 56PSI-S112 11 67.59 19.44 91 57.67 23.03 51PSI-S113 11 71.78 22.20 97 * * *PSI-S114 11 68.16 20.76 93 66.61 27.62 23

2 8 | MI-ACCESS P/SI/FI Science Technical RepoRT | 2 0 0 7 - 2 0 0 8
Table 2.16Spring 2007 Pilot Form Score Summaries by Gender and Test Form -
Functional Independence Science
TEST FORM GradeMale Female
Mean SD N Mean SD NPFI-S51 5 32.9 7.6 329 32.2 6.4 180PFI-S52 5 34.5 6.4 153 30.3 6.4 84PFI-S53 5 33.5 7.5 193 31.2 6.4 90PFI-S54 5 31.0 6.9 173 29.0 6.3 119PFI-S55 5 31.0 6.1 170 30.9 5.9 84PFI-S81 8 37.2 8.0 372 34.3 7.5 192PFI-S82 8 34.3 7.3 172 33.4 7.4 97PFI-S83 8 36.6 7.1 164 34.7 7.1 97PFI-S84 8 32.8 8.3 208 30.1 7.2 109PFI-S85 8 34.7 7.4 180 33.2 7.1 1105PFI-S111 11 39.8 8.2 296 36.4 8.0 179PFI-S112 11 39.4 9.8 205 37.5 8.1 105PFI-S113 11 38.8 8.4 173 37.3 8.2 100PFI-S114 11 37.8 9.2 132 38.4 7.8 94PFI-S115 11 39.4 8.1 212 34.4 8.5 117
Table 2.17Spring 2007 Pilot Form Score Summaries by Ethnicity and Test Form -
Functional Independence Science
TEST FORM GradeWhite Black
Mean SD N Mean SD NPFI-S51 5 33.6 6.9 343 30.1 7.5 127PFI-S52 5 33.8 7.0 159 31.4 5.7 54PFI-S53 5 34.1 6.9 188 29.3 7.5 76PFI-S54 5 31.4 6.6 163 28.3 6.6 111PFI-S55 5 31.6 6.0 174 28.9 5.5 57PFI-S81 8 38.1 8.0 336 32.9 7.1 187PFI-S82 8 35.5 7.3 170 29.7 6.1 70PFI-S83 8 37.1 7.1 160 33.5 6.7 74PFI-S84 8 33.1 7.9 228 27.8 6.9 69PFI-S85 8 35.1 7.5 194 31.7 6.6 81PFI-S111 11 39.5 8.0 363 34.6 8.0 86PFI-S112 11 40.8 8.6 210 32.6 8.9 76PFI-S113 11 39.3 8.3 205 33.8 7.3 58PFI-S114 11 39.3 7.9 171 32.7 9.4 38PFI-S115 11 38.7 8.2 235 34.2 9.0 78

MI-ACCESS P/SI/FI Science Technical RepoRT | 2 0 0 7 - 2 0 0 8 | 2 9
FI DIF Analysis
Winsteps was used to conduct DIF analysis for FI Science items for gender (Female v. Male) and race (White v. Black). The DIF contrast values computed by Winsteps are an estimate of the Log-Odds of item performance conditioned on ability, which is equivalent to the Mantel-Haenzel DIF size. For each DIF contrast, a t-statistic was computed (DIF Contrast / SE) with an associated p-value, equivalent to the Mantel-Haenzel significance test.
Approximately 10% of the piloted items were flagged for potential race bias. Similar proportions of items were flagged for potential gender bias. As would be expected due to the Mantel-Haenzel pro-cedure used, comparable numbers of items were flagged for potential bias for and against each ana-lyzed group. A summary of DIF results is reported in Table 2.18.
Table 2.18Number and Percent of Items Statistically Flagged for DIF in the Spring 2007 Pilot
GradeNo
Statistical DIF
Group Statistically Favored
Female Male White Black
Count
5Gender 176 6 6
Race 166 15 7
8Gender 203 7 12
Race 196 15 11
11Gender 201 13 16
Race 214 12 4
Percent
5Gender 94% 3% 3%
Race 88% 8% 4%
8Gender 91% 3% 5%
Race 88% 7% 5%
11Gender 87% 6% 7%
Race 93% 5% 2%
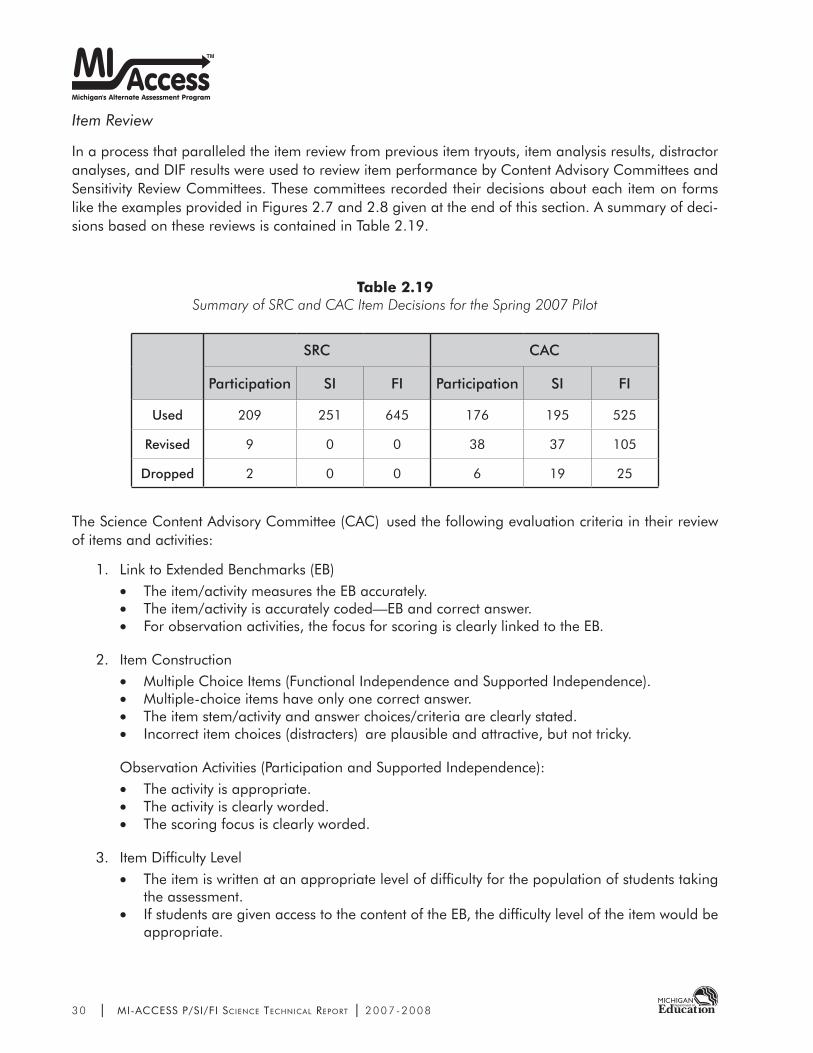
3 0 | MI-ACCESS P/SI/FI Science Technical RepoRT | 2 0 0 7 - 2 0 0 8
Item Review
In a process that paralleled the item review from previous item tryouts, item analysis results, distractor analyses, and DIF results were used to review item performance by Content Advisory Committees and Sensitivity Review Committees. These committees recorded their decisions about each item on forms like the examples provided in Figures 2.7 and 2.8 given at the end of this section. A summary of deci-sions based on these reviews is contained in Table 2.19.
Table 2.19Summary of SRC and CAC Item Decisions for the Spring 2007 Pilot
SRC CAC
Participation SI FI Participation SI FI
Used 209 251 645 176 195 525
Revised 9 0 0 38 37 105
Dropped 2 0 0 6 19 25
The Science Content Advisory Committee (CAC) used the following evaluation criteria in their review of items and activities:
1. Link to Extended Benchmarks (EB)The item/activity measures the EB accurately.•The item/activity is accurately coded—EB and correct answer.•For observation activities, the focus for scoring is clearly linked to the EB.•
2. Item Construction Multiple Choice Items (Functional Independence and Supported Independence).•Multiple-choice items have only one correct answer.•The item stem/activity and answer choices/criteria are clearly stated.•Incorrect item choices (distracters) are plausible and attractive, but not tricky. •
Observation Activities (Participation and Supported Independence):The activity is appropriate. •The activity is clearly worded.•The scoring focus is clearly worded. •
3. Item Difficulty LevelThe item is written at an appropriate level of difficulty for the population of students taking •the assessment.If students are given access to the content of the EB, the difficulty level of the item would be •appropriate.

MI-ACCESS P/SI/FI Science Technical RepoRT | 2 0 0 7 - 2 0 0 8 | 3 1
4. Artwork Is the artwork needed to answer the question?•
5. Adult Life Context Is the adult life context for the item coded correctly? •
Daily living skills (D)o – refers to those activities that adults carry out every day such as making meals, carrying out financial transactions (making purchases) and responsibilities (paying bills), doing laundry, maintaining a home and personal hygiene, planning social activities, etc.Community experience (C)o – refers to the quality of interaction with his/her sur-roundings, including people, places, and things. These are activities that students engage in outside of school/home setting or in locations within their community, such as banking, shopping, accessing transportation, developing satisfying rela-tionships with others, interacting with service providers, and participating in recre-ation and leisure activities.Employment (E)o – refers to skills and knowledge students must have to accom-plish post-graduation goals, such as finding and maintaining paid employment to achieve economic independence. Also includes supporting activities that are carried out less frequently such as filing taxes, registering to vote, renting a home, accessing medical services, etc.
The Sensitivity Review Committee employed the following evaluative criteria in their review of items. A biasing element is any aspect of language content, verbal or non-verbal-considered within the larger context in which it appears – which might reasonably be assumed to create or reinforce in a student: (1) A prejudice against a group of people; (2) A gratuitous stereotype of a group of people; or (3) Val-ues contrary to current notion of equality and equity among groups of people.
This procedure centers on an examination of materials for evidence of biasing elements. In order to make the procedure useful, types of bias and groups of people must be specified.
1. Stereotypes. These biasing elements which fail to take note of a wide range of differences among individual members of a group or, conversely, which express the notion that all or nearly all group members are the same in some way when they are not. Five kinds of stereotyping, including an Other category are:a. Occupational Roles. Examples include: female secretaries; male bosses; minority-group
maids and janitors; white technicians; Chinese laundry-workers; white, male doctors; male barbers; female nurses; man-sized job; women’s work; fireman instead of fire-fighter and mailman instead of mail carrier; and notions contrary to the fact that people with disabilities work in almost all job categories.
b. Family/School Roles. Examples include expressions stating or implying: fathers are the breadwinners; mothers are the homemakers; all families have a father, mother, brother and little sister; boys play football while girls skip rope; old maid school teachers; principals are males; people with disabilities do not take part in fun and games at home or in school; etc.
c. Personality Traits. Examples include notions that: fat men are jolly; blondes are dumb; Mexican people are lazy; Jewish people are stingy; women are flighty; men are steady; Asian people are studious; people with epilepsy are dangerous; little girls are sweet; little boys are ornery; and mentally impaired persons are disruptive.

3 2 | MI-ACCESS P/SI/FI Science Technical RepoRT | 2 0 0 7 - 2 0 0 8
d. Physical Characteristics/Appearance. Examples include: men are strong; women are weak; Chinese people are short; Jewish people have large noses; Black people have thick lips; All black people have the same skin color; All white people are blue-eyed; women wear dresses; visually impaired people are clumsy; farmers wear torn straw hats and chew on a stem of grass; fat people are unsuited for certain jobs when they are not; ugly people should not have jobs where they meet the public; all people with disabilities are in wheelchairs or need help getting from one place to another; lepers are sinners; and visually impaired people make good musicians.
e. Other Stereotypes. Some expressions may connect two groups in ways which tend to stereotype both. Examples include: Asian Indians are Hindus; and Southerners are Baptists.
No materials should reinforce stereotypes. The McGraw-Hill Guidelines for Bias-free Publishing defines a stereotype as “an image formed by ascribing certain characteristics – physical, cultural, personal, occupational, historical – to all members of a group. It is based on some custom or practice, which it isolates and exaggerates. Because it is a standardized image, a stereotype assimilates the individual to the group, making recognition of individuality difficult; it is inaccurate because it oversimplifies. It reinforces preconceived estimations of people, whether positive or negative, and insulates the reader or viewer from the real person or group.”
When trying to decide whether text or illustrations rely on stereotypes in portraying people from minority groups, ask questions like the following:
a. Does the illustration or text isolate or exaggerate particular physical traits?b. Does the dress of characters reinforce stereotypical perceptions?c. Are particular personality traits emphasized as representative?d. Is any group linked or associated with a single occupation, activity, or lifestyle?e. Do historical discussions or discussion of cultural backgrounds oversimplify the beliefs and
values of the people portrayed?
2. Erroneous Group Representation. This is a possible biasing element when two or more groups are implied or specified.a. Under-representation refers to the absence of a group when the context suggests it should
be present, or to the group being present but treated as insignificant. Examples include: omission of a racial group when depicting the people of a large city; a picture showing a welding class of all males and a home economics class of all females; and omission of people with obvious disabilities from everyday activities (e.g., work, play, entertainment, church, and school).
b. Segregation refers to describing in words or illustration an artificial separation of one group from another. Examples include: showing a classroom with equal numbers of black and white students, intermingled male and female students but with black students on one side of the group and white students on the other; or a group with the races intermingled but the males and females on opposite sides of the group (however, it would be natural to separate males and females in a choir because of the need to have voices grouped by range); people with disabilities in a group of specific seats; and signs or arrows, or both, directing people with disabilities around specific barriers such as steps, doorways, restrooms, (i.e., all physical facilities should be shown as accessible to them).

MI-ACCESS P/SI/FI Science Technical RepoRT | 2 0 0 7 - 2 0 0 8 | 3 3
3. Controversial MaterialHighly controversial or emotionally charged material should be included in tests only when it is relevant to what is being tested; a balance of points of view on the subject is presented; and/or when students have the opportunity to respond to the material (as in an essay or constructed-response assessment). Highly controversial materials in a multiple-choice test may imply that there are “right answers” to the subject and do not provide an opportunity for students to respond to those materials in an interactive mode.If controversial materials are used, the questions and items should not trivialize the content. Students should have an opportunity to respond in a constructed response format, and the scoring rubrics should be designed in a way to honor diverse interpretations of the materials.
A social studies or history test may need to include potentially controversial materials that are relevant to what is being assessed; a reading test can usually achieve its objectives without using such materials (see “contextual concerns,” below).
4. Contextual Concerns
Potentially sensitive materials must sometimes be used to achieve the purpose of the assessment, as in the following situations.
a. Historical Context: In testing students’ knowledge of history or in a reading test based on a historical reading selection, it is often desirable to use authentic documents written during a time when social values were very different from those today. Or, a test may need to contain a passage dealing with a historical event or one written during an earlier period. The McGraw-Hill Guidelines state, “In materials dealing with history, accuracy should be the goal, and assumptions about present-day society and politics should not be imposed upon the past. Situation involving members of minority groups should be accurately portrayed.”
b. Literary Context: Again, it is often desirable to use selections from authentic literature to assess student’s reading abilities. Such works may have problems, ranging from the use of the word man to represent all people to the use of words considered offensive to modern readers (Mark Twain’s use of the word nigger in The Adventures of Huckleberry Finn, for example). As the McGraw-Hill Guidelines state, “We realize that the language of literature cannot be prescribed.” Materials must, therefore, be evaluated in light of the overall purpose of the test and the Assessment Frameworks specifications. It may be possible to deal with certain problems in terms of a framing statement, a footnote, or even an open-ended question asking the student to recognize and respond to the problem.
c. Legal Domain: Materials drawn from legal sources may sometimes deal with sensitive areas. For example, real estate tests may contain references to federal, state, or local laws governing discrimination in the mortgage rights of EEO classes.
d. Health and Social Sciences Domain: Certain examinations in these domains (including health professions, social work, and civil service) require knowledge of information that may be considered sensitive in other contexts. For example, in nursing tests it may be necessary to test one’s knowledge of the predominance of sickle-cell anemia among black people or Tay-Sachs disease among Jewish families. Social work and civil service require knowledge of how to approach problems and/or counsel people in a wide variety of social and cultural contexts. Inclusion of potentially sensitive material depends on

3 4 | MI-ACCESS P/SI/FI Science Technical RepoRT | 2 0 0 7 - 2 0 0 8
the content of the entire test. Given an appropriate context, use of certain material may be justifiable. It is important to recognize that many subject-matter tests must include information and concepts that have a great potential for raising sensitivity issues. The test assembler and the sensitivity reviewers are responsible for working together to develop test material that covers the necessary subject matter (such as slavery, the Japanese internment during World War II, ethnic components of social problems) in a theoretically balanced, sensitive, and objective manner.
5. Elitism, Ethnocentricity, and Related Problems
To eliminate concepts, words, phrases, and or examples that may upset or otherwise disadvantage a test taker, every effort is made not to include expressions that might be more familiar to members of a particular social class or ethnic group than the general population, such as “soul food,” and “trust fund,” unless they are defined or knowledge of them is relevant to the purpose of the test. Words and sentence constructions that could have different meaning to different ethnic or geographic groups must be avoided. Care must also be taken to assess the appropriateness of dialect, slang, and non-English words and phrases such as “bairn,” “stickball,” and “maven,” which tends to be more familiar to certain ethnic, geographic, or other subgroups of English speakers.

MI-ACCESS P/SI/FI Science Technical RepoRT | 2 0 0 7 - 2 0 0 8 | 3 5
1
MI-
Acc
ess
Fu
nct
ion
al In
dep
en
den
ce C
on
ten
t A
dvis
ory
Co
mm
itte
e
Sci
en
ce I
tem
Revie
w M
eeti
ng
Ju
ly 1
9-2
0,
20
06
REV
IEW
ER
NA
ME:
__
__
__
__
__
__
__
__
__
__
__
__
__
__
__
__
_
D
AT
E _
__
__
__
__
__
__
__
__
__
A
SS
ES
SM
EN
T T
YP
E (
P,
SI,
or
FI)
_
__
__
__
__
__
__
__
__
__
__
G
RA
DE L
EV
EL (
E,
M,
or
H)
_
__
__
__
__
__
__
__
__
__
D
IREC
TIO
NS
:
Ple
ase
use
th
e r
evie
w s
heets
to
rate
each
ite
m a
cco
rdin
g t
o t
he f
oll
ow
ing
5 c
rite
ria a
nd
th
en
make a
fin
al re
com
men
dati
on
to
use
(U
) re
vis
e (
R),
or
do
no
t u
se (
DN
U)
each
ite
m.
Ple
ase
refe
r to
th
e I
tem
Evalu
ati
on
Cri
teri
a d
ocu
men
t fo
r an
exp
lan
ati
on
of
the r
ati
ng
cr
iteri
a.
#1
A
ccu
rate
Lin
k t
o E
B/
C
orr
ect
Co
de
#2
A
ccu
rate
It
em
C
on
stru
ctio
n
#3
A
pp
rop
riate
It
em
D
iffi
cult
y
Level
#4
A
rtw
ork
is
need
ed
#5
C
orr
ect
A
du
lt L
ife
Co
nte
xt
Co
de
Fin
al
Reco
mm
en
dati
on
:
Use
U,
Revis
e R
, o
r D
NU
?
Co
mm
en
ts
TA
SA
ID
#
3307
4
yes
no
ye
s
no
ye
s
no
ye
s
no
ye
s
no
U
R
D
NU
L
.OR
.e.F
I.E
B01
.A
yes
no
ye
s
no
ye
s
no
ye
s
no
ye
s
no
U
R
D
NU
yes
no
ye
s
no
ye
s
no
ye
s
no
ye
s
no
U
R
D
NU
yes
no
ye
s
no
ye
s
no
ye
s
no
ye
s
no
U
R
D
NU
yes
no
ye
s
no
ye
s
no
ye
s
no
ye
s
no
U
R
D
NU
yes
no
ye
s
no
ye
s
no
ye
s
no
ye
s
no
U
R
D
NU
yes
no
ye
s
no
ye
s
no
ye
s
no
ye
s
no
U
R
D
NU
yes
no
ye
s
no
ye
s
no
ye
s
no
ye
s
no
U
R
D
NU
Figure
2.7
. Conte
nt
Advi
sory
Com
mitte
e Rat
ing F
orm

3 6 | MI-ACCESS P/SI/FI Science Technical RepoRT | 2 0 0 7 - 2 0 0 8
Figure
2.8
. Sen
sitivi
ty R
evie
w C
om
mitte
e Rat
ing F
orm
1
M
I-A
ccess
Fu
nct
ion
al In
dep
en
den
ce S
en
siti
vit
y R
evie
w C
om
mit
tee
Sci
en
ce I
tem
Revie
w M
eeti
ng
Ju
ly 1
7-1
8,
20
06
REV
IEW
ER
NA
ME:
__
__
__
__
__
__
__
__
__
__
__
__
__
__
__
__
_
D
AT
E _
__
__
__
__
__
__
__
__
__
A
SS
ES
SM
EN
T T
YP
E (
P/
SI
or
FI)
_
P E
art
h S
cien
ce –
Ele
men
tary
__
__
DIR
EC
TIO
NS
:
Ple
ase
use
th
e r
evie
w s
heets
to
rate
each
ite
m a
cco
rdin
g t
o t
he f
oll
ow
ing
8 c
rite
ria a
nd
th
en
make a
fin
al re
com
men
dati
on
to
use (
U)
revis
e (
R),
or
do
no
t u
se (
DN
U)
each
ite
m.
P
lease
refe
r to
th
e S
en
siti
vit
y R
evie
w C
rite
ria? d
ocu
men
t fo
r an
exp
lan
ati
on
of
the r
ati
ng
cri
teri
a.
#1
Ste
reo
typ
es?
#2
Err
on
eo
us
Gro
up
R
ep
rese
nta
tio
n?
#3
Co
ntr
overs
ial
Mate
rial?
#4
Co
nte
xtu
al
Co
nce
rns?
#5
Eliti
sm,
Eth
no
cen
tris
m,
Etc
.?
#6
Ap
pro
pri
ate
A
rtw
ork
?
#7
A
A
pp
rop
riate
fo
r A
cco
mm
od
ate
d
Vers
ion
s?
#7
B
N
eed
B
rail
le
Co
mp
an
ion
It
em
?
Fin
al
Reco
mm
en
dati
on
:
Use
U,
Revis
e R
, o
r D
NU
?
Co
mm
en
ts
TA
SA
ID
#
1113
1
yes
no
ye
s
no
ye
s
no
ye
s
no
ye
s
no
ye
s
no
ye
s
no
yes
n
o U
R
D
NU
1113
2
yes
no
ye
s
no
ye
s
no
ye
s
no
ye
s
no
ye
s
no
ye
s
no
yes
n
o U
R
D
NU
1113
3
yes
no
ye
s
no
ye
s
no
ye
s
no
ye
s
no
ye
s
no
ye
s
no
yes
n
o U
R
D
NU
1110
1
yes
no
ye
s
no
ye
s
no
ye
s
no
ye
s
no
ye
s
no
ye
s
no
yes
n
o U
R
D
NU
1110
2
yes
no
ye
s
no
ye
s
no
ye
s
no
ye
s
no
ye
s
no
ye
s
no
yes
n
o U
R
D
NU
1113
4
yes
no
ye
s
no
ye
s
no
ye
s
no
ye
s
no
ye
s
no
ye
s
no
yes
n
o U
R
D
NU
1113
5
yes
no
ye
s
no
ye
s
no
ye
s
no
ye
s
no
ye
s
no
ye
s
no
yes
n
o U
R
D
NU

MI-ACCESS P/SI/FI Science Technical RepoRT | 2 0 0 7 - 2 0 0 8 | 3 7
2.5 2007-2008 Operational Administration
Form Design
Based on the results of the spring 2007 Pilot Administration, several modifications were made to the booklet blueprints. Core items were selected based on the review of Sensitivity Review Committees and Content Advisory Committees. Items that best reflected the item specifications and the intent of the ex-tended grade-level content expectations (EGLCEs) assessable at the state level were selected. Selected core items:
1. are free of racial/gender bias;2. are of average difficulty for items that assess a particular EGLCE based on p-value (.50+) and
point biserial (.30+);3. reflect a range of item difficulty;4. are free of biasing elements as outlined by the OEAA;5. meet sensitivity criteria as outlined by the OEAA;6. meet APH guidelines for the visually impaired; and7. reflect a balance of item and activity content and format.
The forms were built so that the overall difficulty and average point biserial values across forms within a grade were equal. Each form has designated field-test item positions.
Emergency forms for each subject at each grade were also designed in the event that test administra-tion may have to be repeated outside the standard assessment window or to accommodate potential security breaches. Horizontal linking items were used in the designated field-test item positions for the Emergency forms to facilitate equated scaling (raw score to scale score conversion tables) under the condition that Emergency forms may never be administered or may be administered to very small numbers of students.
The booklet blueprints were reviewed by the TAC and are presented in Tables 2.20 to 2.22.

3 8 | MI-ACCESS P/SI/FI Science Technical RepoRT | 2 0 0 7 - 2 0 0 8
Tab
le 2
.20
Scie
nce
Blue
prin
t for
Par
ticip
atio
n
Part
icip
atio
n Sc
ienc
e Bl
uepr
int:
G
rade
s 5,
8,
and
11
Gra
de 5
Gra
de 8
Gra
de 1
1
Stra
nd (
# o
f Ite
ms)
Stan
dard
Num
ber
Cor
e Ite
ms
Num
ber
Embe
dded
Fi
eld
Test
Ite
ms
Num
ber
Cor
e Ite
ms
Num
ber
Embe
dded
Fi
eld
Test
Ite
ms
Num
ber
Cor
e Ite
ms
Num
ber
Embe
dded
Fi
eld
Test
Ite
ms
Con
stru
ctin
g &
Refl
ectin
gC
onst
ruct
ing
10
10
10
Refle
ctin
g1
01
01
0
Life
Sci
ence
Cel
ls1
01
01
0O
rgan
izat
ion
40
44
44
Her
edity
00
00
00
Evol
utio
n0
00
00
0Ec
osys
tem
s0
00
00
0
Phys
ical
Sci
ence
Mat
ter
& E
nerg
y1
61
41
5
Cha
nges
in M
atte
r0
00
00
0
Mot
ion
of O
bjec
ts2
22
12
1
Wav
es2
12
22
0
Eart
h Sc
ienc
e
Geo
sphe
re1
01
21
2H
ydro
sphe
re1
31
21
2A
tmos
pher
e1
31
01
1So
lar
Syst
em0
00
00
0TO
TAL
15
15
15
15
15
15
5 p
er f
orm
5 p
er f
orm
5 p
er f
orm

MI-ACCESS P/SI/FI Science Technical RepoRT | 2 0 0 7 - 2 0 0 8 | 3 9
Tab
le 2
.21
Scie
nce
Blue
prin
t for
Sup
porte
d In
depe
nden
ce
Part
icip
atio
n Sc
ienc
e Bl
uepr
int:
G
rade
s 5,
8,
and
11
Gra
de 5
Gra
de 8
Gra
de 1
1
Stra
nd (
# o
f Ite
ms)
Stan
dard
Num
ber
Cor
e Ite
ms
Num
ber
Embe
dded
Fi
eld
Test
Ite
ms
Num
ber
Cor
e Ite
ms
Num
ber
Embe
dded
Fi
eld
Test
Ite
ms
Num
ber
Cor
e Ite
ms
Num
ber
Embe
dded
Fi
eld
Test
Ite
ms
Con
stru
ctin
g &
Refl
ectin
gC
onst
ruct
ing
10
10
10
Refle
ctin
g1
01
01
0
Life
Sci
ence
Cel
ls1
01
01
0O
rgan
izat
ion
52
53
52
Her
edity
00
00
00
Evol
utio
n0
00
00
0Ec
osys
tem
s1
11
01
1
Phys
ical
Sci
ence
Mat
ter
& E
nerg
y1
31
31
3
Cha
nges
in M
atte
r0
00
00
0
Mot
ion
of O
bjec
ts1
31
31
3
Wav
es1
31
31
0
Eart
h Sc
ienc
e
Geo
sphe
re1
01
01
2H
ydro
sphe
re2
32
32
2A
tmos
pher
e1
01
01
2So
lar
Syst
em1
01
01
0TO
TAL
17
15
17
15
17
15
5 p
er f
orm
5 p
er f
orm
5 p
er f
orm
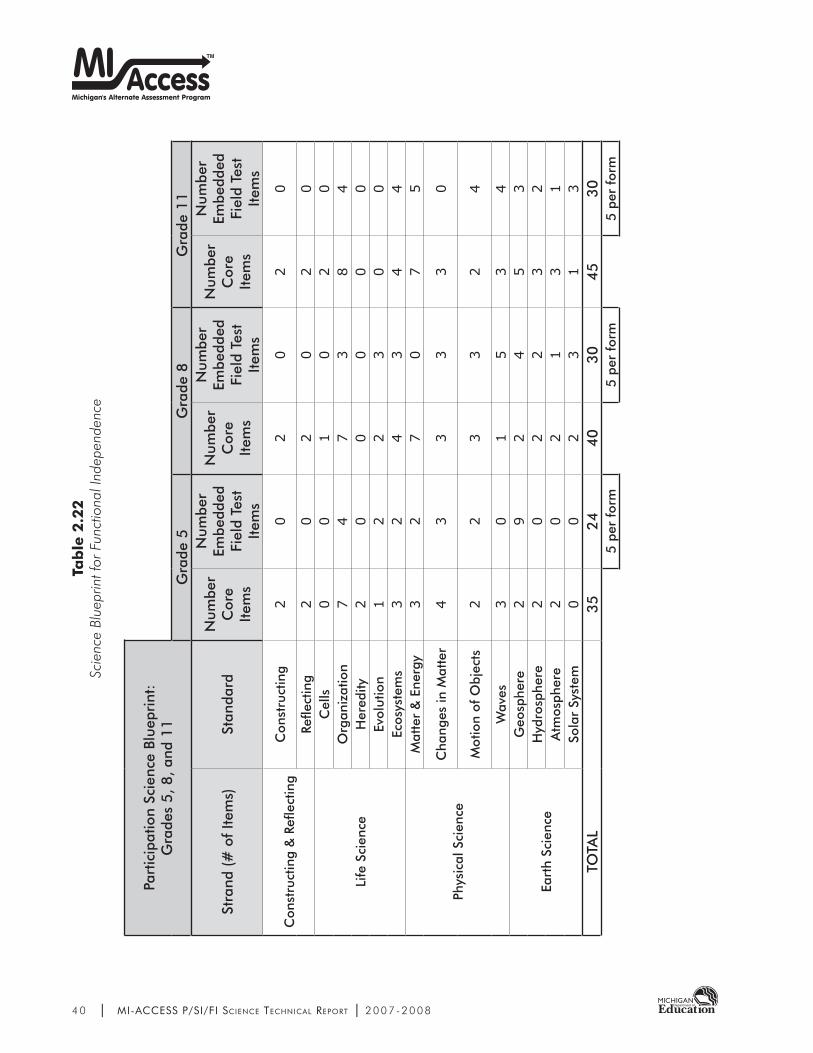
4 0 | MI-ACCESS P/SI/FI Science Technical RepoRT | 2 0 0 7 - 2 0 0 8
Tab
le 2
.22
Scie
nce
Blue
prin
t for
Fun
ctio
nal I
ndep
ende
nce
Part
icip
atio
n Sc
ienc
e Bl
uepr
int:
G
rade
s 5,
8,
and
11
Gra
de 5
Gra
de 8
Gra
de 1
1
Stra
nd (
# o
f Ite
ms)
Stan
dard
Num
ber
Cor
e Ite
ms
Num
ber
Embe
dded
Fi
eld
Test
Ite
ms
Num
ber
Cor
e Ite
ms
Num
ber
Embe
dded
Fi
eld
Test
Ite
ms
Num
ber
Cor
e Ite
ms
Num
ber
Embe
dded
Fi
eld
Test
Ite
ms
Con
stru
ctin
g &
Refl
ectin
gC
onst
ruct
ing
20
20
20
Refle
ctin
g2
02
02
0
Life
Sci
ence
Cel
ls0
01
02
0O
rgan
izat
ion
74
73
84
Her
edity
20
00
00
Evol
utio
n1
22
30
0Ec
osys
tem
s3
24
34
4
Phys
ical
Sci
ence
Mat
ter
& E
nerg
y3
27
07
5
Cha
nges
in M
atte
r4
33
33
0
Mot
ion
of O
bjec
ts2
23
32
4
Wav
es3
01
53
4
Eart
h Sc
ienc
e
Geo
sphe
re2
92
45
3H
ydro
sphe
re2
02
23
2A
tmos
pher
e2
02
13
1So
lar
Syst
em0
02
31
3TO
TAL
35
24
40
30
45
30
5 p
er f
orm
5 p
er f
orm
5 p
er f
orm

MI-ACCESS P/SI/FI Science Technical RepoRT | 2 0 0 7 - 2 0 0 8 | 4 1
Results
Following the completion of the first full statewide administration of MI-Access, analyses of statewide performance were conducted. Table 2.23 shows the total number of students at each grade and the percent of students at each of the three performance levels and at Attained or above. Table 2.24 con-tains the participation counts by gender and special population, and Table 2.25 contains the participa-tion counts by race/ethnicity. Raw score summary statistics are given in Table 2.26 for gender and in Table 2.27 for White, Black, and Other.
Table 2.232007-2008 Percent of Students at each Performance Level
Grade Total N Emerging Attained SurpassedAttained or
Above
Participation
5 264 41.3 46.2 12.5 58.78 280 45.7 40.7 13.6 54.311 296 53.4 31.8 14.9 46.7
Supported Independence
5 480 34.8 42.1 23.1 65.28 547 33.8 40.0 26.1 66.111 576 23.1 60.9 16.0 76.9
Functional Independence
5 2127 46.3 27.2 26.5 53.78 2158 49.3 23.8 27.0 50.811 1875 37.1 33.8 29.1 62.9

4 2 | MI-ACCESS P/SI/FI Science Technical RepoRT | 2 0 0 7 - 2 0 0 8
Table 2.242007-2008 N-Counts by Gender and by Special Group
Grade Male Female Missing ELLStandard
AccommodationsTotal
Participation
5 158 106 0 NA NA 2648 177 103 0 NA NA 28011 183 113 0 NA NA 296
Supported Independence
5 326 154 0 NA NA 4808 380 167 0 NA NA 54711 353 223 0 NA NA 576
Functional Independence
5 1344 783 0 69 1709 21278 1383 775 0 48 1160 215811 1143 732 0 42 718 1875
NA = Data Not Available

MI-ACCESS P/SI/FI Science Technical RepoRT | 2 0 0 7 - 2 0 0 8 | 4 3
Tab
le 2
.25
2007
-200
8 N
-Cou
nts
by E
thni
city
Gra
de
Am
eric
an
Indi
an o
r A
lask
an
Nat
ive
Asi
an o
r Pa
cific
Is
land
er
Blac
k,
Not
of
His
pani
c O
rigi
n
His
pani
c
Whi
te,
Not
of
His
pani
c O
rigi
n
Mul
ti-ra
cial
Oth
erU
nkno
wn
Mis
sing
Tota
l
Part
icip
atio
n
5*
*69
1617
2*
00
026
48
**
71*
187
**
*0
280
11*
*84
1119
10
0*
029
6
Supp
orte
d In
depe
nden
ce
5*
*12
523
321
**
00
480
8*
1716
715
341
*0
*0
547
11*
*14
519
401
*0
*0
576
Func
tiona
l Ind
epen
denc
e
523
1760
211
913
4021
**
021
278
2626
685
6913
3417
*0
021
5811
1913
547
6512
18*
**
018
75*<
10 s
tude
nts
asse
ssed

4 4 | MI-ACCESS P/SI/FI Science Technical RepoRT | 2 0 0 7 - 2 0 0 8
Table 2.262007-2008 Operational Form Score Summaries by Gender
GradeFemale Male
Mean SD N Mean SD N
Participation
5 33.48 30.57 106 38.41 28.75 1588 34.95 31.92 103 35.84 29.06 17711 38.01 31.85 113 46.4 31.14 183
Supported Independence
5 44.93 18.17 154 43.60 19.58 3268 44.49 16.58 167 43.34 16.89 38011 45.34 17.42 223 45.11 16.76 353
Functional Independence
5 19.73 5.14 783 20.38 5.39 13448 20.13 5.35 775 21.41 5.94 138311 22.39 6.24 732 24.49 7.53 1143
Table 2.272007-2008 Operational Form Score Summaries by Ethnicity
GradeWhite Black Other
Mean SD N Mean SD N Mean SD N
Participation
5 37.23 29.15 172 35.23 31.10 69 34.09 28.66 238 37.41 30.54 187 34.01 29.15 71 24.27 27.61 22
11 45.22 31.3 191 41.7 33.27 84 30.76 25.32 21
Supported Independence
5 45.87 18.50 321 39.71 20.29 125 42.50 18.36 348 45.12 16.58 341 41.49 17.18 167 40.56 15.82 39
11 45.87 16.77 401 43.79 17.85 145 43.03 15.95 30
Functional Independence
5 20.69 5.34 1340 18.97 5.13 602 19.92 5.04 1858 22.06 5.77 1334 18.82 5.17 685 20.83 5.63 139
11 25.32 7.18 1218 20.18 5.83 547 22.66 5.83 110

MI-ACCESS P/SI/FI Science Technical RepoRT | 2 0 0 7 - 2 0 0 8 | 4 5
Field Test Item Analysis
Item analysis, distractor analysis, and DIF analysis (for FI) were completed on all field-test items for each subject at each grade level. The field-test item analyses reports were generated in the same way as done following the Pilot analysis. The same set of analyses was completed on all operational core items to provide operational statistical information for the item bank. Summary of FI DIF analysis of field test items is reported in Table 2.28.
Table 2.28Field Test DIF Summary by Grade
Grade5 8 11
Total Number of Items 46 70 74Number of Field Test Items 11 30 29
Statistically Flagged for Gender DIF 4 5 3Statistically Flagged for Race DIF 4 6 7

4 6 | MI-ACCESS P/SI/FI Science Technical RepoRT | 2 0 0 7 - 2 0 0 8
CHAPTER 3
TEST ADMINISTRATION, SCORING, SCALING & EQUATING
3.1 Background
Decision-making Tools
To help IEP Teams decide which state assessment a student should take, the MDE developed:
Draft Guidelines for Determining Participation in State Assessment for Students with Disabilities •(MDE, 2006a);
a matrix matching student levels of independence, characteristics, curriculum, and instruction with •possible state-level assessments;
a decision-making flow chart (see Figure 3.1); and•
a decision-making checklist.•
These materials—all of which were designed to ensure that students participate in the correct state-level assessment—are available online at www.mi.gov/mi-access. Some of the tools have also been made available in training materials and in The Assist, a newsletter published by the MI-Access staff.
Training
To ensure that the assessments are administered correctly, MI-Access hosts annual training conferences across the state. In the past, the conferences had typically included a full-day training of the trainers session, which relied on a 1½ hour training video (showing how to conduct observations) and a binder of written training materials. In recent years, the conferences have evolved to include more detailed concurrent sessions for those previously trained.
In addition, several online learning programs have been developed to train the field on eligibility requirements for participation in MI-Access assessments and how to administer MI-Access assessments effectively.
Additional Tools
Furthermore, the MDE has
helped revise and update the • Individualized Education Program Team Manual to help special edu-cation teams make more informed decisions about MI-Access;
published a bi-monthly newsletter called • The Assist, which informs a wide audience about assessing students with disabilities at the state level;
developed a District MI-Access Coordinator Listserv to distribute time-sensitive information on MI-•Access;

MI-ACCESS P/SI/FI Science Technical RepoRT | 2 0 0 7 - 2 0 0 8 | 4 7
published an annual manual that provides detailed instructions on what to do before, during, and •after administering the MI-Access assessments;
produced calendars, brochures, and other communication tools to continue to inform those in-•volved with the assessment program about proper administration; and
published an annual handbook, which explains how to interpret and use MI-Access results.•

4 8 | MI-ACCESS P/SI/FI Science Technical RepoRT | 2 0 0 7 - 2 0 0 8
Figure 3.1IEP Team State Assessment Decision-Making Flow Chart
IEP Team State Assessment Decision-Making Flow Chart
Is the studentin a grade level
assessed bythe state?
NO
MI-ACCESSMichigan’s AlternateAssessment Program
Determine the student's level ofIndependence (Full, Functional,
Supported, or Participation).
Michigan EducationalAssessment Program
In which stateassessment will thestudent participate?
MEAP
Will the studenttake all of the MEAP assessments required
at this level?
YES
NO
Record the decisionin the student’s IEP.
Determine whataccommodationsare needed for
each content area.
YES
Are the accommodations
standard?
CONSEQUENCE:
The student will count as “assessed”
for NCLB.
CONSEQUENCE:
The student will count as “not assessed”
for NCLB.*
Does the student needassessment accommodations
in any contentareas ?
For each MEAP content area assessment the student is NOT taking,
indicate in the student’s IEP why not, as required by IDEA.
CONSEQUENCE:
Due to the NCLB 1% cap regulation, Functional Independence scores
may count as “not proficient”for AYP.
NOYES
YES
NO
Will the studenttake MI-Access Participation, Supported Independence, or
Functional Independence?
PARTICIPATION
Updated April 2006
FUNCTIONAL INDEPENDENCE
SUPPO
RTED
IN
DEPEN
DEN
CE
Record in the IEP thatno state assessmentsare given for the student’spresent grade level.
For those content areasindicate that the student will be assessed with
MI-Access Functional Independence and explain why that assessment is appropriate.

MI-ACCESS P/SI/FI Science Technical RepoRT | 2 0 0 7 - 2 0 0 8 | 4 9
3.2 Determining Participation in MI-Access
During IEP Team meetings, team members work collaboratively to determine which state-level assess-ment their students should take. They begin by asking: How independently will the student function as an adult? The guidelines for determining participation in state assessments for students with disabili-ties6 (MDE, 2006) include the following questions to help guide IEP Team deliberations.
1. Where will this student live and with what supports?2. In what daily activities will this student be involved and with what supports?3. In what community experiences will this student be involved and with what supports?4. What post-secondary educational opportunities will this student have and with what supports?5. In what environment will this student be employed and with what supports?
Students who are deemed eligible for MI-Access Participation have, or function as if they have, severe or profound cognitive impairment. “These students are expected to require extensive ongoing support in adulthood” (MDE, 2006, p.18).
Students who are deemed eligible for MI-Access Supported Independence have, or function as if they have, moderate cognitive impairment. “These students will require ongoing support in major life roles” (MDE, 2006, p. 18).
Students who are deemed eligible for MI-Access Functional Independence have, or function as if they have, mild cognitive impairment. “These students are capable of meeting their own needs and living successfully in their communities with minimal support from others” (MDE, 2006, p. 17).
3.3 Allowable Accommodations
The word “accommodation” is used to indicate that changes are made to what is considered the “stan-dardized” test condition. Accommodations are tools and procedures that provide fair and reasonable instructional and assessment access for students with disabilities and ELLs in the areas of presentation, response, timing, scheduling, setting, and linguistics. According to Tindal and Fuchs (1999) a test change is considered an accommodation if it does not alter the construct being measured, is based on individual need, and is effective for students who need the change and not effective for others.
The Standards (AERA, APA, & NCME, 1999) require that “all examinees be given a comparable op-portunity to demonstrate their standing on the construct(s) the test is intended to measure. Just treat-ment also requires such factors as appropriate testing conditions and equal opportunity to become familiar with the test format, practice materials, and so forth. Fairness also requires that all examinees be afforded appropriate testing conditions” (p.74).
The foundation of the MI-Access assessments were based on universal design principles; the premise that every child deserves to participate in assessment and that assessment results should not be affected by disability, gender, race, or English language ability. In addition, universally designed assessments aim to reduce the need for assessment accommodations by removing access barriers associated with the assessment themselves.
6 Standard 3.15. When using a standardized testing format to collect structured behavior samples, the domain, test de-sign, test specifications, and materials should be documented as for any other test. Such documentation should include a clear definition of the behavior expected of the test takers, the nature of the expected responses, and any materials or directions that are necessary to carry out the testing.

5 0 | MI-ACCESS P/SI/FI Science Technical RepoRT | 2 0 0 7 - 2 0 0 8
The need for assessment accommodations can be reduced if assessments are developed thought-fully and with the broad student assessment population clearly in mind. To that end, the APWT spent considerable time trying to define and understand the student population that would be participat-ing in MI-Access FI. Furthermore, it recommended that barriers be removed whenever possible, such as (1) using graphs or pictures only when necessary and accompanying them with verbal/textual descriptions, (2) eliminating distracting or purely decorative pictures, (3) designing the assessments to be administered in multiple, short sessions to reduce the need for extra breaks or extended time, and (4) allowing multiple access and response modes to further reduce the need for assessment accom-modations. At every turn, efforts to reduce barriers were explored to ensure that students would have every opportunity to participate fully and meaningfully in assessments (MDE, 2005b, p. 11).
Despite every effort to ensure that MI-Access assessments are accessible, it is understood that some students may still need assessment accommodations in order to participate fully and meaningfully in MI-Access. The use of allowable accommodations is based on individual student need and the students IEP indicates that they are appropriate for the student. In addition, allowable accommodations are used consistently by the student throughout curricular instruction during the school year – they reflect what the student routinely uses or how he or she routinely responds during instruction. Students who are deemed eligible for accommodations have their accommodations documented in the IEPs, 504 Service Plans, and student files.
Standard accommodations do not change what the specific assessment is measuring and therefore student’s assessed using standard accommodations are counted as assessed when calculating NCLB participation rates. A nonstandard assessment accommodation does change what the assessment is measuring and results in an invalid score. Hence, a student using a nonstandard assessment accom-modation will not count as being assessed when calculating NCLB participation rates. The following standard accommodations are used most often on the MI-Access Functional Independence assess-ments: audio versions, Braille and enlarged print, calculators, optional materials, readers, recording student responses, scribes, word processors, and time (MDE, 2005a).
In summer 2005, the SBE approved the “Assessment Accommodation Summary Table” which indicates what assessment accommodations are standard and nonstandard for MEAP and MI-Access. This sum-mary table can be found on the MI-Access Web page (www.mi.gov/mi-access).
3.4 Scoring Rubrics for Participation and Supported Independence
Each Participation and Supported Independence assessment activity is scored by two assessment ad-ministrators observing the activity at the same time. The MI-Access Participation scoring rubric is a 3-point scoring rubric. The MI-Access Supported Independence scoring rubric is a 2-point rubric. In January 2006, the TAC recommended that the PAA and SAA score for each item be added together in order to get a total score. Condition codes would count as zeros.
During the administration of each activity, the PAA and the SAA are instructed to circle the appropriate observation score for each item while they are observing the student. Each activity contains a scoring focus that describes what the student is required to demonstrate. The possible observation scores are shown in Tables 3.1 and 3.2 below.

MI-ACCESS P/SI/FI Science Technical RepoRT | 2 0 0 7 - 2 0 0 8 | 5 1
Table 3.1Participation Rubric
Score Point Definition
3 Responds correctly with no teacher assistance
2Responds correctly after teacher provides
verbal/physical cues
1Responds correctly after teacher provides physical assistance and/or
modeling, short of hand-over-hand assistance
Condition Code** or Zero Score Points
Definition
A Incorrect Response
B Resists/Refuses to participate
CAssessment administrator provides hand-over-hand assistance
and/or step-by-step directions
** All condition codes result in no points.
Table 3.2Supported Independence Rubric
Score Point Definition
2 Responds correctly with no teacher assistance
1Responds correctly after teacher provides
verbal/physical cues
Condition Code** or Zero Score Points
Definition
A Incorrect Response
B Resists/Refuses to participate
CAssessment administrator provides hand-over-hand assistance
and/or step-by-step directions
** All condition codes result in no points.
3.5 Reporting and Score Use
Several reports are generated that provide specific results of students and summaries of results across classrooms, schools, districts, and the state. These reports are presented in the 2007/2008 Handbook for Understanding, Interpreting, and Using MI-Access Results. In addition, school, district, and state results are provided on the MI-Access Information Center. To maintain student anonymity, certain re-ports are not provided for units with fewer than ten students within a given grade. The following types of reports are provided at each level as presented in Table 3.3. Samples of each report are provided in the Handbook Addendum.

5 2 | MI-ACCESS P/SI/FI Science Technical RepoRT | 2 0 0 7 - 2 0 0 8
Table 3.3MI-Access Reports by Level of Reporting
State Results Online
District School ClassOnline Only
Summary Reports X X X
Demographic Reports X X X
Item Analysis Reports X X X
Rosters X X X
Individual Student Reports X
Parent Reports X
District Comprehensive Reports*
X
ISD Comprehensive Reports X
*Available for Functional Independence assessments only.
3.6 Available Training and MI-Access Administrative Support
There are several resources and supporting materials for MI-Access.7
Each year, the MDE publishes a MI-Access Coordinator and Assessment Administrator Manual that provides general information about MI-Access as well as instructions for District and School MI-Access coordinators and assessment administrators.
Each fall and spring assessment window, the MDE delivers a Web cast to update the field on assess-ment administration procedures and other important MI-Access related issues.
The MI-Access contractor also staffs a hotline to which the field can direct questions and concerns re-garding the assessments via email or phone.
Finally, the MDE has created various online learning tools to assist the field with MI-Access administra-tion.
3.7 Scaling Background
Scoring, scaling, and equating are processes designed to improve score comparability and interpreta-tion.8 Scoring begins with test item responses that are assigned numeric values, a 0 or 1 for the typical multiple-choice item and 0 to 1, 2, or more points for constructed response items (e.g., essay scores). The item scores are combined as a summed total to obtain a raw score. Raw scores vary based on test length, item difficulty, etc. This requires a method to create scores that are more comparable.
7 Standard 6.9. Test documents should cite a representative set of the available studies pertaining to general and specific uses of the test.
8 Standard 4.1. Test documents should provide test users with clear explanations of the meaning and intended interpreta-tion of derived score scales, as well as their limitations.

MI-ACCESS P/SI/FI Science Technical RepoRT | 2 0 0 7 - 2 0 0 8 | 5 3
The process of placing scores from different forms of a test on a common scale is called equating. “The term equating is properly reserved only for score conversions derived for alternate forms of the same test. It is often useful, however, to compare scores from tests that cannot, in theory, be equated.” (AERA, APA, NCME, 1999, p. 52).
At the current time, only the FI assessment is employing a formal scaling and equating design.
3.8 Scaling and Equating
Winsteps 3.65 is used to complete all calibration tasks.
Scaling
MDE determined that the appropriate scales for MI-Access would be to locate the attained cut score at 2500 for grade 5, 2800 for grade 8 and 3100 for grade 11; each with a standard deviation of 25. This was accomplished through a linear conversion of the theta distribution to the scale score distribution (e.g., for grade 5, the theta associated with attained performance level was set to 2500). Once this conversion was completed, a raw score to scale score (through theta) conversion table was developed.
Calibrating Field-Test Items
Finally, the operational forms contained field-test items for which analysis was needed to facilitate item review. A Winsteps control file combined response files across forms by organizing items such that core items appear in the first set of item columns and all field test items follow, where the core items are anchored based on the previous analyses for scaling core-item total scores. Results were reviewed for consistency with classical test statistics results and item data-review tables were created with distractor analyses for the CAC and SRC item review meeting (identical to those used following the spring 2007 Pilot).
Future Equating
All test forms were designed to facilitate horizontal equating across forms within grade over time. This is facilitated by employing common item anchoring, following the test blueprint to achieve content rep-resentation within the anchor items.9 There are 8 common items at grade 5, and 10 common items at grades 8 and 11.
9 Standard 4.13. In equating studies that employ an anchor test design, the characteristics of the anchor test and its simi-larity to the forms being equated should be presented, including both content specifications and empirically determined relationships among test scores. If anchor items are used, as in some IRT-based and classical equating studies, the representativeness and psychometric characteristics of anchor items should be presented.

5 4 | MI-ACCESS P/SI/FI Science Technical RepoRT | 2 0 0 7 - 2 0 0 8
CHAPTER 4
STANDARD SETTING
4.1 Background
Standard setting is an essential component in the design of a statewide assessment program, which is part of a broader educational accountability system. Accountability systems hold educational pro-grams accountable for increasing the number of students whose test scores meet or exceed prescribed standards.
Standards exist in many forms, but most fall into two broad categories of content standards and per-formance standards. For MI-Access, the content standards are the Performance Expectations (PEs) de-scribed in Addressing Unique Educational Needs of Students with Disabilities (AUEN), including those PEs that have been identified as appropriate for statewide assessment (section 2.2), and those found in the Model Content Standards contained in the Michigan Curriculum Framework.
The Michigan Curriculum Framework was used as the basis for content standards relevant for students at the FI level. The Michigan Curriculum Framework’s model content standards, benchmarks, and grade-level content expectations (GLCEs) were reviewed for appropriateness for the FI population. In addition, benchmarks and GLCEs were modified or extended when possible with respect to the acces-sibility or enabling skills needed to achieve the content standard. The complete process was described in the Mi Access Assessment Plan Science (2008).
The performance standards describe what constitutes satisfactory performance of the content stan-dards. These are typically described as the cut scores or decision rules that identify how well stu-dents must perform on the assessments to be considered proficient. The Technical Advisory Committee (TAC) considered several models of standard setting before recommending the final model. They also considered numerous aspects of the MI-Access model that would need to be included in the decision-making framework for the standard setting process to be consistent with the intent of the MI-Access and provide a parallel system of standards to the MEAP.
The results of the standard setting process have been documented elsewhere (Questar Assessment, Inc., 2008) and will be summarized here.1 0
4.2 Initial Considerations
Planning for the standard setting activities began in the winter of 2007-2008 with discussions among professional staff of OEAA and the state’s contractor to MDE for MI-Access support services, Questar Assessment, Inc. (formerly BETA/TASA). These discussions led to two iterations of written outlines for the process to be followed for establishing the student performance standards. These draft plans were dis-cussed with the OEAA TAC April 2008, during which revisions were proposed and the plans ultimately approved. Based on the draft plans and TAC counsel, the implementation process was finalized. The TAC-approved version of the implementation plan is available from OEAA. The subsequent implemen-tation of the standard-setting process was carried out consistent with the OEAA- and TAC-approved
10 Standard 4.19. When proposed score interpretations involve one or more cut scores, the rationale and procedures used for establishing cut scores should be clearly documented.
MI-ACCESS P/SI/FI Science Technical RepoRT | 2 0 0 7 - 2 0 0 8 | 5 5
plan. Essentially identical procedures were followed for the sessions summarized in this report as were carried out for the several earlier MI-Access standard-setting sessions, including those for the Science assessments in Grades 5 and 8. Conduct of the Science sessions and subsequent data analyses and state standards-adoption processes were parallel for all three levels of the assessments.
4.3 Levels of Performance and Performance Categories
A critical step in a performance standard setting process is the selection of performance labels. Early on, TAC recommended, with advice from MI-Access staff, to select performance labels that were distinct from the labels used by MEAP. This was important to discourage inappropriate comparisons between performance levels on MEAP and MI-Access. Because the two systems are based on qualitatively differ-ent content (while linked, they are based on fundamentally different levels of performance), the same performance labels might inappropriately imply equivalent levels of performance on the same content standards.
OEAA developed, with input from a range of relevant stakeholders in the process, three “achievement labels” and corresponding draft performance-level descriptors (PLDs) to describe student performance on MI-Access. The chosen labels and PLDs were shared with the TAC for their input and counsel. Three performance categories were used for each level of MI-Access; the number of categories was chosen to be consistent with the MEAP, which also has 3 performance levels. The final PLDs are presented in the final Standard Setting Reports.
4.4 The Standard Setting Process
The standard setting process was designed and carried out by Questar in consultation with TAC and MI-Access staff. Questar facilitated the process which occurred on December 5 and 6, 2007, for grades 5 and 8, and April 29 and 30, for grade 11. Standard-setting participants were chosen from nominees made to the OEAA from MI-Access district coordinators, the state’s Special Education Advisory Com-mittee, and from various professional organizations. In addition, the call for panelists was posted on the MDE web site. The final panel was comprised of Michigan special education stakeholders, includ-ing parents, classroom teachers (both special and general education), building-level administrators, special education directors, and school counselors and psychologists.
On the recommendation of the OEAA contractor and Questar, and approved by OEAA and the state’s TAC, the general methodology selected for all standard setting sessions was “item mapping,” more commonly referred to as the “Bookmark Procedure™.” This procedure was adopted for several rea-sons: (i) it is currently the most widely used method for setting performance standards on high-stakes educational assessments; (ii) the method is widely understood and researched by measurement pro-fessionals; (iii) the method is well-suited for assessments predominately consisting of multiple-choice questions; and (iv) the item-mapping procedure was used for establishing standards for the majority of the MEAP (general education) assessments.
A Questar facilitator presented a general introduction of the standard setting procedure and the three performance labels to be used. The panelists then broke out into smaller, separate panels to begin their work. These groups were assembled based on the age groups and MI-Access levels (P, SI, FI) for which the assessments were developed. Facilitators of these smaller panels followed the same agenda and used identical overhead transparency sequence and notes to lead their individual sessions. MDE/OEAA

5 6 | MI-ACCESS P/SI/FI Science Technical RepoRT | 2 0 0 7 - 2 0 0 8
personnel were present for all sessions, but served only as resource personnel and observers; they were not allowed to participate in the judgment process. The agendas for the standard setting sessions are provided in the standard setting report (Questar Assessment, Inc., 2008).
Each panel made three separate rounds of judgments of the standards. The training encouraged par-ticipants to focus on their professional experience-based judgments as a basis for decision-making throughout the process.1 1 As described in the standard setting report, each panelist judged the mini-mum score a student should receive to be deemed having attained the performance standard. They made separate judgments regarding the minimum score a student should receive to have surpassed the performance standard. Extensive discussions by the panelists of their interim ratings took place fol-lowing the first and second rounds. They were instructed to explain their ratings and seek clarification for any questions. During these interim periods, each panelist had available their own ratings and a summary of their peers’ ratings for comparison.
After the second round of judgments, panelists were provided with impact data, illustrating the ex-pected percentages of students who would likely be in each of the three performance categories. After some discussion about the limitations of the impact data, panelists made their final judgments. Upon completion, each panelist filled out an evaluation questionnaire regarding their comfort with the stan-dard setting process and results. (Questar Assessment, Inc., 2008).
All panel recommendations were shared with the state’s national TAC for their counsel. Small adjust-ments to a small number of the panels’ recommendations were made by OEAA to smooth the grade-to-grade percents of student scoring in each performance category. Of the 48 panel recommended cut scores, OEAA smoothed a total of 14 of them. With the TAC input, the final OEAA recommendations were presented to, and were subsequently approved by, the State Board of Education.
4.5 Standard Setting Results
For Participation, the percentage of students by performance category is given in Table 4.1 and the item mapping test booklet cuts, as adopted by the State Board of Education, are given in Table 4.2.
Table 4.1Summary of Panel Recommendations for MI-Access Participation Science Test:
Percentage of Students by Performance Category
Grade 5 Grade 8 Grade 11
Emerging 42 45 54
Attained 46 42 34
Surpassed 13 14 13
11 Standard 4.21. When cut scores defining pass-fail or proficiency categories are based on direct judgments about the adequacy of item or test performances or performance levels, the judgmental process should be designed so that judges can bring their knowledge and experience to bear in a reasonable way.

MI-ACCESS P/SI/FI Science Technical RepoRT | 2 0 0 7 - 2 0 0 8 | 5 7
Table 4.2Summary of Panel Recommendations for MI-Access Participation Science Test:
Item Mapping Test Booklet Cuts, Median Scores (Standard Errors)
Grade 5 Grade 8 Grade 11
Attained 24 (0.7) 25 (0.7) 49 (1.4)
Surpassed 75 (0.5) 78 (0.5) 81 (0.5)
Note: Maximum score = 90 at each grade.
For Supported Independence, the percentage of students by performance category is given in Table 4.3 and the item mapping test booklet cuts, as adopted by the State Board of Education, are given in Table 4.4.
Table 4.3Summary of Panel Recommendations for MI-Access Supported Independence
Science Test: Percentage of Students by Performance Category
Grade 5 Grade 8 Grade 11
Emerging 35 34 23
Attained 43 40 61
Surpassed 22 26 16
Table 4.4Summary of Panel Recommendations for MI-Access Supported Independence
Science Test: Item Mapping Test Booklet Cuts, Median Scores (Standard Errors)
Grade 5 Grade 8 Grade 11
Attained 38 (2.0) 39 (2.4) 34 (1.2)
Surpassed 62 (1.2) 58 (1.0) 61 (1.1)
Note: Maximum score = 68 at each grade.

5 8 | MI-ACCESS P/SI/FI Science Technical RepoRT | 2 0 0 7 - 2 0 0 8
For Functional Independence, the percentage of students by performance category is given in Table 4.5 and the item mapping test booklet cuts, as adopted by the State Board of Education, are given in Table 4.6.
Table 4.5Summary of Panel Recommendations for MI-Access Functional Independence
Science Test: Percentage of Students by Performance Category
Grade 5 Grade 8 Grade 11
Emerging 46 50 37
Attained 27 23 37
Surpassed 27 27 26
Table 4.6Summary of Panel Recommendations for MI-Access Functional Independence
Science Test: Item Mapping Test Booklet Cuts, Median Scores (Standard Errors).
Grade 5 Grade 8 Grade 11
Attained 18 (0.6) 20 (0.8) 19 (1.5)
Surpassed 28 (0.7) 33 (0.6) 38 (0.6)
Note: Maximum score = 35 at Grade5, 40 at Grade 8, and 45 at grade 11.

MI-ACCESS P/SI/FI Science Technical RepoRT | 2 0 0 7 - 2 0 0 8 | 5 9
CHAPTER 5
RELIABILITY EVIDENCE
5.1 Background
The reliability of scores refers to the consistency or degree of stability of scores under conditions where the measurement is repeated on a population of individuals. “The usefulness of behavioral measure-ments presupposes that individuals and groups exhibit some degree of stability in their behavior” (AERA, APA, NCME, 1999, p. 25). Variability in scores over successive measurements that is unrelated to the intended measurement is called measurement error. The Standards also state “because of sub-jectivity in the scoring process, an individual’s obtained score and the average score of a group will always reflect at least a small amount of measurement error” (AERA, APA, NCME, 1999, p. 25).
The Standards clarify the summary requirements for reliability data, critical information that should in-clude the identification of the major sources of error, summary statistics describing the size of resulting errors, the degree of generalizability of scores across relevant aspects of the assessment procedure, and a description of the population on which the reliability evidence is based. It is important to note that reliability data is typically sample-specific, so comparisons to other populations must be tempered by evaluation of the degree of similarity in relevant characteristics between the population and the sample.1 2
Information about decision consistency is also available for MI-Access. Decision consistency estimates are useful for judging stability when scores are used to determine whether an individual student has met the standard.
5.2 Internal Consistency and Standard Errors of Measurement of Spring 2007 Pilot Forms
Internal consistency estimates were computed as coefficient alpha for each pilot form. Coefficient Al-pha and the Standard Error of Estimate (SEM) are reported in Table 5.1 for Participation, Table 5.2 for Supported Independence, and Table 5.3 for Functional Independence. The N, mean, standard devia-tion and minimum and maximum are also reported in these tables.
12 Standard 2.1 For each total score, subscore, or combination of scores that is to be interpreted, estimates of relevant reliabilities and standard errors of measurement or test information functions should be reported.

6 0 | MI-ACCESS P/SI/FI Science Technical RepoRT | 2 0 0 7 - 2 0 0 8
Table 5.1Spring 2007 Pilot Form Summaries, including Score Statistics, Sample Size,
Coefficient Alpha, and SEM by Form - Participation Science
Test Form
Grade Mean SD Minimum Maximum N Alpha SEM
PP-S51 5 51.75 37.27 0 102 36 0.94 9.3PP-S52 5 32.66 35.89 0 120 89 0.95 7.7PP-S53 5 40.34 38.60 0 120 83 0.96 8.0PP-S54 5 42.89 38.49 0 118 61 0.96 8.1PP-S81 8 53.78 38.04 0 120 41 0.94 9.3PP-S82 8 52.63 43.43 0 120 79 0.97 7.8PP-S83 8 42.70 38.25 0 120 84 0.96 7.8PP-S84 8 49.55 38.14 0 118 66 0.95 8.7
PP-S111 11 43.98 38.24 0 120 45 0.96 8.0PP-S112 11 35.77 40.44 0 120 61 0.97 7.2PP-S113 11 54.01 41.23 0 120 68 0.96 8.2PP-S114 11 46.90 42.32 0 120 58 0.96 8.0
Table 5.2Spring 2007 Pilot Form Summaries, including Score Statistics, Sample Size, Coefficient Alpha, and SEM by Form - Supported Independence Science
Test Form
Grade Mean SD Minimum Maximum N Alpha SEM
PSI-S51 5 69.06 22.55 0 100 104 0.90 7.0PSI-S52 5 65.51 26.91 0 100 104 0.93 6.9PSI-S53 5 65.70 25.55 0 100 109 0.92 7.2PSI-S54 5 64.69 26.78 0 100 131 0.94 6.6PSI-S81 8 58.15 23.46 0 96 147 0.90 7.6PSI-S82 8 58.89 26.57 0 100 128 0.93 7.2PSI-S83 8 60.18 25.47 0 100 142 0.92 7.4PSI-S84 8 67.50 22.71 0 100 140 0.90 7.2PSI-S111 11 68.63 27.89 0 100 139 0.95 6.2PSI-S112 11 64.46 20.77 8 100 162 0.87 7.5PSI-S113 11 71.16 23.92 0 100 110 0.92 6.6PSI-S114 11 69.14 21.91 0 100 136 0.89 7.2

MI-ACCESS P/SI/FI Science Technical RepoRT | 2 0 0 7 - 2 0 0 8 | 6 1
Table 5.3Spring 2007 Pilot Form Summaries, including Score Statistics, Sample Size, Coefficient Alpha, and SEM by Form - Functional Independence Science
Test Form
Grade Mean SD Minimum Maximum N Alpha SEM
PFI-S51 5 32.50 7.02 10 47 585 0.84 2.8PFI-S52 5 33.00 6.48 16 47 294 0.82 2.7PFI-S53 5 32.63 7.25 13 47 303 0.85 2.8PFI-S54 5 30.45 6.74 4 45 318 0.81 2.9PFI-S55 5 31.06 5.93 0 46 286 0.77 2.8PFI-S81 8 36.11 7.92 0 54 666 0.84 3.1PFI-S82 8 34.05 7.24 15 50 304 0.81 3.2PFI-S83 8 35.54 7.28 16 52 297 0.81 3.2PFI-S84 8 31.71 7.99 9 53 338 0.83 3.3PFI-S85 8 33.99 7.30 14 52 313 0.81 3.2PFI-S111 11 38.45 8.33 12 60 489 0.85 3.2PFI-S112 11 38.56 9.41 15 58 326 0.88 3.2PFI-S113 11 38.31 8.36 11 55 289 0.85 3.3PFI-S114 11 38.07 8.61 16 56 241 0.85 3.3PFI-S115 11 37.55 8.63 13 56 337 0.85 3.3
5.3 Internal Consistency and Standard Errors of Measurement of 2007-2008 Operational Assessments
Internal consistency estimates were computed as coefficient alpha for the operational forms. Coefficient Alpha and the SEM are reported in Table 5.4 for Participation, Table 5.5 for Supported Independence, and Table 5.6 for Functional Independence. The raw score mean and standard deviation along with the N are also reported in these tables.
Rash model reliabilities are included as part of the Winsteps calibration of core items in the FI science assessment. These model reliabilities provide further evidence of score reliability and are reported in Table 5.6 along with the scale score mean and standard deviation.
Table 5.42007-2008 Operational Form Summaries, including Sample Size, Raw Score
Statistics, Coefficient Alpha, and SEM - Participation
Grade N Mean SDCronbach's
AlphaSEM
5 264 36.43 29.54 0.94 7.28 280 35.51 30.09 0.94 7.311 296 43.20 31.63 0.96 6.1
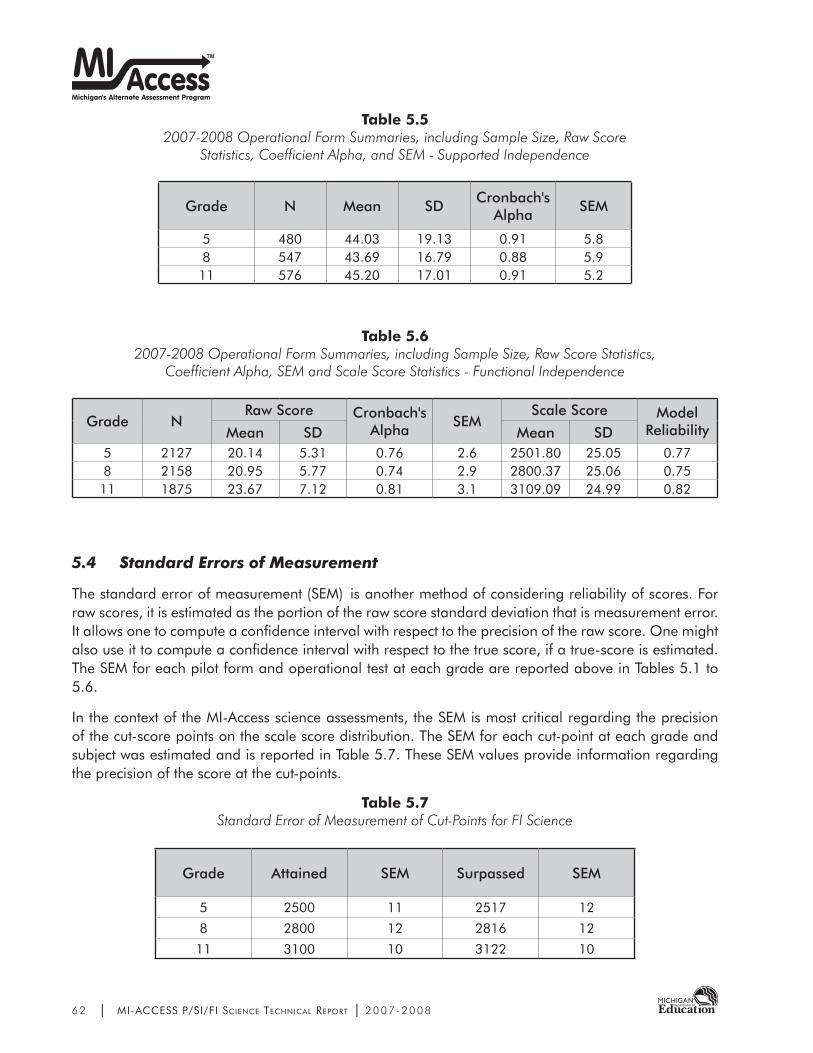
6 2 | MI-ACCESS P/SI/FI Science Technical RepoRT | 2 0 0 7 - 2 0 0 8
Table 5.52007-2008 Operational Form Summaries, including Sample Size, Raw Score
Statistics, Coefficient Alpha, and SEM - Supported Independence
Grade N Mean SDCronbach's
AlphaSEM
5 480 44.03 19.13 0.91 5.88 547 43.69 16.79 0.88 5.911 576 45.20 17.01 0.91 5.2
Table 5.62007-2008 Operational Form Summaries, including Sample Size, Raw Score Statistics,
Coefficient Alpha, SEM and Scale Score Statistics - Functional Independence
Grade NRaw Score Cronbach's
AlphaSEM
Scale Score Model ReliabilityMean SD Mean SD
5 2127 20.14 5.31 0.76 2.6 2501.80 25.05 0.778 2158 20.95 5.77 0.74 2.9 2800.37 25.06 0.7511 1875 23.67 7.12 0.81 3.1 3109.09 24.99 0.82
5.4 Standard Errors of Measurement
The standard error of measurement (SEM) is another method of considering reliability of scores. For raw scores, it is estimated as the portion of the raw score standard deviation that is measurement error. It allows one to compute a confidence interval with respect to the precision of the raw score. One might also use it to compute a confidence interval with respect to the true score, if a true-score is estimated. The SEM for each pilot form and operational test at each grade are reported above in Tables 5.1 to 5.6.
In the context of the MI-Access science assessments, the SEM is most critical regarding the precision of the cut-score points on the scale score distribution. The SEM for each cut-point at each grade and subject was estimated and is reported in Table 5.7. These SEM values provide information regarding the precision of the score at the cut-points.
Table 5.7Standard Error of Measurement of Cut-Points for FI Science
Grade Attained SEM Surpassed SEM
5 2500 11 2517 12
8 2800 12 2816 12
11 3100 10 3122 10

MI-ACCESS P/SI/FI Science Technical RepoRT | 2 0 0 7 - 2 0 0 8 | 6 3
5.5 Classification Consistency
Classification accuracy and consistency are indices of agreement for performance-level classification as a score. Classification accuracy is a way to estimate the difference between true classification and observed classification due to measurement error. Classification consistency is a way to estimate the difference between the observed classification and the classification on a parallel form. The MI-Access Functional Independence classification accuracy and consistency indices were calculated by apply-ing procedures given in Livingston and Lewis (1995) via the BB-CLASS computer program (Brennan, 2004). These indices are presented in the following table, Table 5.8. The accuracy indices can be interpreted as the proportion of examinees that would be classified accurately into the performance-level score categories given infinite replications of identical conditions. The consistency indices can be interpreted as the proportion of examinees that would be classified accurately (consistently) into the performance-level score categories on the assessment and a parallel form of the assessment.
Table 5.8Estimated Classification Accuracy and Consistency - Science
2 Categories
Emerging vs. Attained plus Surpassed
3 Categories
Emerging vs. Attained vs. Surpassed
Grade Accuracy Consistency Accuracy Consistency
Participation
5 0.95 0.92 0.85 0.808 0.94 0.92 0.86 0.8111 0.95 0.93 0.83 0.79
Supported Independence
5 0.92 0.89 0.81 0.748 0.91 0.88 0.77 0.6911 0.94 0.91 0.78 0.71
Functional Independence
5 0.84 0.78 0.73 0.658 0.84 0.78 0.73 0.6511 0.86 0.80 0.76 0.67
Across all three grades and across the three levels of MI-Access, the classification accuracy when cat-egorizing students into the basic NCLB categories of proficient (attained and surpassed) and not pro-ficient (emerging) ranges from 84% to 95% with a median of 92%, and the classification consistency ranges from 78% to 92% with a median of 89%. When categorizing the students into three categories, the classification accuracy ranges from 73% to 86% with a median of 78%, and the classification con-sistency ranges from 65% to 81% with a median of 71%. The accuracy indices will be higher than the

6 4 | MI-ACCESS P/SI/FI Science Technical RepoRT | 2 0 0 7 - 2 0 0 8
consistency indices because the former estimates accuracy between observed scores containing mea-surement error and true scores with no error, whereas the latter estimates accuracy between observed scores on parallel forms of the assessment where both scores contain measurement error.
These estimates represent strong proportions of students classified accurately for an assessment ap-propriate for students with disabilities such as those who take the MI-Access Participation, Supported Independence, and Functional Independence assessments.
5.6 Rater Consistency
Each item of the Participation and Supported Independence assessments is scored based on a rubric. There is a 3-point rubric with 3 condition codes at the Participation level and a 2-point rubric with the same 3 condition codes at the Supported Independence level. (See Tables 3.1 and 3.2 for the two rubrics.) Each activity has two raters—Primary Assessment Administrator (PAA) and the Shadow As-sessment Administrator (SAA). A student’s score is the sum of the item scores across both raters. The Primary rater must be a professional school staff person (i.e. classroom teacher, teacher consultant, school psychologist) and is often the classroom teacher. The Shadow rater can be another teacher, related service provider (i.e. school psychologist, speech and language pathologist), or a paraprofes-sional.
For the spring 2007 pilot, the percent perfect agreement rates are given in Table 5.9 for Participation and in Table 5.10 for Supported Independence. For Participation, across the 80 grade 5 items, the per-cent perfect agreement rates ranged from 90% to 100% with a median of 96%; across the 80 grade 8 items the percents ranged from 89% to 100% with a median of 96%; and finally, across the 80 grade 11 items the percents ranged from 84% to 99% with a median of 93%. For Supported Independence, across the 100 grade 5 items, the percent perfect agreement rates ranged from 91% to 100% with a median of 95%; across the 100 grade 8 items, the percents ranged from 91% to 98% with a median of 95%; and finally, across the 100 grade 11 items the percents ranged from 90% to 99% with a median of 95%.
For the 2007-2008 operational forms the percent perfect agreement rates are given in Table 5.11 for Participation and in Table 5.12 for Supported Independence. For Participation, across the 15 grade 5 items, the percent perfect agreement rates ranged from 92% to 97% with a median of 95%; across the 15 grade 8 items, the percents ranged from 94% to 99% with a median of 96%; and finally, across the 15 grade 11 items, the percents ranged from 96% to 99% with a median of 97%. For Supported Independence, across the 15 grade 5 items the percent perfect agreement rates ranged from 95% to 98% with a median of 96%; across the 15 grade 8 items the percents ranged from 95% to 98% with a median of 97%; and finally, across the 15 grade 11 items, the percents ranged from 94% to 99% with a median of 97%.

MI-ACCESS P/SI/FI Science Technical RepoRT | 2 0 0 7 - 2 0 0 8 | 6 5
Tab
le 5
.9Sp
ring
2007
Pilo
t For
m P
erce
nt P
erfe
ct In
terr
ater
Agr
eem
ent R
ates
—Pa
rtici
patio
n Sc
ienc
e
Gra
de 5
Gra
de 8
Gra
de 1
1
Item
N
umbe
rPP
-S51
PP-S
52
PP-S
53
PP-S
54
PP-S
81
PP-S
82
PP-S
83
PP-S
84
PP-S
111
PP-S
112
PP-S
113
PP-S
114
N =
36
N =
89
N =
83
N =
61
N =
41
N =
79
N =
84
N =
66
N =
45
N =
61
N =
68
N =
58
197
9696
9010
099
9895
8792
9798
210
098
9497
100
9995
9489
9296
953
9796
9498
9897
9597
8992
9195
494
9694
9810
097
9392
8790
9497
594
9898
9298
9794
9184
9396
976
9799
9597
100
9695
9587
9293
977
100
9696
9895
9694
8987
9296
978
9797
9697
100
100
9495
8993
9193
994
9698
9798
9998
9489
9096
9710
9797
9692
100
9995
9489
9396
9711
9494
9595
100
9598
9589
9091
9712
100
9896
9510
099
9495
8993
9497
1397
9699
9710
099
9494
8489
9695
1497
9696
9310
097
9694
8792
9797
1592
9796
9598
9695
100
9190
9491
1697
9796
9210
099
9495
8490
9391
1794
9795
9395
9995
9291
9599
9718
9798
9893
100
100
9294
8987
9095
1997
9792
9510
096
9592
8993
9395
2094
9994
9310
096
9592
8992
9697

6 6 | MI-ACCESS P/SI/FI Science Technical RepoRT | 2 0 0 7 - 2 0 0 8
Tab
le 5
.10
Sprin
g 20
07 P
ilot F
orm
Per
cent
Per
fect
Inte
rrat
er A
gree
men
t Rat
es—
Supp
orte
d In
depe
nden
ce S
cien
ce
Gra
de 5
Gra
de 8
Gra
de 1
1
Item
N
umbe
r
PSI-
S51
PSI-
S52
PSI-
S53
PSI-
S54
PSI-
S81
PSI-
S82
PSI-
S83
PSI-
S94
PSI-
S111
PSI-
S112
PSI-
S113
PSI-
S114
N =
104
N =
104
N =
109
N =
13
1N
= 1
47
N =
12
8N
= 1
42
N =
14
0N
= 1
39
N =
162
N =
110
N =
136
194
9498
9294
9596
9694
9394
982
9697
9795
9695
9697
9593
9596
396
9310
093
9394
9696
9493
9396
496
9299
9495
9296
9696
9492
965
9492
9697
9596
9297
9490
9595
696
9596
9194
9297
9493
9695
977
9796
9992
9495
9398
9494
9498
897
9399
9393
9494
9794
9394
969
9793
9994
9496
9695
9496
9496
1097
9399
9595
9196
9794
9595
9711
9695
100
9596
9496
9694
9494
9612
9694
9595
9496
9596
9492
9296
1394
9398
9593
9494
9894
9393
9514
9697
9992
9294
9597
9692
9597
1597
9498
9495
9594
9496
9495
9816
9698
9895
9497
9495
9693
9599
1798
9598
9294
9194
9494
9494
9618
9695
9892
9595
9596
9493
9597
1994
9298
9395
9394
9497
9495
9720
9693
9795
9597
9396
9790
9495
2197
9198
9595
9594
9595
9192
9722
9895
9992
9591
9496
9594
9594
2395
9399
9593
9594
9596
9394
9724
9595
9892
9596
9697
9495
9595
2595
9499
9694
9694
9895
9494
97

MI-ACCESS P/SI/FI Science Technical RepoRT | 2 0 0 7 - 2 0 0 8 | 6 7
Table 5.112007-2008 Operational Form Percent Perfect Interrater
Agreement Rates—Participation Science
Grade 5 Grade 8 Grade 11
Item # N = 264 Item # N = 280 Item # N = 296
1 97 1 96 1 972 95 2 96 2 963 97 3 95 3 964 96 4 98 4 985 96 5 96 5 976 94 6 96 6 967 95 7 95 8 989 96 9 94 9 9910 96 10 99 10 9712 93 11 96 11 9614 95 14 96 14 9715 92 15 99 15 9816 95 16 97 16 9717 94 19 96 19 9920 92 20 98 20 98

6 8 | MI-ACCESS P/SI/FI Science Technical RepoRT | 2 0 0 7 - 2 0 0 8
Table 5.122007-2008 Operational Form Percent Perfect Interrater Agreement Rates—Supported Independence Science
Grade 5 Grade 8 Grade 11
Item # N = 480 Item # N = 547 Item # N = 576
1 97 1 97 1 982 97 2 97 2 953 95 3 97 3 974 96 4 97 4 955 97 5 96 5 966 96 6 96 6 987 98 7 97 7 968 96 8 98 8 9910 97 10 97 10 9812 96 12 97 12 9814 96 14 97 14 9515 97 15 97 15 9717 97 17 98 17 9418 96 18 95 18 9719 95 19 97 19 9521 97 21 96 21 9722 96 22 97 22 96

MI-ACCESS P/SI/FI Science Technical RepoRT | 2 0 0 7 - 2 0 0 8 | 6 9
CHAPTER 6
VALIDITY EVIDENCE
6.1 Background
Validity is the most important consideration for the development and evaluation of an assessment. “Validity refers to the degree to which evidence and theory support the interpretations of test scores en-tailed by proposed uses of tests” (AERA, APA, NCME, 1999, p. 9). Validation begins with a clarification of the appropriate interpretations of scores. The evidence that is gathered to support such interpreta-tions should be linked to proposed uses of the scores that result from the assessment.
Related to this is construct-irrelevant variance or variance in scores that is introduced systematically by influences not related to the characteristic being measured. “Validation involves careful attention to possible distortions in meaning arising from inadequate representation of the construct and also to aspects of measurement such as test format, administration conditions, or language level that may materially limit or qualify the interpretation of test scores” (AERA, APA, NCME, 1999, p. 10).
In addition to the evidence presented below, the documentation of the development of MI-Access provided in Chapters 1 and 2 provides additional evidence regarding the meaning and usefulness of the assessment results while Chapter 3 presents training and resources available to improve the observation and rating process. Furthermore, the reliability analyses in Chapter 5 provide evidence of the limited influence of irrelevant variance (e.g., variance introduced because of inconsistent raters or rater bias).
6.2 Relevance of Content (Test Blueprint)
The heart of MI-Access is embodied in the set of EGLCEs for elementary and middle school and the EHSCEs for high school along with the corresponding Scoring Focus for each assessment item. These documents lead to the subject matter areas typically found in standard assessments; namely ELA and mathematics. The current set of EGLCEs and EHSCEs and corresponding Scoring Foci were developed through an inclusive process, involving teachers, school administrators, parents, advocates, and adult service agency personnel. This process has been documented in Chapters 1 and 2 and provides clear evidence of the general agreement from key stakeholders and experts regarding their appropriateness, comprehensiveness, and completeness.
6.3 Field Review of the MI-Access Science Assessment Plan
Once the draft of the MI-Access Science Assessment Plan was completed, an online evaluation form was provided for feedback from the field. The results of this feedback were considered in the develop-ment of the final assessment plan as implemented.

7 0 | MI-ACCESS P/SI/FI Science Technical RepoRT | 2 0 0 7 - 2 0 0 8
6.4 Results of Item Review Processes
SRC & CAC review of Newly Developed ItemsThe Sensitivity Review Committees (SRC) and the Content Advisory Committees (CAC) meetings were held on July 17-20, 2006 at the East Lansing Marriott. The purpose of these meetings was to convene the SRC and CAC to review the newly developed science items for Functional Independence, Supported Independence, and Participation. A copy of the agenda for these meetings can be found in the Science SRC-CAC Summary Report (2006).
Table 6.1 shows the number of new science development items that the SRC committee reviewed, and how many of those were accepted, rejected, or revised.
Table 6.1New Development Item Status: SRC Recommendations
Committee Total Items Accepted Rejected Revised
SRC-Functional Independence Science 689 576 4 109
SRC-Participation and Supported Independence Science
881 610 8 208

MI-ACCESS P/SI/FI Science Technical RepoRT | 2 0 0 7 - 2 0 0 8 | 7 1
Table 6.2 shows the number of new science development items that the CAC committees re-viewed, and how many items were accepted, rejected, or revised.
Table 6.2New Development Item Status: CAC Recommendations
Committee Total Items Accepted Rejected Revised
CAC Functional Independence Science - Elementary
252 177 20 55
CAC Functional Independence Science - Middle School
234 126 6 102
CAC Functional Independence Science - High School
203 122 3 83
CAC Supported Independence Science - Elementary
188 80 5 103
CAC Supported Independence Science - Middle School
210 54 25 131
CAC Supported Independence Science - High School
185 71 21 93
CAC Participation Science-Elementary
99 32 7 60
CAC Participation Science- Middle School
99 33 9 57
CAC Participation Science- High School
100 15 9 76
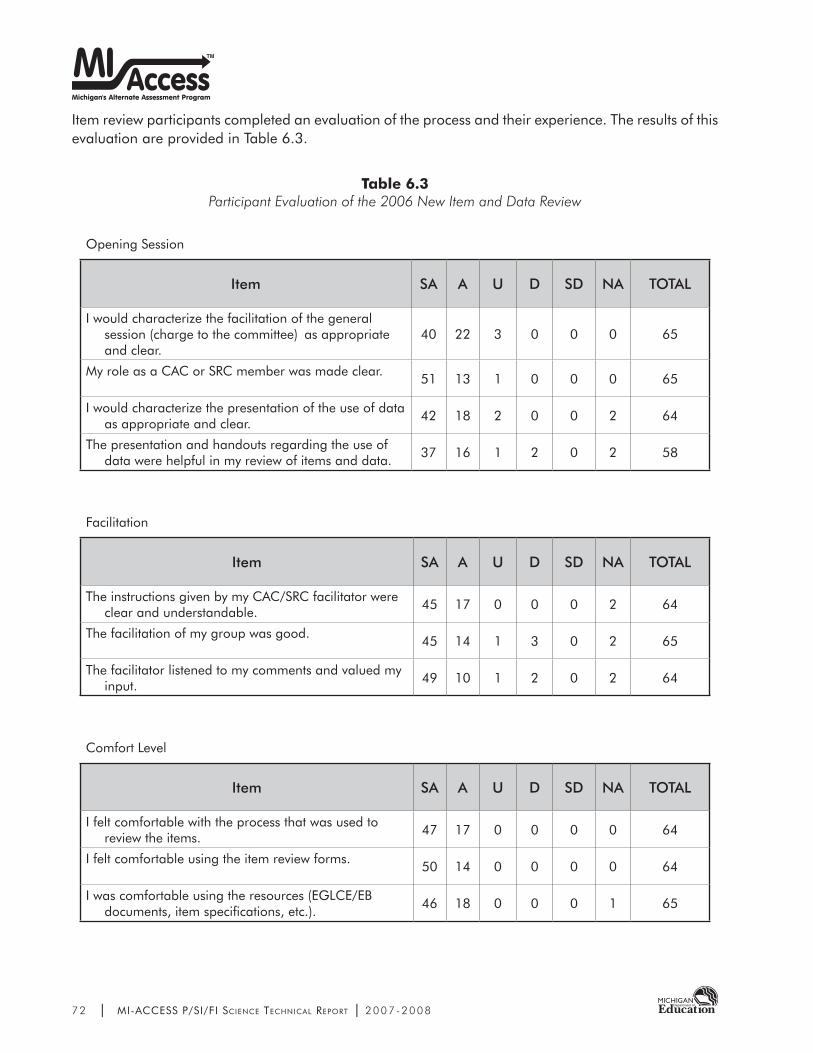
7 2 | MI-ACCESS P/SI/FI Science Technical RepoRT | 2 0 0 7 - 2 0 0 8
Item review participants completed an evaluation of the process and their experience. The results of this evaluation are provided in Table 6.3.
Table 6.3Participant Evaluation of the 2006 New Item and Data Review
Opening Session
Item SA A U D SD NA TOTAL
I would characterize the facilitation of the general session (charge to the committee) as appropriate and clear.
40 22 3 0 0 0 65
My role as a CAC or SRC member was made clear. 51 13 1 0 0 0 65
I would characterize the presentation of the use of data as appropriate and clear.
42 18 2 0 0 2 64
The presentation and handouts regarding the use of data were helpful in my review of items and data.
37 16 1 2 0 2 58
Facilitation
Item SA A U D SD NA TOTAL
The instructions given by my CAC/SRC facilitator were clear and understandable.
45 17 0 0 0 2 64
The facilitation of my group was good. 45 14 1 3 0 2 65
The facilitator listened to my comments and valued my input.
49 10 1 2 0 2 64
Comfort Level
Item SA A U D SD NA TOTAL
I felt comfortable with the process that was used to review the items.
47 17 0 0 0 0 64
I felt comfortable using the item review forms. 50 14 0 0 0 0 64
I was comfortable using the resources (EGLCE/EB documents, item specifications, etc.).
46 18 0 0 0 1 65

MI-ACCESS P/SI/FI Science Technical RepoRT | 2 0 0 7 - 2 0 0 8 | 7 3
Spring 2007 Pilot
Following the Spring 2007 Pilot, Content Advisory Committees (CAC) and Sensitivity Review Commit-tees (SRC) were convened to review items and resulting statistics. The following questions were ad-dressed during the CAC review:
1. Does the item measure the content standard?2. Does the item measure the extended GLCE/Benchmark?3. Is the item simply and clearly stated?4. Does the item measure a functional and familiar word?5. Is the item difficulty appropriate?6. Is the artwork appropriate? 7. Does the item meet the specifications?
Item and data review participants completed an evaluation of the process and their experience. The results of this evaluation are provided in Table 6.4.
Table 6.4Participant Evaluation of the Spring 2007 Pilot Item and Data Review
Opening Session
Item SA A U D SD NA TOTAL
I would characterize the facilitation of the general session (charge to the committee) as appropriate and clear.
27 5 0 0 0 0 32
My role as a SRC or CAC member was made clear. 28 4 0 0 0 0 32
The “Overview on How to Use Item Data” presentation was clear and informative.
25 4 2 1 0 0 32

7 4 | MI-ACCESS P/SI/FI Science Technical RepoRT | 2 0 0 7 - 2 0 0 8
Facilitation
Item SA A U D SD NA TOTAL
The instructions given by my SRC/CAC facilitator were clear and understandable.
25 6 0 0 0 1 32
I would characterize the facilitation of my committee as very good.
24 5 2 0 0 0 32
I felt that the facilitator listened to my comments and valued my input.
28 3 0 0 0 1 32
Comfort Level
Item SA A U D SD NA TOTAL
I felt comfortable with the process that was used to review the items.
26 5 0 1 0 0 32
I felt the item review forms were well organized and user-friendly.
26 4 1 1 0 0 32
I felt the resources (EB documents, item specifications, etc.) provided to the committee were adequate.
23 5 1 2 1 0 32
I felt my input was taken into account when reviewing the items.
26 3 2 0 0 1 32
6.5 Evaluation of Standard-Setting Training, Process, and Outcomes
Following each standard setting session, panelists completed an evaluation of the process and out-comes. Participants were instructed to “Please share with us your feedback about the standards-setting process, activities and outcomes. Your feedback will help OEAA evaluate the training, methods, ma-terials, and results of the sessions.” The evaluations are summarized in Table 6.5 for the December, 2007 grades 5 and 8 standard setting sessions and in Table 6.6 for the April, 2008 grade 11 standard setting sessions.

MI-ACCESS P/SI/FI Science Technical RepoRT | 2 0 0 7 - 2 0 0 8 | 7 5
Table 6.5Panelist Evaluation of the Fall 2007 Standard Setting Process and Outcomes
1. Indicate the level of success of various components of the standard-setting session in which you participated.
ComponentNot Very
SuccessfulPartially
SuccessfulSuccessful
Very Suc-cessful
a) Introduction to the MI-Access Assessments
1 (3%) 22 (52%) 19 (45%)
b) Standard-setting process intro. – Large group
1 (3%) 21 (51%) 19 (46%)
c) Performance Level Descriptor review 24 (57%) 18 (43%)d) Standard-setting orientation – Small
group3 (7%) 23 (56%) 15 (37%)
e) Group discussions of the panel 3 (7%) 18 (43%) 21 (50%)
f) Data presentations before Rounds 2 & 3 20 (48%) 22 (52%)
2. Indicate the importance of each of these factors in making your cut-score recommendations.
ComponentNot Very Important
Somewhat
ImportantImportant
Very Impor-tant
a) Performance Level Descriptors 8 (20%) 14 (34%) 19 (46%)b) Your perception of the assessment’s
difficulty5 (12%) 19 (45%) 18 (43%)
c) Your own professional experiences 4 (10%) 12 (29%) 25 (61%)d) Your initial judgments (Round 1) 1 (2%) 17 (40%) 16 (37%) 9 (21%)e) Group discussions of the panel 3 (7%) 16 (38%) 23 (55%)f) Feedback data provided to the panel 14 (34%) 27 (66%)g) Policy environment in the state 4 (10%) 13 (32%) 11 (27%) 13 (32%)h) What students would vs. should be able
to do1 (2%) 10 (24%) 30 (73%)
3. I understood the task of recommending performance standards when I did my work for:
Not Very Well Moderately Well Very Well
a) Round 1 5 (12%) 23 (55%) 14 (33%)b) Round 2 6 (14%) 36 (86%)c) Round 3 1 (3%) 39 (97%)

7 6 | MI-ACCESS P/SI/FI Science Technical RepoRT | 2 0 0 7 - 2 0 0 8
4. I understood the data that were provided to the panel prior to:
Not Very Well Moderately Well Very Well
a) Round 2 1 (2%) 10 (24%) 30 (73%)b) Round 3 4 (10%) 37 (90%)
5. How confident are you with your personal classification of students at each level of proficiency?
Performance LevelNot
ConfidentSomewhat Confident
ConfidentVery
Confident
a) Surpassed the Standard 1 (2%) 18 (43%) 23 (55%)b) Attained the Standard 2 (5%) 22 (52%) 18 (43%) c) Emerging Towards the
Standard2 (5%) 22 (52%) 18 (43%)
Table 6.6Panelist Evaluation of the Spring 2008 Standard Setting Process and Outcomes
1. Indicate the level of success of various components of the standard-setting session in which you participated.
ComponentNot Very
SuccessfulPartially
SuccessfulSuccessful
Very Suc-cessful
a) Introduction to the MI-Access Assessments
1 (3%) 22 (52%) 19 (45%)
b) Standard-setting process intro. – Large group
1 (3%) 21 (51%) 19 (46%)
c) Performance Level Descriptor review 24 (57%) 18 (43%)d) Standard-setting orientation – Small
group3 (7%) 23 (56%) 15 (37%)
e) Group discussions of the panel 3 (7%) 18 (43%) 21 (50%)f) Data presentations before Rounds 2 & 3 20 (48%) 22 (52%)

MI-ACCESS P/SI/FI Science Technical RepoRT | 2 0 0 7 - 2 0 0 8 | 7 7
2. Indicate the importance of each of these factors in making your cut-score recommendations.
ComponentNot Very Important
Somewhat Important
ImportantVery
Important
a) Performance Level Descriptors 8 (20%) 14 (34%) 19 (46%)b) Your perception of the assessment’s
difficulty5 (12%) 19 (45%) 18 (43%)
c) Your own professional experiences 4 (10%) 12 (29%) 25 (61%)d) Your initial judgments (Round 1) 1 (2%) 17 (40%) 16 (37%) 9 (21%)e) Group discussions of the panel 3 (7%) 16 (38%) 23 (55%)f) Feedback data provided to the panel 14 (34%) 27 (66%)g) Policy environment in the state 4 (10%) 13 (32%) 11 (27%) 13 (32%)h) What students would vs. should be able
to do1 (2%) 10 (24%) 30 (73%)
3. I understood the task of recommending performance standards when I did my work for:
Not Very Well Moderately Well Very Well
a) Round 1 5 (12%) 23 (55%) 14 (33%)b) Round 2 6 (14%) 36 (86%)c) Round 3 1 (3%) 39 (97%)
4. I understood the data that were provided to the panel prior to:
Not Very Well Moderately Well Very Well
a) Round 2 1 (2%) 10 (24%) 30 (73%)b) Round 3 4 (10%) 37 (90%)
5. How confident are you with your personal classification of students at each level of proficiency?
Performance LevelNot Confi-
dentSomewhat Confident
ConfidentVery Confi-
dent
a) Surpassed the Standard 1 (2%) 18 (43%) 23 (55%)b) Attained the Standard 2 (5%) 22 (52%) 18 (43%) c) Emerging Towards the
Standard2 (5%) 22 (52%) 18 (43%)

7 8 | MI-ACCESS P/SI/FI Science Technical RepoRT | 2 0 0 7 - 2 0 0 8
6.6 Intercorrelations Within Tests (section observed scores)
Intercorrelations within tests provide a picture of the internal structure of a test, indicating the extent to which item types of content areas “hang together.” To some extent, these correlations should be relatively high, indicating a set of items that contribute to a common measure. Moreover, when these intercorrelation structures are consistent across grades, it provides additional support for the similarity of test construction across grades as well.
Correlations between sections scores by grade are given in Table 6.7 for Participation, in Table 6.8 for Supported Independence, and in Table 6.9 for Functional Independence. These section scores are based on the 4 science strands: Constructing & Reflecting, Life Science, Physical Science, and Earth Sci-ence. For Participation, the intercorrelations are high; in the .70s and .80s at grades 5 and 8 and typi-cally in the .60s and .70s at grade 8. For Supported Independence, the intercorrelations are also high but lower than those for Participation. Supported Independence has far fewer points than Participation; 68 total points versus 90. The intercorrelations for Functional Independence are moderately high, but lower than those for Supported Independence. Again, Functional Independence has far fewer points than Supported Independence with total points of 35 at grade 5, 40 at grade 8, and 45 at grade 11 versus 68 for Supported Independence. Constructing and Reflecting has the lowest intercorrelations for the Functional Independence assessments, but this subsection only has 4 items at each grade.
Finally, the Ns, means, and standard deviations along with the minimum and maximum score for sub-sections by grade are also provided in Tables 6.10 to 6.12.
Table 6.72007-2008 Operational Form Intercorrelations Between Section Scores by Grade
Participation Science
GradeConstructing & Reflecting
Life Science
Physical Science
Earth Science
5
Constructing & Reflecting 1 0.796 0.734 0.724Life Science 0.796 1 0.809 0.788Physical Science 0.734 0.809 1 0.737Earth Science 0.724 0.788 0.737 1N 264 264 264 264
8
Constructing & Reflecting 1 0.781 0.645 0.718Life Science 0.781 1 0.698 0.828Physical Science 0.645 0.698 1 0.726Earth Science 0.718 0.828 0.726 1N 280 280 280 280
11
Constructing & Reflecting 1 0.809 0.772 0.754Life Science 0.809 1 0.873 0.816Physical Science 0.772 0.873 1 0.792Earth Science 0.754 0.816 0.792 1N 296 296 296 296
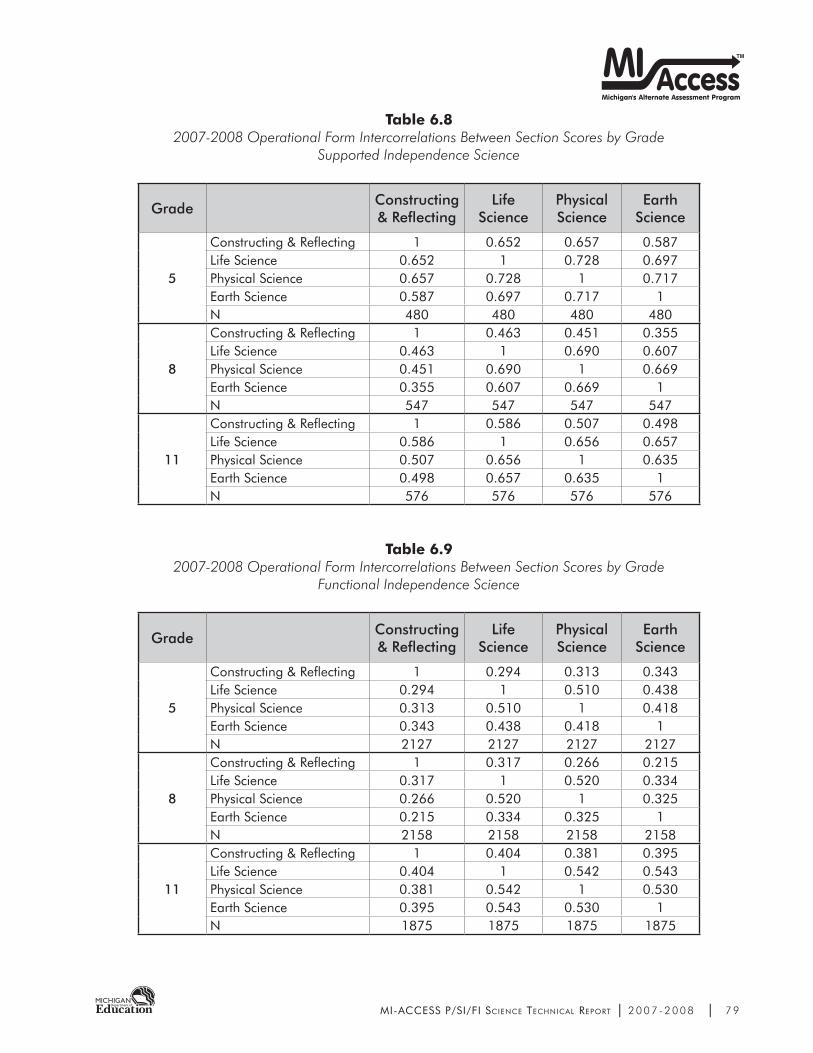
MI-ACCESS P/SI/FI Science Technical RepoRT | 2 0 0 7 - 2 0 0 8 | 7 9
Table 6.82007-2008 Operational Form Intercorrelations Between Section Scores by Grade
Supported Independence Science
GradeConstructing & Reflecting
Life Science
Physical Science
Earth Science
5
Constructing & Reflecting 1 0.652 0.657 0.587Life Science 0.652 1 0.728 0.697Physical Science 0.657 0.728 1 0.717Earth Science 0.587 0.697 0.717 1N 480 480 480 480
8
Constructing & Reflecting 1 0.463 0.451 0.355Life Science 0.463 1 0.690 0.607Physical Science 0.451 0.690 1 0.669Earth Science 0.355 0.607 0.669 1N 547 547 547 547
11
Constructing & Reflecting 1 0.586 0.507 0.498Life Science 0.586 1 0.656 0.657Physical Science 0.507 0.656 1 0.635Earth Science 0.498 0.657 0.635 1N 576 576 576 576
Table 6.92007-2008 Operational Form Intercorrelations Between Section Scores by Grade
Functional Independence Science
GradeConstructing & Reflecting
Life Science
Physical Science
Earth Science
5
Constructing & Reflecting 1 0.294 0.313 0.343Life Science 0.294 1 0.510 0.438Physical Science 0.313 0.510 1 0.418Earth Science 0.343 0.438 0.418 1N 2127 2127 2127 2127
8
Constructing & Reflecting 1 0.317 0.266 0.215Life Science 0.317 1 0.520 0.334Physical Science 0.266 0.520 1 0.325Earth Science 0.215 0.334 0.325 1N 2158 2158 2158 2158
11
Constructing & Reflecting 1 0.404 0.381 0.395Life Science 0.404 1 0.542 0.543Physical Science 0.381 0.542 1 0.530Earth Science 0.395 0.543 0.530 1N 1875 1875 1875 1875

8 0 | MI-ACCESS P/SI/FI Science Technical RepoRT | 2 0 0 7 - 2 0 0 8
Table 6.102007-2008 Operational Form Summary Statistics for Section Scores by Grade
Participation Science
Grade NMinimum
Score
Maximum
ScoreMean
Standard
DeviationAlpha
5
Constructing and Reflecting 264 0 12 4.62 4.81 0.78Life Science 264 0 30 12.69 10.71 0.85Physical Science 264 0 18 6.45 6.09 0.90Earth Science 264 0 30 12.67 10.72 0.83
8
Constructing and Reflecting 280 0 12 4.43 4.78 0.74Life Science 280 0 30 12.74 10.95 0.88Physical Science 280 0 18 6.78 6.35 0.91Earth Science 280 0 30 11.56 11.12 0.83
11
Constructing and Reflecting 296 0 12 5.38 5.04 0.76Life Science 296 0 30 14.95 11.46 0.82Physical Science 296 0 30 14.23 10.65 0.83Earth Science 296 0 18 8.64 6.82 0.79
Table 6.112007-2008 Operational Form Summary Statistics for Section Scores by Grade
Supported Independence Science
Grade NMinimum
ScoreMaximum
ScoreMean
Standard Deviation
Alpha
5
Constructing and Reflecting 480 0 8 5.02 2.98 0.54Life Science 480 0 28 18.47 8.10 0.82Physical Science 480 0 20 12.51 6.59 0.75Earth Science 480 0 12 8.04 4.00 0.80
8
Constructing and Reflecting 547 0 8 3.44 2.77 0.26Life Science 547 0 28 18.68 7.49 0.78Physical Science 547 0 20 13.22 5.96 0.76Earth Science 547 0 12 8.34 3.80 0.77
11
Constructing and Reflecting 576 0 8 4.79 2.95 0.44Life Science 576 0 28 20.21 7.52 0.78Physical Science 576 0 12 7.75 3.95 0.62Earth Science 576 0 20 12.45 5.61 0.65

MI-ACCESS P/SI/FI Science Technical RepoRT | 2 0 0 7 - 2 0 0 8 | 8 1
Table 6.122007-2008 Operational Form Summary Statistics for Section Scores by Grade
Functional Independence Science
Grade NMinimum
Score
Maximum
ScoreMean
Standard
DeviationAlpha
5
Constructing and Reflecting 2127 0 4 2.36 0.91 0.17Life Science 2127 0 13 7.46 2.45 0.56Physical Science 2127 0 12 6.03 2.26 0.48Earth Science 2127 0 6 4.29 1.34 0.49
8
Constructing and Reflecting 2158 0 4 2.01 1.01 0.17Life Science 2158 0 14 8.45 2.63 0.60Physical Science 2158 0 14 6.85 2.60 0.54Earth Science 2158 0 8 3.64 1.54 0.24
11
Constructing and Reflecting 1875 0 4 2.11 1.11 0.31Life Science 1875 0 14 7.42 2.74 0.61Physical Science 1875 0 15 7.86 2.78 0.57Earth Science 1875 0 12 6.28 2.32 0.52

8 2 | MI-ACCESS P/SI/FI Science Technical RepoRT | 2 0 0 7 - 2 0 0 8
REFERENCES
AERA, APA, NCME. (1999). Standards for educational and psychological testing. Washington DC: AERA.
BETA (2006). Setting student performance standards on the Michigan MI-Access Participation, Supported Independence, and Functional Independence assessment instruments. Pleasant-ville, NY: Author.
Brennan, R. L. (2004). BB-CLASS: Beta-Binomial Classification Consistency and Accuracy, ver-sion 1.1. CASMA, University of Iowa, Iowa City, IA: Author.
Frey, W. D., Burke, D. A., Jakwerth, P., Lynch, L., & Sumpter, M. L. (1999). Addressing Unique Educational Needs (AUEN) of students with disabilities. Educational performance expec-tations for achieving functional independence in major life goals. Lansing, MI: Disability Research Systems, Inc.
Linacre, J. M. (2006). WINSTEPS Rasch measurement computer program. Chicago: Winsteps.com
Livingston, S. A. & Lewis, C. (1995). Estimating the consistency and accuracy of classifications based on test scores. Journal of Educational Measurement, 32, 179-197
MDE. (2001). Proposed plan for the development of alternate assessments for students receiv-ing special education services. Lansing, MI: Author.
MDE. (2002a). Draft guidelines for determining participation in state assessment for student with disabilities. Lansing, MI: Author.
MDE. (2002b). MI-Access state results, winter 2002. Lansing, MI: State Administrative Board, State of Michigan.
MDE (2005, April). The Assist: Helping to improve access to and make progress in the general curriculum 4 (3), p. 11, Lansing, MI: Author.
MDE. (2005a). Fall 2005 MI-Access coordinator and assessment administrator manual. Lansing, MI: State Administrative Board, State of Michigan.
MDE. (2005b). MI-Access Functional Independence assessment plan. Lansing, MI: Author.
MDE (2005c). Winter 2005 MI-Access Functional Independence 2.1 pilot coordinator and as-sessment administrator manual. Lansing, MI: State Administrative Board, State of Michi-gan.
MDE (2005/2006). 2005/2006 MI-Access handbook: How to understand, interpret, and use MI-Access results. Lansing, MI: State Administrative Board, State of Michigan.
MDE (2006/2007). 2006/2007 MI-Access handbook: How to understand, interpret, and use MI-Access results. Lansing, MI: State Administrative Board, State of Michigan.
MDE (2008). MI-Access assessment Plan: Science. Lansing, MI: State of Michigan.

MI-ACCESS P/SI/FI Science Technical RepoRT | 2 0 0 7 - 2 0 0 8 | 8 3
Thompson, S.J, Johnson, C.J, & Thurlow, M.L. (2002). Universal design applied to large-scale assessments (Synthesis Report 44). Minneapolis, MN: University of Minnesota, National Center on Educational Outcomes. Retrieved August 19, 2003 from the World Wide Web: http://education.umn.edu/NCEO/OnlinePubs/Synthesis44.html
Thurlow, M.L., Thompson, S.J., & Lazarus, S.S. (2006). Considerations for the administration of tests to special needs students: Accommodations, modifications, and more. In S.M. Down-ing & T.M. Haladyna (Eds.), Handbook of test development (pp. 653-673). Mahwah, NJ: Lawrence Erlbaum Associates Inc.
Tindal, G., & Fuchs, L.S. (1999). A summary of research on test changes: An empirical basis for defining accommodations. Lexington: University of Kentucky, Mid-South Research Resource Center.

Michigan Department of EducationOffice of Educational Assessment and Accountability608 West Allegan StreetP.O. Box 30008Lansing, MI 48909(517) 241-4416www.mi.gov/mi-access