Embed Size (px)
Citation preview
PARTICIPATION IN A NATIONAL, MEANS-TESTED SCHOOL VOUCHER
PROGRAM
David E. Campbell
University of Notre Dame
Martin R. West
Harvard University
Paul E. Peterson
Harvard University
Paper prepared for presentation at the annual conference of Associa tion for Public Policy
Analysis and Management, November 6-8, 2003, Washington, DC.

1
The Supreme Court’s 2002 decision in Zelman v. Simmons-Harris that
Cleveland’s school voucher program passes constitutional muster has renewed interest in
vouchers in states and localities across the United States. When considering this issue,
policymakers may wish to know the profile of the students who would move from the
public to the private sector if vouchers were provided. Would public schools be drained
of the most committed students and their parents? Or would vouchers simply foster
better matches between students and schools in both the private and public sectors? Here
we use data on applicants to the nation’s largest existing voucher program and a matched
sample of families who were eligible for the program to analyze the factors that lead
parents to move their children from public to private schools.
Our inquiry is motivated by the fact that the normative literature on school choice
has made two conflicting arguments. On the one hand, many observers argue that
vouchers will result in private schools “skimming the cream” from the public schools
(Elmore and Fuller 1996; Levin 1998; Hochschild and Scovronick 2003). The most
advantaged students – or at least those with the most advantaged parents – would transfer
from the public to the private sector. The competing perspective holds that vouchers will
facilitate the movement of the least educationally and economically advantaged students,
as it is this group whose parents are currently the least satisfied and face the most serious
obstacles to choosing the most appropriate schools for their children under the status quo
(Hoxby 2003, 10).

2
The Literature
For all of the controversy surrounding publicly funded vouchers, only a miniscule
percentage of students in the United States have actually had the opportunity to employ
them.1 Although some studies have evaluated these programs, many scholars have relied
upon indirect strategies to assess who would be most likely to exercise their option to
choose non-public schools under a market-oriented education system. One approach has
been to infer the impact of vouchers on attendance patterns from data on public and
private school enrollments under existing policy and market conditions (Buddin and
Cordes 1998; Betts and Fairlie 2001; Lankford and Wykoff 2001). Such inferences are
problematic, however, as the very motivation for a voucher system is to alter the status
quo. Predictably, the findings of this research tend to be most consistent with the “cream-
skimming” perspective outlined above.
Another approach has been to examine the process by which parents select their
children’s public or other secular schools where programs such as open enrollment plans
or charter schools or secular-only voucher programs offer some measure of choice among
them (Schneider, Teske, and Marschall 2000). Such research, however, leaves open the
question of whether choice within the public sector resembles choice between the public
and private sectors. Certain unique features of private schools, such as their ability to
1 In the 2002-2003 school year, publicly funded vouchers were used to attend private schools by 11,624 students in Milwaukee, Wisconsin, 4,948 students in Cleveland, Ohio, and 577 students in the state of Florida. In addition, Maine and Vermont paid tuition costs of some secondary school students residing in towns without a public school to attend private schools, while a number of states offer tax credits or deductions for private school tuition expenses (Education Commission of the States 2003; Howell, Peterson, Wolf, and Campbell 2002).

3
offer religious education and to decide which students they will admit, raise the
possibility of important differences.
Still a third approach has been to describe to survey respondents a hypothetical
voucher plan, and ask whether they would be likely to switch their child from a public to
a private school under such a system (Moe 2001). This research strategy is illuminating,
but leaves open the possibility that parents’ actual behavior will diverge from what they
say they would do in a telephone survey. Asking parents about their plans to transfer also
ignores the possibility that they would be unable to find a private school willing to accept
their child. This is a potentially important weakness, as scholars have argued that private
schools will systematically discriminate against those students who are most difficult to
educate (Brighouse 2000). In contrast to survey-based research, we are in a position to
test how parents have actually behaved when given the opportunity to switch their
children from public to private schools, and the extent to which they were successful in
pursuing this opportunity.
Our study thus complements recent work on private voucher programs (Howell,
Peterson, Wolf, and Campbell 2002; Howell forthcoming), as well as Witte’s (2000)
analysis of publicly funded vouchers in Milwaukee. Findings from these studies greatly
informed our own analysis. However, our project is distinct in that it analyzes a voucher
program with a national scope, which allows us to examine how differences across
communities affect the use of school vouchers. To our knowledge, it is the first study to
offer separate multivariate analyses of the determinants of application to a voucher
program and actual voucher use.
4
The Children’s Scholarship Fund
Because the design of a school voucher program may affect its impact on students
and society, conclusions about the impacts of any given program are most relevant for
those that share its essential characteristics. The privately funded Children’s Scholarship
Fund (CSF) program we examine here is of interest in part because its design is so similar
to the voucher programs that have been proposed and implemented by policymakers.
Established in 1999, the program is restricted to families with low-to-moderate incomes,
with the value of the tuition discount offered to families scaled to reflect their relative
financial need. In order to be eligible to receive a CSF scholarship (voucher), applicants
must have at least one child in grades K-8 and a total household income of less than 270
percent of the federally determined poverty line for a family of their size. The value of
the vouchers awarded is a function of recipients’ income level, household size, and the
cost of tuition at the private school they select.2 Families awarded CSF scholarships can
use them to send their children to religious schools; in fact over 92 percent of parents
participating in the program report that their child attends a private school with a
religious affiliation (Peterson and Campbell 2001).
Many characteristics of the CSF correspond closely to those of voucher programs
in Cleveland and Milwaukee, the two largest and longest-running government-funded
2 Families with an annual household income below the federally established poverty line qualify for a scholarship covering up to 75 percent of tuition at the private school of their choice. Families with incomes above this threshold, however, are only eligible to receive awards equal to 50 percent of their tuition payments, while the maximum award for those families with incomes greater than 185 percent of the poverty line is 25 percent of tuition.

5
voucher systems currently in existence.3 The House of Representatives has debated a
proposal to create a national, means-tested voucher program comparable to the CSF and
in September of 2003 passed legislation approving a similar program for the District of
Columbia. Meanwhile, Moe’s (2001) study of public opinion regarding school vouchers
suggests that Americans would be most likely to support a voucher program if it initially
has each of the features outlined above. If a voucher system is to prove politically
feasible, therefore, it seems likely to closely resemble the CSF program in its basic
design. 4
Fortunately, the CSF program is also well-suited for empirical study. It is the
largest voucher program in the United States, serving approximately 40,000 students.
With its national scope we can have confidence that any findings concerning selection are
not simply a reflection of a particular locality’s special characteristics. Moreover, because
the number of eligible applicants far exceeded the number of available scholarships,
recipient families were selected by lottery. 5 Portions of our analysis take advantage of
the random assignment of families to what can be considered treatment (voucher) and
control (no voucher) conditions.
We rely upon two unique surveys as our sources of data on the CSF. First is a
telephone survey of CSF applicants with children in grades 1 through 8 enrolled in public
3 One important exception is that the programs in Milwaukee and Cleveland do not require parents to supplement the vouchers with their own funds, though they allow parents to do so. Note that means-tested voucher programs like these are qualitatively different than a system in which vouchers are given to students in failing schools, as in Florida. 4 Moe’s study also demonstrates that Americans favor imposing certain limited regulations on private schools with regard to curriculum, academic performance, and admissions policies. To the extent that the CSF places no additional restrictions on participating private schools apart from existing state regulations, it is out-of-step with national public opinion on this issue. However, such measures would serve to ameliorate any detrimental consequences a voucher system might have on educational segregation. 5 If a family won the lottery, each of their children in the appropriate grade range was offered a scholarship.

6
school, randomly sampled from the universe of applicants whose eligibility had been
confirmed.6 Applicants were surveyed in the summer following the first school year after
CSF scholarships were awarded (2000); one parent in each family was interviewed. The
sample, drawn to match the overall geographic distribution of CSF applicants, included
three distinct groups of families: applicants who were not offered a voucher, applicants
who were awarded a voucher but remained in a public school, and applicants who used
vouchers to enroll in a private school.
To compare this sample of CSF applicants to the eligible population at large, we
use a similar survey administered to parents in a cross-section of families who were
definitely eligible for the program.7 We defined this group as families with children in
grades 1 through 8, who have low-to-moderate incomes (less than $40,000), and live in
cities with a population of 200,000 or more. These criteria do not precisely match those
used by the CSF; in reality, CSF families could have incomes above $40,000 and did not
have to live in an urban area. When comparing CSF applicants to the cross-sectional
survey of eligible families, we therefore exclude from the former survey applicants with a
household income of $40,000 or more and those not living in cities with a population of
200,000 or more to ensure the validity of the comparison. Our results should therefore be
6 The survey was administered by Taylor Nelson Sofres Intersearch, a professional survey research firm. According to the guidelines of American Association for Public Opinion (2000), the adjusted response rate is 46 percent. This response rate uses as its denominator an estimate of the percentage of eligible cases among the unknown cases generated by assuming that the percentage of ineligible households among those we interviewed is the same as the percentage among those we did not interview (43 percent). 7 The cross-sectional surveys were administered to members of a panel assembled by Knowledge Networks (KN) in the summer of 2000. KN panel members use Web TV, a device that provides access to the Internet through a television. KN’s panel is constructed using a probability sample of the U.S. population who are initially contacted by telephone, and data are weighted to account for non-response (either to the initial invitation to join the panel or the request to complete a particular survey). Although questions on the Internet survey were communicated in print form rather than orally, the questions were identical to those used in the phone survey of CSF applicants. Other research indicates that results from conventional RDD telephone and Knowledge Networks surveys are substantively similar (Berrens et al 2001).

7
interpreted as an analysis of a means-tested voucher program for urban areas with
somewhat stricter eligibility restrictions than the CSF.8
Two Processes: Application and Use
In principle, these two surveys would enable us to compare those urban families
attending private schools through the CSF with the urban population eligible for the
program. Although informative, this straightforward comparison obscures the fact that
the process of exercising school choice through a voucher program involves two distinct
steps. First is simply expressing an interest in receiving a voucher in order to transfer
from the public to the private sector, a relatively low-commitment act. The second is
actually using a voucher to make the switch – a step that requires a considerable
investment of parental resources. In addition to the financial commitment required to
make up for the gap in tuition left by the CSF voucher, parents also must gather
information about, and then actually apply to, at least one private school. Our data on
applicants allow us to model these two processes separately.
We might think of the difference between applying for a voucher and moving to a
private school as analogous to the difference between asking someone out on a date, an
act that requires some interest but little commitment, and getting married – which entails
the heavy commitment of a continuing relationship. Merely asking someone out on a
date, moreover, does not require him or her to accept the offer; actually getting married,
however, requires finding a partner that is not only suitable, but also willing.
8 We supplement both surveys with contextual information from other sources. Data about respondents’ public school districts are derived from the Common Core of Data, published by the National Center for Education Statistics, while other data about their communities comes from the U.S. Census Bureau.

8
The analogy suggests that while constraints on choice might lead to expressing an
interest in leaving one’s current public school (and thus applying to the CSF), this is
nonetheless a far cry from actually navigating all of the obstacles to enrolling in a private
school. A CSF voucher only subsidizes tuition. It is not a guarantee that a family will
find a private school that is a good fit for their child. Even if the family does locate the
right school, it does not ensure that child will meet the admission requirements. In short,
of all the potential obstacles to enrolling in the private sector, a voucher only helps to
ease the financial cost. Therefore, we expect that except for economic factors, within the
applicant pool similar factors will predict voucher usage as currently lead to private
school enrollment among the general public. However, we expect the applicant pool itself
to be enlarged to include a broader range of families interested in considering the voucher
opportunity.
Application
First we focus on the decision to apply for a voucher, and then we turn to a
family’s decision to enroll a child in a private school. Two types of factors should be
relevant for application: those creating parental interest in an alternative school, and
those hindering parents’ ability to enroll their child in one. While interest in school
vouchers should have numerous causes, ranging from the priority parents place on
education to the prevalence of private education in their community, the existing
constraints on school mobility are less varied. They consist primarily of limitations on
parents’ ability to select their preferred school either by purchasing a home in a public
school district of their choice, or by paying tuition for a private school.

9
Parental education: One measure of the importance a family places on education
for their child is the education obtained by the child’s mother. This is measured as a
categorical variable, with five categories ranging from less than a high school diploma to
an advanced degree. Previous research has suggested that families where the mother has
more education are more likely to use vouchers, although the differences in education
between voucher users and the eligible population have generally been slight (Witte
2000; Howell, Peterson, Wolf and Campbell 2002).
Parental Interest in Education: Parents who are interested in a child’s education
are more likely to be both more actively engaged in their child’s education and more
likely to consider private education as an option for their child. We measure parental
interest in education with a question about attendance at parent-teacher conferences.9
Using a similar measure in evaluating Milwaukee’s voucher program, Witte (2000)
concluded that voucher applicants are more engaged in their children’s education than are
non-applicants.
Per-pupil expenditures: The more successful the local public school dis trict, the
less need parents should see for the private sector. We therefore expect an inverse
relationship between the quality of a child’s public school and demand for vouchers.
While it is not simply the case that greater expenditures mean higher quality (Hanushek
2003), per-pupil expenditures seem a reasonable proxy for perceived quality – especially
given the conventional wisdom among the public that more money means better schools.
The model thus includes the per-pupil spending in each respondent’s public school
9 The specific question is: “How many parent-teacher conferences did you or someone else attend for <child’s name> this school year?” (responses ranged from 0-5, with “more than five” coded as 5).
10
district, as reported in the Common Core of Data (published by the National Center for
Education Statistics). We also include in the model squared per-pupil spending to allow
for the possibility of a curvilinear relationship between spending and voucher application.
In other words, since many of the nation’s failing urban school systems actually have
high levels of spending, it could be that at the upper reaches of per-pupil expenditures,
voucher applications level off or even become more, rather than less, likely.
Teacher-student ratio: We also include the ratio of teachers to students as a
measure of students’ class size. It is widely thought that smaller classes are to be
preferred and parents can be expected to share this belief. Teacher-student ratios for each
district are also compiled from the Common Core of Data.
Satisfaction with the Public Schools: In addition to an “objective” indicator of
school quality like expenditures, it is likely that parents’ satisfaction with their child’s
school is also a function of personal experiences and preferences that cannot be captured
with a blunt measure of school resources. For example, Witte (2000, 68) finds that
parents who enrolled in Milwaukee’s voucher program scored one-third of a standard
deviation lower on a scale measuring satisfaction with their public schools than those
who were not in the program. Similarly, Howell, Peterson, Wolf, and Campbell (2002)
report that voucher recipients who switch their children from public to private schools are
far more satisfied with their schools than comparable families whose children remain in
public schools, although this is different than comparing people who simply apply for a
voucher with the relevant public school population. Parents were asked to rate their
satisfaction with each of five aspects of their child’s school – academic quality, safety,
location, discipline, and the values it teaches – on a four point scale: very satisfied,

11
satisfied, dissatisfied, and very dissatisfied. We report each dimension of satisfaction
separately.
Religious Affiliation: Because most private schools are affiliated with a specific
religious denomination, we might also expect voucher application to be more common
among parents who are looking for a particular moral environment in which to educate
their child. We thus measure the percentage of families who report being Catholic,
traditionally a group with an historic presence in the private school market. We also
report the proportion who identify themselves as “born-again” Christians a group that
may perceive public schools as hostile to their values and traditions. We also measure the
frequency of attendance at religious services as an indicator of religious commitment.
Frequent attendance at church services may also provide respondents with a social
network through which they can learn about private schools, particularly those affiliated
with their denomination. Church attendance is measured with a binary variable for
whether the respondent attends religious services at least weekly.
Duration In Current Residence: Families living in the same residence for an
extended period of time exhibit a degree of economic stability that may also make them
more likely applicants for a voucher program. Specifically, we might expect that families
that have put down roots in their community will be more willing to consider the long-
term investment a private education entails. Also, residential stability implies that a
respondent has more had time to develop the types of informal social networks known to
be an important source of information for consumers in educational markets. We thus

12
measure the length of time that a family has lived in its current residence, using a dummy
variable for whether the family has lived at the same address for two years or more.10
Percentage of Students in Metropolitan Area Attending Private School: One
factor that has been largely ignored in the previous literature is simply the prevalence of
private schools within a community. Across the United States, there is tremendous
variation in the proportion of the school-age population that attends private schools. In
communities where private education is more common, we hypothesize that parents are
more likely to consider the private sector as a viable option for their children. The model
thus includes the percentage of students enrolled in private school within the metropolitan
area, as reported by the Census Bureau.
Constraints on Choice
All the factors listed above should increase parents’ interest in private education
as an option for their child, and thus their propensity to apply for a CSF voucher. We
also expect, however, that over and above these factors the parents most likely to apply
for a voucher are those who face the most serious obstacles to enrolling their child in the
school they prefer under the current policy regime. Our analysis focuses on two such
constraints: income and race.
Family income: A low income makes it difficult to find housing in desirable
public school districts, since school quality is a major factor driving the price of
10 Unfortunately, the question on the survey about residential stability produced little variation. “Two years or more” was the option at the top of the range, which turned out to be the modal category.

13
residential real estate (Black 1999).11 Families with limited income are also the least able
to pay private school tuition. As we would therefore expect, previous research has found
that voucher applicants have a lower income than eligible non-applicants (Witte 2000;
Howell forthcoming). We thus hypothesize that a family’s income will have a negative
impact on voucher application. Household income is measured using a categorical
variable, and is based on respondents’ self-reports.12
Race: Given the volatile history of race and education in America, we also
account for race as a possible constraint on mobility among schools. Public opinion
research has suggested that vouchers enjoy considerable support in the African American
community (Moe 2001), one reason for which might be that blacks feel that they have
fewer educational options than whites. For example, racial discrimination in the housing
market – of which there is considerable evidence – could limit the ability of blacks to
purchase a home in a public school district of their choice (Howell, Peterson, Wolf and
Campbell 2002). We therefore expect that African Americans will be more likely to
apply for vouchers than whites. As with the above measure of educational attainment, we
employ a measure of the mother’s or female guardian’s race (except in the extremely rare
case where there was only a father or male guardian in the home, in which case his race is
used). Race is coded as white, black, Hispanic, or other minority.
White Flight : Some observers have suggested that vouchers would facilitate
“white flight,” whereby white families exit public schools with heavily minority
populations. Based on current private school enrollment, Fairlie and Resch (2002, 32)
11 Black’s (1999, 578) results indicate that a one standard deviation increase in local school test scores leads to a 2.1 percent increase in what a marginal resident is willingness to pay for a home in that area. 12 There are four annual income categories: (1) less than $10,000; (2) $10,000-$20,000; (3) $20,000 - $30,000; (4) $30,000 to $40,000.

14
find “some evidence of white flight to private schools from minority schoolchildren”
although other studies have failed to find a systematic relationship between the racial
composition of a community’s public schools and private school enrollment (Lankford,
Lee, and Wykoff 2001). The empirical examination of this question, however, has been
hampered by the fact that previous analyses of voucher programs have been restricted to
individual cities, severely limiting variation in the racial composition of the public
schools. Since the CSF is a national program, we are able to put the white flight
hypothesis to a rigorous test. Drawing from the Common Core of Data we have
compiled the percentage of minorities in each respondent’s public school district, which
enables us to see whether voucher applicants are more likely to live in districts with a
large minority presence, and whether whites in particular react to the racial context of
their community. Specifically, our model employs an interaction term between being
white and the percentage of minority students in a respondent’s public school district –
which allows us to test the “white flight” hypothesis. If whites are using vouchers to exit
districts with a heavy minority population, this interaction term should be positive and
statistically significant.
Learning Disability: Finally, we also test whether parents of children with a
learning disability are more or less likely to apply for a voucher. In this case, our
expectations are not clear. On the one hand, it could be that parents of the learning
disabled have an increased demand for school choice if, on average, they do not feel that
the public schools adequately accommodate their child’s needs. On the other hand,
however, perhaps parents of children with learning disabilities are less likely to consider

15
the private sector, since private schools are not legally required to accept disabled
children.
We begin by comparing the characteristics of applicants to the Children’s
Scholarship Fund (with annual family incomes of less than $40,000 and with children
who were in public school at the time of application) to families who met the eligibility
requirements but did not apply.13
<Insert Table 1>
Table 1 displays these bivariate comparisons, which generally conform to our
expectations. Families who applied for a CSF voucher have mothers with more
education, and have parents who attend more parent-teacher conferences than those who
did not apply. But while these differences are statistically significant, substantively the
gaps are modest. Per-pupil expenditures in the local public school district show no
difference between applicants and the eligible non-applicants, suggesting that spending
on public schools does not drive the demand for school choice. Not surprisingly, parents
who applied for vouchers are less satisfied with their current public school than non-
applicants, with statistically significant differences for every dimension of satisfaction.
Applicants are no more likely to be Catholic, but they are far more likely to identify as
13 For most of the factors we examine, we are able to compare all of the applicants to the non-applicants. For parental satisfaction and involvement, however, we must restrict the comparison to the group of applicants that did not subsequently win the lottery, since the survey was administered one year after vouchers were awarded and we are interested in satisfaction with and involvement in public schools attended prior to applying. Since CSF selected voucher recipients randomly from among the pool of eligible applicants, however, this should not affect the validity of the comparison. Comparing non-recipients and non-applicants leaves open the possibility that applicants not awarded vouchers may have grown more dissatisfied with their public schools as a result of not receiving a voucher. However, since voucher application appears to be a low-commitment act, there is little reason to expect not winning a voucher to have a substantial effect on satisfaction or involvement. Research on similar voucher programs for which data on applicants not awarded vouchers is available before and after the lottery was conducted confirms that this is not an important consideration (Howell, Peterson, Wolf, and Campbell 2002, chapter 7).

16
“born-again” (i.e. evangelical) Christians. While 40 percent of applicants are born-again
Christians, only 8 percent of non-applicants are. 14 Applicants also attend church more
frequently than non-applicants: 63 percent of those who applied for a CSF voucher attend
church at least once a week, as compared with just 36 percent of the eligible population.
We also see that voucher applicants have deeper roots in their communities, as 80
percent have lived in their current home for two years, compared to 69 percent of non-
applicants. And, as expected, applicants live in communities where private schools have
a greater presence. On average, applicants live in a metropolitan area where 13 percent
of K-12 students attend private school, while in non-applicants’ communities private
schools claim only 4 percent of the population.
In addition to these factors which lead to a preference for school choice, we also
have reason to believe that voucher applicants are less able to act on that preference in the
absence of a voucher system than eligible non-applicants. For one, their income is lower.
While the income gap is not dramatic, we do find a statistically significant difference in
the household income of applicants and non-applicants.
The next analytical step is to enter each of these demographic variables in a single
model predicting application to the Children’s Scholarship Fund. However, correctly
inferring their impact is complicated by the fact that our data are not drawn from a single
sample of the relevant population. Notwithstanding the considerable number of CSF
applicants, they still represent only a small fraction of the eligible population, and thus a
tiny proportion of the overall U.S. population. Obtaining an analytically useful number
14 Note that the high percentage of born-again Christians is at least partly due to the fact that the applicants have a large proportion of African-Americans who are far more likely than whites to report being a born-again Christian (49 percent versus 27 percent).

17
of CSF applicants in a random draw of the general U.S. population would require a
prohibitively large sample. We employed a more efficient strategy. As described above,
we drew a sample of CSF applicants and then a separate sample of eligible nonapplicants.
In other words, we have a choice-based or endogeneous stratified sample, or what
epidemiologists call a case-control research design (King and Zeng 2001). We have, in
effect, selected on the dependent variable by oversampling families that applied to the
CSF. Models similar to this one can be found in the literature (Witte 2000), but are
biased without correcting for the use of a choice-based sample.
We adapt the common logit estimator to account for the endogeneity inherent in
the research design, using the method of prior correction described by King and Zeng
(2001). They detail how this method can account for the bias in our sample.15
Essentially, this consists of estimating a logit model and adjusting the model’s parameters
based on the proportion of 0s and 1s in the population, a technique known as rare-events
logit. Producing correct results thus requires an estimate of the incidence of 1s, or in this
case CSF applicants, in the population. We estimate that nationwide approximately 4
percent of the eligible population applied for a CSF scholarship. Because we restrict our
analysis to metropolitan statistical areas, where the application rate is likely to have been
somewhat higher than in non-urban areas, we use a range for the application rate of 4% to
8%. The substantive implications of our results do not change when we experiment with
other application rates that are within a range of four percentage points either way (that
is, as low as 0% to 4% or as high as 8% to 12%).
15 Tomz, King, and Zeng (1999) provide software for this method—what they label ReLogit (Rare events Logit)—which operates as a command file within STATA. Software available online at http://gking.Harvard.edu.
18
In addition to all of the variables listed in Table 1, our multivariate analysis of
CSF application adds a few more. First, we also control for whether the respondent lives
in a metropolitan area targeted by CSF for promotional efforts—a dummy variable
indicating whether program operators identified their area for radio ads and other forms
of advertising. 16 We also account for possible regional variation by accounting for
whether respondents were in one of four Census regions: the Northeast, Midwest, West,
and South (with South as the excluded category).
Because the satisfaction scores are highly correlated with one another, we follow
the example of Howell (forthcoming) to isolate the impact of each. We regressed each of
the five satisfaction scores on the other four, saving the residuals. The model thus
includes the residuals – which are “purged” of the inter-correlation among the satisfaction
items – rather than the satisfaction scores themselves.
<Insert Table 2>
Table 2 displays three models. The first omits the measures of parental
satisfaction and involvement, since including these variables in the model requires us to
limit the applicant portion of the sample to only those respondents who did not win the
CSF lottery (the control group). The second model contains exactly the same set of
variables but only includes applicants who were not selected to receive a voucher, in
order to ensure that restricting the sample in this way does not distort the statistical
16 This information was provided by the staff of the Children’s Scholarship Fund in personal correspondence with the authors. The level of specificity with which CSF focused its advertising efforts generally coincided with census MSA classifications. Where the program instead targeted a larger region, such as an entire state, each MSA within the region was coded as a one. When the targeted region was smaller, the entire MSA was assigned the value of one.

19
relationships observed in the full sample.17 If the vouchers were awarded randomly,
columns 1 and 2 should be substantively identical. The results of the two models are
very similar, giving us confidence that the randomization was successful. Almost all of
the variables common across the two models retain the same sign and significance level,
and in no case does a statistically significant variable change its sign from one model to
another. In a few cases, variables slide from statistical significance to non-significance,
but this is not surprising given the smaller sample size in column 2. Having thus
confirmed that omitting the lottery winners from the analysis does not distort the
inferences drawn from the model, the third column adds parental involvement
(attendance at parent-teacher conferences) and the satisfaction measures.
Because these models are all so similar, we focus our discussion on the final, and
most complete, one. We begin with the factors that we expected to increase the demand
for private education. For the most part, the multivariate results confirm the bivariate
comparisons in Table 1. Having a mother with a higher average level of education and
parents who attend more parent-teacher conferences both increase the probability of
applying for a voucher. Interestingly, of the five satisfaction measures only two reach
statistical significance – satisfaction regarding the safety and location of a child’s current
public school. As expected, greater satisfaction means a lower likelihood of applying for
a voucher (and thus we observe a negative coefficient). Satisfaction with academic
quality, discipline, and the values taught in the school do not achieve statistical
significance (although the measures for academic quality and values are in the expected
direction).
17 This is a concern because we have no baseline data on the CSF applicants. That is, we cannot observe the satisfaction levels of CSF applicants before they applied to the program.

20
Regarding religious values, being Catholic or a born-again Christian (categories
that generally do not overlap) increase the likelihood of applying for a voucher.
Applicants are also more likely to live in metropolitan areas where private schools have a
greater share of the education market.
The multivariate model also reveals that, all else equal, per-pupil expenditures in
the respondent’s public school district are, as anticipated, a negative predictor of voucher
application. In general, the more money that is spent in a district, the lower the
likelihood of applying for a voucher. However, the relationship between public school
budgets and voucher application is not as simple as it first appears, as we also see that the
squared term for per-pupil spending is positive. In other words, in those districts at the
upper reaches of spending, the negative relationship between spending and application
begins to level off. Teacher-student ratio has no impact in either model. Surprisingly,
promotional efforts by the Children’s Scholarship Fund were less successful than one
might expect; they fall short of statistical significance in the final specification.
Next, we turn to the constraints on a family’s ability to exercise school choice.
As expected, the greater a household’s income, the lower the likelihood of applying for a
voucher. Whites are less likely to apply for a voucher than are African Americans (who
are the baseline category), although there is no difference between the application rates of
African Americans and either Hispanics or members of other minority groups.18 In both
cases, we see no evidence of cream-skimming. Indeed, we see the opposite, as it is
families who face the greatest hurdles to choosing the most appropriate school for their
child who were most likely to apply for a CSF voucher. In particular, the fact that
18 The “other minority” category is composed of Asian Americans, Native Americans, and Pacific Islanders, of which Asian Americans constitute the largest category.

21
African Americans are more likely to apply than whites underscores the demand for
greater educational options within the black community.
There is no evidence tha t the percentage of minority students in a district affects
the voucher application rate. Nor does it appear to be the case that racial context affects
whites specifically, as the interaction term between white and percentage minority in the
applicant’s district cannot be distinguished from zero. Finally, we observe that parents of
students with learning disabilities are neither more nor less likely to apply for a voucher.
Because Table 2 includes coefficients from logistic regression, the interpretation
of their relative magnitude is non- intuitive. To facilitate comparison of each factor’s
relative impact, the final column displays how the probability of voucher application
changes as a function of changes in each of the substantive variables with statistically
significant impact on application rates, while holding every other variable constant at its
mean. Dichotomous variables were shifted from zero to one, ordinal variables from their
minimum to maximum values, and continuous variables from their 20th to 80th
percentiles. Not surprisingly, the levels of satisfaction regarding the safety and location of
the public schools have some of the largest impacts on application, dropping the
probability of applying for a voucher by 8.7 and 8.3 points respectively. Moving from a
metropolitan area at the 20th percentile to one at the 80th percentile increases the
probability of voucher application by about 7.3 percentage points.19 Having a mother who
holds an advanced college degree rather than having dropped out of high school increases
19 Since these are individual-level probabilities, they technically should be reported on a 0-1 scale. We have chosen to discuss percentage points instead to remind the reader that our results should be interpreted as the changes in aggregate percentages.

22
the probability of application by about 4 points, which is about the same as the impact of
attending five or more parent-teacher conferences in a year compared to none.
The impacts for identifying as a Catholic or born-again Christian are comparable,
with positive impacts of about 3.7 and 5.5 points respectively. Relative to African
Americans, whites are about 4.5 points less likely to apply. Moving from the lowest
category of family income to the highest decreases the probability of applying by 2.3
points. To gauge the impact of per-pupil expenditures, both the linear and squared terms
must be varied simultaneously. An increase in the per-pupil expenditure from the 20th to
80th percentile, leads to a drop in the application rate of 8.9 points, but that is reduced to
1.6 points when we account for the squared term.
With these results in mind, we can construct a profile of applicants to a voucher
program restricted to families with relatively low incomes. When compared to eligible
non-applicants, parents who submitted an application for a voucher have a higher level of
education and are more involved in their current schools – two factors that suggest a
creaming process – but the impact of these factors is relatively small. Taken as a whole,
the results of the multivariate analysis of application suggest that the typical voucher
applicant has a high demand for increased schooling options but is constrained in
fulfilling that demand. Thus, not only are applicants more likely to express a strong
commitment to their child’s education, they are also more likely to be dissatisfied with at
least some aspects of their current school. In addition, we see that religious affiliation
has an impact on the decision to apply for a voucher. The fact that both Catholics and
born-again Christians are more likely to apply suggests that either parents with these
religious beliefs are pushed to consider private education because of dissatisfaction with

23
the moral environment of their current public school, or that they are pulled to the private
sector because so many private schools have a religious character – or, most likely, both.
We also see that the more prevalent private education is in a community, the more likely
a family is to apply for a voucher. This is likely because private education is a more
salient option in communities where a greater percentage of students attend private
schools, perhaps because of explicit marketing efforts on the part of private schools, or
simply because parents are more likely to know other families whose children attend
private schools.
Making the Switch
An analysis of who applies for a voucher reveals a latent interest in the private
sector but does not tell us who, upon receiving the offer of a voucher, follows through
and actually switches their child from a public to a private school. As mentioned above,
receiving a voucher is merely the first step. Under any voucher plan, parents must still
identify a private school they believe to be a good fit for their child and gain admission to
that school. In many cases, parents have to arrange for their child’s transportation to and
from school, as most private schools do not provide busing like their public counterparts
do. And in the case of the CSF, parents must still come up with enough money to cover
the tuition not paid by the voucher.
The importance of these obstacles is evidenced by the fact that the usage rate for
CSF vouchers was relatively low; only about 1/3 of CSF applicants who won the lottery
actually enrolled their child in a private school. The low rate of voucher usage within the
CSF program suggests that policymakers should be careful not to underestimate the

24
difficulty of navigating the barriers to attending a private school. While the debate over
vouchers has centered on easing the financial cost of private school tuition, these other
costs are relevant too. Money is not the only thing that matters as parents decide whether
to switch a child from a public to a private school.
<Insert Table 3>
Our general hypothesis, then, is that while receiving a voucher will ease (although
not remove) the financial burden of attending a private school, other factors that we
would expect to facilitate private school enrollment absent vouchers should still be
relevant. As before, our first cut consists of a simple bivariate comparison, as displayed
in Table 3. Here we compare the characteristics of two groups among the CSF lottery
winners: the users (those who enrolled their child in private school), and the decliners
(those who did not). We display all of the same variables used in predicting application
to the program in order to be able to compare the decision to apply for a voucher with the
decision to use one.
As we hypothesized, there is no difference in the family income of users and
decliners, suggesting that even though the CSF vouchers did not cover 100% of tuition,
income was not a factor determining who went private. This means the program worked
as it was designed to, as CSF employed a sliding income scale to determine the amount
of each family’s voucher; families with lower incomes received larger vouchers.
However, both religion and race are significant factors. Catholics are more likely to
enroll in a private school, as are whites, while both African Americans and Hispanics are
under-represented among the users relative to their proportion among the decliners.

25
Users are more likely to attend religious services weekly than are decliners.
Admittedly, it is possible that church attendance is an effect, not a cause, of voucher
usage. Since our data were collected one year after application, this result could be due to
the fact that enrolling children in religious schools leads parents to attend church more
frequently. In the CSF data, we have tested for this possibility by estimating a simple
model in which church attendance is the dependent variable, and private school
attendance is predicted using the offer of a voucher as an instrument. The coefficient for
switching from the public to private sector is not statistically significant. However, we
should note that similar models using data from private voucher programs in New York
City, Washington, DC, and Dayton, Ohio have found that switching from public to
private school does increase religious involvement, so we are hesitant to rule out the
possibility that church attendance is itself affected by enrolling in a private school. Most
likely, both factors reinforce one another.
Church attendance is both a measure of religious engagement and the social
network one develops from regular attendance at a church (or synagogue, mosque, etc.).
Schneider and his colleagues (2000) have demonstrated that social networks are an
important avenue of information about the local education environment – a broader social
network means the ability to gather more information about a community’s private
schools. Additional evidence consistent with the notion that social networks play a key
role as families exercise school choice is found in the fact that users exhibit greater
residential stability than decliners. Deeper roots in a community presumably facilitate
social networks through which parents can acquire information about private schools.

26
We also see that users are less likely to have a child who has been diagnosed as
having a learning disability, suggesting that it is difficult to find a private school to
accommodate children with special needs, especially given the modest size of the CSF
vouchers. Interestingly, on average users live in districts with higher per-pupil spending
than decliners, though the difference is relatively small (about $400). Users also live in
metropolitan areas with a slightly higher average percentage of students enrolled in
private schools. And, contrary to the white flight hypothesis, users live in public districts
with a smaller percentage of minority students than families who opt to keep their
children in public school.
<Insert Table 4>
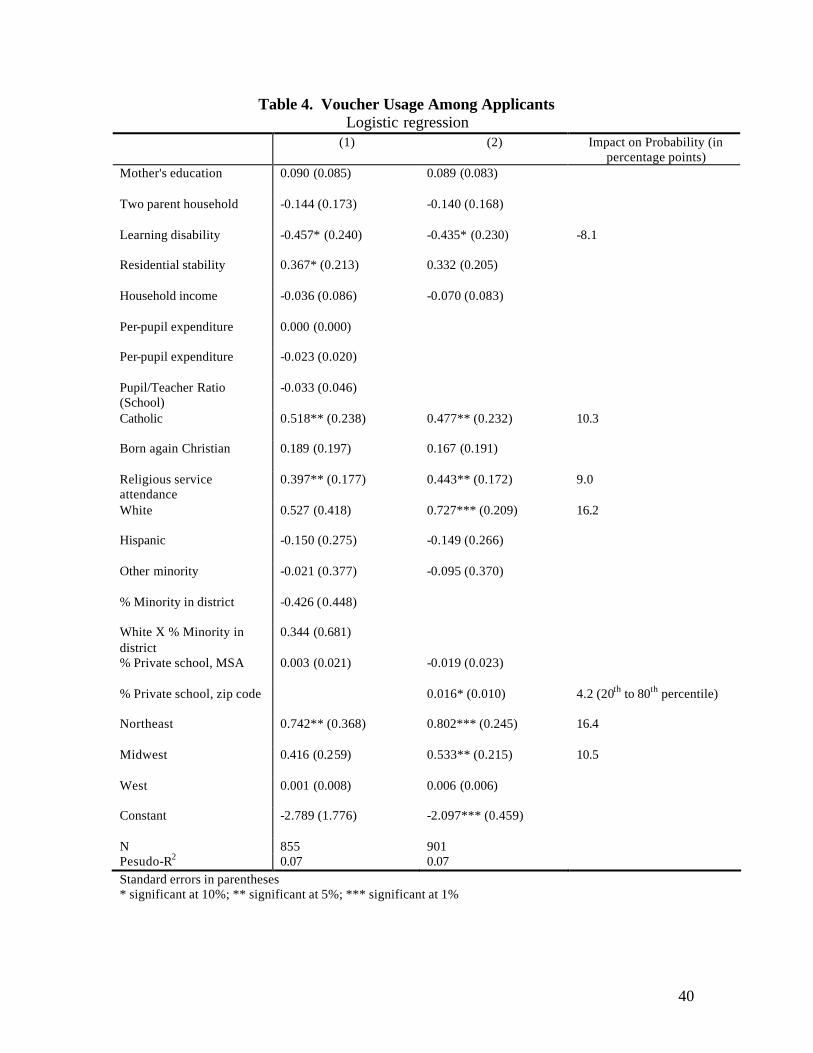
The more interesting results, however, come from the multivariate model. Again,
we have a dichotomous dependent variable – whether a family used the voucher or not –
and thus use logistic regression. With no need in this case to account for a choice-based
sample, we use a standard logit model. The first column of Table 4 displays a model that
includes essentially the same variables as in the first column of Table 2. (The sole
exception is the control for CSF marketing, which is not relevant to this analysis.) The
results are illuminating, as we see that some of the factors that showed statistically
significant differences between users and decliners in Table 3 fail to achieve significance
in the multivariate model. For example, the percentage of minorities in the school district
has no impact. Nor do whites in particular respond to living in a racially heterogeneous
environment. Similarly, the level of spending in the local district does not affect voucher
usage. The percentage of students enrolled in private schools across the metropolitan area
also fades into statistical insignificance. For other factors, though, the story does not

27
change in a multivariate setting. As we saw in Table 3, families with a learning disabled
child are less likely to use a voucher, while those who have lived in their current
residence longer are more likely to go private. Catholics are more likely to switch from
the public to the private sector, as are families who attend religious services weekly.
Notably, as we saw in the bivariate results, household income has no impact on
voucher usage. Within the applicant pool, the decision to enroll a child in a private school
does not appear to depend on a family’s income, even though the CSF vouchers do not
cover all of tuition.
Our conclusions regarding the importance of race are less clear. With this
specification, the coefficient for whites is positive, but lies outside the conventional
threshold for statistical significance at p < 0.20. However, the presence of the interaction
term White X Percentage Minority potentially obscures the impact of White, since these
two variables are obviously correlated with one another (inflating the standard error of
White). Thus, the second column of Table 4 displays a second model from which White
X Percentage Minority has been omitted, which we feel justified in doing because it has
no impact on voucher usage. The model also omits the other district- level measures on
expenditures and pupil- teacher ratios, since these also have no effect.
There is one other difference between the models in columns 1 and 2. In addition
to the percentage of private school students in a family’s metropolitan area we also
include the same measure for a smaller geographic area, the zip code. We do this based
on the simple assumption that parents generally prefer to have their children attend
school close to home. While private schools across the metropolitan area might serve to
raise the salience of private education generally, when faced with the opportunity to send

28
a child to a private school, parents are going to look at what is reasonably close by,
especially since most private schools do not provide transportation. Furthermore, to the
extent that parents learn about private schooling options through their social networks,
we would expect those networks to be centered within their localized community, which
is better approximated by their zip code than the metropolitan area.
When the private school population at the levels of both the metropolitan area and
zip code are included in the same model, the zip code coefficient is positive and
statistically significant (p < 0.10), even though these measures are highly correlated.
When only the zip code measure is included in the model (not shown), it is significant at
p < 0.03 and its magnitude is essentially unchanged.20
With the removal of the interaction term between race and the racial composition
of the local public school district, the coefficient for White increases in both size and
significance. In other words, compared to blacks, whites are more likely to enroll a child
in a private school when given a voucher, although they are less likely to apply for a
voucher in the first place.
We must stress that with these data, it is not possible to determine why blacks did
not enroll in private schools at the same rate that they applied for vouchers. Nonetheless,
some possibilities present themselves. Religion is likely a factor explaining why blacks
do not use vouchers at the same rate that they applied for them. Catholic schools have the
largest share of the private school market, and few African Americans are Catholics.
Even though Catholic schools may generally welcome black students (Bryk, Lee, and
20 Note that the zip code measure is nowhere near statistically significant when included in a model of application alongside the percentage of private school students in the metropolitan area.

29
Holland 1993), parents might nonetheless be reluctant to send their children to a school
run by a church different than their own. Similarly, schools with a predominantly white
student body may have a difficult time attracting black students. And, of course, some
private schools may engage in practices that discourage the enrollment of black students,
whether deliberately or not.
Finally, it could be that the high rate of application actually leads to the relatively
low rate of usage among African Americans. The high percentage of black applicants
may indicate that, on average, there was less self-selection, and perhaps less pre-
commitment to using the voucher, on the part of African Americans who submitted their
names to the CSF. If as a consequence the average black family among voucher
applicants was less committed to using a voucher upon its offer than a white family, the
take-up rate among African Americans would be lower.
The contradictory results for application and usage among African Americans
obviously raise the question of whether, when both stages of the decision process are
combined, African Americans are more or less likely than whites to end up in private
schools. We will address that question in the concluding section.
Column 3 of the table translates the logit coefficients from the model presented in
column 2 into impacts on the probability of using a voucher upon being offered one. In
terms of relative magnitude, the largest impact is for race – being white (versus black)
increases the probability of using a voucher by 16.2 percentage points. Being Catholic
increases the probability by just over 10 points, attending church weekly by 9 points.
Moving from the 20th to the 80th percentile in the percentage of students in private school
within one’s zip code results in a 4.2 point gain in the probability of using a voucher.

30
Having a child with a learning disability drops the likelihood of accepting a voucher by
8.1 points.
In sum, there are both similarities and differences between the factors that
influence application and usage. Religion, for example, has a similar effect on both
processes. However, while income has a negative relationship to the likelihood of
applying for a CSF voucher, it has no relationship to the decision to use a voucher once
offered. Race’s impact, meanwhile, turns 180 degrees from one model to the next:
compared to African Americans, whites are less likely to apply but more likely to use.
Comparing Users and Eligible Non-applicants
We conclude by seeing how the dual processes of application and usage add up,
by comparing families who switched to the private sector upon receiving a voucher
(users) with those who were eligible for the program but did not apply (non-applicants).
For example, given that African Americans are more likely than whites to apply for a
voucher but less likely to go private upon receiving one, are voucher users as a group
more or less likely to be black than the eligible population? By answering this question
for the Children’s Scholarship Fund, we hope to shed light on the probable consequences
of other voucher programs with similar characteristics.
<Insert Table 5>
We turn first to the question with which we began: whether vouchers would
“skim the cream” from public schools as the best students with the most committed
31
parents abandon public education in favor of the private sector. The bivariate comparison
between users and eligible non-applicants displayed in Table 5 suggests that the answer
depends on the comparison being made.
There is no evidence whatsoever of cream-skimming with respect to income,
although recall that this is at least partly owing to the design of the CSF program. In fact,
lower income families were actually more likely to apply to the program, while income
was not a significant factor predicting who used a voucher upon receiving one. Overall,
there is no statistically significant difference in the family income of users and eligible
non-applicants. In other words, the CSF program accomplishes its objective of removing
income as a constraint on private school enrollment, even though it requires families to
pay a portion of their child’s tuition.
When we direct our attention to parental education, however, we see that users are
modestly more advantaged than non-applicants. Mothers in voucher-using families have
a higher average level of education, a point that is perhaps made clearer when we note
that among families who used a voucher to go private, 24 percent of mothers have a
college degree compared to 12 percent of mothers within the eligible non-applicant
families. Similarly, users have deeper roots in their communities than non-applicants.
While there is a slightly lower percentage of students with learning disabilities among the
voucher users, the difference is not statistically significant.
The story for race is quite complex. On one hand, the proportion of African
Americans applying to the CSF far exceeds their share of the eligible population. On the
other hand, African American applicants are less likely than white applicants to use a
voucher when awarded one – that is, actually enroll a child in private school. However,
32
even with their reduced likelihood of using a voucher upon being offered one, the
population of users still has a much larger proportion of African Americans (42 percent)
than the eligible population (28 percent). Conversely, Hispanics are under-represented
among the users (15 percent versus 27 percent). The fact that the coefficient on Hispanic
was statistically indistinguishable from that on Black in the multivariate models of both
application and usage (each of which included regional control variables) suggests that
this disparity may at least partly be a reflection of the fact that both the Children’s
Scholarship Fund and private schools are concentrated in areas of the country where there
are relatively few Hispanics.
The religious profile of users and non-applicants differs sharply, with users far
more likely to identify as “born-again” Christians and attend religious services weekly.
(Interestingly, however, while users are also slightly more likely to be Catholic, the
difference is not statistically significant ). Religion is clearly a critical factor driving
demand for private education among public school families. This conclusion is
consistent with that of Howell’s (forthcoming) study of privately funded vouchers in New
York City, which found religiosity to be an important predictor not only of voucher usage
during the first year of the New York City program, but also of whether families
remained in a private school in subsequent years. By examining families only in the first
year they were awarded vouchers, our analysis may actually understate religion’s true
importance.
Even so, it is important to note that we do not know the extent to which the
demand for private education among religiously committed families is actually a function
of supply – the fact that most private schools have a religious character. If a voucher
33
system increased the supply of secularly-oriented private schools, perhaps religious
factors would no longer have such a potent impact on private school enrollment, as more
parents without a religious background would find private schools that meet their needs.
In sum, we find the cream-skimming metaphor inadequate to describe the process
we observe. Instead, we find Hoxby’s argument that vouchers relax constraints on school
mobility compelling. The profile of the voucher users is consistent with the description of
families who have a strong preference for greater educational opportunities for their
children – greater parental education, higher levels of religious involvement – but face a
financial obstacle to acting on their preferences. This would also explain why African
Americans disproportionately applied to the program, as we suspect that many African
American parents combine a preference for better schools with constraints on their ability
to act on that preference.
We must stress, though, that our study cannot speak to the consequences of a
voucher program on a much broader scale than the CSF. A larger voucher program could
do more than simply loosen the constraints on a latent demand for private education, and
encourage the establishment of new schools in the private sector. These new schools
would presumably differentiate themselves from what is already available in the
education market. We might, for example, see more secularly oriented schools, and
schools with a wider array of curricula than is currently available. Under such a scenario,
still other factors will shape school choice.

34
Bibliography
American Association for Public Opinion Research. 2000. “Standard Definitions: Final Dispositions of Case Codes and Outcome Rates for Surveys.” Ann Arbor, MI. Berrens, Robert P., Alok K. Bohura, Hank Jenkins-Smith, Carol Silva, and David L. Weimer. 2001. “The Advent of Internet Surveys for Political Research: A Comparison of Telephone and Internet Samples.” Betts, Julian R., and Robert W. Fairlie. “Explaining Ethnic, Racial, and Immigrant
Differences in Private School Attendance,” Journal of Urban Economics, 50 (2001), 26-51.
Black, Sandra E. “Do Better Schools Matter? Parental Valuation of Elementary
Education,” Quarterly Journal of Economics, 114 (1999), 577-599. Brighouse, Harry. School Choice and Social Justice. (Oxford: Oxford University Press,
2000). Bryk, Anthony S., Valerie E. Lee, and Peter B. Holland. Catholic Schools and the
Common Good. (Cambridge, MA: Harvard University Press, 1993). Buddin, Richard J., and Joseph J. Cordes. “School Choice in California: Who Chooses
Private Schools?” Journal of Urban Economics 44 (1998),110-134. Education Commission of the States, Policy Brief: Vouchers, Tax Credits and Tax
Deductions (August 2003). Elmore, Richard F. and Bruce Fuller. “Empirical Research on Educational Choice: What
are the Implications for Policy-Makers?” in Bruce Fuller and Richard F. Elmore, eds., Who Chooses? Who Loses? Culture, Institutions and the Unequal Effects of School Choice. (New York: Columbia Teachers College Press, 1996), ??-??.
Fairlie, Robert W. and Alexandra M. Resch. “Is there “White Flight” into Private Schools? Evidence from the National Educational Longitudinal Study.” Review of Economics and Statistics, 84(1): 21-33 (2002). Hanushek, Eric A. (2003). “The Failure of Input-Based Schooling Policies.” Economic
Journal 113 (485): F64-F98. Hochschild, Jennifer L. and Nathan Scovroneck, The American Dream and the Public
Schools (Oxford: Oxford University Press, 2003).
35
Howell, William G., “Dynamic Selection Effects in a Means-Tested, Urban School Voucher Program,” Journal of Policy Analysis and Management, forthcoming.
Howell, William G., Paul E. Peterson, Patrick J. Wolf, and David E. Campbell. The
Education Gap: Vouchers and Urban Schools (Washington, DC: Brookings Institution, 2002).
Hoxby, Caroline M. “Introduction,” in Caroline M. Hoxby, ed. The Economics of School
Choice (Chicago: University of Chicago Press, 2003). King, Gary and Langche Zeng. “Logistic Regression in Rare Events Data.” Political
Analysis 9 (2): 137-163 (2001). Lankford, R. Hamilton, and James H. Wykoff. “Who Would Be Left Behind by
Enhanced Private School Choice?” Journal of Urban Economics, Vol. 50 (July 2001), 288-312.
Levin, Henry M. "Educational Vouchers: Effectiveness, Choice, and Costs." Journal of
Policy Analysis and Management, 17(June, 1998), 373-392. Moe, Terry M. Schools, Vouchers, and the American Public. (Washington, DC:
Brookings Institution Press, 2001). Peterson, Paul E., and David E. Campbell. “An Evaluation of the Children's Scholarship
Fund.” (Cambridge, MA: Program on Education Policy and Governance, Harvard University, 2001.)
Peterson, Paul E. “Efficiency, Bias, and Classification Schemes: Estimating Private-
School Impacts on Test Scores in the New York City Voucher Experiment.” (The American Behavioral Scientist, forthcoming). Available at http://www.ksg.harvard.edu/pepg/ (accessed 10-14-03).
Schneider, Mark, Paul Teske and Melissa Marschall. Choosing Schools: Consumer
Choice and the Quality of American Schools. (Princeton, NJ: Princeton University Press, 2000).
Tomz, Michael, Gary King and Langche Zeng. 1999. ReLogit (for STATA). Cambridge,
MA: Harvard University. Available at http://GKing.Harvard.Edu. Witte, John F. The Market Approach to Education: An Analysis of America’s First
Voucher Program. (Princeton, NJ: Princeton University Press, 2000).

36
Table 1. Comparing Applicants to Eligible Non-applicants
Applicants Non-applicants N # of parent-teacher conferences (1-5)
2.9*** 2.5 866
Education (1-5) 2.8*** 2.6 1973 Per-pupil expenditure ($) 6746 6609 1970 Satisfaction: Academic quality (1-4)
2.9*** 3.2 862
Satisfaction: Safety (1-4) 3.0*** 3.2 866 Satisfaction: Location (1-4) 3.2*** 3.4 868 Satisfaction: Discipline (1-4) 2.9** 3.1 866 Satisfaction: Values (1-4) 3.0*** 3.1 865 Catholic (%) 26.3 27.2 1964 Born again Christian (%) 39.9*** 7.7 1957 Attend church weekly (%) 63.3*** 36.1 1947 Lived in current residence at least two years (%)
80.0*** 69.1 1972
Percent private school students in MSA (%)
12.7*** 3.7 1835
Family income (1-4) 2.8** 2.9 1978 White (%) 24.5*** 57.3 1931 Hispanic (%) 19.3* 24.8 1946 Black (%) 50.8*** 27.5 1931 Other minority (%) 5.3 4.1 1931 Percent minority (%) 60.5*** 51.5 1968 Learning disability (%) 15.0 14.9 1958

37
Table 2. Application to the Children’s Scholarship Fund Rare-events logistic regression with prior correction
(1) (2) (3) Impact on Probability (in percentage points)
CSF marketing
0.703** (0.283) 0.691* (0.367) 0.535 (0.380)
Mother's education
0.382*** (0.116) 0.349** (0.147) 0.348** (0.169) 4.0 (minimum to maximum)
Two parent household
0.182 (0.244) 0.088 (0.296) -0.222 (0.305)
Learning disability
-0.128 (0.338) 0.089 (0.440) -0.243 (0.440)
Residential stability
0.427* (0.247) 0.445 (0.317) 0.395 (0.326)
Household income -0.289** (0.136) -0.238 (0.160) -0.288* (0.162) -2.3 (minimum to maximum)
Per-pupil expenditure -0.001*** (0.000) -0.001*** (0.000) -0.001*** (0.000) - 8.9 (20th to 80th percentile)
Per-pupil expenditure squared
0.035*** (0.011) 0.049*** (0.013) 0.074*** (0.015) 7.3 (20th to 80th percentile)
Pupil/Teacher Ratio (School) 0.091 (0.057) 0.051 (0.072) 0.084 (0.077)
Catholic 0.947*** (0.315) 1.218*** (0.465) 1.142** (0.462) 3.7
Born again Christian 1.557*** (0.305) 1.485*** (0.368) 1.490*** (0.378) 5.5
Religious service attendance 0.592** (0.236) 0.502* (0.298) 0.505 (0.328)
White -1.152** (0.496) -1.938*** (0.641) -1.859*** (0.655) -4.5
Hispanic -0.293 (0.394) -0.316 (0.510) -0.307 (0.485)
Other minority -0.050 (0.499) -0.255 (0.553) -0.245 (0.540)
% Minority in district -0.420 (0.565) -0.702 (0.672) -0.804 (0.701)
White X % Minority in district
0.180 (0.793) 0.834 (1.022) 0.933 (1.048)
% Private school, MSA 0.433*** (0.037) 0.360*** (0.036) 0.367*** (0.042) 7.3 (20th to 80th percentile)
Northeast 0.691 (0.546) 1.124* (0.609) 0.957 (0.654) 4.6
Midwest -0.699* (0.404) -0.294 (0.450) -0.217 (0.448)
West 0.005 (0.010) -0.009 (0.012) -0.007 (0.012)

38
Number of parent-teacher conferences
0.393*** (0.096) 4.3 (minimum to maximum)
Satisfaction: Academic quality
-0.595 (0.457)
Satisfaction: Safety
-0.746** (0.340) -8.7 (minimum to maximum)
Satisfaction: Location
-0.421* (0.217) -8.2 (minimum to maximum)
Satisfaction: Discipline
0.025 (0.420)
Satisfaction: Values
-0.339 (0.507)
Constant
-1.444 (1.998) 0.632 (2.652) 2.733 (2.556)
Observations 1623 719 717 Robust standard errors in parentheses * significant at 10%; ** significant at 5%; *** significant at 1% Note that rare-events logit does not calculate a measure of fit.

39
Table 3. Comparing Users and Decliners
Users Decliners N Education (1-5) 2.9** 2.7 1040 Two parent household (%)
44.1 40.2 1040
Learning disability (%)
11.7** 16.8 1034
Lived in current residence at least two years (%)
85.0*** 78.7 1038
Family income (1-4) 2.8 2.8 1040 Per-pupil expenditure ($)
7016*** 6642 1035
Catholic (%) 30.6* 25.6 1032 Born again Christian (%)
40.4 40.1 1026
Attend church weekly (%)
70.2*** 62.3 1023
White (%) 38.7*** 21.0 1033 Hispanic (%) 15.2*** 21.6 1033 Black (%) 41.8*** 51.9 1033 Other minority (%) 4.3 5.7 1033 Percent minority in school district (%)
54.9*** 62.5 1035
Percent private school students in MSA (%)
13.2** 12.5 939
40
Table 4. Voucher Usage Among Applicants Logistic regression
(1) (2) Impact on Probability (in percentage points)
Mother's education
0.090 (0.085) 0.089 (0.083)
Two parent household
-0.144 (0.173) -0.140 (0.168)
Learning disability
-0.457* (0.240) -0.435* (0.230) -8.1
Residential stability
0.367* (0.213) 0.332 (0.205)
Household income
-0.036 (0.086) -0.070 (0.083)
Per-pupil expenditure
0.000 (0.000)
Per-pupil expenditure
-0.023 (0.020)
Pupil/Teacher Ratio (School)
-0.033 (0.046)
Catholic
0.518** (0.238) 0.477** (0.232) 10.3
Born again Christian
0.189 (0.197) 0.167 (0.191)
Religious service attendance
0.397** (0.177) 0.443** (0.172) 9.0
White
0.527 (0.418) 0.727*** (0.209) 16.2
Hispanic
-0.150 (0.275) -0.149 (0.266)
Other minority
-0.021 (0.377) -0.095 (0.370)
% Minority in district
-0.426 (0.448)
White X % Minority in district
0.344 (0.681)
% Private school, MSA
0.003 (0.021) -0.019 (0.023)
% Private school, zip code
0.016* (0.010) 4.2 (20th to 80th percentile)
Northeast
0.742** (0.368) 0.802*** (0.245) 16.4
Midwest
0.416 (0.259) 0.533** (0.215) 10.5
West
0.001 (0.008) 0.006 (0.006)
Constant
-2.789 (1.776) -2.097*** (0.459)
N 855 901 Pesudo-R2 0.07 0.07 Standard errors in parentheses * significant at 10%; ** significant at 5%; *** significant at 1%

41
Table 5. Comparing Users and Eligible Non-Applicants Users Non-applicants N Education 2.9*** 2.4 754 Family income 2.8 2.9 759 Catholic 30.6 26.7 755 Born again Christian 40.5*** 9.8 753 Attend church weekly
70.2*** 38.8 745
White 38.8*** 55.1 715 Hispanic 15.3*** 27.0 730 Black 41.7*** 28.0 715 Lived in current residence at least two years
85.2*** 70.3 758
Learning disability 11.8 14.2 746