Embed Size (px)
Citation preview

20
1. Conservation of the Global Atmospheric Environment
(1) Global Warming
Expanding human activities have discharged vast quantities of carbon dioxide (CO2), methane and other greenhouse
gases (GHGs) into the atmosphere. In recent years, these gases have enhanced the greenhouse effect and given rise to
the threat of global warming.
According to the Third Assessment Report: Climate Change 2001 published by the Intergovernmental Panel on
Climate Change (IPCC), the global mean surface temperature has increased by approximately 0.6ºC over the 20th
century, and consequently the mean global sea level has risen by approximately 10–20cm. The progress of global
warming may have far-reaching and serious effects on the living environment of humans and the natural habitats of
other living organisms.
Part Two of the Quality of the Environment in Japan 2005 (White Paper) introduces in the chapters below the
environmental conservation policies and measures implemented in FY 2004 based on the state of environmental problems
and in line with the Basic Environment Plan. Part Two of this booklet will report on the issues and current state of
environmental problems in the major fields.
Chapter One: Conservation of the Global Atmospheric Environment
Chapter Two: Conservation of the Atmospheric Environment (not including the global atmospheric environment)
Chapter Three: Conservation of the Water, Soil, and Ground Environments
Chapter Four: Measures and Policies related to the Material Cycle, including Waste and Recycling Measures
Chapter Five: Measures for Chemical Substances
Chapter Six: Conservation of the Natural Environment and Promoting Contact with Nature
Chapter Seven: Basis of Various Measures, and Measures Facilitating the Participation of Various Actors and
International Cooperation
Part Two Current Environmental Issues and Environmental ConservationMeasures by the Government
Source: Ministry of the Environment
(FY)
Amount of emissions (million ton CO2)
Industries 476 million tons → 478 million tons (+0.3%)
Residential 129 million tons → 170 million tons (+31.4%)
Commercial/other 144 million tons → 196 million tons (+36.1%)
Waste 17 million tons → 23 million tons (+37.8%)
Industrial processes 57 million tons → 48 million tons ( -15.8%)
Energy conversion 82 million tons → 86 million tons (+4.3%)
Transportation 217 million tons → 260 million tons (+19.8%)
Sector Change in emissions (FY 1990 → FY 2003)
0
50
100
150
200
250
300
350
400
450
500
550
600
CO2 Emissions in Japan
1990 1995 2000 2003
21
Of the amounts of GHGs emitted in Japan in FY 2003, CO2 emission was 1,259 million tons, with a per capita
emission of 9.87 tons. Compared to the FY 1990 figures (the base year of the Kyoto Protocol), the total emission has
increased by 12.2% and the per capita emission by 8.7%. A breakdown by sector shows that emission from the
industries has increased by 0.3%, while that of the commercial and other sector has increased by 36.1%, the residential
sector by 31.4% and the transportation sector by 19.8%.
In May 2002, Japan revised the “Climate Change Policy
Law,” and ratified the Kyoto Protocol in June of the same
year, which sets legally binding numerical targets for
greenhouse gas emissions in developed nations. With the
Russian ratification of the Protocol in November 2004, the
conditions for the entry into force of the Protocol was
fulfilled. Thus the Kyoto Protocol entered into force on
February 16, 2005. One hundred and forty-nine countries
and the EU ratified the Kyoto Protocol as of April, 2005.
Because CO2 arises from every aspect of human
activities, curbing its emission requires collective efforts by all actors of society from national and local governments to
business operators and each individual citizen. In pursuing measures against global warming, an effective mechanism
for both economy and environment must be developed and established.
(2) Depletion of the Ozone Layer
It has been known that the ozone layer is being destroyed by ozone-depleting substances such as chlorofluorocarbons
(CFCs). There is concern that depletion of the ozone layer may increase the quantity of harmful ultraviolet radiation
reaching the earth, causing growth impediment of organisms and health damages in humans such as skin cancer and
cataracts.
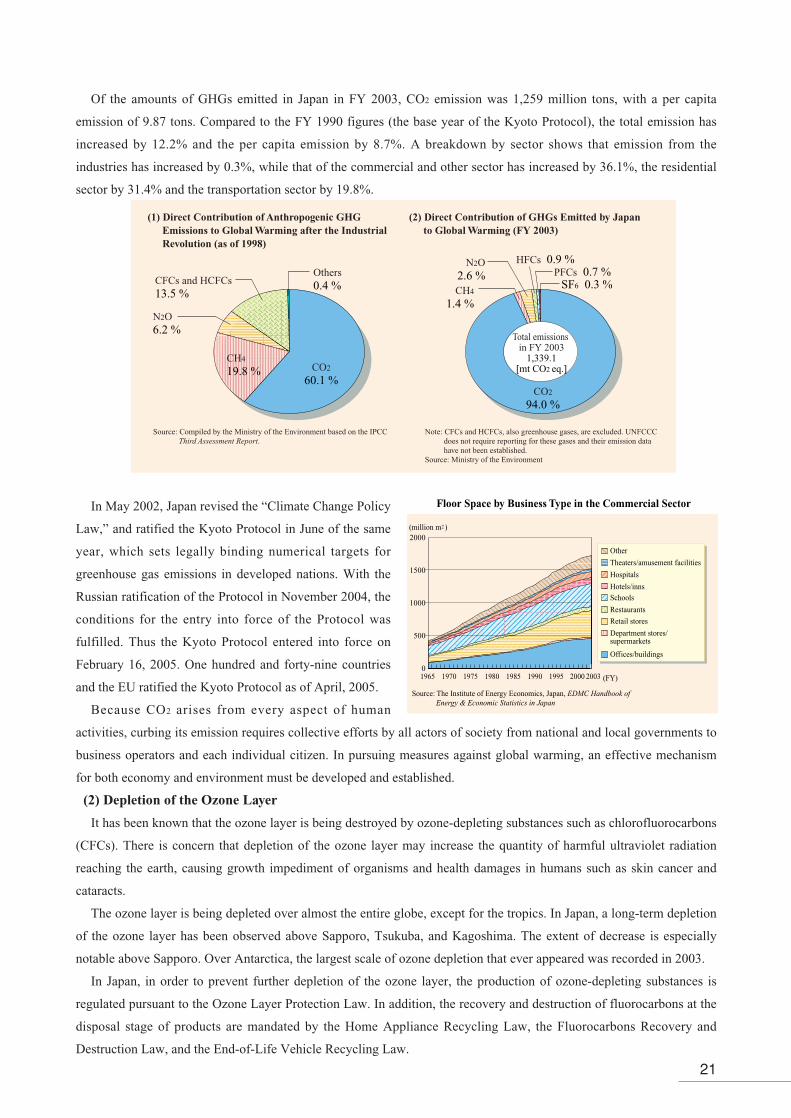
The ozone layer is being depleted over almost the entire globe, except for the tropics. In Japan, a long-term depletion
of the ozone layer has been observed above Sapporo, Tsukuba, and Kagoshima. The extent of decrease is especially
notable above Sapporo. Over Antarctica, the largest scale of ozone depletion that ever appeared was recorded in 2003.
In Japan, in order to prevent further depletion of the ozone layer, the production of ozone-depleting substances is
regulated pursuant to the Ozone Layer Protection Law. In addition, the recovery and destruction of fluorocarbons at the
disposal stage of products are mandated by the Home Appliance Recycling Law, the Fluorocarbons Recovery and
Destruction Law, and the End-of-Life Vehicle Recycling Law.
Total emissions in FY 2003
1,339.1[mt CO2 eq.]
Source: Compiled by the Ministry of the Environment based on the IPCC Third Assessment Report.
Note: CFCs and HCFCs, also greenhouse gases, are excluded. UNFCCC does not require reporting for these gases and their emission data have not been established.
Source: Ministry of the Environment
CO2
60.1 %CO2
94.0 %
CH4
19.8 %
CH4
1.4 %N2O6.2 %
N2O2.6 %
HFCs 0.9 %PFCs 0.7 %
CFCs and HCFCs13.5 %
Others0.4 %
(1) Direct Contribution of Anthropogenic GHG Emissions to Global Warming after the Industrial Revolution (as of 1998)
(2) Direct Contribution of GHGs Emitted by Japan to Global Warming (FY 2003)
SF6 0.3 %
0
500
1000
1500
2000
Floor Space by Business Type in the Commercial Sector
Source: The Institute of Energy Economics, Japan, EDMC Handbook of Energy & Economic Statistics in Japan
(million m2 )
(FY)
Theaters/amusement facilities
Other
Hospitals
Hotels/inns
Schools
Restaurants
Retail stores
Offices/buildings
Department stores/supermarkets
1965 1970 1975 1980 1985 1990 1995 2000 2003
22
2. Conservation of the Atmospheric Environment (not including the global atmospheric environment)
(1) Acid Deposition and Dust and Sandstorms
Acid deposition can produce various effects on the environment and living creatures such as trees or fish by
increasing acidity in soil, lake water, etc. Buildings, artificial constructions and cultural assets can be affected by acid
deposition. In the U.S. and Europe, acidification of lakes/reservoirs and the decline of forests caused by acid deposition
have been reported.
In Japan, long-term monitoring of acid deposition is carried out to detect its effects as early as possible and to
forecast the effects in the future.
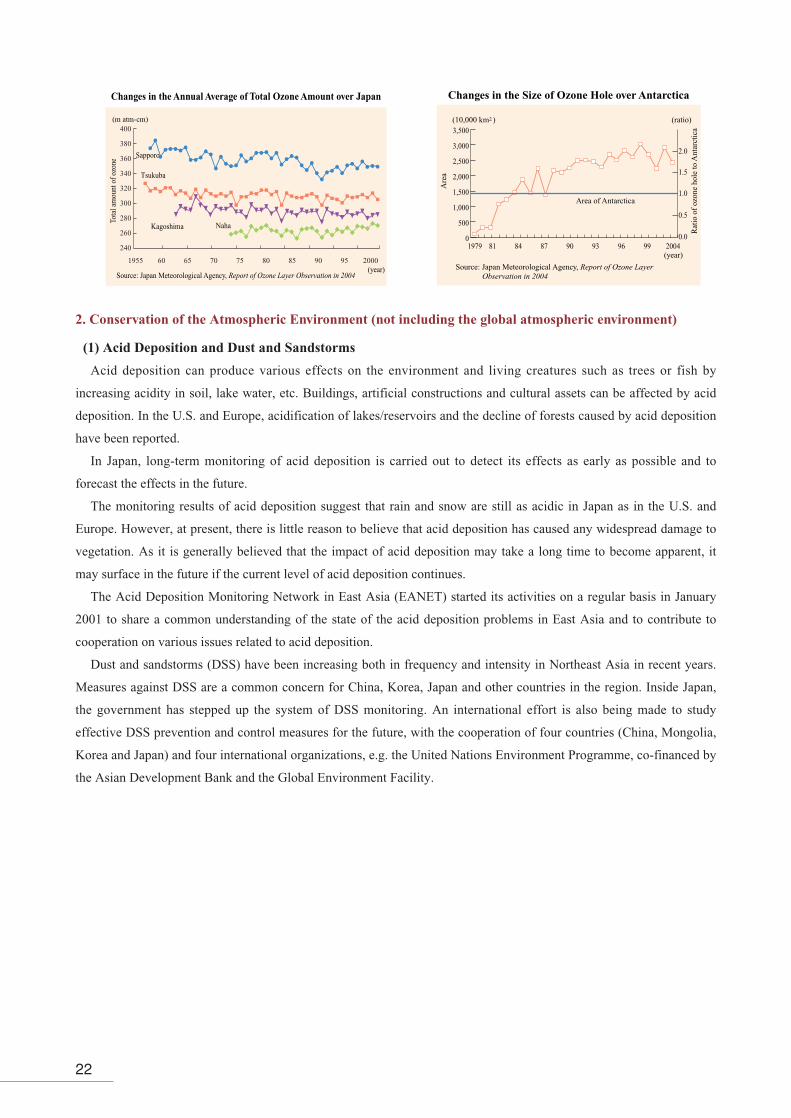
The monitoring results of acid deposition suggest that rain and snow are still as acidic in Japan as in the U.S. and
Europe. However, at present, there is little reason to believe that acid deposition has caused any widespread damage to
vegetation. As it is generally believed that the impact of acid deposition may take a long time to become apparent, it
may surface in the future if the current level of acid deposition continues.
The Acid Deposition Monitoring Network in East Asia (EANET) started its activities on a regular basis in January
2001 to share a common understanding of the state of the acid deposition problems in East Asia and to contribute to
cooperation on various issues related to acid deposition.
Dust and sandstorms (DSS) have been increasing both in frequency and intensity in Northeast Asia in recent years.
Measures against DSS are a common concern for China, Korea, Japan and other countries in the region. Inside Japan,
the government has stepped up the system of DSS monitoring. An international effort is also being made to study
effective DSS prevention and control measures for the future, with the cooperation of four countries (China, Mongolia,
Korea and Japan) and four international organizations, e.g. the United Nations Environment Programme, co-financed by
the Asian Development Bank and the Global Environment Facility.
0
500
1,000
1,500
2,000
2,500
3,000
3,500
Changes in the Size of Ozone Hole over Antarctica
Area of Antarctica
Source: Japan Meteorological Agency, Report of Ozone Layer Observation in 2004
(10,000 km2 ) (ratio)
(year)1979 81 84 87 90 93 96 99 2004
2.0
1.5
1.0
0.5
0.0
Are
a
Rat
io o
f oz
one
hole
to A
ntar
ctic
a
Sapporo
Tsukuba
Kagoshima Naha
240
260
280
300
320
340
360
380
400
2000959080 85757065601955
Changes in the Annual Average of Total Ozone Amount over Japan
Source: Japan Meteorological Agency, Report of Ozone Layer Observation in 2004
(m atm-cm)
(year)
Tota
l am
ount
of o
zone
23
(2) Photochemical Oxidants
Nitrogen oxides (NOx) and volatile organic compounds (VOCs) emitted from factories, business establishments, and
automobiles form primary pollutants, which react in the presence of sunlight (photochemical reaction) to form
secondary substances such as ozone and other substances, known collectively as photochemical oxidants.
Photochemical oxidants are the cause of photochemical smog, which causes eye and throat irritation and respiratory
distress. In almost all regions throughout Japan, photochemical oxidants still exceed the EQS (a one-hour value of 0.06
ppm or less).
Levels of pH in Precipitation
FY 2001 average / FY 2002 average /FY 2003 average
Rishiri 4.82/4.83/4.85
Sapporo 4.71/4.73/4.76
Hachimantai ※/4.86/4.75
Ochiishi-misaki 4.87/4.90/4.88
Nonodake 4.63/※/4.77
Sendai ※/※/-
Tsukuba 4.62/4.60/4.61
Kashima ※/※/-
Ichihara 4.64/4.89/-Kawasaki 4.73/4.82/-
Tanzawa 4.63/4.79/-Inuyama 4.38/4.58/4.63
Nagoya 4.57/4.88/-Kyoto Yawata ※/4.62/4.67
Osaka 4.55/4.75/-Amagasaki 4.68/4.61/4.71
Shiono-misaki 4.68/4.85/4.74Kurashiki 4.52/4.65/-
Yusuhara 4.84/4.74/4.76
Kurahashijima 4.61/4.34/4.48
Ube 6.25/6.00/-Oita Kuju 4.72/4.65/4.59
Yakushima 4.75/※/4.67
Ebino 4.70/4.72/※
Omuta 5.48/5.64/-
Amami 5.03/※/-
Hedo-misaki 4.96/※/4.83Ogasawara 5.10/5.11/5.04
Tappi-misaki 4.63/※/※
Obanazawa 4.80/4.81/4.72
Niigata 4.64/4.63/-
Niigata Maki 4.58/4.66/4.60
Sado Seki-misaki 4.61/※/※
Happo-one 4.81/4.93/4.90
Tateyama 4.63/4.84/-
Wajima 4.55/4.62/-
Echizen-misaki 4.59/4.47/4.54
Ijirako 4.39/4.54/4.40
Kyoto Yasaka 4.67/※/-
Oki 4.77/※/4.80
Matsue 4.91/4.58/-Banryuko 4.68/4.62/4.65
Tsushima ※/4.66/4.83
Chikugo Ogori 4.77/※/4.85
Goto 4.88/4.76/4.82
-: No data※: Invalid data (disregarded based on the annual assessment criteria). Note: For the Akagi area, annual averages cannot be calculated in years when heavy snowfall prevents data collection. Source: Data from the Ministry of the Environment
National Average 4.74/4.79/4.71
Akagi ※/※/4.59
24
As one of the measures to combat photochemical oxidants, the
Air Pollution Control Law was revised in May 2004 to control
VOC emissions from factories. Adequately combining VOC’s
emission regulations and voluntary efforts by business operators,
the revised law will be effective in harnessing VOC emissions. In
FY 2006, VOC emitters will be required to notify VOC-emitting
facilities and to meet regulatory standard values. There is also
great expectation for the voluntary efforts of businesses. To
control VOC emissions from automobile exhaust gas, regulations
have been in place and stepped up successively in accordance with
the Air Pollution Control Law.
Through the Atmospheric Environmental Regional Observation
System (nickname Soramame-kun), real-time data on the
atmospheric environment is measured, and information
concerning the issuance of photochemical oxidants alarms or warnings by local governments nationwide is collected
and announced on the Internet.
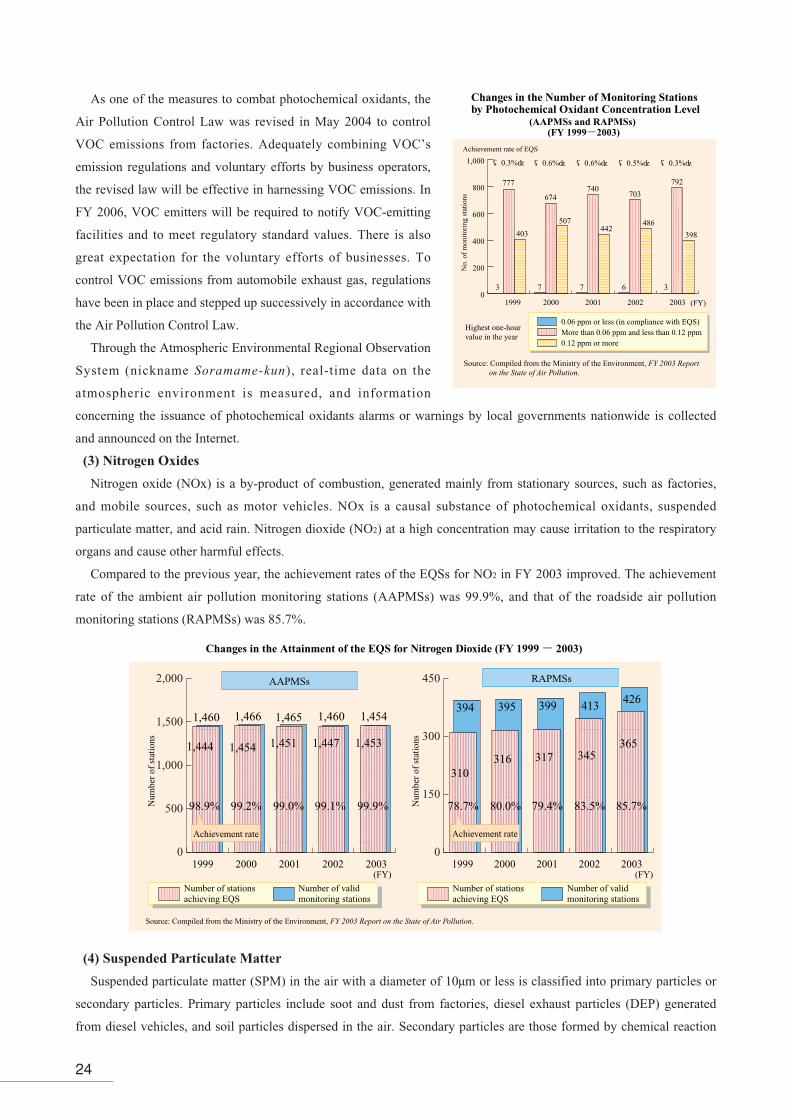
(3) Nitrogen Oxides
Nitrogen oxide (NOx) is a by-product of combustion, generated mainly from stationary sources, such as factories,
and mobile sources, such as motor vehicles. NOx is a causal substance of photochemical oxidants, suspended
particulate matter, and acid rain. Nitrogen dioxide (NO2) at a high concentration may cause irritation to the respiratory
organs and cause other harmful effects.
Compared to the previous year, the achievement rates of the EQSs for NO2 in FY 2003 improved. The achievement
rate of the ambient air pollution monitoring stations (AAPMSs) was 99.9%, and that of the roadside air pollution
monitoring stations (RAPMSs) was 85.7%.
(4) Suspended Particulate Matter
Suspended particulate matter (SPM) in the air with a diameter of 10µm or less is classified into primary particles or
secondary particles. Primary particles include soot and dust from factories, diesel exhaust particles (DEP) generated
from diesel vehicles, and soil particles dispersed in the air. Secondary particles are those formed by chemical reaction
(AAPMSs and RAPMSs) (FY 1999-2003)
Changes in the Number of Monitoring Stations by Photochemical Oxidant Concentration Level
Achievement rate of EQS
0
200
400
600
800
1,000
Source: Compiled from the Ministry of the Environment, FY 2003 Report on the State of Air Pollution.
(0.3%) (0.6%) (0.6%) (0.5%) (0.3%)
(FY)1999 200220012000 2003
792
398
3 7 7 6 3
740
442
674
507
777
403
703
486
0.06 ppm or less (in compliance with EQS) More than 0.06 ppm and less than 0.12 ppm0.12 ppm or more
Highest one-hour value in the year
No.
of
mon
itor
ing
stat
ions
0
500
1,000
1,500
2,000
0
150
300
450
Changes in the Attainment of the EQS for Nitrogen Dioxide (FY 1999 - 2003)
Number of stations achieving EQS
Number of valid monitoring stations
Number of stations achieving EQS
Number of valid monitoring stations
AAPMSs RAPMSs
(FY)1999 2000 2001 2002 2003 1999 2000 2001 2002 2003
(FY)
Achievement rate Achievement rate
Source: Compiled from the Ministry of the Environment, FY 2003 Report on the State of Air Pollution.
413
345
99.1%98.9% 99.2% 99.0%
399394 395
317310
3161,444 1,454 1,451 1,447
1,460 1,466 1,465 1,460
99.9% 79.4%78.7% 80.0% 83.5%
1,453
1,454
426
365
85.7%Num
ber
of s
tati
ons
Num
ber
of s
tati
ons

25
within the atmosphere from gaseous substances, such as nitrogen oxides (NOx). Because SPM is of a minute size, it
remains in the air for extended periods. An accumulation of SPM in high concentrations in the lungs or the trachea can
have damaging effects on the respiratory system.
The achievement rates of the EQS for suspended particulate matter improved in FY 2003 compared to the previous
year.
Furthermore, studies are being conducted on fine particulate matter with a diameter of 2.5µm or less and diesel
exhaust particles, because their impacts on human health have raised concerns in recent years.
(5) Hazardous Air Pollutants
Various chemical substances, though low in concentrations, have been detected in the atmosphere, raising concern
about the health effects of long-term exposure to these substances. In FY 2003, the level of benzene exceeded the EQS
at 33 monitoring points, 7.8% of the 424 total points.
Pursuant to the Air Pollution Control Law, standards were set up to control the emissions of specified substances,
such as benzene, and voluntary measures by businesses to control emissions were encouraged. Simple calculation of the
total emissions of twelve substances that are targeted by the voluntary management plans in FY 2003 shows a
substantial reduction rate of 57%, decreasing from approximately 38,000 tons in FY 1999 to 16,000 tons in FY 2003.
(6) Noise, Vibration, and Offensive Odors
Complaints about noise and vibration have increased gradually in the last few years, totaling 15,928 and 2,608 in FY
2003 respectively. Complaints about offensive odors, especially about open incineration, have increased drastically
since FY 1997. The trend is on the rise in the last several years, reaching a record of 24,587 complaints in FY 2003.
For car noise in areas facing roads, the state of compliance with the EQS in FY 2003 was as follows: 1,933 thousand
(80.7%) out of assessed 2,395 thousand households facing roads were within the satisfactory level stipulated by the
EQS for both day and night. Among those household facing roads, 1,016 thousand households were near trunk roads,
out of which 709 thousand households (69.8%) were within the EQS’s satisfactory level. As for aircraft noise, 71.4% of
households were within the satisfactory level the EQS in FY 2002.
0
400
800
1,200
1,600
2,000
0
50
100
150
200
250
300
350
400
Changes in the Attainment of the EQS for Suspended Particulate Matter (FY 1999 - 2003)
Source: Compiled from the Ministry of the Environment, FY 2003 Report on the State of Air Pollution.
1,529 1,539
1,290
1,025
301319
199
150
1,529
1,378
90.1% 84.4% 66.6% 52.5%
282
215
76.2% 66.1% 47.0% 34.3%
1,538
807
359
123
92.8%77.2%
1,520
1,410
390
301
Achievement rateAchievement rate
Number of stations achieving EQS
Number of valid monitoring stations
Number of stations achieving EQS
Number of valid monitoring stations
Num
ber
of s
tati
ons
Num
ber
of s
tati
ons
(FY)1999 2000 2001 2002 2003 (FY)1999 2000 2001 2002 2003
AAPMSs RAPMSs

26
For noise and vibration coming from factories, business establishments, automobiles, and aircrafts, permissible limits
and EQSs were set up pursuant to the Noise Regulation Law and the Vibration Regulation Law in order to impose
restrictions.
(7) Heat Island Phenomenon
The heat island phenomenon occurs when the temperature rises more in urban areas than in surrounding suburban
areas. This phenomenon results in an increase in the number of sultry nights in the summer. As waste heat from air
conditioners raises the temperature, more energy is consumed as air conditioning works harder still, creating a vicious
cycle.
In March 2004, concerned ministries and agencies put together the “Outline of the Policy Framework to Reduce
Urban Heat Island Effects” to facilitate policy implementation. The Outline consists of four pillars of measures,
including the reduction of anthropogenic exhaust heat, improvement of urban surface, improvement of urban structure,
and improvement of lifestyle.
Attainment of the EQS for Transportation Noise
0% 20% 40% 60% 80% 100%
0% 20% 40% 60% 80% 100%
Below EQS both day and night
Below EQS in daytime only
Below EQS at night only
Exceeded EQS both day and night
Note: [ ] indicates the number of households surveyed.Source: Ministry of the Environment
Note: [ ] indicates the number of monitoring points. Source: Ministry of the Environment
EQS for Car Noise (road-facing areas)
EQS for Aircraft Noise
FY 2003 total (National)
[2,395]
FY 2002 [563 monitoring points]
Near trunk roads [1,016]
179 (17.6%)
1,933 (80.7%)
177 (7.4%)
22 (0.9%)
263 (11.0%)
709 (69.8%)
111 (10.9%)
17 (1.6%)
71.4%
(1,000 households)
Distribution of High Temperature Areas in the Tokyo Region (1981 and 1999)
Unit: hours Unit: hours
400
300
200
100
50
400
300
200
100
50
Source: Ministry of the Environment, Report on the Heat Island Phenomenon–Analysis of the Current State and Countermeasures
Maebashi KiryuIsesaki Sano Oyama
TatebayashiKoga
Shimotsuma
Tsukubasan
YoriiKumagaya
Kuki Tsuchiura
Chichibu Hatoyama
Ogouchi OmeTokorozawa
KoshigayaUrawa Ryugasaki
Otsuki
Abiko
Hachioji FuchuNerima
TokyoShinkiba
Funabashi Sakura
Chiba
Ebina Yokohama
Kisarazu Ushiku
Maebashi KiryuIsesaki Sano Oyama
TatebayashiKoga
Shimotsuma
Tsukubasan
YoriiKumagaya
Kuki Tsuchiura
Chichibu Hatoyama
Ogouchi OmeTokorozawa
KoshigayaUrawa Ryugasaki
Otsuki
Abiko
Hachioji FuchuNerima
TokyoShinkiba
Funabashi Sakura
Chiba
Ebina Yokohama
Kisarazu Ushiku
Number of hours exceeding 30 ℃ in Tokyo region in 1981
Distribution of High Temperature Areas in the Tokyo Region in 1981 Distribution of High Temperature Areas in the Tokyo Region in 1999
Number of hours exceeding 30 ℃ in Tokyo region in 1999

27
3. Conservation of the Water, Soil, and Ground Environments
(1) Water Environment
According to the Results of FY 2003 Measurement of Water
Quality in Public Waters, the achievement level of the EQS for the
protection of human health from substances, such as cadmium, was
99.3%. Standards set for protecting the living environment were
achieved at slightly lower rates. The BOD (or COD) level is an
EQS for the conservation of the living environment and is a typical
water-quality indicator for organic contamination. Its EQS
achievement level remained at 83.8%. By water area, the
achievement levels were 87.4% for rivers, 55.2% for lakes and
reservoirs, and 76.2% for sea areas. In particular, the achievement
rates for enclosed water areas, such as lakes, reservoirs, inner bays,
and inland seas, were still low. In terms of COD, the achievement
rates were 68% for Tokyo Bay, 50% for Ise Bay, and 70% for the
Seto Inland Sea. Consequently a bill making a partial amendment
to the Law concerning Special Measures for the Preservation of
Lake Water Quality was submitted to the 162nd Diet in order to
conserve the water quality of lakes and reservoirs further. It
promotes measures to reduce the pollution load from urban districts
and farmland in specified areas and to maintain the lakeshore water
environment in a proper manner.
According to the Results of the FY 2003 Water Quality Survey of Groundwater, the rate of exceeding the EQSs was
8.2% of the total wells surveyed. Especially, the rate of nitrate/nitrite nitrogen exceeding the EQS was 6.5%. The
pollution was caused by farmland fertilization, domestic drainage, excreta of livestock, etc., and immediate measures
are needed to deal with the groundwater pollution by nitrate/nitrite nitrogen.
The review of the Groundwater Management Methods for managing groundwater and supporting conservation plans,
and the review of the Measures for Environmental Water Security for local waters that have experienced a decline in
water flow are underway by the Inter-Ministry/Agency Coordination Committee for Building a Sound Water Cycle.
0
20
40
60
80
100(%)
Tokyo BayOsaka Bay Seto Inland Sea
Ise Bay
Trends in Rate of Achievement with EQS (COD) in Three Coastal Regions
1975 77 79 81 83 85 87 89 91 93 95 97 99 2001(FY)
03
Note: Ise Bay includes Mikawa Bay, and Seto Inland Sea includes Osaka Bay
Source: Ministry of the Environment, Results of FY 2003 Measurement of Water Quality in Public Waters
Ach
ieve
men
t lev
el
0
20
40
60
80
100
Trends toward Achieving EQSs (BOD or COD)
(%)
1975 77 79 81 83 85 87 89 91 93 95 97 99 01(FY)2003
Notes:1. BOD used for rivers, and COD used for lakes/reservoirs, and
sea/coastal areas.2. Achievement level (%) = (no. of water bodies achieving/no. of
designated water bodies) × 100Source: Ministry of the Environment, Results of FY 2003 Measurement
of Water Quality in Public Waters
TotalRiversLakes & reservoirsSea & coastal areas
Ach
ieve
men
t lev
el
0
1.0
2.0
3.0
4.0
5.0
6.0
7.0
1989 90 91 92 93 94 95 96 97 98 99 2000 01 02 03
Exceeding rate(%)
(FY of survey)
Notes:1. Different wells were measured in the General Monitoring Survey each
year. (Not the same wells were measured every year.) 2. Before the EQSs for groundwater were established in 1997, the
assessment standards had been used to evaluate groundwater quality. (The assessment standard for arsenic was revised from “0.05 mg/L or less to “0.01 mg/L or less” in 1993.)
3. Nitrate/nitrite nitrogen, fluorine, and boron were added to the list of EQS items in 1999.
Source: Ministry of the Environment, Results of FY 2003 Water Quality Survey of Groundwater
Changes in Exceeding Rates to EQSs for Groundwater (Items with high exceeding rate)
Nitrate nitrogen/nitrite nitrogenFluorineArsenicTrichloroethyleneTetrachloroethylene

28
(2) Marine Pollution
For conservation of the marine environment,
Japan has concluded the London Convention,
which regulates the dumping of waste from ships
at sea, and the MARPOL 73/78 Convention,
which prevents marine pollution caused by ships.
In response to these conventions, Japan has taken
domestic measures to prevent marine pollution.
In order to assess and monitor the condition of
the marine environment, data is being collected to
determine the condition of water quality, bottom
sediment, and aquatic organisms comprehensively
and systematically.
In terms of pollution caused by oil, waste, and
red tide, 425 cases were identified in 2004, a decrease of 146 cases from the 2003 total. Monitoring of drifting marine
debris by sight indicated that most of such debris was petrochemical products such as foamed polystyrene and plastics.
They were found in large quantities along the western coast of Kyushu.
(3) Soil Contamination
Once soil is contaminated, it accumulates hazardous substances, perpetuating the state of pollution. In order to tackle
such soil contamination, appropriate measures were sought based on the Soil Contamination Countermeasures Law. At
the same time, studies were conducted to review the overall EQSs for soil, increasing targeted substances and exposure
paths. In recent years, an increasing number of urban soil contamination cases have been found during the
redevelopment of former factory sites. In FY 2002, 260 cases that failed to comply with the EQS for Soil
Contamination were newly identified.
Changes in the Number of Identified Marine Pollution Cases
0
100
200
300
400
500
600
700
20042003200220012000
(case)
Total: 610
Total: 486Total: 516
Total: 571
Total: 425
Note: “Other” includes factory effluent.Source: Japan Coast Guard
307
226
3031 4
12
327
1038
47
37
358
798
914
48
382
124
74
11
43
270
67
518
425
Oil Waste Hazardous liquid substances
Red tide Blue tide Other
0
100
200
300
400
500
600
700
8 12 13 25 37 50 49 126 132 148 222 26038 34 44 44 45 58 63
209 212 206
288
635
Number of Identified Soil Contamination Cases by Fiscal Year
Enforcement of EQSs for soil: August 23, 1991
1974 and before 75 80 85 90 95 2000 02
Items added to EQSs for soil (15 items including VOCs: February 21, 1994) (Fluorine and boron: March 28, 2001)
Num
ber
of c
ases
(FY)
Number of cases surveyed
Number of cases exceeding EQSs
Source: Ministry of the Environment, Overview of the Survey Result concerning Survey and Measures and State of Responses for Soil Contamination in FY 2002
2 7 6 2 10 5 3 10 2 18 10 18 12 14 27 22 26

29
(4) Ground Subsidence
Ground subsidence is caused by excessive
pumping of groundwater, which lowers the level of
the groundwater and shrinks the clay layer. There
were 61 areas in 37 prefectures that reported ground
subsidence as of FY 2003. The restrictions on the
pumping of groundwater and other measures have
mitigated ground subsidence in the wards of Tokyo,
Osaka City, and Nagoya City, where remarkable
ground subsidence had occurred in the past.
However, ground subsidence has still occurred in
certain areas such as the Kujukuri plain in Chiba
Prefecture. Some areas that are lower than sea level
due to ground subsidence may face the danger of
huge damages caused by high tides or floods. For this reason, besides imposing restrictions on the pumping of
groundwater, measures are being taken to deal with high tides and to build facilities to protect the coastline.
4. Measures and Policies related to the Material Cycle, including Waste and Recycling Measures
Since FY 1990, Japan has been generating municipal solid waste at an annual volume of approximately 50 million
tons or more. These annual volumes have remained steady over the last several years. In FY 2002, of all municipal solid
waste, direct incineration accounted for 78.4% and recycling accounted for 17.3%. The final volume disposed of at
landfill sites was 9.03 million tons, a decrease of 920,000 tons from the previous year.
The total volume of industrial waste generated in Japan has also remained steady over the last several years. The
volume in FY 2002 was approximately 393 million tons, a decrease of about 1.8 % from the previous fiscal year.
Approximately 40 million tons were discarded at final disposal sites, a decrease of about 2 million tons from the
previous fiscal year. Nationally, an average of 4.5 years of capacity in final disposal sites for industrial waste remained
as of April 2003, presenting a serious situation.
Changes in Ground Subsidence in Selected Areas
Minamiuonuma (Yokawa, Muika-machi, Niigata Pref.)
Chikugo-Saga Plain (Tonoe, Shiroishi-cho, Saga Pref.)Kujukuri Plain (Minamiyoshida, Mobara City, Chiba Pref.)
Kanto Plain (Yasaka-cho, Koshigaya City, Saitama Pref.)Nobi Plain (Hakke, Nagashima-cho, Mie Pref.)
Niigata Plain (Sakaiwa, Niigata City, Niigata Pref.)
Osaka Plain (Hyakushima, Nishiyodogawa Ward, Osaka City)
Kanto Plain (Kameido 7-chome, Koto Ward, Tokyo)
-100
0
-200
-300
-400
-500(FY)19021892 1912 1922 1932 1942 1952 1962 1972 1982 1992 2002
Source: Ministry of the Environment, Overview of Ground Subsidence in Japan in FY 2003
Formulation of the Outline of Measuresfor Preventing Ground Subsidencein Northern Part of Kanto PlainDigging of deep wells
began in various areas
Great Kanto Earthquake
Ground subsidence identified
Typhoon Muroto
Announcement of Wadachi's Theory
World War II
Typhoon Catherine
Enactment of Industrial Water Law Typhoon Ise BayTyphoon Muroto No.2
Enactment of Building Water LawAmendment to Industrial Water Law
Enactment of Basic Lawfor Environmental Pollution Control
Establishment of the Environment AgencyFormulation of the Outline of Measuresfor Preventing Ground Subsidencein Chikugo-Saga Plain and Nobi Plain
Cum
ulat
ive
grou
nd s
ubsi
denc
e (c
m)
4,000
4,500
5,000
5,500
6,000
800
900
1000
1100
1200
Changes in the Total Volume of Municipal Solid Waste and Volume Generated per Person per Day
Note: Volume of waste generated = volume of waste collected by local governments + volume of waste directly brought into waste treatment facilities + volume of waste collected by groups such as PTAsIn the Basic Guidelines for the Comprehensive and Systematic Promotion of Waste Reduction Measures and Other Appropriate Treatments, developed based on the Waste Management and Public Cleansing Law, total volume of municipal solid waste is defined as “volume of waste collected by local governments + volume of waste directly brought into waste treatment facilities + volume of group collection of recyclable waste.”
Source: Ministry of the Environment, Waste Treatment in Japan (January 2005)
(FY)
(10,000 tons/yr)(g/person/day)
5,030 5,054 5,0695,116 5,120 5,160 5,145
5,236 5,210
1,103 1,106 1,1051,114 1,112 1,118 1,111
1,132 1,124
5,161
1,111
Tota
l vol
ume
of m
unic
ipal
sol
id w
aste
gen
erat
ed Municipal solid waste generated per person per day
Total volume of municipal solid waste generated
1993 1994 1995 1996 1997 1998 1999 2000 2001 2002
Mun
icip
al s
olid
was
te g
ener
ated
per
per
son
per
day

30
To solve these problems, it is necessary to implement waste and
recycling measures, taking into account the following priorities
stipulated in the Fundamental Law for Establishing a Sound
Material-Cycle Society: (i) reduce waste, (ii) reuse end-of-life
products and parts, (iii) recycle as raw materials, (iv) recover heat,
and (v) appropriately dispose as final waste. In line with this basic
principle, the Waste Management and Public Cleansing Law and
various recycling laws have been steadily enforced.
In terms of the illegal dumping of industrial waste in Japan, the
number of cases with volume over 10 tons was 894 in FY 2003,
showing a decline following the previous year. The total volume of
illegal dumping, on the other hand, reached 745,000 tons, including
about 567,000 tons found in Gifu City in March 2004. This volume
set the record as the highest total since the survey started in FY
1993.
To tackle these issues, the government made a partial
amendment to the Waste Management and Public Cleansing Law in
2004. The Law strengthens the government’s role to help resolve
cases of improper disposal of waste. It also establishes provisions
to punish those who improperly dispose of specified hazardous
waste (sulfate pitch) and those who collect and/or transport waste
with the intention of illegal dumping. These various provisions of
the Law were enforced in succession until all were in force by
April, 2005. In March of the same year, a bill to make another
partial amendment to the Waste Management and Public Cleansing
Law and Other Laws was submitted to the 162nd Diet in order to
step up measures to tackle improper disposal of waste, such as
large-scale illegal dumping and unauthorized export, and to
establish more effective administrative systems. The bill proposes
streamlined administrative practices in cities with public health
offices, a strengthened industrial waste manifest system, and
harsher penalties for waste exports that have evaded mandatory authorization procedures.
5. Measures for Tackling Environmental Risk from Chemical Substances
Among the more than several tens of thousands of chemical substances in circulation in Japan today, some may be
harmful to human health and to ecosystems if they are not properly managed and may pollute the environment during
the various stages of production, distribution, consumption, and disposal.
In order to prevent these harmful effects, the environmental risk (possible interference with environmental
conservation) of these chemical substances must be assessed and appropriate measures must be taken.
The partial amendment to the Chemical Substances Control Law, which came into force in April 2004, introduced
prior evaluation procedure and regulation of chemical substances from the viewpoint of eco-toxicity in addition to
human health. It also introduced measures for persistent and highly bio-accumulative existing chemical substances and
05,000
10,00015,00020,00025,00030,00035,00040,00045,000
Changes in the Volume of Industrial Waste Generated
Notes:(*1) indicates the amount of waste generated in FY 1996, calculated based
on the “Target of Waste Reduction” (government decision, September 28, 1999) - target for FY 2010-compiled pursuant to the Basic Policy for Dioxins Measures.
(*2) The amount of waste after FY 1997 was calculated using the same calculation conditions as *1.
Source: Compiled from the Ministry of the Environment, State of the Generation and Treatment of Industrial Waste (FY 2002 Results).
(10,000 tons/yr)
(FY)
39,700 40,500 39,40042,600(*1) 40,000
(*2)40,000(*2)
39,300(*2)
40,600(*2)
40,800(*2)
41,500(*2)
Tota
l vol
ume
of in
dust
rial
was
te g
ener
ated
1993 1994 1995 1996 1997 1998 1999 2000 2001 2002
In Gifu City (567,000 tons)
Num
ber
of d
umpi
ng
Am
ount
of
dum
ping
1994 1995 1996 1997 1998 1999 2000 2001 2002 20030
20.0
40.0
60.0
80.0
100.0
120.0
0
200
400
600
800
1,000
1,200
1,400
Changes in the Number of Cases and Amount of Illegal Dumping
(case) (10,000 tons)
(FY)
Notes:1. The number of dumping cases and the amount of dumping are derived
by counting cases in which, from among the illegal dumping of industrial waste identified by prefectures and cities with public health offices, the amount of dumping is 10 tons or more. (Cases that involve specially controlled industrial waste are all included.)
2. For cases identified in the transboundary area between Aomori and Iwate prefectures, the totaled 16,000 tons are included in the FY 1999 data. The remaining 860,000 tons, identified during FY 2002 and FY 2003, were not included in the respective fiscal years. The case in Teshima, Kagawa Prefecture (510,000 tons) was identified in FY 1990, and therefore was not within the scope of the above Figure 2.
3. The amount of waste in the case in Gifu Prefecture was in fact 753,000 tons, as was determined by later studies conducted by Gifu municipal government in March 2005.
Source: Ministry of the Environment, State of the Illegal Dumping of Industrial Waste, FY 2003
382,000tons
444,000 tons
219,000tons
408,000 tons
424,000 tons
433,000tons 403,000
tons
242,000 tons
318,000 tons
745,000 tons
934 cases894 cases
353 cases
679 cases 719 cases
855 cases
1,197 cases
1,049 cases
1,027 cases
1,150 cases
Number of dumping (cases)
Amount of dumping (10,000 tons)

31
obligatory reporting system for hazard information voluntarily obtained by businesses etc.
The annual emission of dioxins in 2003 was 376 – 404 g-TEQ, an estimated decrease of about 95% compared to
1997, achieving the target for reduction. The average daily intake of dioxin for humans has been decreasing annually
and is now less than the tolerable daily intake level (4pg-TEQ/kg bw/day), which is low enough that even if this amount
were to be taken throughout one’s lifetime, it would not cause adverse health effects.
To tackle the issue of endocrine disruption, which causes injury and/or hazardous effects on organisms through
influence on the endocrine system, the Ministry of the Environment put together a new policy paper in March 2005
entitled “MOE’s Perspectives on Endocrine Disrupting Effects of Substances -ExTEND2005-.”
Japan has also adopted the PRTR (Pollutant Release and Transfer Register) system for chemical substances that are
suspected of being harmful to human health and to ecosystems. Under the PRTR system, businesses voluntarily identify
and report to the government the amount of chemical substances that are released to the environment or transferred as
waste materials. The government then aggregates the data from businesses and publishes them with estimated results of
release quantities outside notification. The third aggregate result was published in March 2005. It is important to further
promote risk communication to enable all parties, including citizens, industries, and the administrations, to share
accurate information on chemical substances and to improve communication with each other.
0.0
0.5
1.0
1.5
2.0
2.5
3.0
PCDD+PCDFCoplanar PCBsDioxins
2003200220012000199919981997
Chronological Changes in Daily Intake of Dioxins from Food
(FY)
(pg-TEQ/kg bw/day)
Source: Ministry of Health, Labor and Welfare, Survey on the Daily Intake of Dioxins from Food
Emissions (g-TEQ/year)
01,0002,0003,0004,0005,0006,0007,0008,0009,000
Others
Industrial sources
Small scale waste incinerators
Industrial waste incinerators
Municipal waste incinerators
Target200320022001200019991998 1997
Reduction rate to 1997 level (%)
Base year
49.0 – 51.9
60.6 – 62.6
68.8 – 68.9
75.2 – 75.3
87.7 – 88.1
95.0 – 95.1
Changes in Total Emission of Dioxins
Source: Ministry of the Environment
0 100 200
Reported releases
Releases not subject to reporting
(1000 tons/year)
Top 10 Chemical Substances for Reported Releases and Releases Not Subject to Reporting (FY 2003)
Sources: Ministry of the Environment; Ministry of Economy, Trade and Industry
119 72
48 67
13 18
25
0.1
0.3
0.1
2.1
21
20
19
1.415
0.410
16
0.1
(191)
(115)
(31)
(27)
(21)
(20)
(19)
(17)
(16)
(10)
Figures in parenthesis are the total amount of reported releases and releases not subject to reporting.
Xylene
Toluene
Ethylbenzene
Methylene dichloride
Linear alkylbenzenesulfonates and their salts
poly(oxyethylene) alkyl ether
p-dichlorobenzene
Benzene
Formaldehyde
Lead and its compounds

32
6. Conservation of the Natural Environment and Promoting Contact with Nature
(1) Conservation of the Natural Environment and Promoting Contact with Nature
Pursuant to the new National Biodiversity Strategy in which all ministries work together to realize “a society in
harmony with its natural environment,” the second review on its implementations was carried out in FY 2004. The
result indicates a need to enhance efforts to disseminate the National Biodiversity Strategy and to set up measures to
respond to increasing community activities for conserving the natural environment. These measures include creating a
system to involve experts and nurturing human resources.
The Red List provides the status of threatened wildlife species. Facing extinction, it reports, are a little more than
20% of mammals, amphibians, brackish water and freshwater fishes, and vascular plants (tracheophyte), a little less
than 20% of reptiles, and a little more than 10% of bird species inhabiting Japan. Furthermore, 73 species have been
designated as national endangered species of wild fauna and flora pursuant to the Law for the Conservation of
Endangered Species of Wild Fauna and Flora, including four species of mammals and 39 species of birds.
A variety of measures are being taken to help conserve biological diversity in Japan.
To protect and increase the use of natural parks properly, Japan is conducting an overall review of park areas and
park plans to meet changes in social and other conditions surrounding parks.
To promote the conservation of internationally important wetlands, Japan announced that it would aim at increasing
its Ramsar sites to at least 22 by the 9th Meeting of the Conference of the Contracting Parties to the Ramsar Convention
to be held in November 2005, and conducted scientific review on priority sites for such designation.
Under the Law for the Promotion of Nature Restoration, 12 new Nature Restoration Committees had been
established as of January 2005, initiating efforts toward nature restoration.
The Invasive Alien Species Act was promulgated in June 2004 and entered into effect on June 1, 2005. The
objectives of this act are to regulate various actions such as importing and raising invasive alien species (IAS) in
addition to controlling IAS that already exist in Japan, thus preventing damages to ecosystem, human safety,
agriculture, forestry and fisheries in Japan caused by IAS. Laying down the basic measures in support of damage
prevention, the Basic Policy for Preventing Adverse Effects on Ecosystems Caused by Invasive Alien Species was
established in October 2004. The basic policy is now being translated into specific measures; for example, 32 species, 4
genera, and 1 family of introduced organisms have been designated as IAS.
In addition, an emphasis is also being placed on people’s contact with nature. It is considered that nature helps
develop a healthy mind, revitalize humanity, and learn more about coexistence with nature.
Crisis 1Destruction of ecosystem due to human activity
Crisis 2Change in the environmental quality of satochi-satoyama
Crisis 3Ecosystem disturbances by alien species
Responses to Three Crises of Biodiversity
[Future challenges]
[Future challenges]
Response
Expanding protected areas and promoting nature restoration
Establishing an alien species control system
Protecting “cultural landscape” and establishing a framework for NPO activities
Response
Response
- Expansion of protected areas (national parks, national wildlife protection areas, protected/protection forests)
- Nomination of Shiretoko for the World Natural Heritage - Amendment of the City Green Zone Conservation Law- Establishment of the Nature Restoration Committees in 12 new
localities
- Amendment of the Law for the Protection of Cultural Properties to establish “cultural landscapes” as a form of cultural properties
- Establishment of a management contract system for forest land owners and NPOs
- Enactment of the Invasive Alien Species Act
Building ecological networks between conserved and restored areas to enhance the total effect
Utilizing various programs for protection in satochi-satoyama areas
Developing systems to implement the Act
[Future challenges]
Source: Ministry of the Environment

33
To promote ecotourism, the Ecotourism Promotion Committee formulated a package of promotion measures in June,
2004. It includes the adoption of the Ecotourism Charter and implementation of model projects.
As a response to the urgent issue that needs to be addressed, specifically the state of mineral content displays by hot
spring business operators, the enforcement regulation for the Hot Spring Law was revised in February 2005. It aims at
improving the provision of information to hot spring users. Under the new regulation, items that may influence hot
spring properties must be indicated, in addition to existing description items.
(as of March 2005)
Taxonomical group
Subtotal for animals
Subtotal for plants
Total
Extinct Threatened species
Critically endangered+ EndangeredCategory IA Category IB
VulnerableExtinct in thewild
Species assessed (a)
Near threatened
Data deficient
Threatened local population
Number ofthreatenedspecies (b)
b/a(approx.)
approx. 200
approx. 700
97
64
approx. 300
approx. 30,000
approx. 1,000
approx. 4,200
approx. 7,000
approx. 1,800
approx. 5,500
approx. 1,000
approx. 16,500
4
13
0
0
3
2
25
0
47
20
0
5
3
27
55
102
0
1
0
0
0
0
0
1
2
5
0
1
0
1
7
9
16
47
11
9
18
76
165
23
365
621
70
6
23
10
730
1,095
16
16
9
5
12
161
206
31
456
145
4
24
17
0
190
646
9
15
1
0
5
88
69
36
223
52
54
0
17
0
123
346
12
2
2
4
14
3
5
0
42
0
0
0
0
0
0
42
48
89
18
14
76
139
251
33
668
1,665
180
41
45
63
1,994
2,662
24%
13%
19%
22%
25%
0.5%
25%
0.8%
24%
10%
0.7%
5%
0.4%
63
86
10
303
322042257554
5829
1,044480
110
35
22
53
1,264
1,567
12
17
2
1
29
564
Threatened Wildlife of Japan (Species Listed in the Red List and the Red Data Book)
(1) Data on the assessed animal species (including subspecies) were derived from the Environment Agency, Checklist of Japanese Species of Wildlife 1993, 1995, and 1998.
(2) Data on the vascular plants (including subspecies) were gathered by the Japanese Society for Plants Systematics.(3) Data on the species of bryophytes, algae, lichen, and fungi (including subspecies) were derived from Ministry of the Environment surveys.(4) Data on the current state of threatened species (including subspecies) were derived from the Environment Agency, Revised Red Data Book–Threatened
Wildlife of Japan: Amphibians, Reptiles, Plants I, and Plants II (2000), Mammals and Birds (2002); Ministry of the Environment, Revised Red Data Book– Threatened Wildlife of Japan: Brackish Water and Freshwater Fish (2003), Land and Freshwater Mollusks (2005); and the Environment Agency, Red List on Invertebrates (2000).The categories are considered as follows: Extinct: Species that are extinct in Japan Extinct in the wild: Species that are known only to survive in captivity or in cultivation Critically endangered + Endangered: Species in danger of extinction Vulnerable: Species facing increasing danger of extinction Near threatened: Species with weak foundation for survival Threatened local population: Population of a species that is isolated in an area and has high possibility of extinction.
Source: Ministry of the Environment
Vascular plants
Bryophytes
Algae
Lichen
Fungi
Ani
mal
sP
lant
s
Mammals
Birds
Reptiles
Amphibians
Brackish water and freshwater fish
Insects
Land/freshwater molluscs
Spiders/crustaceans
List of Invasive Alien Species under the Invasive Alien Species Act
Class
Mammals
Birds
Reptiles
Amphibians
Fish
Insects
Invertebrates
Plants
Taiwan macaque, crab-eating macaque, rhesus macaque, raccoon, crab-eating raccoon, Javan mongoose, Pallas's squirrel (including Taiwan squirrel),
gray squirrel, coypu or nutria, brushtail possum, Reeves's muntjac
Laughing thrushes, masked laughingthrush, white-browed laughingthrush, red-billed mesia
Snapping turtle, green anole, brown anole, brown tree snake, Taiwan beauty snake, Taiwan pit vipers
Cane toad
Largemouth bass, smallmouth bass, bluegill, channel catfish
Red imported fire ant, fire ant, Argentine ant or tropical fire ant
4 species of widow spiders, 3 species of the genus Loxosceles, any species of the genera Atrax and Hadronyche (family Hexathelidae), any species of the family Buthidae
Alligatorweed, floating marshpennywort or pennywort, Senegal tea plant
Name of Species
Source: Ministry of the Environment
(as of June 1, 2005)

(2) Conservation of Natural Environment Outside Japan
Forests in the world decreased at a rate of about 9.4 million
hectares per year averagely from 1990 to 2000. It was mainly
attributed to the conversion of forests to farmland, forest fire, and
illegal logging. Therefore, efforts for the sustainable forest
management in Asia are being promoted under Asia Forest
Partnership (AFP), which was set up in 2002, and other initiatives.
About one-quarter of all land areas in the world and 900 million
people, accounting for one-sixth of the world’s population, are
affected by desertification, which is defined as land degradation in
arid and semi-arid areas etc. As background of this problem, there
are factors such as poverty and population growth in developing
countries. Therefore, international efforts are being made under the
UN Convention to Combat Desertification (UNCCD).
34
The Quality of the Environment in Japan 2005 (White Paper) reports the environmental conservation policies and
measures to be implemented in FY 2005 in line with the Basic Environment Plan in chapters as follows:
Chapter One: Conservation of the Global Atmospheric Environment
Chapter Two: Conservation of the Atmospheric Environment (not including the global atmospheric environment)
Chapter Three: Conservation of the Water, Soil, and Ground Environments
Chapter Four: Measures and Policies related to the Material Cycle, including Waste and Recycling Measures
Chapter Five: Measures for Chemical Substances
Chapter Six: Conservation of the Natural Environment and Promoting Contact with Nature
Chapter Seven: Basis of Various Measures, and Measures Facilitating the Participation of Various Actors and
International Cooperation
○ Environmental Conservation Measures to be Implemented in FY 2005
Current State of Desertification
Proportion of desertification area to agriculturally used dry land
Population affected by desertification
Land area affected by desertification
Approx. one-quarter of the world's total land surface
Approx. 3.6 billion ha
Approx. one-sixth of the total world population
Asia 36.8%
Africa 29.4%
South America 8.6%
North America 12.0%
Europe 2.6%
Australia 10.6%
Approx. 0.9 billion persons
Approx. 14.4 billion
ha
Approx. 5.4 billion
persons
Source: Compiled by the Ministry of the Environment based on UNEP, Desertification Control Bulletin (1991).
-16
-14
-12
-10
-8
-6
-4
-2
0
2
4
GlobalNon-tropicalTropical
Annual Forest Area Changes in the World
(million ha)
(1990 - 2000)
Note: The bars show net changes in forest area.Source: Compiled by the Ministry of the Environment based on FAO,
Global Forest Resources Assessment 2000.
Natural forest Forest plantation Total forest