Embed Size (px)
Citation preview

PART II
PARAFFIN WAX DEPOSITION
AND FOULING

— 26
PART II - PARAFFIN WAX DEPOSITION AND FOULING
1. INTRODUCTION
The problem of deposition and fouling by waxy hydrocarbons is of long standingin the oil processing industry(1’2). it is of particular importance inpipeline operations and any subsequent processing stages where cooling occurs.In pipelines, paraffin wax deposition may increase the pressure drop duringnormal operation and cause major difficulties during restarting after shut-down.When waxy hydrocarbons are cooled in heat exchangers they tend to deposit andcause fouling; increasing the overall heat transfer resistance and pressuredrop.
Methods used to reduce paraffin deposition in industry are both mechanicaland chemical in nature. Pipelines are frequently cleaned by mechanical ‘pigs1that are transmitted with the bulk flow and scrape away the deposits.Chemical additives affect the crystal structure of materials depositing andmay reduce their solidification temperature. Deposition and fouling may alsobe reduced by proper design and operation of pipelines and heat exchangers.This requires knowledge of the deposition behaviour of waxy hydrocarbons inrelation to the various process variables such as velocity, concentration andtemperature. The present work was performed to investigate the deposition andfouling characteristics of paraffin wax in kerosene solutions.
2. PREVIOUS WORK
2.1 Introduction
In the oil industry the formation of any predominantly organic matter in oilwell tubing, surface flowlines and other production equipment, is referred toas paraffin deposition(3’4). The deposits consist mainly of n-paraffins withsmaller amounts of branched and cyclic paraffins and aromatics5).
The literature n paraffin deposition deals primarily with flowlines atlaminar flow conditions. Some of the literature, however, discusses thevarious factors affecting deposition, making it relevant to heat transfer andprocessing conditions. The latest comprehensive review available on paraffindeposition is from 1955(6) and prior to that the most thorough examination ofthe problem is from 1932(1).
i

- 27 -
2.2 Paraffin Wax Solutions
The amount of paraffins in crude oils is usually in the range 1 — 30 percent(5), indicating the different deposition problems that may be encountered
in the oil industry. The cloud point temperature. of waxy hydrocarbons is a
controlling factor in paraffin deposition. It indicates the amount of wax in
solution and is determined empirically(7)as the temperature at which wax
crystals appear when petroleum oils are cooled under prescribed conditions.
Similarly, the pour point(8) is the temperature at which hydrocarbon solutions
show no movement at standard conditions.
The crystalline nature of paraffin wax has been investigated by a number ofworkers(9’10’11). Holder and Winkler() stated that paraffin wax crystals
have the appearance of very thin diamond shaped plates consisting of layers
of n-paraffins, stacked side by side parallel with the longer axis of the
crystal.
The size and number of wax crystals formed in solutions depend on the rate of
cooling. TronovO2) stated that a high rate of cooling favoured the formation
of a large number of crystals. Rafikov et ai03) studying paraffin based
petroleums, observed that on rapid cooling many centres of crystallization
arise, which lead to the formation of fine crystals. On slow cooling, however,
the crystallization process occurs under more uniform conditions and large and
more uniformly packed crystals are formed. Surface active components can have
an appreciable effect on the nature of paraffin crystallization, leading to a
depression of the pour point.
Both empirical and theoretical expressions are available for the solubility
of paraffin waxes in petroleum fractions(C).
2.3 Depasition Variables
2.3. Flowrate and time
Jessen and Howell(14) studied the effect of flowrate on paraffin deposition in
pipes. The main conclusion of their work was that in laminar flow deposition
increased with flowrate, reaching a maximum prior to transition to turbulent
flow and then decreasing with increasing turbulence. The increase in
deposition with flowrate was explained in terms of more particles being
carried towards the wall. As the flowrate increased the shear stress at thewall became equal to or exceeded the deposit strength and deposition becomes

- 28 -
less. Paraffin wax deposited at high flowrates was observed to beconsiderably harder than at low flowrates.
Tronov(12) studied the effect of flowrate on paraffin deposition. Theexperimental results showed that the deposit thickness decreased withincreasing velocity and that the deposit hardness, as expressed by the velocityrequired to remove it from the tube wall, increased with velocity. Tronovstated that studies on paraffin deposition indicated that the build—up ofdeposits alternates with their partial or total removal, independent of thenature of the surface. Armenski et al(l5) observed deposit removal followingtheir build-up when analysing the reduction in pipe diameter due to paraffindeposition.
Patton and Casad(16) studied paraffin deposition on a cold surface insertedinto a well stirred wax solution maintained above its cloud point temperature.They found that deposition increase asymptotically with time. The initialrate of deposition and the asymptotic deposit both decreased with increasedstirring. Hunt(3) and Patton and Jessen(4) found that paraffin depositionincreased asymptotically with time.
2.3.2 Temperature
Cole and Jessen(17) studied how the temperature difference between thesolution cloud point and a confining surface affected paraffin deposition.This was achieved by passing a kerosene-wax solution over a chilled copperplate. The amount of paraffin deposited was determined by removing the copperplate and weighing it. The temperature difference between the cloud pointand the plate temperature was considered most important in controlling theaccumulation. The experimental results showed that both the initial rate ofdeposition and the final amount deposited increased with the temperaturedifference. Jorda(b) has obtained similar exoerimental results.
2.3.3 Surface Properties
Cole and Jessen(1’) studied the effect of wettability on paraffin deposition.The etabiii:y of a copper plate was varied by applying different siliconecoatings. The contact angles were measured with water. The amount of paraffindeposited for a given temperature difference decreased with increasing contactangle. It was found that the temperature difference and free surface energyacted independently in determining the amount of wax depositing. A lowcontact angle means a high free surface energy and more wetting. Cole andJessen concluded that as paraffin wax is deposited on a surface it is held
in place by adsorption forces. The adsorption forces are dependent upon the
- 29 -
free surface energy possessed by both the paraffin and the surface. As thefree surface energy of the plate is reduced, a resultant decrease in theadsorption forces holding the paraffin to the plate surface takes place.This causes a decrease in the amount of paraffin which can be retained onthe plate surface for the flow conditions present. Patton and Jessen(4)investigated the effect of wettability on paraffin deposition. They foundthat deposition increased with increased free surface energy of the depositionsurface.
Hunt(3) studied the effect of roughness on paraffin deposition and concludedthat deposits do not adhere to metals themselves but are held in place bysurface roughness. Jorda(5) investigated the roughness effect in deposition.Paraffin deposition was found to increase with surface roughness. Patton andCasadC6) performed similar studies and concluded that no correlation couldbe observed between surface roughness and deposition. However, they arguedthat the adhesion bond at a surface should be proportional to the total contactarea and therefore related to surface roughness.
2.4 Summary
1. The nature of wax crystals formed in solutions is affected by the rate ofcooling and the presence of surfactants.
2. Paraffin deposition increases asymptotically with tine.
3. The initial rate of deposition and the asymptotic deposition both decreasewith increased flowrate.
4. The initial rate of deposition and the asymptotic deposition both increasewith increased difference between the solution cloud point and wall temperature.
5. increased fiowrate increases the strength of paraffin wax deposits.
6. Paraffin eDosits are held to deposition surfaces by adsorption forces.
7. Eaiiures can occur in paraffin deposits resulting in random processes ofbufld-up and break-down.
3. FOULING STUDIES
3.1 introduction
The present studies are an extension of work carried out by Walker(18) on the

- 30 -
fouling characteristics of paraffin wax in kerosene solutions. Walkerstudied the effect of flowrate, wax concentration, bulk temperature and timeon deposition in cooled heat exchanger tubes. A 51/54°C fully refined paraffinwax was dissolved in a commercial grade kerosene. The wax concentration usedin the experiments ranged from 4.2 to 26.4 per cent by weight, correspondingto cloud point temperature from 10 to 32°C respectively. The average bulktemperature ranged from 28.9 to 49.5°C. In all of the 46 runs the bulktemperature was kept above the cloud point. At concentrations below 10 percent the runs were carried out at ‘u 30°C and 50°C but at higher concentrationsonly at ‘-‘ 30°C. The Reynolds number of the paraffix wax-kerosene solutionsranged from 5045 to 25451 and experimental times were up to 167 hours.
The experimental results obtained by Walker08) showed that the overall heattransfer resistance did not increase continuously or approach an asymptoticvalue. Instead, the overall resistance fluctuated about an initial value.These fluctuations and the overall heat transfer resistance itself, were bothfound to increase with increasing wax concentration, decreasing flowrate anddecreasing bulk temperature. A visual examination of the paraffin wax depositsshowed them to vary from individual particles to extended areas, depending onthe operating conditions. The deposits were also found to be more extensiveat the colder downstream end of the heat exchanger tubes.
3.2 Experimental
The main purpose of the experimental work was to obtain data for longer periodsthan achieved by WalkerO8). It was hoped that this would show if an asymptoticheat transfer resistance would be reached or that it had been reached in thefirst few minutes, not detectable on the apparatus.
The experimenta wcrk was carried out in the sare apparatus as used by WalkerO8)with minor modifications (see Figure 1). The apparatus was basically a closedcirculation loop where an experimental solution could be circulated a constantbulk temperatu’e and flowrate through ten parallel heat exchangers. Theexchanger tubes were mounted vertically between horizontal delivery and dischargemanifolds and were cooled by constant flowrate water from the mains, flowingcounter-current to the experimental solution. The ten simulate heat exchangertubes were made from copper 13.1 mm ID and 15.00 mm OD having an entry lengthof 762 mm with a further water-jacketed section 914 mm long. The water jacketwas mace from 19.1 mm ID copper pipe. The holding tank of the apparatus was2660 litres stainless steel while all the pipework was made from copper. The

- 31
experimental procedure consisted of regularily measuring the inlet andoutlet temperatures of the paraffix wax-kerosene solution and the coolingwater. The flowrates were also measured. Before starting the extendedexperimental runs the apparatus was tested for reproducibility as compared withWalker’s(18) results.
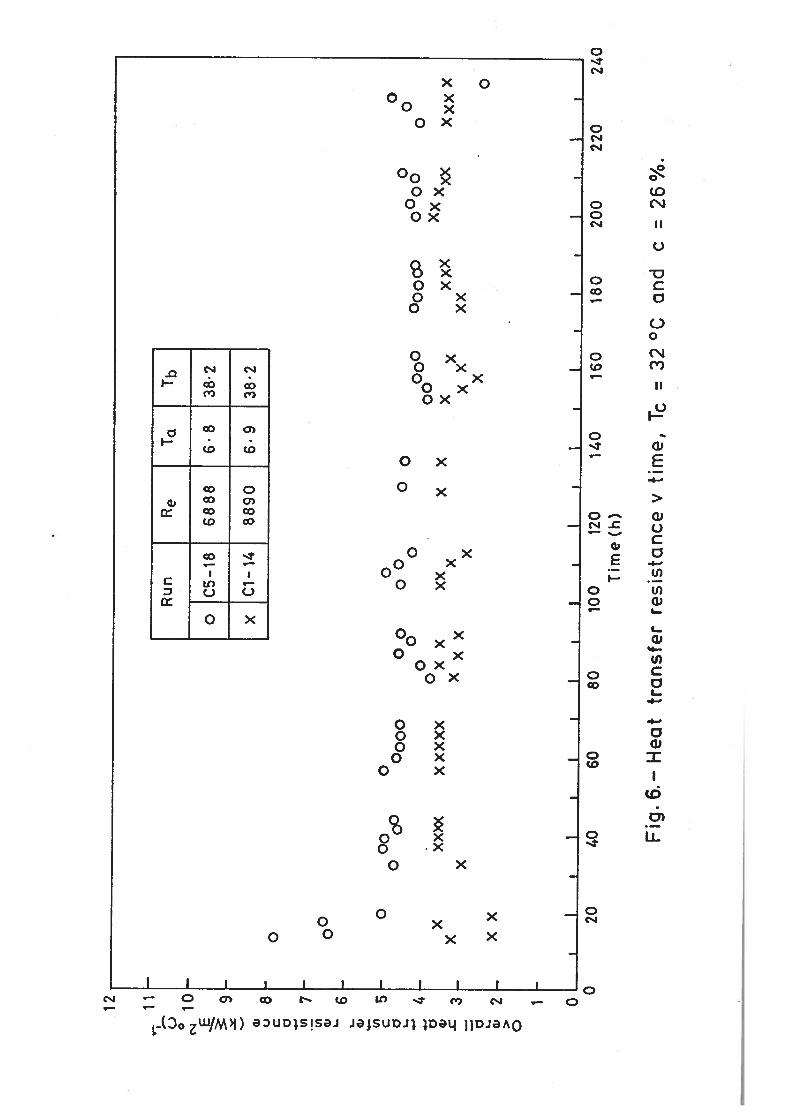
The paraffin wax-kerosene solution used in all the present experimental workwas 26.4 per cent wax with a cloud point temperature of 32°C. The Reynoldsnumbers obtained ranged from 3000 to 13000 and the bulk temperatures from33 to 43°C. The maximum experimental times reached were 220 hours. In all,22 experimental runs were obtained.
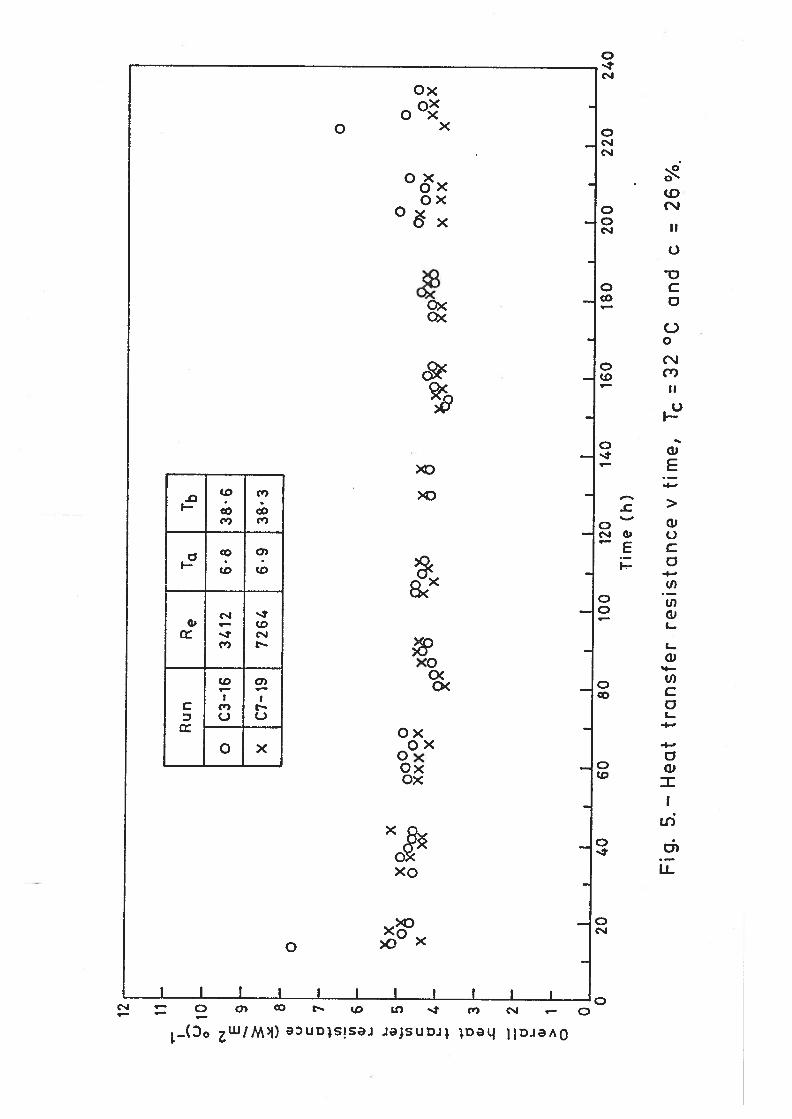
The temperature and flowrate data were used to calculate the overall heattransfer resistance of each exchanger with time. A computer program wasdeveloped for this purpose. WalkerC18) and Bott and Gudmundsson(A) have giventhe physical property data used in the calculations. Walker(l8) has giventhe basic calculation procedures. The overall heat transfer resistance wasused as an indication of the change of fouling resistance with time since thewall resistance was low and the water flowrate constant. Most of theexperimental results are shown in Figures 2 - 8 where the overall resistanceis plotted with time.
The experimental results confirmed the findings of Walker(18). The overallheat transfer resistance did not increase continuously or approach an asymptoticvalue, even at the extended experimental times of 220 hours. Instead, itfluctuated about an initial value. These fluctuations and the overall heattransfer resistance both decreased with flowrate and temperature.
3.3 Temperature Profile
in all the experinental work the solution bulk temperature was maintainedabove its c;oud point teperature(’’). The deposition process was thereforecofine o the cooled heat exchanger tubes. Clearly, the temperaturecc:tors existing at the exchanger wall govern the deposition process to alarge extent. It was decided to investigate the likely temperaturedistribution (profile) in the experimental heat exchangers at asymptoticconditions.
There are two significant temperatures at which changes take place near acold deposition wall. At the cloud point wax particles will be formed and at

— 32 —
the pour point the solution becomes solid. It was found for the 51/54°Cparaffix wax solution used in the experimental work that the pour point was
3 - 4°C below the cloud point for the concentrations investigated(A,BC)
A computer program was developed to calculate the velocity and temperatureprofiles in turbulent pipe flow. The program was developed for the paraffinwax—kerosene solutions used by Walker(8) and in the present studies(A).
The program was based on the work of Deissler(l9) and predicted the temperaturedistribution from the expressions:
+(a) y < 26
++dy
T
+ n2u+y exp(n2 uyj]
(1)
Pr 11
(b) y>26
- 1 ++T = lrj._-+T1 (2)
K y
where:+
= dimensionless distanceu±
= dimensionless velocityT+
= dimensionless temperature
Pr = Prandtl number
n constant
u = viscosity
= viscosity at wall
K = constant
and y is the lowest value of y for which Equation 2 applies and is thedimensionless terperature at that distance. Equation 1 includes the effect ofvariable viscosity and must be solved iteratively. The dimensionless temperaturewas defined as:
(T - T ) C T=
W p W.... (3)
u*

- 33 -
where T is the temperature at some distance y from the wall, T. -r andthe temperature, shear stress and heat flux at the wall, respectively, and
and u the heat capacity and friction velocity.
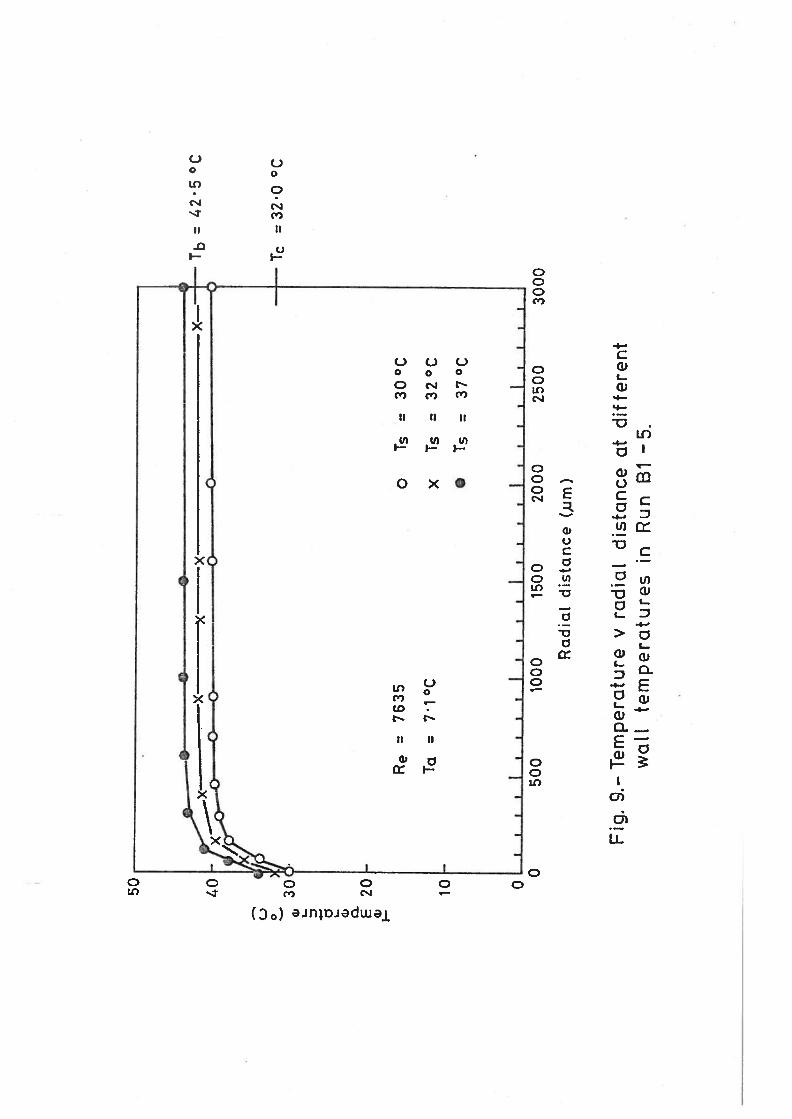
From the experimental heat transfer data used to calculate the overall heattransfer resistance in Figures 2 — 8, all the variables in Equations 1 —3were known or could be evaluated, except the wall temperature T. In thepresent analysis the wafl temperature T in Equation 3 was taken as thetemperature T5 of some surface that respresented the effective boundary ofthe flow passage. Therefore, the correlations developed for turbulent flowin clean tubes could be applied to the case where a thin layer of wax haddeposited. For a given experimental run the solution average bulk temperaturewas known. The program calculation procedure consisted of finding a surfacetemperature T5 that produced a temperature profile thatwas consistent withthe experimental solution bulk temperature.
Walker’s08) data and the results obtained in the present fouling studies wereused in the temperature profile analysis. Most of the calculations showedthat if the surface temperature T5 was equal or close to the solution cloudpoint, the temperature profile corresponded well with the experimental bulktemperature. Figure 9 shows the profile for Run 31-5 whose overall heattransfer resistance is plotted in Figure 2.
3.4 Comments
The experimental results have shown that paraffin wax fouling in turbulentpipe flow depends on flowrate, temperature and concentration and that theoverall heat transfer resistance fluctuates with time. The deposition appearsto consist of continuous build-up and break-down processes. To investigatethis further a typical experimental Run F38 by WalkerO8) for which theindivcua neat transfer coefficients had been calculated, was selected foranalysis:
eynolds number Re = 14345
Wax concentration c = 15%Estimated cloud point T = 28°C
Average bulk temperature Tb = 31°CAverage overall heat R = 2.3987 (kt1/m20C)1transfer resistance
Estimated foulingresistance Rf = 1.7483 (kW/m20C)’

- 34 -
The standard deviation of the overall heat transfer resistance R wascalculated as 0.1585 (kW/m20C)’ from the experimental data of Nalker(18).The maximum fluctuation from the average overall resistance was found to be0.3100 (kW/m20C)’. Therefore, the standard deviation represented a deviationof 9.1 per cent from the estimated fouling resistance and the maximumfluctuation a deviation of 17.7 per cent. The fouling resistance thereforechanged by about 4 standard deviations going from minimum to maximum but moretypically by only 2 standard deviations. These calculations show that theamount of wax required to break down or build up and give rise to the measuredfluctuations in the overall heat transfer resistance, may typically be 10 - 20per cent of the average wax deposited.
The shear stress at the pipe wall, in the simulated heat exchanger tubes, willincrease during deposition because of the reduction in flow area, assumingconstant flowrate. From the fouling resistance Rf = 1.7483 (kW/m20C)1 aboveand the thermal conductivity of a typical wax given by Nelson(2) ask = 0.0002387 (kW/m °C) the average deposit thickness for Run F38 was evaluatedRfk 0.42 mm. For a tube having ID 13.1 mm this represents a change indiameter of 6.4 per cent resulting in an increase in average velocity of 14.2per cent and an increase in shear stress at the wall of 30.4 per cent.
For the experimental results plotted in Figures 2 - 8 the solution bulktemperature Tb and the cooling water bulk temperature Ta were 38 - 43°C and
7°C respectively. The cloud point temperature was Tc = 32°C and the pourpoint temperature 3 - 4°C lower. It was shown for the present experimentalresults that the average fouling resistance was up to 3x the estimated cleantube overall heat transfer resistance. Therefore, the tube wall temperature Twas much closer to the cooling water temperature Ta than the solutiontemperature Tb. The tube wall temperature can be estimated from therd ationship:
T + (R /R) TT = a or
....(4)W1 + (R0/Rf)
derived by considering the heat flux across the tube wall with a deposit.Walker(18) estimated the cooling water (outside) heat transfer resistanceR0 = 0.0317 (kW/m20C)’ for Run F38 discussed above. It was shown inSection 3.3 that the surface of the paraffin wax deposit was at the cloudpoint temperature such that T5
= Tc 28°C and that Rf = 1.7483 (kW/m20C)’.Taking the cooling water temperature(’’) as Ta = 6°C the average wall temperature
- 35 -
in Equation 4 was calculated as 6.4CC. Therefore, Tw ‘ Ta in the presentexperimental work. The inside and wall resistances for Run F38 wereR = 0.6164 (kW/m20C)’ and R = 0.0023 (kW/m20C)’ respectively.
4. DEPOSITION STUDIES
4.1 Introduction
In Section 3 it was shown that the overall heat transfer resistance did notincrease asymptotically with time. However, the deposition studies reviewedin Section 2 showed that in some model systems the deposition increasedasymptotically with time, reaching stable values in 1 — 2 hours. It wasconsidered likely that the asymptotic build-up for the paraffin wax-kerosenesolutions was too rapid to be detected on the fouling studies apparatus. Tostudy the initial deposition behaviour of the experimental solutions it wasdecided to construct a special apparatus where the deposition could be observedvisually during operation and examined in detail on shut—down.
4.2 Apparatus
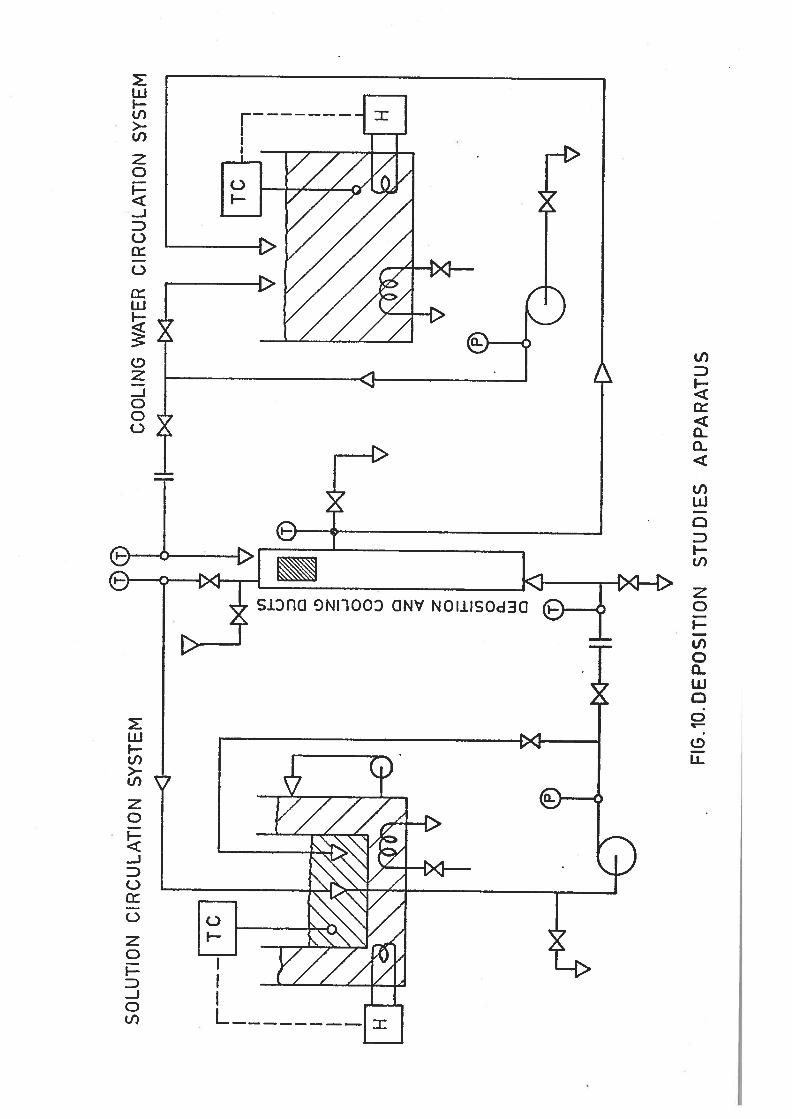
The deposition studies apparatus was basically two closed circulation systemswhere paraffin wax was allowed to deposit on a copper plate cooled with water.See Figure 10. The experimental solution and the cooling water were circulatedthrough rectangular ducts, separated by the deposition plate. The depositionand cooling ducts were similar to the flow cell first used by Cole and Jessen(17)and later by Patton and Jessen(4). The present duct, however, had a long entrysection on the solution side while the water side just covered the copper plate.
The experimental solution and cooling water systems were basically the same.Both had constant temperature tanks and centrifugal circulation pumps, feedingthe respective ducts. The solution and cooling water tanks were 46 litres and114 litres, respectively, both made of galvanized steel. Steam traced copperpDes were used throughout. The solution and cooling water inlet and outlette:eratures were iieasured with —10 to 50 x 0.1°C mercury—in—glass thermometers.Flowrates were measured with orifice meters connected to mercury manometers.
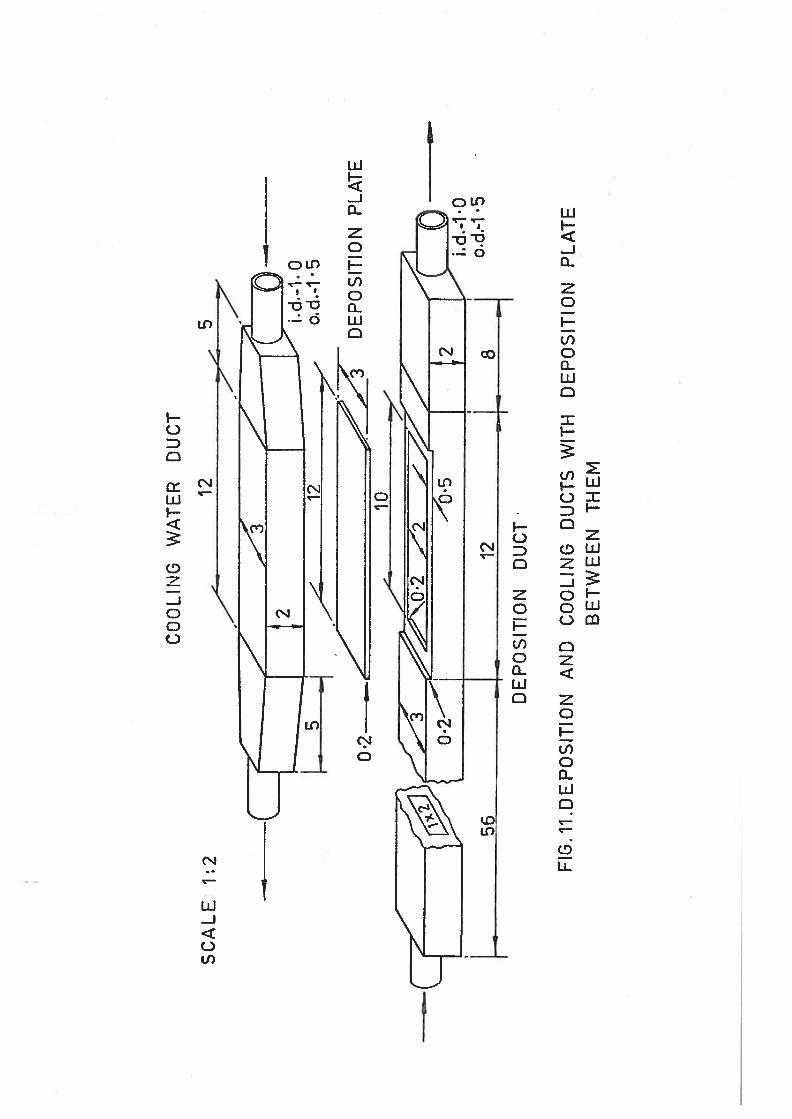
The deposition assembly was designed to simulate the deposition of paraffinwax in heat exchangers. The assembly consisted of deposition and cooling ductsand a copper plate as shown in Figure II. The assembly was placed verticallyin the apparatus. The experimental solution entered at the bottom and the

— 36 —
cooling water at the top, making the flow counter-current. The depositionand cooling ducts were made from 0.5 cm Perspex glued together. The depositionduct was a 1 x 2 cm rectangular channel, 76 cm long. At the downstream endof the duct a 2 x 10 cm area was cut out to fit a copper plate. The inlet andoutlet of the deposition duct had 6 cm long tapered sections where the flowarea was reduced to 1 x 1 cm. Perspex pipes were drilled into the taperedsections to connect the deposition duct to the pipework of the circulationsystem. Expansion bellows were fitted between the Perspex pipes and the rigidpipework. The effective entry length before the deposition plate was 51 cm.The velocity distribution in the deposition duct was therefore fully developedbefore reaching the plate. The 2 x 10 cm surface of the copper plate was flushwith the wall of the deposition duct. A paper gasket was used for sealingbetween the copper plate and the deposition duct. The copper plate was sandblasted on the surface areas facing the deposition and cooling ducts. Theblasting medium was described as 30/40 mesh, non—silica. It was hoped that thesand blasted plate would represent conditions more like those existing in thefouling studies heat exchangers rather than a polished surface. The coolingwater duct was 12 cm long with tapered inlet and outlet sections 5 cm long each.The tapered sections were filled with wire mesh to promote better flowdistribution in the duct. The rectangular duct was 1 x 2 cm at each end but1 .5 x 2 cm where the copper plate was since the Perspex wall thickness was0.5 cm. The copper plate was therefore not flush with the wall of the coolingduct. The deposition and cooling ducts were bolted together.
4.3 Experimental
For each experimental run the apparatus was allowed to reach its operatingconditions by passing the paraffin wax-kerosene solution and cooling waterthrough the bypass lines. The flow streams were then diverted through thedeposition assembly at the controlled flowrates. The inlet and outlettemperatures for both streams were measured several times during experiments.At the end of an experiment the solution and cooling water streams werediverted through the bypass lines and the deposition duct drained quickly andfoHo,ed by the cooling duct. The shut-down procedure took about 30 seconds.The deposition plate was removed by dismantling the cooling water duct from thedeposition duct.
Some slurry-like wax solution was left on the deposit as a result of shut-down.This was washed off by gently pouring fresh kerosene over the plate, leaving
— 37
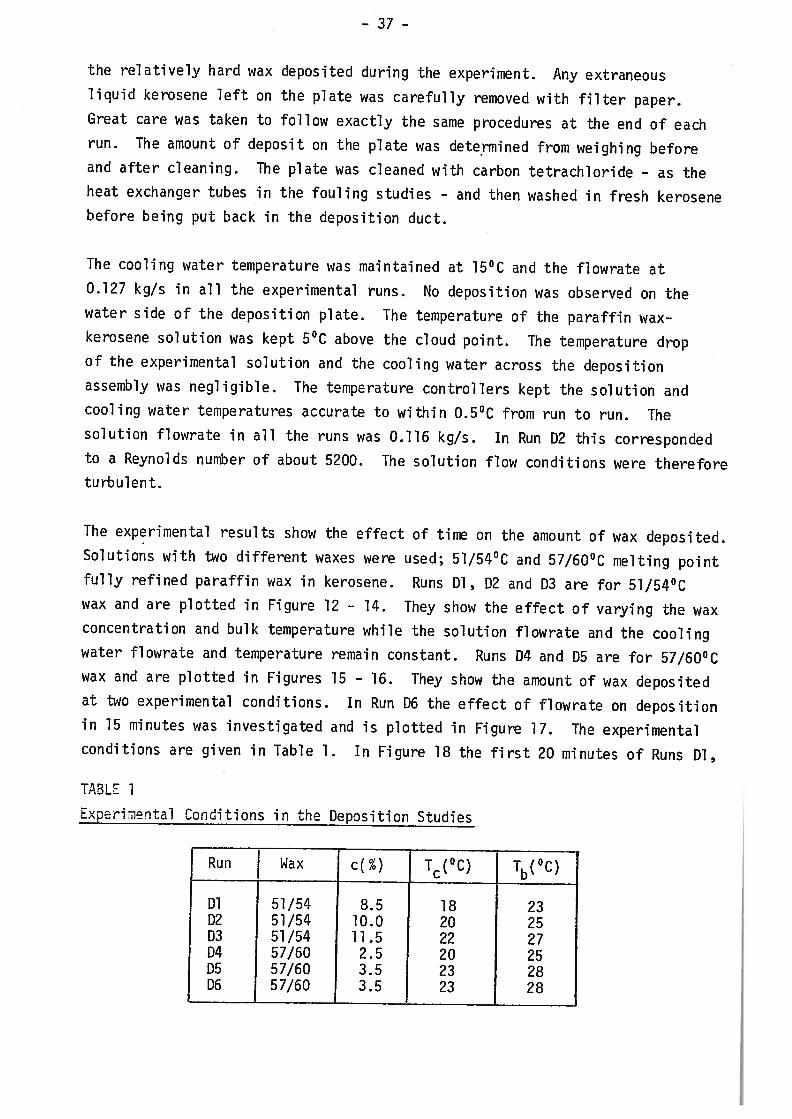
the relatively hard wax deposited during the experiment. Any extraneousliquid kerosene left on the plate was carefully removed with filter paper.Great care was taken to follow exactly the same procedures at the end of eachrun. The amount of deposit on the plate was determined from weighing beforeand after cleaning. The plate was cleaned with carbon tetrachioride - as theheat exchanger tubes in the fouling studies - and then washed in fresh kerosenebefore being put back in the deposition duct.
The cooling water temperature was maintained at 15°C and the flowrate at0.127 kg/s in all the experimental runs. No deposition was observed on thewater side of the deposition plate. The temperature of the paraffin wax—kerosene solution was kept 5°C above the cloud point. The temperature dropof the experimental solution and the cooling water across the depositionassembly was negligible. The temperature controllers kept the solution andcooling water temperatures accurate to within 0.5°C from run to run. Thesolution flowrate in all the runs was 0.116 kg/s. In Run D2 this correspondedto a Reynolds number of about 5200. The solution flow conditions were thereforeturbulent.
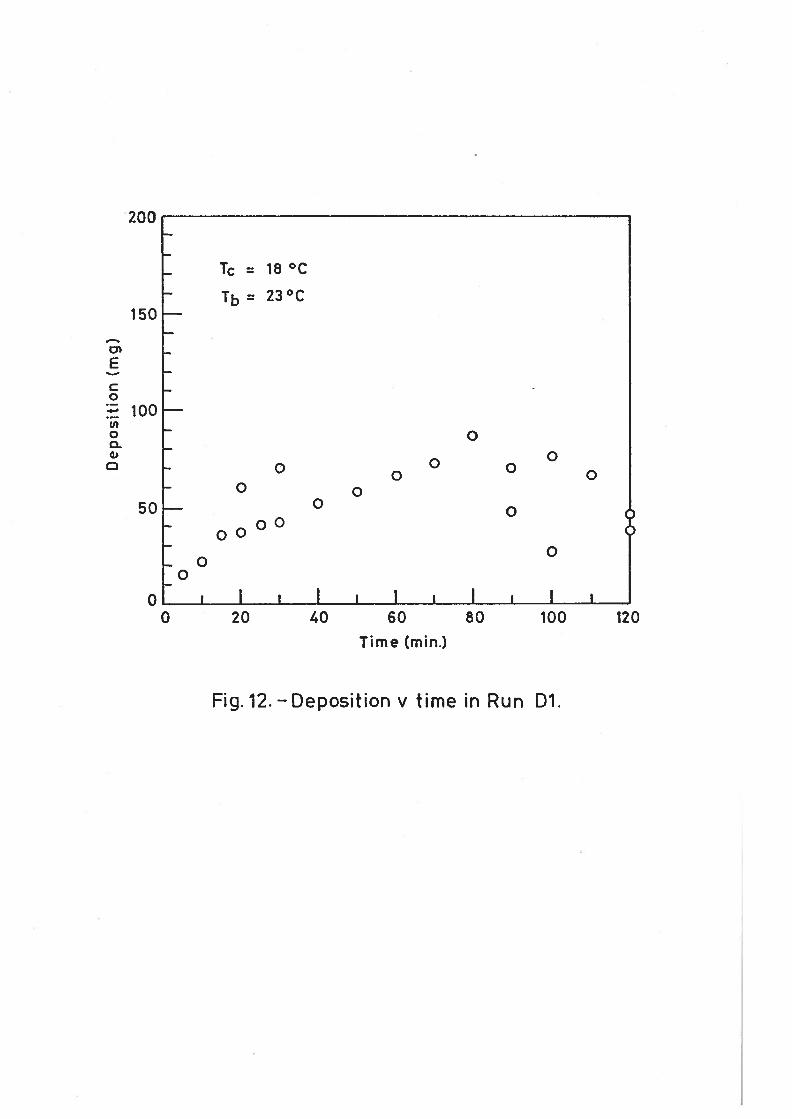
The experimental results show the effect of time on the amount of wax deposited.Solutions with two different waxes were used; 51/54°C and 57/60°C melting pointfully refined paraffin wax in kerosene. Runs Dl, D2 and D3 are for 51/54°Cwax and are plotted in Figure 12 - 14. They show the effect of varying the waxconcentration and bulk temperature while the solution flowrate and the coolingwater flowrate and temperature remain constant. Runs D4 and D5 are for 57/60°Cwax and are plotted in Figures 15 - 16. They show the amount of wax depositedat two experimental conditions. In Run D6 the effect of flowrate on depositionin 15 minutes was investigated and is plotted in Figure 17. The experimentalconditions are given in Table 1. In Figure 18 the first 20 minutes of Runs Dl,
TABS I
xertenta1 Conditions in the Deposition Studies
un Wax c(%) T(°C) Tb(°C)
I Dl 51/54 8.5 18 23D2 51/54 10.0 20 25D3 51/54 11.5 22 27D4 57/60 2.5 20 25D5 57/60 3.5 23 28D6 57/60 3.5 23 28
38 -
D2 and D3 have been plotted to show the effect of concentration on deposition.Each experimental point was obtained from separate measurements performed ina random order.
4.4 Comments
The experimental results showed the asymptotic nature of paraffin waxdeposition; the deposition increased with time to reach a final fluctuatingvalue. This final asymptotic value was reached more quickly at higherconcentrations as shown in Figure 18. The deposits were found to cover thedeposition plate evenly. The deposits were firm, although the firmnessdecreased with concentration. At experimental times approaching two hours thedeposits were observed to wear off at the leading edge of the deposition plate.In the three runs (Dl, D2 and D3) where the 51/54°C wax was used the highestconcentration run did not produce the highest final value although it gave thehighest initial deposition rate. Evidently the paraffin deposits broke downearlier at higher concentrations. Since the thickness of the depositsincreased with time and concentration it suggests that break-down occurs whena certain critical thickness was reached. As expected, deposition decreasedwith increased flowrate.
5. DISCUSSiON
5.1 Mechanism
When a solution containing a wax foulant enters a clean tube that is cooledbelow the cloud or pour point temperature, deposition will occur. As the waxdeposits built up the heat flux decreases gradually, due to increased thermalresistance, and fewer wax particles will be formed. This lower particle
concentration reduces the number of particles reaching the wall and therebythe deposition. For the experimental conditions adopted in the present studiesthe wall temperature was always below the pour point and the wax particles cameout of the solution inside the boundary layer. It is suggested that asuspension of wax crystals may exist in the boundary layer from the surface ofthe solid wax, at the pour point temperature to a temperature interfacerepresented by the cloud point Tc Clearly, the behaviour of the smallparticles in the boundary layers is important in paraffin wax deposition andfoul i n g.
The average deposit thickness x at asymptotic conditions can be calculated

- 39 -
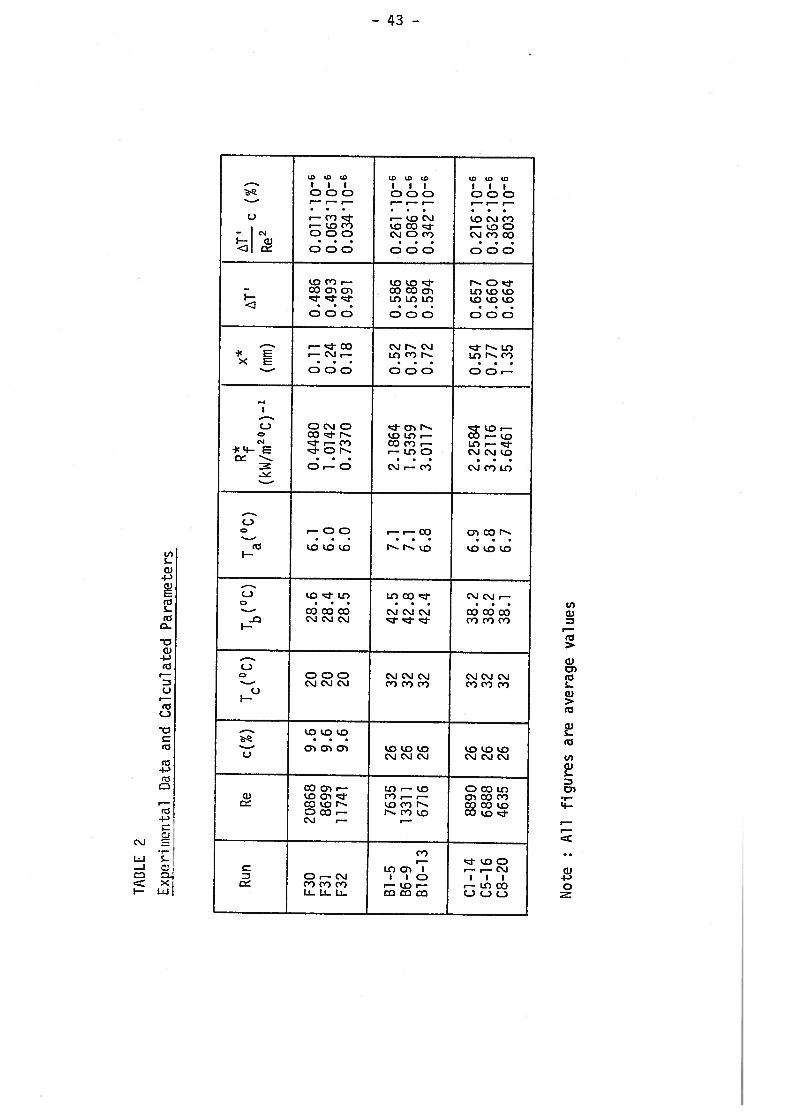
from x = R k, as shown in Section 3.4 above, where R and k are theasymptotic fouling resistance and k the wax thermal conductivity. This hasbeen done in Table 2 and the deposit thickness found to be in the range0.11 - 0.77 mm. Assuming constant flowrate and friction factor conditionsthe shear stress at the wall c. d4 will therefore increase by 7—65 percent during deposition from clean to asymptotic conditions. These increasesand the decrease in heat flux will be the major factors contributing to theasymptotic behaviour of paraffin wax deposition and fouling.
The fluctuating nature of the overall heat transfer resistance in the foulingstudies indicated continuous build-up and break—down of the paraffin waxdeposits. The strength of wax deposits will depend upon a close and regularpattern of the crystals. As deposition increases with time the likelihoodof such a regular pattern being sustained is reduced and eventually a planeof weakness will develop. The wax deposit breaks down and is removed fromthe tube surface, probably leaving a thin granular layer. The granular layermay represent a well oriented matrix of crystals with few planes of weakness.The creation of planes of weakness and the increase in shear stress at thewall as deposits build up are probably the main factors causing break—downand removal, giving rise to the characteristic wax deposition and fouling.
The present work has shown that in turbulent flow the deposition at asymptoticconditions decreases with flowrate. Heat, mass and momentum transfer allincrease with flowrate. While heat and mass transfer are necessary fordeposition to occur, the deposition at asymptotic conditions is probably moredependent on momentum transfer in the form of shear stresses at the wall.The transport of material to the surface is therefore not the limiting factor,but the cohesive properties of the particles depositing. Increased temperatureand concentration will decrease and increase the number of particlesavailable for deposition, respectively, and also affect their cohesiveroperties.
5.2 ‘DCC1
The following characteristics of paraffin wax deposition and fouling haveemerged from the literature reviewed and the present studies.
1. Initial rate of fouling (dRf/dt)t0 and asymptotic fouling resistance Rdecrease with flowrate and increase with temperature difference AT(5l2’l4,16,17,18,A)

- 40 -
2. Deposit hardness increases with f1owrate(12’4).
3. Deposition is heavier at the downstream end of heat exchangers (1 8)
The various deposition-release fouling models were reviewed in Part I, Section 3.It was stated that these models have met with some success in predicting heattransfer fouling. Such a model will be proposed in the present section todescribe deposition and fouling by paraffin wax—kerosene solutions. The modelincludes a stickability term s and mass flux towards the wall N, in thedeposition function, as suggested by Watkinson(20). The exact expressions,however, are based on observations related to paraffix wax systems. Therelease function includes the effect of deposit hardness similar to that ofTaborek et ai(2U. The following deposition—release model is proposed:
dR= k1sN-k2()T ....(5)
dt u W
where: Rf = fouling resistance
s = stickability
N = foulant mass flux
x deposit thickness
u = friction velocity
TW = shear stress at wail
k1 = deposition coefficient
k2 = release coefficient
In accordance with the experimental observations it is suggested that thestickability be expressed by:
k AT’s=
Lw
where k3 is a constant and AT’ the temperature driving force causing deposition.
T -TAT = c w.... (7)
Tb
This dimensionless temperature difference applies to systems where thesolubility increases with temperature.
- 41 -
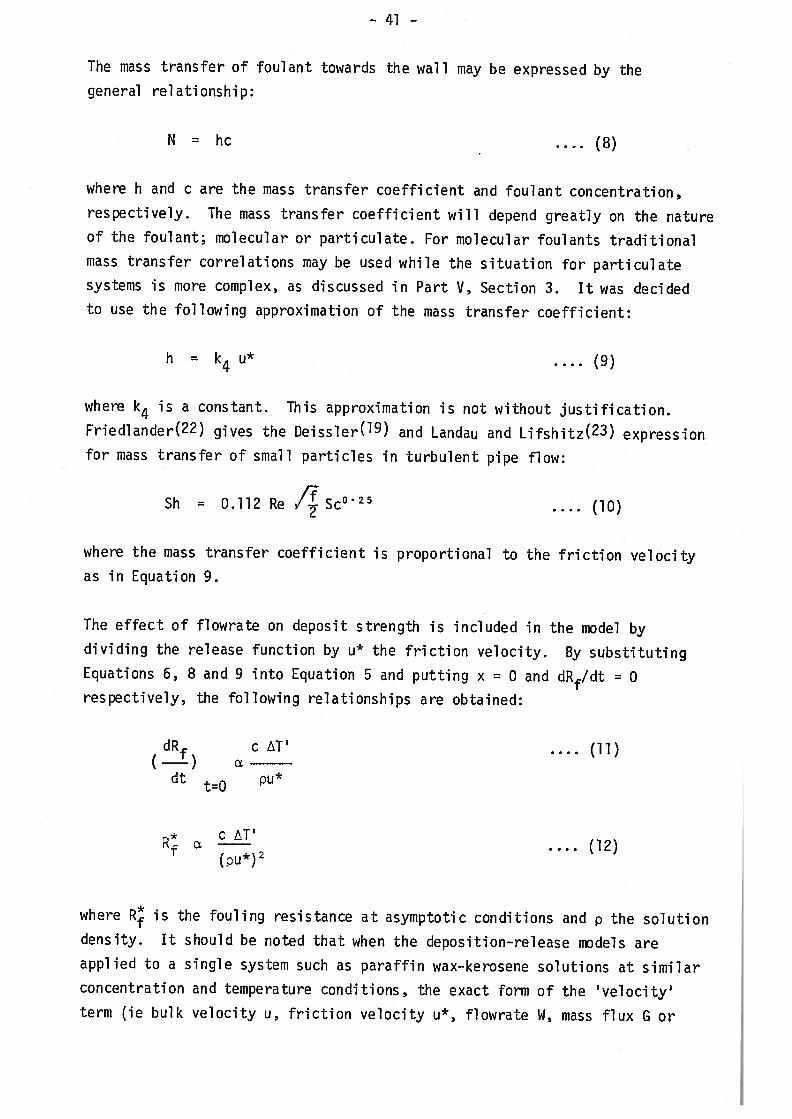
The mass transfer of foulant towards the wall may be expressed by thegeneral relationship:
N = hc .... (8)
where h and c are the mass transfer coefficient and foulant concentration,respectively. The mass transfer coefficient will depend greatly on the natureof the foulant; molecular or particulate. For molecular foulants traditionalmass transfer correlations may be used while the situation for particulatesystems is more complex, as discussed in Part V. Section 3. It was decidedto use the following approximation of the mass transfer coefficient:
h = k4u*.... (9)
where k4 is a constant. This approximation is not without justification.Friedlander(22)gives the OeisslerO9)and Landau and Lifshitz(23)expressionfor mass transfer of small particles in turbulent pipe flow:
Sh = 0.112 Re 4SC0.25 (10)
where the mass transfer coefficient is proportional to the friction velocityas in Equation 9.
The effect of flowrate on deposit strength is included in the model bydividing the release function by u the friction velocity. By substitutingEquations 6, 8 and 9 into Equation 5 and putting x = 0 and dRf/dt = 0respectively, the following relationships are obtained:
dRf C AT’.... (11)
(—)L.U
C i.... (12)
(cu*)2
where R is the fouling resistance at asymptotic conditions and p the solutiondensity. It should be noted that when the deposition-release models areapplied to a single system such as paraffin wax—kerosene solutions at similarconcentration and temperature conditions, the exact form of the ‘velocity’term (ie bulk velocity u, friction velocity uk, flowrate W, mass flux G or
- 42 -
Reynolds number) is not all that important.
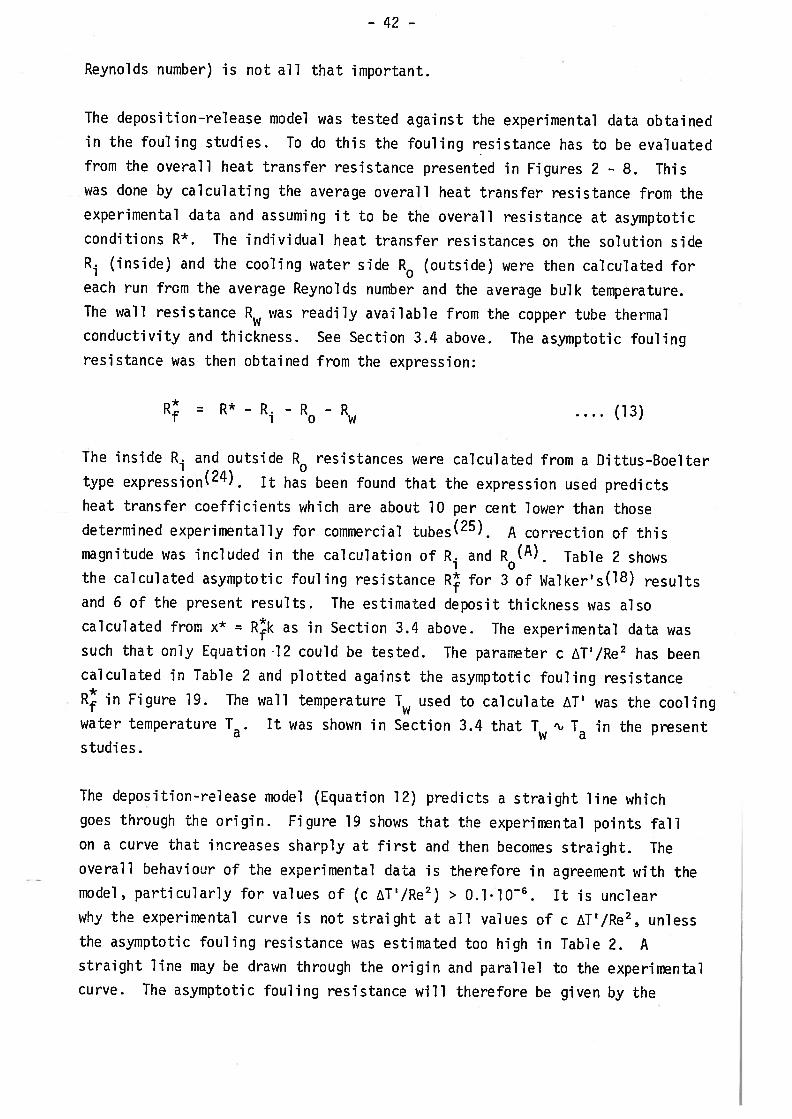
The deposition—release model was tested against the experimental data obtainedin the fouling studies. To do this the fouling resistance has to be evaluatedfrom the overall heat transfer resistance presented in Figures 2 — 8. Thiswas done by calculating the average overall heat transfer resistance from theexperimental data and assuming it to be the overall resistance at asymptoticconditions R*. The individual heat transfer resistances on the solution sideR1 (inside) and the cooling water side R0 (outside) were then calculated foreach run from the average Reynolds number and the average bulk temperature.The wall resistance R was readily available from the copper tube thermalconductivity and thickness. See Section 3.4 above. The asymptotic foulingresistance was then obtained from the expression:
R = R*- R1 - R0
- R .... (13)
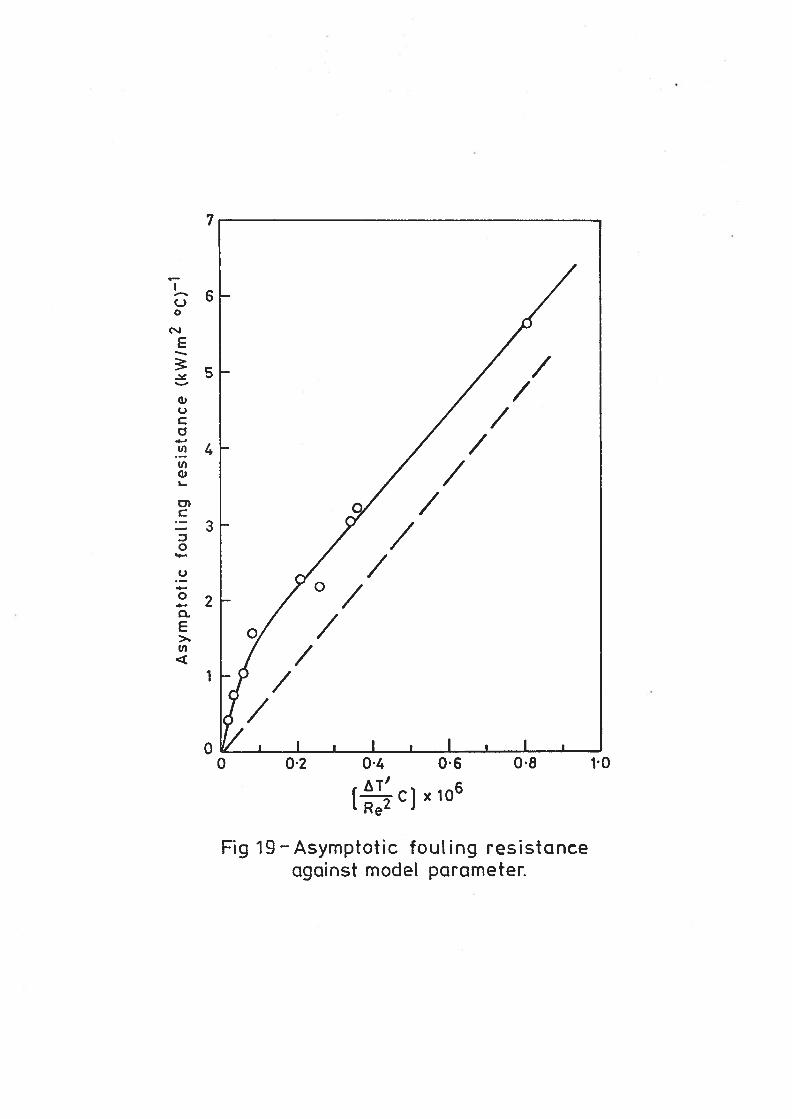
The inside R. and outside R resistances were calculated from a Dittus-Boeltertype expression(24). It has been found that the expression used predictsheat transfer coefficients which are about 10 per cent lower than thosedetermined experimentally for commercial tubes(25). A correction of thismagnitude was included in the calculation of R1 and R0(A). Table 2 showsthe calculated asymptotic fouling resistance R for 3 of Waiker’s(l8) resultsand 6 of the present results. The estimated deposit thickness was alsocalculated fro’ x = Rk as in Section 3.4 above. The experimental data wassuch that only Equation 12 could be tested. The parameter c AT’/Re2 has beencalculated in Table 2 and plotted against the asymptotic fouling resistanceR in Figure 19. The wall temperature T used to calculate AT’ was the coolingwater temperature Ta• It was shown in Section 3.4 that T ‘- Ta in the presentstudies.
The deposition-release model (Equation 12) predicts a straight line whichgoes through the origin. Figure 19 shows that the experimental points fallon a curve that increases sharply at first and then becomes straight. Theoverall behaviour of the experimental data is therefore in agreement with themodel, particularly for values of (c AT’/Re2) > 0.l•l0. It is unclearwhy the experimental curve is not straight at all values of c AT’/Re2, unlessthe asymptotic fouling resistance was estimated too high in Table 2. Astraight line may be drawn through the origin and parallel to the experimentalcurve. The asymptotic fouling resistance will therefore be given by the
TABL
E2
Expri
inon•J
—__
n!_
Cal
cula
ted
Par
amet
ers
fl*
AT
IR
unRe
c(%
)T
(°C
)T
b(°C
)T
a(°C
)R
fX
T’
.—c
(%)
(kW
/m20
C)’
(mm
)R
e2
F30
2086
89
.620
28.6
6.1
0.44
800.
110.
486
0.01
1.1D
_6F3
186
999
.620
28.4
6.0
1.01
420.
240.
493
0.0
63
.10
_6
F32
1174
19.6
2028
.56.0
0.73
700.1
80.
491
0.0
34
.lO
_6
Bl-
576
3526
324
2.5
7.1
2.18
640.
520.
586
0.2
6l.
10_6
86-9
1331
126
3242.8
7.1
1.53
590.3
70.
586
0.0
86l0
—81
0-13
6716
2632
42
.46
.83.
0117
0.7
20.
594
0.3
42l0
_6
C1—
1488
9026
3238.2
6.9
2.25
840.
540.
657
0.2
l6.l
O_6
C5—
1668
8826
3238
.26.8
3.21
160.
770.
660
0.3
62.1
06
C8—
2046
3526
3238
.16.7
5.64
611.
350.
664
0.8
0310
Not
e:
All
figure
sar
eav
erag
ev
alu
es

- 44 -
approximate expressi on:
R = 6.106 (I_c) (]4)Re2
6. CONCLUSIONS
1. The deposition of paraffin wax from kerosene solutions onto cooledsurfaces increases asymptotically with time.
2. The asymptotic fouling resistance fluctuates at random with time due todeposit build-up and break-down.
3. The amount of wax depositing at initial and asymptotic conditions decreaseswith flowrate and temperature but increases with concentration.
4. The cohesive properties of wax crystals appear to be important in themechanism of deposition.
5. Paraffin deposition and fouling may be described by a deposition—releasemodel where the initial rate of fouling and the asymptotic fouling resistanceare inversely proportional to friction velocity and friction velocity squared,respectively.
7. RECONMEND.TIONS
1. Further work should be carried out to test the proposed deposition-releasemodel, particularly the initial rate of fouling.
2. The increase in pressure drop during asymptotic build-up should beinvestigated. Shear stresses at the wall could then be related to strengthof deposits.
3. The weighing ‘.ethod used to determine deposition may be improved byevaporating the extraneous solvent under vacuum.

RE
TU
RN
E3Y
PA
SS
C
o-J
UJL
LJW
LL
IL.J
ST
EA
M50
psi
g
TE
N
TE
ST
SE
CT
ION
S
WA
TE
RFR
OM
MA
INS
DR
AIN
FE
ED
LIN
E
Fig.
1.—FL
owdia
gra
mof
the
fouL
ing
studie
sappara
tus

Fig.2.- Heat transfer resistance v time,
T=32°C and c26%.
Run Re T Tb
0 B1-5 7635 7-1 42-5
X B2—6 6052 Ti 425
.1869 13311 71 42-8
0
x
0
00
c’.1E
a)UC
U)I’,
a)U)C0
-I
01-c
0I-
a)>0
12
11
10
9
8
7
6
5
4
3
2
1
00
-
)O(X xxxxx x
°d 0o 0ooo000 0
-
xi). ••• •
I I i I t I I i
20 40 60 80 100Time (h)

—S
C-)0
c—IE
-
UCC-s
U)
I—
U)Cci
ci
I.
C-;
>0
Fig.3.— Heat transfer resistance v time,
‘FF’
Run Re Ta Tb
0 83-7 7697 71 431
X 87—lO 4306 6-6 42-4
• B10-13 6716 GS 42-4
14 —
13 -
12 -
11 —
10 -
9-
8-
7—
6—
5-
4-
3-
2—
0
x
>(
0•9
X x XXX XX X
X X
0
e .0•. S
00
0
XXX X
S0• S
0000
0 20 40 60I I t I I
Time (h)80 100
Tc 32 °C and c 26%

12
0 20I I I I
40 60I I
80 100Time (h)
Fig. 4.- Heat transfer resistance v time,
Run Re Ta Tb
0 B4-8 8435 7•1 426
X B8-11 9500 70 435
• 89-12 5161 68 425
C)0
a,U
cS
U,
;; 7 -
a,I—
. 6—a,
U,
L.
a,.c3
‘-2a,>0
1
0
. .
•S.
0000
xXX)&
0000
)OGxo0 0
xxx
T 32°C and c 26%.
Run
Re
Ta
Tb
0C
3-16
34
12
68
386
xC
7-19
72
64
69
383
12 11
10
c3
1
2—U
; >1
0
0
0 x
X00
00
0X
XX
X
22°
0 X
00
Ox
XX
X
0 XX
X
020
4060
80
100
,I
tIiIil
,I
-I
Tim
e(h
)
120
140
160
180
20
02
20
240
Fig
.5.
—H
eat
transf
er
resi
stance
vti
me,
T32°C
and
c=
26
%.
Tim
e(h
)
C2
6%
.
Run
Re
Ta
Tb
0C
5—18
68
88
68
382
xC
1-’1
48890
6.9
382
12 11() 1o
a) o8
a)
0 00
0
XX X
X
00
00
0O
0
XX
XX
X
0 X
oo000
XX
x XX X
0
00000
XX
XX
XX
XX
x
00
0 XxX
)< 0
II
iI
iI
II
II
iI
iI
tI
Ii
Ii
I20
4060
8010
012
014
016
018
020
022
024
0
Fig
.6.
—H
eat
tran
sfer
resi
stan
cev
tim
e,T
=32
°Can
d

12
n C.)
0 6 a.’ U
2
U) (1) I ci.’
U) L. cs a) ci a) > 0
xx
xx
0
-0
-x xx
x
0
11 10 9 8 7 6 S 4 3-
2 1-
0. 0
0
0
00
00
00
xxxx
xxx
xx
x
000
0
00
0000
0
000
0ocD
O0
00
00
00
,x
xxxx
xx
xxx
xxx
XX
XX
XX
xxxx
x
II
II
iI
iI
iI
iI
i
x
204
060
8010
012
014
016
018
02
00
220
240
Tim
e(h
)
Fig.
7.—
Hea
ttr
ansf
erre
sist
ance
vti
me,
Tc32
°Can
dc
t26%
.

0I
I1
iI
iI
II
iI
Tim
e(h
)
Ii__j_I_
11
12 11
U 0 C.., E a) U C ci •1
-’ Ii) I a) U) C ci a) -c
0 X
Run
Re
Ta
Tb
0C
2-1
559
59
69
38
2
xC
10-2
18
70
87-1
38
0
00
0
0
0
xx
XX
X
00
00
00
0
00
000
0o0
00
00
0O
00
00
0
xX
xX
xX
xX
XX
X)O
(XX
XX
XX
xX
XX
Xx
0
0 0 xx
x
x
020
40
6080
100
120
140
160
180
200
22
024
0
Fig
.8.
—H
eat
tran
sfer
resi
stan
ce
vti
me,
T32
00
and
c=
26%
.
50 40
—-c
-——
-
Tj
425
0C
30
——
Ta
32
0°C
S20
1) I-
Re
7635
0Ts
30°C
Ta
=7
1°C
XT
s=
32
°C10-
eT5
=3
7°C
0i
ti
II
iI
iI
II
Ii
050
010
0015
002
00
02
50
03
00
0
Rad
ial
dis
tan
ce
(Mm
)
Fig
.9.—
Tem
per
ature
vra
dia
ld
ista
nce
atd
iffe
ren
tw
aLl
tem
pera
ture
sin
Run
Bi
—5.
I-n
U D 0 cD z -J 0 0 L)
ci z z 0 I— If)
0 0 uJ C
FIG
.1O
.DE
PO
SIT
ION
ST
UD
IES
AP
PA
RA
TU
S
SOL
UT
ION
CIR
CU
LA
TIO
NSY
STE
MC
OO
LIN
GW
ATE
RC
IRC
UL
AT
ION
SYST
EM
LUF
-J0
z0
FU)0a..LUcm
F
I—
I— cmC) ZD (Wo ZLIJ
Z OHO 0W
EU) QO z
cm z0
I-U)00LUC
Li..
LU
-JU
z0
1cDLf) EU)
ItJt? a
LU0
cL)
%- %-
.93
0
I-c)
‘I
HC)
cm
H
-J00C-)
LU-J
C-)U)
200
- 18°C
- Tb= 23°C150 —
C0
2 100 —
LI)o o0
0o 0 0 00 00 0
50 0 00000
0
0 I I I I I it00
0 20 40 60 80 100 120
Time Cmi,,.)
Fig. 12.—Deposition v time in Run Dl.

300
250 —
200 —
— - 000
-- (•
C - 00 0o 0t 150—U)o
- 0
£ 000
100: 0
ITb25°C
50—Tc=20°C
-0
I I I I0 20 40 60 80 100 120
Time (mini
Fig.13.- Deposition v time in Run D2.

300
250
2000
0)
00 00
150 0 00 0
.
o 0 00a) 0o 0 0
0 0100 0 0 0
-o
Tb27°C50o
- = 22°C
00 20 40 60 80 100 120
Time (mm.)
Fig.U..— Deposition v time in Run D3.

200
150 —
6 00
00 0
:100 o0
0
- 0
50• Tb=28°C
23°C
0 1 I I I i I0 20 40 60 80 100 120
Time (mm.)
Fig.15.- Deposition v time in Run D4.
200
T = 20°C
Tb 25°C
150 —
E
C0
100U,0
a,0
0’
0 0
50— 0
00
- 0 00
0
I I I I I I.0 20 40 60 80 100 120
Time (mm.)
Fig.16.—Deposition v time in Run 05.

200
150 —
cnE
C0
100‘I)0
0
50 —
0—0 005 010 015 020
FLowrate (kg Is)
Fig.17— Deposition v flowrate in Run D6.
200
1 50
E
00
Tc = 23 °C
Tb = 28 °C
t =15mm.
0 000
0 0
0
I I I I i i i i I i i I I I I I I I
5 10 15 20Ti me (m i n.)
Fig.18.-Deposition v time at different concentrations.
7
C-)0
E
C.,
C
U)
U)C)I
0)C
0
C-)
0
0
E>.U)
6
5
4
3
2
1
00 02 04 06 08 1-0
[tTc]x1o6
Fig 19—Asymptotic fouLing resistanceagainst modeL parameter.
- 45 -
NOMENCLATURE
c : Foulant concentration (%) or
C : Solution heat capacity (kJ/kg°C)
d : Tube diameter (m)
0 : Foulant diffusivity (m2/s)
f : Friction factor (= -r/pu2)0 : Solution mass flux (kg/m2s)
h : Foulant mass transfer coefficient (mis)
k Deposit thermal conductivity (kW/m °C)
K : Constant (= 0.36)
k1 : Deposition coefficient
k2 : Release coefficient
k3 : Stickability constant
n : Constant (= 0.124)
N Foulant mass flux towards wall (kg/m2s)
Pr : Prandtl number (= Ciik)
q Heat flux (kWim2)
R : Heat transfer resistance (kWim20C)
Rf : Fouling resistance (kWim20C)’
Re : Reynolds number (= udi)
s : Foulant stickability (N/m2)1
Sh : Sherwood number (= hd/D)
Sc : Schmidt number (= iD)
t : Time (s)
I : Temperature (°C)
AT : Temperature difference (°C)
AT’ Dimensionless temperature difference (Eq. 7)
AT : Dimensionless temperature (Eq. 3)+ . . 1 +
AT1 : Dimension Less temperature at y1
u : Solution bulk velocity (mis)
Friction velocity (= u/)
Omensionless velocity ( u/u*)
A Solution mass flowrate (kg/s)
x : Deposit thickness (m)
y : Distance from wall (m)
y : Dimensionless distance (yu*/)
p : Solution viscosity (kgims)
Solution kinematic viscosity (m2/s)
p : Solution density (kg/ni3)
T : Shear stress (N/rn2)
- 46 -
Subscripts
a : Cooling water
b Bulk (solution)
c : Cloud point
i : Inside
o : Outside
p : Pour point
s : Surface
w : Wall
Superscript
* : Asymptotic (except u*)

- 47 -
REFERENCES
1. Reistle, C E, “Paraffin and Congealing Oil Problems”, Bull USBM, 348,(19 32).
2. Nelson, W L, “Fouling of Heat Exchangers”, Refiner and Natural GasolineManufacturer, 13 (7), 271—276, (July 1934), and 13 (8).292—298, (AuguT 1934). —
3. Hunt, E B, “Laboratory Study of Paraffin Deposition”, J Pet Tech, 1259—1269, (November 1962).
4. Patton, C C, Jessen, F W, “The Effect of Petroleum Residua on ParaffinDeposition from a Heptane-Refined Wax System”, Soc Pet Engrs J,333-340, (Dec 1965).
5. Jorda, R M, “Paraffin Deposition and Prevention in Oil Wells”, J PetTech, 1605—1619, (Dec 1966).
6. Shock, D A, Sudbury, J D, Crockett, J J, “Studies of the Mechanism ofParaffin Deposition and its Control”, J Pet Tech, 23-28,(Sept 1955).
7. ASTM D2500-66 and IP 219/67, “Cloud Point of Petroleum Oils”.
8. ASTM 97—67 and IP 15/67, “Pour Point of Petroleum Oils”.
9. Rhodes, F H, Mason, C W, Sutton, N R, “Crystallisation of Paraffin Wax”,md Eng Chem, 19,935-938, (1927).
10. Cruse, WA, Stevens, D R, “Chemical Technology of Petroleum”, McGraw Hill,3rd Edition, (1960).
11. Holder, G A, Winkler, J, “Wax Crystallisation from Distillate Fuels”,J Inst Pet, 51 (499), 228-252, (July 1965).
12. Tronov, V P. “Effect of Flowrate and Other Factors on the Formation ofParaffin Deposits”, Tr, Tatar. Neft. Nauch—Issled. Inst. No 13,207—30, (1969), (in Russian).
13. Rafikov, S R, Gutsalyuk, V G, Epelbaum, K E, Yatsenko, E A, Sdobnov, E I,“The Rheological Properties of Paraffin—Based Petroleums”, mtChem Eng, 13 (3), 500-506, (July 1973).
14. Jessen, F 1, Howell, J N, “Effect of Flow Rate on Paraffin Accumulationin Plastic Steel and Coated Pipe”, Pet Trans AIME, 213, 80-87,(1953).
15. Arnens, E A, Novoselov, V F, Tugunov, P I, “Paraffin Deposition inShort PieHnes”, Izv Vyssh. Ucheb. Zaved., Neft Gas, 14(7),71—73, (1971), (in Russian). —
16. Patton, C C, Cased, B N, “Paraffin Deposition from Refined Wax-SolventSystems”, Soc Pet Engrs J, 17—24, (March 1970).
17. Cole, R J, Jessen, F W, “Paraffin Deposition”, Oil Gas J, 58 (38),87—91, (Sept 1960).
18. Walker, R A, “Fouling in Heat Exchanger Tubes”, PhD Thesis, Universityof Birmingham, (1973).

- 48 -
19. Deissler, R G, “Turbulent Heat Transfer and Friction in Smooth Passages”,High Speed Aerodynamics and Jet Propulsion, Volume 5,Section E, Convective Heat Transfer and Friction in Flow ofLiquids, 288-337, edited by C C Lin, Oxford University Press,(1959).
20. 1atkinson, A P, “Particulate Fouling of Sensible Heat Exchangers”, PhDThesis, University of British Columbia, (1968).
21. Taborek, J, Aoki, T, Ritter, R B, Palen, J W, Knudsen, J G, “PredictiveMethods for Fouling Behaviour”, Chem Eng Prog, 68 (7), 69—78,(July 1972).
22. Friedlander, S K, “Smoke, Dust and Haze : Fundamentals of AerosolBehaviour”, Wiley, (1977).
23. Landau, L D, Lifshitz, E M, “Fluid Mechanics”, Addison-Wesley, (1959).
24. Everett, M, “Forced Convection Heat Transfer Inside Tubes — TurbulentFlow”, Chem Engr, No 159, (Sept 1969).
25. Gudmundsson, J 5, Bott, T R, “Deposition of Silica from GeothermalWaters on Heat Transfer Surfaces”, to be published
A. Bott, T R, Gudmundsson, J S, “Deposition of Paraffix Wax from Kerosenein Cooled Heat Exchanger Tubes”, Paper No 76-CSME/CSChE-2l,16th Nat Heat Transfer Conf, St Louis, Mo, (August 1976),to be published Can J Chem Eng, (1977).
B. Gudmundsson, J S, Bott, T R, “Deposition of Paraffin Wax from FlowingSystems”, to be published.
C. Gudrnundsson, J S, Bott, T R, “Solubility of Paraffin Wax in Kerosene”,Fuel, 55 (1), 15-16, (1977).


