Embed Size (px)
Citation preview

Part I
Basic principles

1.1 Properties of liquids, solids and gases
Liquids, gases and some solids (for example powders and particulate materials) aretermed ‘fluids’ and can flow without disintegration when a pressure is applied to them. Incontrast, solids deform when pressure is applied to them (Section 1.1.4). In this section,the properties of fluids and solids that are relevant to both the design of food processesand the quality of processed food are described. More detailed mathematical treatmentsand derivations of formulae used in food engineering calculations are given in a numberof texts including Toledo (1999), Lewis (1990), Brennan et al. (1990) and Earle (1983).
The transition from solid to fluid and back is known as a phase transition and this isimportant in many types of food processing (e.g. water to water vapour in evaporationand distillation (Chapter 13) and dehydration (Chapter 15); water to ice in freezing(Chapter 21) and freeze drying or freeze concentration (Chapter 22) or crystallisation offats (Chapter 23)). Phase transition takes place isothermally at the phase transitiontemperature by release or absorption of latent heat, and can be represented by a phasediagram (for example Chapter 22, Fig. 22.1).
A second type of transition, known as glass transition, takes place without the releaseor absorption of latent heat and involves the transition of a food to an amorphous glassstate at its glass transition temperature. The transition is dependent on the temperature ofthe food, time, and the moisture content of the food. Examples of glass transitiontemperatures are given in Chapter 21 (Table 21.2). When materials change to glasses,they do not become crystalline, but retain the disorder of the liquid state. However, theirphysical, mechanical, electrical and thermal properties change as they undergo thetransition. In their glassy state, foods become very stable because compounds that areinvolved in chemical reactions that lead to deterioration are immobilised and take longperiods of time to diffuse through the material to react together. Details of nine keyconcepts underlying the relationship between molecular mobility and food stability aregiven by Fennema (1996). Processes that are significantly influenced by transition to aglassy state include aroma retention, crystallisation, enzyme activity, microbial activity,non-enzymic browning, oxidation, agglomeration and caking. The relationship between
1
Properties of foods and processing theory

glass transition and water activity (Section 1.5) and factors that affect glass transition aredescribed in detail by Rahman (1999), Blanshard (1995) and Fennema (1996).
1.1.1 Density and specific gravityA knowledge of the density of foods is important in separation processes (Chapter 6), anddifferences in density can have important effects on the operation of size reduction andmixing equipment (Chapters 4 and 5). The density of a material is equal to its massdivided by its volume and has units of kg m�3. Examples of the density of solid foods andother materials used in food processing are shown in Table 1.1 (see also Chapter 15,Table 15.7) and examples of densities of liquids are shown in Table 1.2. The density ofmaterials is not constant and changes with temperature (higher temperatures reduce thedensity of materials) and pressure. This is particularly important in fluids wheredifferences in density cause convection currents to be established (Section 1.4.3).
Table 1.1 Densities of foods and other materials
Material Density Bulk density Temperature(kg m�3) (kg m�3) (ºC)
SolidsAluminium 2640 – 0Copper 8900 – 0Stainless steel 7950 – 20Concrete 2000 – 20
Grapes 1067 368 –Tomatoes – 672 –Lemons/oranges – 768 –Fresh fruit 865–1067 – –Frozen fruit 625–801 – –Fresh fish 967 – –Frozen fish 1056 – –Water (0ºC) 1000 – 0Ice (0ºC) 916 – 0Ice (�10ºC) 933 – �10Ice (�20ºC) 948 – �20Fat 900–950 – 20Salt 2160 960 –Sugar (granulated) 1590 800 –Sugar (powdered) – 480 –Starch 1500 – –Wheat 1409–1430 790–819Wheat flour – 480 –Barley 1374–1415 564–650 –Oats 1350–1378 358–511 –Rice 1358–1386 561–591 –
GasesAir 1.29 – 0Air 0.94 – 100Carbon dioxide 1.98 – 0Carbon dioxide 1.46 – 100Nitrogen 1.30 – 0
Adapted from data of Earle (1983), Lewis (1990), Milson and Kirk (1980), Peleg (1983) and Mohsenin (1970).
10 Food processing technology
The density of liquids is a straightforward measure of mass/volume at a particulartemperature, but for particulate solids and powders there are two forms of density: thedensity of the individual pieces and the density of the bulk of material, which alsoincludes the air spaces between the pieces. This latter measure is termed the bulk densityand is ‘the mass of solids divided by the bulk volume’. The fraction of the volume that istaken up by air is termed the porosity (�) and is calculated by:
� � Va�Vb 1�1
where Va � volume of air (m3) and Vb � volume of bulk sample (m3).The bulk density of a material depends on the solids density and the geometry, size
and surface properties of the individual particles. Examples of bulk densities of foods areshown in Table 1.1 and bulk density is discussed in relation to spray dried powders inChapter 15.
The density of liquids can be expressed as specific gravity (SG), a dimensionlessnumber (Appendix D), which is found by dividing the mass (or density) of a liquid by themass (or density) of an equal volume of pure water at the same temperature:
SG = mass of liquid/mass water 1�2
Table 1.2 Properties of fluids
Thermal Specific Dynamicconductivity heat Density viscosity Temperature
(W m�1 ºK�1) (kJ kg�1 ºK�1) (kg m�3) (N s m�2) (ºC)
Air 0.024 1.005 1.29 1.73�10�5 00.031 1.005 0.94 2.21�10�5 100
Carbon dioxide 0.015 0.80 1.98 0Oxygen 0.92 1.48�10�3 20Nitrogen 0.024 1.05 1.30 0Refrigerant 12 0.0083 0.92Water 0.57 4.21 1000 1.79�10�3 0
0.68 4.21 958 0.28�10�3 100Sucrose
solution (60%) 6.02�10�2 20Sucrose
solution (20%) 0.54 3.8 1070 1.92�10�3 20Sodium chloride
solution (22%) 0.54 3.4 1240 2.7�10�3 2Acetic acid 0.17 2.2 1050 1.2�10�3 20Ethanol 0.18 2.3 790 1.2�10�3 20Rape-seed oil 900 1.18�10�1 20Maize oil 1.73 20Olive oil 0.168 8.4�10�2 29Sunflower oil 1.93 20Whole milk 0.56 3.9 1030 2.12�10�3 20
2.8�10�3 10Skim milk 1040 1.4�10�3 25Cream (20% fat) 1010 6.2�10�3 3Locust bean gum
(1% solution) 1.5�10�2
Xanthan gum(1% solution) 1000
From Earle (1983), Lewis (1987) and Peleg and Bagley (1983).
Properties of foods and processing theory 11

SG = density of liquid/density water 1�3
If the specific gravity of a liquid is known at a particular temperature, its density canbe found using:
�L � �SG�T � �w 1�4
where �L = liquid density (kg m�3) and �w � density of water, each at temperature T(oC).
Specific gravity is widely used instead of density in brewing and other alcoholicfermentations (Chapter 7), where the term ‘original gravity (OG)’ is used to indicate thespecific gravity of the liquor before fermentation (for example ‘1072’ or ‘72’ refers to aspecific gravity of 1.072).
The density of gases depends on their pressure and temperature (Table 1.1). Pressure isoften expressed as ‘gauge pressure’ when it is above atmospheric pressure, or as ‘gaugevacuum’ when it is below atmospheric pressure. Pressure is calculated using the IdealGas Equation as follows:
PV � nRT 1�5
where P � absolute pressure (Pa), V � volume (m3), n � number of moles of gas(kmole), R � the gas constant (8314 N(m)/(kmole K) and T � temperature (K).
This equation is useful for calculation of gas transfer in applications such as modifiedatmosphere storage or packaging (Chapter 20), cryogenic freezing (Chapter 21) and thepermeability of packaging materials (Chapter 24).
The density of gases and vapours is also referred to as specific volume which is ‘thevolume occupied by unit mass of gas or vapour’ and is the inverse of density. This is usedfor example in the calculation of the amount of vapour that must be handled by fans duringdehydration (Chapter 15) or by vacuum pumps in freeze drying (Chapter 22) or vacuumevaporation (Chapter 13). Further details are given by Lewis (1990) and Toledo (1999).
When air is incorporated into liquids (for example cake batters, ice cream, whippedcream) it creates a foam and the density is reduced. The amount of air that is incorporated
Sample problem 1.1Calculate the amount of oxygen that enters through a polyethylene packaging materialin 24 h if the pack has a surface area of 750 cm2 and an oxygen permeability of 120 mlm�2 per 24 h at 23 oC and 85% relative humidity (see Chapter 24, Table 24.2).
Solution to Sample problem 1.1The volume of oxygen entering through the polyethylene:
V � 120 � 7501002
� 9�0 cm3
using equation 1.5,
n � 9�0 � 1000��8314 � 273�
� 0�00396 kmole
12 Food processing technology

is referred to as the over-run and is described in Chapter 4 (Section 4.2.3)
over-run � volume of foam � volume of liquidvolume of liquid
� 100
Typical over-run values are 60–100% for ice cream and 100–120% for whippedcream.
1.1.2 ViscosityViscosity is an important characteristic of liquid foods in many areas of food processing.For example the characteristic mouth feel of food products such as tomato ketchup,cream, syrup and yoghurt is dependent on their consistency or viscosity.1 The viscosity ofmany liquids changes during heating, cooling, concentration, etc. and this has importanteffects on, for example, the power needed to pump these products. Viscosities of somecommon fluids in food processing are shown in Table 1.2.
Viscosity may be thought of as a liquid’s internal resistance to flow. A liquid can beenvisaged as having a series of layers and when it flows over a surface, the uppermostlayer flows fastest and drags the next layer along at a slightly lower velocity, and so onthrough the layers until the one next to the surface is stationary. The force that moves theliquid is known as the shearing force or shear stress and the velocity gradient is known asthe shear rate. If shear stress is plotted against shear rate, most simple liquids and gasesshow a linear relationship (line A in Fig. 1.1) and these are termed Newtonian fluids.Examples include water, most oils, gases, and simple solutions of sugars and salts. Wherethe relationship is non-linear (lines B–E in Fig. 1.1), the fluids are termed ‘non-Newtonian’. Further details are given by Nedderman (1997). For all liquids, viscositydecreases with an increase in temperature but for most gases it increases with temperature(Lewis, 1990).
Many liquid foods are non-Newtonian, including emulsions and suspensions, andconcentrated solutions that contain starches, pectins, gums and proteins. These liquidsoften display Newtonian properties at low concentrations but as the concentration of thesolution is increased, the viscosity increases rapidly and there is a transition to non-Newtonian properties (Rielly, 1997). Non-Newtonian fluids can be classified broadly intothe following types:
• pseudoplastic fluid (line B in Fig. 1.1) – viscosity decreases as the shear rate increases(e.g. emulsions, and suspensions such as concentrated fruit juices and purees)
• dilatant fluid (line C in Fig. 1.1) – viscosity increases as the shear rate increases. (Thisbehaviour is less common but is found with liquid chocolate and cornflour suspension.)
• Bingham or Casson plastic fluids (lines D and E in Fig. 1.1) – there is no flow until acritical shear stress is reached and then shear rate is either linear (Bingham type) ornon-linear (Casson type) (e.g. tomato ketchup)
• thixotropic fluid – the structure breaks down and viscosity decreases with continuedshear stress (most creams)
• rheopectic fluid – the structure builds up and viscosity increases with continued shearstress (e.g. whipping cream)
1. Although these two terms are often used inter-changeably, strictly ‘viscosity’ is only applied toNewtonian fluids – see below.
Properties of foods and processing theory 13

• viscoelastic material – has viscous and elastic properties exhibited at the same time.When a shear stress is removed the material never fully returns to its original shapeand there is a permanent deformation (e.g. dough, cheese, gelled foods).
The measurement of viscosity is complicated by the range of terms used to describe it.The simplest is the ratio of shear stress to shear rate, which is termed the dynamic viscosity(kg m�1 s�1). This is related to another term, kinematic viscosity (m2 s�1), as follows:
kinematic viscosity � dynamic viscositydensity
1�6
Other terms, including ‘relative viscosity’, ‘specific viscosity’ and ‘apparentviscosity’, together with descriptions of methods of measuring viscosity, are given byLewis (1990) and Toledo (1999).
1.1.3 Surface activityA large number of foods comprise two or more immiscible components, which have aboundary between the phases (Table 1.3). The phases are known as the dispersed phase(the one containing small droplets or particles) and the continuous phase (the phase inwhich the droplets or particles are distributed). Details of the preparation of emulsions aregiven in Chapter 4.
One characteristic of these systems is the very large surface area of the dispersedphase that is in contact with the continuous phase. In order to create the increased surface
Fig. 1.1 Changes in viscosity of Newtonian fluid (A) and different types of non-Newtonian fluids;(B) pseudoplastic fluid; (C) dilatant fluid; (D) Bingham plastic fluid and (E) Casson plastic fluid.
(After Lewis (1990).)
14 Food processing technology

area, a considerable amount of energy needs to be put into the system using for example ahigh-speed mixer or an homogeniser. Droplets are formed when new surfaces are created.To understand the reason for this it is necessary to know the forces acting in liquids:within the bulk of a liquid the forces acting on each individual molecule are equal in alldirections and they cancel each other out. However, at the surface the net attraction istowards the bulk of the liquid and as a result, the surface molecules are ‘pulled inwards’and are therefore in a state of tension (produced by surface tension forces). This causesliquid droplets to form into spheres because this shape has the minimum surface area forthe particular volume of liquid.
EmulsionsChemicals that reduce the surface tension in the surface of a liquid are termed surfaceactive and are known as ‘surfactants’, ‘emulsifying agents’ or ‘detergents’. By reducingthe surface tension, they permit new surfaces to be produced more easily when energy isput into the system (for example by homogenisers) and thus enable larger numbers ofdroplets to be formed. There are naturally occurring surfactants in foods, includingalcohols, phospholipids and proteins and these are sometimes used to create foodemulsions (for example using egg in cake batters). However, synthetic chemicals havemore powerful surface activity and are used in very small amounts to create emulsions.Others are used in detergents for cleaning operations (Chapter 26). Details of syntheticemulsifying agents are given in Chapter 4 and Appendix C.
Surface active agents contain molecules which are polar (or ‘hydrophilic’) at one endand non-polar (or ‘lipophilic’) at the other end. In emulsions, the molecules ofemulsifying agents become oriented at the surfaces of droplets, with the polar end in theaqueous phase and the non-polar end in the oil phase.
Detergents are surface active agents that reduce the surface tension of liquids to bothpromote wetting (spreading of the liquid) and to act as emulsifying agents to dissolvefats. The detergent molecules have a lipophilic region of long chain fatty acids and ahydrophilic region of either a sodium salt of carboxylic acid (soapy detergents) or thesodium salt of an alkyl or aryl sulphonate (anionic detergents). Anionic detergents are notaffected by hard water, whereas soapy detergents form a scum in hard water. Non-ionicdetergents, which have alcohols, esters or ethers as the hydrophilic component, producelittle foam and are easily rinsed off. Enzymes may also be added to detergents to removeproteins, and other ingredients may include polyphosphates (to soften water and keep dirt
Table 1.3 Examples of colloidal food systems
Dispersed Continuous Name Examplephase phase
Liquid Gas Fog, mist, aerosol Sprays (e.g. spray drying)Solid Gas Smoke, aerosol Carbon dioxide fog, smokeGas Liquid Foam Whipped cream, aeration of
fermentation media, hydrogenationof oils (hydrogen in oil)
Liquid Liquid Emulsion Cream, mayonnaise, margarineand low-fat spreads, salad cream,sausagemeat and cakes
Solid Liquid Sol, colloidal solution, Chocolate drinks, fruit juicegel suspension
Gas Solid Solid foam Meringue, ice cream
From Lewis (1990).
Properties of foods and processing theory 15

in suspension), sodium sulphate or sodium silicate (to make detergent powder free-flowing) and sodium perborate (bleaching agent).
FoamsFoams are two-phase systems which have gas bubbles dispersed in a liquid or a solid,separated from each other by a thin film. In addition to food foams (Table 1.3), foams arewidely used for cleaning equipment. The main factors needed to produce a stable foam are:
• a low surface tension to allow the bubbles to contain more air and prevent themcontracting
• gelation or insolubilisation of the bubble film to minimise loss of the trapped gas andto increase the rigidity of the foam and
• a low vapour pressure in the bubbles to reduce evaporation and rupturing of the film.
In food foams, the structure of the foam may be stabilised by freezing (ice cream), bygelation (setting gelatin in marshmallow), by heating (cakes, meringues) or by theaddition of stabilisers such as proteins or gums (Appendix C).
1.1.4 Rheology and textureThe texture of foods has a substantial influence on consumers’ perception of ‘quality’ andduring chewing (or ‘mastication’), information on the changes in texture of a food istransmitted to the brain from sensors in the mouth, from the sense of hearing and frommemory, to build up an image of the textural properties of the food. This may be seen astaking place in a number of stages:
1. an initial assessment of hardness, ability to fracture and consistency during the firstbite
2. a perception of chewiness, adhesiveness and gumminess during chewing, themoistness and greasiness of the food, together with an assessment of the size andgeometry of individual pieces of food
3. a perception of the rate at which the food breaks down while chewing, the types ofpieces formed, the release or absorption of moisture and any coating of the mouth ortongue with food.
These various characteristics have been categorised (Table 1.4) and used to assess andmonitor the changes in texture that affect the quality of foods.
Rheology is the science of deformation of objects under the influence of appliedforces. When a material is stressed it deforms, and the rate and type of deformationcharacterise its rheological properties. (The rheological properties of solid foods aredescribed in more detail in Chapter 4.) A large number of different methods have beenused to assess the texture of food, including texture profiling by sensory methods usingtaste panels (e.g. Bourne, 1982), Quantitative Descriptive Analysis (QDA) (Fig. 1.2),described by Clark (1990), and empirical methods in which measurements of the forcesneeded to shear, penetrate, extrude, compress or cut a food are related to a texturalcharacteristic. These methods are reviewed by Kilcast (1999), Rosenthal (1999), Lawlessand Heyman (1998) and Brennan (1984).
Examples of these instrumental methods include the Brabender system to measuredough texture or the viscosity of starch pastes, cone or rod penetrometers to measure theyield stress of margarine and spreads or the hardness of fruits, the General FoodsTexturometer which simulates mastication by compressing foods using a plunger, and the
16 Food processing technology

Fig. 1.2 Example of texture assessment using quantitative descriptive analysis.(Adapted from Clark (1990).)
Table 1.4 Textural characteristics of foods
Primary characteristic Secondary characteristic Popular terms
Mechanical characteristicsHardness Soft�firm�hardCohesiveness Brittleness Crumbly, crunchy, brittle
Chewiness Tender, chewy, toughGumminess Short, mealy, pasty, gummy
Viscosity Thin, viscousElasticity Plastic, elasticAdhesiveness Sticky, tacky, gooey
Geometrical characteristicsParticle size and shape Gritty, grainy, coarseParticle shape and orientation Fibrous, cellular, crystalline
Other characteristicsMoisture content Dry�moist�wet�wateryFat content Oiliness Oily
Greasiness Greasy
Adapted from Szczesniak (1963).
Properties of foods and processing theory 17

Instron Universal Testing machine, which measures stress and strain forces bycompression or extension. Chemical methods include measurement of starch or pectincontent, and microscopic methods include electron microscopy of emulsions or the fleshstructure of meat and fish. These methods are described in detail by Sherman (1979),Prentice (1984), Bourne (1978), Brennan (1984), Kramer and Szczesniak (1973), Lewis(1990) and Bourne (1982).
1.2 Material transfer
The transfer of matter is an important aspect of a large number of food processingoperations: it is a key factor in solvent extraction, distillation (Chapter 13) and membraneprocessing (Chapter 6) and it is an important factor in loss of nutrients during blanching(Chapter 10). Mass transfer of gases and vapours is a primary factor in evaporation(Chapter 13), dehydration (Chapter 15), baking and roasting (Chapter 16), frying (Chapter17), freeze drying (Chapter 22), the cause of freezer burn during freezing (Chapter 21)and a cause of loss in food quality in chilled, MAP and packaged foods (Chapters 19, 20and 24, respectively).
In an analogous way to heat transfer (Section 1.4), the two factors that influencethe rate of mass transfer are a driving force to move materials and a resistance totheir flow. When considering dissolved solids in liquids, the driving force is adifference in the solids concentration, whereas for gases and vapours, it is adifference in partial pressure or vapour pressure. The resistance arises from themedium through which the liquid, gas or vapour moves and any interactions betweenthe medium and the material.
An example of materials transfer is diffusion of water vapour through a boundary layerof air in operations such as dehydration, baking, etc. Packaging also creates additionalboundary layers which act as barriers to movement of moisture and to heat transfer (Fig.1.3).
The rate of diffusion is found using:
NA � Dw�RTx �PT�PAm � �Pw1 � Pw2� 1�7
where NA (kg s�1) or (kmols s�1) � rate of diffusion, Dw � diffusion coefficient of watervapour in air, R � the Gas Constant (= 8.314 kJ kmol�1 K�1), T (K) � temperature, x (m)� distance across stationary layer, PT (kNm�2) � total pressure, PAm (kNm�2) � meanpressure of non-diffusing gas across the stationary layer and Pw1 – Pw2 (kNm�2) � watervapour pressure driving force.
Formulae for diffusion of solutes through liquids and for gases dissolving in liquidsare given by Lewis (1990) and Toledo (1999).
Mass balancesThe law of conversion of mass states that ‘the mass of material entering a process equalsthe mass of material leaving’. This has applications in, for example, mixing (Chapter 5),fermentation (Chapter 7), and evaporation (Chapter 13).
In general a mass balance for a process takes the following form:
mass of raw materials in � mass of products and wastes out � mass of stored materials� losses
18 Food processing technology

Many mass balances are analysed under steady-state conditions where the mass ofstored materials and losses are equal to zero. Mass balances are used to calculate thequantities of materials in different process streams, to design processes, to calculaterecipe formulations, the composition after blending, process yields and separationefficiencies. A typical mass balance is shown in Fig. 1.4.
Here the total mass balance is
W � A � moist air � D
The mass balance for air is
A � moisture � moist air
Fig. 1.3 Barriers to masstransfer and heat flow due to
packaging.
Fig. 1.4 Diagram of material flow during baking in an oven.
Properties of foods and processing theory 19

The mass balance for solids is
W � moist air � D
Examples of mass balances calculations are shown in Chapter 13 (Sample problem 13.1)and Chapter 15 (Sample problem 15.2).
In applications involving concentration or dilution, the use of mass fraction or weightpercentage is often used:
Mass fraction A � mass of component Atotal mass of mixture
or
Sample problem 1.2Calculate the total mass balance and component mass balance for mixing ingredientsto make 25 kg of beef sausages having a fat content of 30%, using fresh beef meat andbeef fat. Typically, beef meat contains 18% protein, 12% fat and 68% water and beeffat contains 78% fat, 12% water and 5% protein.
Solution to Sample problem 1.2Let F � mass of beef fat (kg)Let M � mass of beef meat (kg)
Fat (78% fat, 12% water, 5%protein)(F)
Meat (M) Sausage (S)18% protein, 12% fat and 68% water (25 kg, 30% fat)
Bowl chopper
Total mass balance
M � F � 25
Fat balance
0�12M � 0�78F � 0�3�25�Substitute M � 25 � F into the fat balance
0�12�25 � F� � 0�78F � 7�5
3�0 � 0�12F � 0�78F � 7�5
� 6�82 kg
and
M � 25 � 6�82
� 18�18 kg
20 Food processing technology

Total mass of mixture � mass of component Amass fraction of A
If the weight of the component and its mass fraction are known, the total mass of themixture can be calculated. Computerised recipe calculations are described in Chapter 2(Section 2.2.1).
A simple method to calculate the relative masses of two materials that are required toform a mixture of known composition is the Pearson Square (Anon., 1996). If, forexample, homogenised milk (3.5% fat) is to be mixed with cream (20% fat) to produce alight cream containing 10% fat, the Pearson Square (Fig. 1.5) is constructed with the fatcomposition of ingredients on the left side, the fat content of the product in the centre. Bysubtracting diagonally across the square, the resulting proportions of milk and cream canbe found (i.e. 10 parts milk and 6.5 parts cream in Fig 1.5). An alternative method is touse a total balance and a fat balance (see Sample problem 1.2). Toledo (1999) describesthe application of mass balances to multi-stage processing and includes a computerprogramme for the use of mass balances in recipe formulations. Another example of theuse of a Pearson Square is shown in Sample problem 1.3.
1.3 Fluid flow
Many types of liquid food are transported through pipes during processing, and powdersand small-particulate foods are more easily handled as fluids (by fluidisation). Gasesobey the same laws as liquids and, for the purposes of calculations, gases are treated ascompressible fluids. Properties of selected fluids are shown in Table 1.2. The study offluids is therefore of great importance in food processing. It is divided into fluid statics(stationary fluids) and fluid dynamics (moving fluids).
A property of static liquids is the pressure that they exert on the containing vessel. Thepressure is related to the density of the liquid and the depth or the mass of liquid in thevessel. Liquids at the base of a vessel are at a higher pressure than at the surface, owing tothe weight of liquid above (the hydrostatic head). This is important in the design of holdingtanks and processing vessel, to ensure that the vessel is constructed using materials of
Fig. 1.5 Pearson Square.(From Anon. (1996).)
Properties of foods and processing theory 21

adequate strength. A large hydrostatic head also affects the boiling point of liquids, which isimportant in the design of some types of evaporation equipment (Chapter 13).
When a fluid flows through pipes or processing equipment (Fig. 1.6), there is a loss ofenergy and a drop in pressure which are due to frictional resistance to flow. These frictionlosses and changes in the potential energy, kinetic energy and pressure energy are describedin detail in the food engineering texts referenced at the start of this chapter and by Loncinand Merson (1979). The loss of pressure in pipes is determined by a number of factorsincluding the density and viscosity of the fluid, the length and diameter of the pipe and thenumber of bends, valves, etc., in the pipeline. To overcome this loss in energy, it isnecessary to apply power using pumps to transport the fluid. The amount of power requiredis determined by the viscosity of the fluid (Section 1.1.2), the size of the pipework, thenumber of bends and fittings, and the height and distance that the fluid is to be moved.
To calculate the energy balance when a liquid flows through pipework, the effect ofvalves or bends on the flow rate, or the pressure developed by a pump, use is made ofBernoulli’s equation, which is a statement of the conservation of energy.
Sample problem 1.3Use a Pearson Square to calculate the amounts of orange juice (10% sugar content)and sugar syrup (60% sugar content) needed to produce 50 kg of fruit squashcontaining 15% sugar.
Solution to Sample problem 1.3Orange juice
10 45
15
60 5
Sugar syrup
The result indicates that 45 kg of orange juice should be mixed with 5 kg of sugar syrup.
Fig 1.6 Application of Bernoulli’sequation to frictionless fluid flow.
22 Food processing technology

P1
�1� v2
1
2� z1g � P2
�2� v2
2
2� z2g 1�8
where P (Pa) = the pressure, � (kg m�3) = the fluid density, g (= 9.81 m s�1) = accelera-tion due to gravity, v (m s�1) = the velocity of the fluid and z (m) = the height. Thesubscript 1 indicates the first position in the pipework and the subscript 2 the secondposition in the pipework.
In any system in which fluids flow, there exists a boundary film (or surface film) of
Sample problem 1.4A 20% sucrose solution flows from a mixing tank at 50 kPa through an horizontal pipe5 cm in diameter at 25 m3 h�1. If the pipe diameter reduces to 3 cm, calculate the newpressure in the pipe. (The density of sucrose solution is 1070 kg m�3 (Table 1.2).)
Solution to Sample problem 1.4
Flow rate � 253600
m3 s�1
� 6�94 � 10�3 m3 s�1
Area of pipe 5 cm in diameter � �
4D2
� 3�1424
�0�05�2
� 1�96 � 10�3m2
Velocity of Flow � 6�94 � 10�3
1�96 � 10�3
� 3�54m s�1
Area of pipe 3 cm in diameter � 7�07 � 10�4 m2
Velocity of Flow � 6�94 � 10�3
7�70 � 10�4
� 9�81m s�1
Using equation (1.8),
P1
�1� v2
1
2� z1g � P2
�2� v2
2
2� z2g
3�542
2� 50 � 103
1070� 0 � P2
1070� 9�812
2� 0
Therefore,
P2 � 56 656 Pa
� 56�7 kPa
Properties of foods and processing theory 23
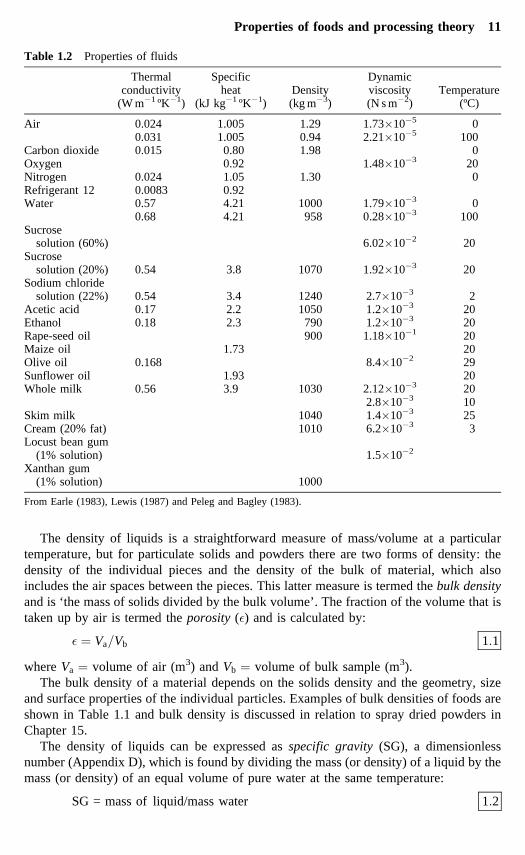
fluid next to the surface over which the fluid flows (Fig. 1.7(a)). The thickness of theboundary film is influenced by a number of factors, including the velocity, viscosity,density and temperature of the fluid. Fluids which have a low flow rate or high viscositymay be thought of as a series of layers which move over one another without mixing (Fig.1.7(b)). This produces movement of the fluid, which is termed streamline (or laminar)flow. In a pipe, the velocity of the fluid is highest at the centre and zero at the pipe wall.Above a certain flow rate, which is determined by the nature of fluid and the pipe, thelayers of liquid mix together and turbulent flow is established (Fig. 1.7 (c)) in the bulk ofthe fluid, although the flow remains streamline in the boundary film. Higher flowratesproduce more turbulent flow and hence thinner boundary films.
Fluid flow is characterised by a dimensionless group (Appendix D) named theReynolds number (Re). This is calculated using
Re � Dv��
1�9
where D (m) = the diameter of the pipe, v (m s�1) = average velocity, � (kg m�3) = fluiddensity and � (N s m�2) = fluid viscosity.
Fig. 1.7 Fluid flow: (a) velocity distribution and boundary layer; (b) streamline flow; (c) turbulentflow.
24 Food processing technology

A Reynolds number of less than 2100 describes streamline flow and a Reynoldsnumber of more than 4000 describes turbulent flow. For Reynolds numbers between 2100and 4000, transitional flow is present, which can be either laminar or turbulent atdifferent times. These different flow characteristics have important implications for heattransfer and mixing operations; turbulent flow produces thinner boundary layers, whichin turn permit higher rates of heat transfer. The implications of this for the design andperformance of equipment are discussed in Chapters 11–13 and 17 (for liquids throughpipes or over metal plates) and Chapters 15, 16 and 21 (for air moving over the surface offood or metal). The Reynolds number can also be used to determine the powerrequirements for pumps and mixers used for blending and mixing operations (Chapter 5).
In turbulent flow, particles of fluid move in all directions and solids are retained insuspension more readily. This reduces the formation of deposits on heat exchangers andprevents solids from settling out in pipework. Streamline flow produces a larger range ofresidence times for individual particles flowing in a tube. This is especially importantwhen calculating the residence time required for heat treatment of liquid foods, as it isnecessary to ensure that all parts of the food receive the required amount of heat. Thisaspect is discussed in more detail in relation to ohmic heating (Chapter 18). Turbulentflow causes higher friction losses than streamline flow does and therefore requires higherenergy inputs from pumps.
Sample problem 1.5Two fluids, milk and rape-seed oil, are flowing along pipes of the same diameter(5 cm) at 20ºC and at the same flow velocity of 3 m s�1. Determine whether the flow isstreamline or turbulent in each fluid. (Physical properties of milk and rape-seed oil areshown in Table 1.2.)
Solution to Sample problem 1.5For milk from Table 1.2, � � 2�10 � 10�3 N s m�2 and � � 1030 kg m�3. Fromequation (1.9),
Re � Dv��
Therefore,
Re � 0�05 � 3 � 10302�1 � 10�3
� 73 571
Thus the flow is turbulent (because Re is greater than 4000).For rape-seed oil, from Table 1.2, � � 118 � 10�3N s m�2 and � � 900 kg m�3.
Therefore
Re � 0�05 � 3 � 900118 � 10�3
� 1144
Thus the flow is streamline (because Re is less than 2100).
Properties of foods and processing theory 25

1.3.1 Fluid flow through fluidised bedsWhen air passes upwards through a bed of food, the particles create a resistance to theflow of air and reduce the area available for it to flow through the bed. As the air velocityis increased, a point is reached where the weight of the food is just balanced by the forceof the air, and the bed becomes fluidised (for example fluidised-bed drying (Chapter 15)).If the velocity is increased further, the bed becomes more open (the voidage is increased),until eventually the particles are conveyed in the fluid stream (for example pneumaticseparation (Chapter 3), pneumatic drying (Chapter 15), or pneumatic conveying (Chapter26)). The velocity of the air needed to achieve fluidisation of spherical particles iscalculated using
vf � ��s � ��g�
d2�3
180�1 � �� 1�10
where vf (m s�1) � fluidisation velocity, �s (kg m�3) � density of the solid particles, �(kg m�3) � density of the fluid, g (m s�2) � acceleration due to gravity, � (N s m�2) �viscosity of the fluid, d (m) � diameter of the particles, � � the voidage of the bed.
Formulae for foods of other shapes are described by Kunii and Levenspiel (1969). Theminimum air velocity needed to convey particles is found using
ve ���
4d��s � ��3Cd�
�1�11
where ve (m s�1) � minimum air velocity and Cd (= 0.44 for Re � 500–200 000) � thedrag coefficient.
1.4 Heat transfer
Most unit operations in food processing involve the transfer of heat into or out of a food.There are three ways in which heat may be transferred: by radiation, by conduction and byconvection. Radiation, which is described in detail in Chapter 18, is the transfer of heat byelectromagnetic waves (see Chapter 18, Fig. 18.1), for example in an electric grill.Conduction is the movement of heat by direct transfer of molecular energy within solids (forexample through metal containers or solid foods). Convection is the transfer of heat bygroups of molecules that move as a result of differences in density (for example in heated
Sample problem 1.6Peas which have an average diameter of 6 mm and a density of 880 kg m�3 are dried ina fluidised-bed drier (Chapter 15). The minimum voidage is 0.4 and the cross-sectionalarea of the bed is 0.25 m2. Calculate the minimum air velocity needed to fluidise thebed if the air density is 0.96 kg m�3 and the air viscosity is 2�15 � 10�5 N s m�2.
Solution to Sample problem 1.6From equation (1.10),
vf � �880 � 0�96�9�812�15 � 10�5
�0�006�2�0�4�3
180�1 � 0�4�� 8�5 m s�1
26 Food processing technology

air) or as a result of agitation (for example in stirred liquids). In the majority of applicationsall three types of heat transfer occur simultaneously but one type may be more importantthan others in particular applications. Further details are given by Hayhurst (1997).
1.4.1 Energy balancesAn energy balance states that ‘the amount of heat or mechanical energy entering aprocess � the total energy leaving with the products and wastes � stored energy �energy lost to the surroundings’. If heat losses are minimised, energy losses to thesurroundings may be ignored for approximate solutions to calculation of, for example, thequantity of steam, hot air or refrigerant required. For more accurate solutions,compensation should be made for heat losses.
1.4.2 Mechanisms of heat transferSteady-state heat transfer takes place when there is a constant temperature differencebetween two materials. The amount of heat entering a material equals the amount of heatleaving, and there is no change in temperature of the material. This occurs for examplewhen heat is transferred through the wall of a cold store if the store temperature andambient temperature are constant (Chapter 19), and in continuous processes onceoperating conditions have stabilised. However, in the majority of food-processingapplications the temperature of the food and/or the heating or cooling medium areconstantly changing, and unsteady-state heat transfer is more commonly found.Calculations of heat transfer under these conditions are extremely complicated but aresimplified by making a number of assumptions and using prepared charts and computermodels to give approximate solutions (Toledo, 1999).
Steady-state conductionThe rate at which heat is transferred by conduction is determined by the temperaturedifference between the food and the heating or cooling medium, and the total resistanceto heat transfer. The resistance to heat transfer is expressed as the conductance of amaterial, or more usefully as the reciprocal which is termed the thermal conductivity.Thermal conductivities of some materials found in food processing are shown in Tables1.2 and 1.5.
Under steady-state conditions the rate of heat transfer is calculated using
Q � kA��1 � �2�x
1�12
where Q (J s�1) � rate of heat transfer, k (J m�1 s�1 K�1 or W m�1 K�1) � thermalconductivity, A (m2) � surface area, �1 – �2 (oC or K) � temperature difference and x(m) � thickness of the material. (�1 ��2)/x is also known as the temperature gradient.
Although, for example, stainless steel conducts heat ten times less well thanaluminium (Table 1.5), the difference is small compared to the low thermal conductivityof foods (twenty to thirty times smaller than steel) and does not limit the rate of heattransfer. Stainless steel is much less reactive than other metals, particularly with acidicfoods, and is therefore used in most food-processing equipment that comes into contactwith foods.
The thermal conductivity of foods is influenced by a number of factors concerned withthe nature of the food (for example cell structure, the amount of air trapped between the
Properties of foods and processing theory 27

cells, and the moisture content), and the temperature and pressure of the surroundings. Areduction in moisture content causes a substantial reduction in thermal conductivity. Thishas important implications in unit operations which involve conduction of heat through foodto remove water (for example drying (Chapter 15), frying (Chapter 17) and freeze drying(Chapter 22)). In freeze drying the reduction in atmospheric pressure also influences thethermal conductivity of the food. Ice has a higher thermal conductivity than water and this isimportant in determining the rate of freezing and thawing (Chapter 21). (A sample problemindicating the importance of thermal conductivity is shown in Chapter 17.)
Unsteady-state conductionDuring processing, the temperature at a given point within a food depends on the rate ofheating or cooling and the position in the food. The temperature therefore changescontinuously. The factors that influence the temperature change are:
• the temperature of the heating medium
Table 1.5 Thermal conductivity of selected foods and other materials
Thermal conductivity Temperature ofType of material (W m�1 K�1) measurement (ºC)
Construction materialsAluminium 220 0Copper 388 0Stainless steel 21 20Other metals 45–400 0Brick 0.69 20Concrete 0.87 20
FoodsOlive oila 0.17 20Whole milka 0.56 20Freeze-dried foods 0.01–0.04 0Frozen beefb 1.30 �10Pork (lean)b 0.48 3.8Frozen cod 1.66 �10Apple juice 0.56 20Orange 0.41 0–15Green beans 0.80 �12.1Cauliflower 0.80 �6.6Egg 0.96 �8Ice 2.25 0Watera 0.57 0
Packaging materialsCardboard 0.07 20Glass, soda 0.52 20Polyethylene 0.55 20Poly(vinyl chloride) 0.29 20
Insulating materialsPolystyrene foam 0.036 0Polyurethane foam 0.026 0Other types 0.026–0.052 30
a Assuming convection currents are absent.b Heat flow parallel to fibres.From Earle (1983), Lewis (1987) and Woodams and Nowrey (1968).
28 Food processing technology

• the thermal conductivity of the food• the specific heat of the food.
Examples of the specific heat of foods are given in Tables 1.2 and 1.6. Thermaldiffusivity is related to the thermal conductivity, specific heat and density of a food by
a � k�c
1�13
where a (m2 s�1) � the thermal diffusivity, � (kg m�3) � density, c (J kg�1 K�1) �specific heat capacity and k (W m�1 K�1) � thermal conductivity.
The basic equation for unsteady-state heat transfer in a single direction (x) is
d�dt
� k�c
d2�
dx21�14
where d�/dt � change in temperature with time.Examples of solutions to this equation for simple shapes (for example a slab, cylinder
or sphere) are described by Earle (1983), Jackson and Lamb (1981) and Loncin andMerson (1979).
ConvectionWhen a fluid changes temperature, the resulting changes in density establish natural-convection currents. Examples include natural-circulation evaporators (Chapter 13), airmovement in chest freezers (Chapter 21), and movement of liquids inside cans duringsterilisation (Chapter 12). Forced convection takes place when a stirrer or fan is used toagitate the fluid. This reduces the boundary film thickness to produce higher rates of heattransfer and a more rapid temperature redistribution. Consequently, forced convection ismore commonly used than natural convection in food processing. Examples of forcedconvection include mixers (Chapter 5), fluidised-bed driers (Chapter 15), air blastfreezers (Chapter 21) and liquids pumped through heat exchangers (Chapters 11–13).
When liquids or gases are used as heating or cooling media, the rate of heat transferfrom the fluid to the surface of a food is found using
Table 1.6 Specific heat of selected foods and other materials
Food/material Specific heat (kJ kg�1 K�1) Temperature (ºC)
Aluminium 0.89 20Apples 3.59 ambientApples 1.88 frozenCod 3.76 ambientCod 2.05 frozenCopper 0.38 20Ice 2.04 0Lamb 2.80 ambientLamb 1.25 frozenPotatoes 3.43 ambientPotatoes 1.80 frozenStainless steel 0.46 20Water 4.18 15Water vapour 2.05 100
Adapted from data of Peleg and Bagley (1983), Jowitt et al. (1983) and Polley et al. (1980).
Properties of foods and processing theory 29

Q � hsA��b � �s� 1�15
where Q (J s�1) � rate of heat transfer, A (m2) � surface area, �s (K) � surfacetemperature, �b (K) � bulk fluid temperature and hs (W m�2 K�1) � surface (or film) heattransfer coefficient.
The surface heat transfer coefficient is a measure of the resistance to heat flow, causedby the boundary film, and is therefore equivalent to the term k/x in the conductionequation (equation 1.12) (Polley et al., 1980). It is higher in turbulent flow than instreamline flow. Typical values of hs are given in Table 1.7.
These data indicate that heat transfer through air is lower than through liquids andhigher rates of heat transfer are obtained by moving air than still air. Larger heatexchangers are therefore necessary when air is used for heating (Chapters 15 and 16) orcooling (Chapters 19 and 21) compared to those needed for liquids. Condensing steamproduces higher rates of heat transfer than hot water at the same temperature and thepresence of air in steam reduces the rate of heat transfer. This has important implicationsfor canning (Chapter 12) as any air in the steam lowers the temperature and hence lowersthat amount of heat received by the food. Both thermometers and pressure gauges aretherefore needed to assess whether steam is saturated.
The surface heat transfer coefficient is related to the physical properties of a fluid (forexample density, viscosity, specific heat), gravity (which causes circulation due tochanges in density), temperature difference and the length or diameter of the containerunder investigation. The formulae which relate these factors are expressed asdimensionless numbers (Appendix D) as follows:
Nusselt number Nu � hcDk
1�16
Prandtl number Pr � cp�
k1�17
Grashof number Gr � D3�2g���
�21�18
where hc (W m�2 K�1) � convection heat transfer coefficient at the solid-liquid interface, D(m) � the characteristic dimension (length or diameter), k (W m�1 K�1) � thermal con-
Table 1.7 Values of surface heat transfer coefficients
Surface heat transfercoefficient hs Typical(W m�2 K�1) applications
Boiling liquids 2400–60 000 EvaporationCondensing saturated steam 12 000 Canning, evaporationCondensing steam
With 3% air 3500 CanningWith 6% air 1200
Condensing ammonia 6000 Freezing, chillingLiquid flowing through pipes
low viscosity 1200–6000 Pasteurisationhigh viscosity 120–1200 Evaporation
Moving air (3 m s�1) 30 Freezing, bakingStill air 6 Cold stores
Adapted from Loncin and Merson (1979) and Earle (1983).
30 Food processing technology

ductivity of the fluid, cp (J kg�1 K�1) � specific heat at constant pressure, � (kg m�3) �density, � (N s m�2) � viscosity, g (m s�2) � acceleration due to gravity, � (m m�1 K�1) �coefficient of thermal expansion, �� (K) � temperature difference and v (m s�1) � velocity.
For streamline flow through pipes,
Nu � 1�62�Re PrDL�0�33 1�19
where L (m) � length of pipe, when Re Pr D/L > 120 and all physical properties aremeasured at the mean bulk temperature of the fluid.
For turbulent flow through pipes,
Nu � 0�023�Re�0�8�Pr�n 1�20
where n � 0.4 for heating or n � 0.3 for cooling, when Re 10 000, viscosity ismeasured at the mean film temperature and other physical properties are measured at themean bulk temperature of the fluid.
The Grashof number is used for natural convection when there is no turbulence in thefluid. Formulae for other types of flow conditions and different vessels are described byLoncin and Merson (1979), Jackson and Lamb (1981) and Earle (1983).
Sample problem 1.7Whole milk is cooled in the pipes of a tubular heat exchanger from 30ºC to 10ºC, bywater at 1ºC. The pipe diameter is 5 cm and the milk flow velocity is 1.0 m s�1.Calculate the heat transfer coefficient for the milk using physical properties described inTable 1.2.
Solution to Sample problem 1.7
Mean bulk temperature � 30 � 102
� 20�C
From Table 1.2, � � 1030 kg m�3 c � 3�9 kJ kg�1�K�1
and
k � 0�56 W m�2 �K�1�
If Re 10 000 viscosity should be measured at the mean temperature.
Mean film temperature � 1 � 12 �30 � 10�
2
� 10�5�C
For milk at 10.5ºC, � � 2�8 � 10�3N s m�2. From equation (1.9),
Re � Dv��
� 0�05 � 1�0 � 10302�8 � 10�3
� 18 393
Properties of foods and processing theory 31

Most cases of heat transfer in food processing involve heat transfer through a numberof different materials. For example heat transfer in a heat exchanger from a hot fluid,through the wall of a vessel to a second fluid is shown in Fig. 1.8.
The overall temperature difference is found using
�a � �b � QA
�1ha
xk� 1
hb
�1�21
From equation (1.17)
Pr � cp�
k
� �3�9 � 103��2�8 � 10�3�0�56
� 19�5
From equations (1.16) and (1.20)
Nu � hcDk
� 0�023�Re�0�8�Pr�0�33
Therefore,
hc � 0�023kD�Re�0�8 �Pr�0�33�
� 0�0230�560�05
�18 393�0�8�19�5�0�33
� 1768 W m�2 �K�1
Fig. 1.8 Temperature changes from a hotliquid through a vessel wall to a cold liquid.
32 Food processing technology

The unknown wall temperatures �2 and �3 are therefore not required and all factors tosolve the equation can be measured.
The sum of the resistances to heat flow is termed the overall heat transfer coefficient(OHTC) U and the rate of heat transfer may then be expressed as
Q � UA��a � �b� 1�22
The OHTC is an important term which is used, for example, to indicate theeffectiveness of heating or cooling in different types of processing equipment. Examplesare shown in Table 1.8.
Liquids can be made to flow in either the same direction or in opposite directions in aheat exchanger. Counter-current flow of fluids (Fig. 1.9) has a higher heat transferefficiency than co-current (or ‘parallel’) flow and is therefore widely used in heatexchangers (for example Chapters 10–21). However, the temperature difference varies atdifferent points in the heat exchanger and it is necessary to use a logarithmic meantemperature difference in calculations (equation 1.23):
Table 1.8 OHTCs in food processing
Heat transfer fluids Example OHTC (W m�2 K�1)
Hot water–air Air heater 10–50Viscous liquid–hot water Jacketed vessel 100Viscous liquid–hot water Agitated jacketed vessel 500Viscous liquid–steam Evaporator 500Non-viscous liquid–steam Evaporator 1000–3000Flue gas–water Boiler 5–50Evaporating ammonia–water Chilled water plant 500
Adapted from Lewis (1990).
Fig. 1.9 Parallel and counter-current flow through a heat exchanger.
Properties of foods and processing theory 33

��m � ��1 ���2
ln���1��2� 1�23
where �1 is higher than �2.Related sample problems are shown in Chapters 11, 13 and 15.The heating time in batch processing is found using
t � mcUA
ln
��h � �i
�h � �f
�1�24
where m (kg) � the mass, c (J kg�1 oK�1) � specific heat capacity, �h (oC) � temperatureof the heating medium, �i (oC) � initial temperature, �f (oC) � final temperature, A (m2)� surface area and U (W m�2 K�1) � OHTC.
Sample problem 1.8In the counter-current heat exchanger shown in Fig. 1.9, milk is cooled from 73ºC to38ºC at the rate of 2500 kg h�1, using water at 15ºC which leaves the heat exchangerat 40ºC. The pipework 2.5 cm in diameter is constructed from stainless steel 3 mmthick; the surface film heat transfer coefficients are 1200 W m�2 K�1 on the milk sideand 3000 W m�2 K�1 on the water side of the pipe. Calculate the OHTC and the lengthof pipe required.
Solution to Sample problem 1.8To find the OHTC, from equations (1.21) and (1.22),
1U
� 1ha
� xk� 1
hb
� 11200
� 3 � 10�3
21� 1
3000� 1�3 � 10�3
Therefore the OHTC is
U � 769�2 W m�2 �K�1
To find the length of pipe required, we proceed as follows.From equations (1.22) and (1.23),
Q � UA��m
and
��m � ��1 ���2
ln ���1���2�
� �73 � 40���38 � 15�ln�73 � 40���38 � 15�
� 27�8�C
Now Q is the heat removed from the milk which equals mcp��a � �b�. From Table 1.2,cp � 3�9 kJ kg�1 ºK�1. Therefore,
34 Food processing technology

Unsteady-state heat transfer by conduction and convectionWhen a solid piece of food is heated or cooled by a fluid, the resistances to heat transferare the surface heat transfer coefficient and the thermal conductivity of the food. Thesetwo factors are related by the Biot Number Bi:
Bi � h�k
1�25
where h (W m�2 K�1) � heat transfer coefficient, � � the characteristic ‘half dimension’(e.g. radius of a sphere or cylinder, half thickness of a slab) and k (W m�1 K�1) � thermalconductivity.
At small Bi values (less than 0.2) the surface film is the main resistance to heat flowand the time required to heat the solid food is found using equation (1.24), using the filmheat transfer coefficient hs instead of U. However, in most applications the thermalconductivity of the food limits the rate of heat transfer (Bi > 0.2). These calculations arecomplex, and a series of charts is available to solve the unsteady-state equations forsimple shaped foods (Fig. 1.10). The charts relate the Biot number (Bi) (equation 1.25),the temperature factor (the fraction of the temperature change that remains to beaccomplished (equation (1.26))) and the Fourier number Fo (a dimensionless numberwhich relates the thermal diffusivity, the size of the piece and the time of heating orcooling (equation (1.27))).
�h � �f
�h � �i1�26
where the subscript h indicates the heating medium, the subscript f the final value and thesubscript i the initial value.
Q � 25003600
�3�9 � 103��73 � 38�
� 9�48 � 104J
Now the area is
A � QU��m
� 9�48 � 104
769�2 � 27�8
� 4�4 m2
Also
A � �DL
Therefore the length of pipe is
L � A�D
� 4�43�142 � 0�025
� 56 m
Properties of foods and processing theory 35

Fo � kc�
t�2
1�27
Examples of unsteady-state calculations are shown below and in Chapter 19. Morecomplex calculations are described by Lewis (1990), Earle (1983) and Jackson and Lamb(1981).
Sample problem 1.9Peas which have an average diameter of 6 mm are blanched to give a temperature of85ºC at the centre. The initial temperature of the peas is 15ºC and the temperature ofthe blancher water is 95ºC. Calculate the time required, assuming that the heat transfercoefficient is 1200 W m�2 K�1 and, for peas, the thermal conductivity is0.35 W m�1 K�1, the specific heat is 3.3 KJ kg�1 K�1, and the density is 980 kg m�3.
Solution to Sample problem 1.9From equation (1.25),
Bi � h�k
� 1200�3 � 10�3�0�35
� 10�3
Fig. 1.10 Chart for unsteady-state heat transfer: (a) sphere; (b) slab; (c) cylinder.(After Henderson and Perry (1955).)
36 Food processing technology

1.4.3 Sources of heat and methods of application to foodsThe cost of energy for heating has become one of the major considerations in the selectionof processing methods and ultimately in the cost of the processed food and the profitabilityof the operation. Different fuels have specific advantages and limitations in terms of cost,safety, risk of contamination of the food, flexibility of use, and capital and operating costsfor heat transfer equipment. The following sources of energy are used in food processing:
• electricity• gas (natural and liquid petroleum gas)• liquid fuel oil.
Solid fuels (anthracite, coal, wood and charcoal) are only used to a small extent. Theadvantages and limitations of each type of energy source are shown in Table 1.9.
Direct heating methodsIn direct methods the heat and products of combustion from the burning fuel comedirectly into contact with the food. There is an obvious risk of contamination of the foodby odours or incompletely burned fuel and, for this reason, only gas and, to a lesserextent, liquid fuels are used. Applications include kiln driers (Chapter 15) and bakingovens (Chapter 16). These direct methods should not be confused with ‘direct’ steaminjection where the steam is produced in a separate location from the processing plant.Electricity is not a fuel in the same sense as the other types described above. It isgenerated by steam turbines heated by a primary fuel (for example coal or fuel oil) or byhydro-power or nuclear fission. However, electrical energy is also said to be used directlyin dielectric heating or microwave heating (Chapter 18).
Therefore,
kh�
� 0�097
From equation (1.26),
�h � �f
�h � �i� 95 � 85
95 � 15
� 0�125
From the chart for a sphere (Fig. 1.10), Fo � 0.32. From equation (1.27),
Fo � kc�
t�2
� 0�32
Therefore,
time t � 0�32c��2
k
� 0�32�3�3 � 103�980�3 � 10�3�2
0�35� 26�6 s
Properties of foods and processing theory 37

Indirect methodsIndirect cooling of foods is described in Chapters 19 and 21. Indirect heating methodsemploy a heat exchanger to separate the food from the products of combustion. At itssimplest an indirect system consists of burning fuel beneath a metal plate and heating byenergy radiated from the plate. The most common type of indirect-heating system used infood processing is steam or hot water generated by a heat exchanger (a boiler) locatedaway from the processing area. A second heat exchanger transfers the heat from thesteam to the food under controlled conditions or the steam is injected into the food. Avariation on this system involves an additional heat exchanger which transfers heat fromthe steam to air in order to dry foods or to heat them under dry conditions. Theadvantages of steam for process heating, and a description of equipment for producingand handling different types of steam, are given by Farrall (1979). Properties of steam arediscussed by Brennan et al. (1990) and Toledo (1999) and the temperatures of saturatedsteam are shown in Chapter 12 (Table 12.6).
Indirect electrical heating uses resistance heaters or infrared heaters. Resistanceheaters are nickel-chromium wires contained in solid plates or coils, which are attachedto the walls of vessels, in flexible jackets which wrap around vessels, or in immersionheaters which are submerged in the food. These types of heater are used for localised orintermittent heating. Infrared heaters are described in Chapter 18.
1.4.4 Energy conservationA survey of food industries within the European Union found large variations in energyconsumption in different types of processing; flour milling has the lowest energy input(586 MJ per tonne of product) and cocoa and chocolate processing the highest (8335 MJper tonne of product) (Whitman et al., 1981). A comparison of energy inputs in differenttypes of potato processing is shown in Table 1.10.
In all types of food processing, most of the energy (58%; range, 40–80%) is used foractual processing, but significant amounts are also used for packaging (11%; range, 15–40%), transport (12%; range, 0.56–30%), cleaning water (15%) and storage (up to 85% oftotal energy input for deep-frozen foods). Boiler fuel accounts for 8.6–97.2% of the total
Table 1.9 Advantages and limitations of different energy sources for food processing
Liquid SolidElectricity Gas fuel fuel
Energy per unit mass or volume Not Lowa Highb Moderateapplicable to highc
Cost per kilojoule of energy High Low Low LowHeat transfer equipment cost Low Low High HighEfficiency of heatingd High Moderate Moderate Low
to high to lowFlexibility of use High High Low LowFire or explosion hazard Low High Low LowRisk of food contamination Low Low High HighLabour and handling costs Low Low Low Higha Heating value for gas is 1�17 � 103 � 4�78 � 103 kJ kg�1.b Heating value for oil is 8�6 � 103 � 9�3 � 103 kJ kg�1.c Heating value for coal is 5�26 � 103 � 6�7 � 103 kJ kg�1 and for wood is 3�8 � 103 � 5�26 � 103 kJ kg�1.d Efficiency defined as the amount of energy used to heat the product divided by the amount of energy supplied.Data compiled from Farrall (1979) and Whitman et al. (1981).
38 Food processing technology

energy input to a factory, but boiler utilisation averages only 45%, owing to the practiceof keeping the boiler on low heat during periods of low production rates (for exampleevening and night shifts). In addition an average of only half of the condensate is returnedto the boiler and the heat contained in the condensate is therefore wasted. On average40% of the heat lost from factories is contained in vapours and steam and a further 10–20% is lost in hot water (Whitman et al., 1981).
It is clear from this and other data (for example Kefford, 1982), that potentially themain energy savings in food processing are associated with boiler operation, the supply ofsteam or hot air, and re-use of waste heat. An energy audit is used to identify specificareas and equipment within a factory where energy savings can be made (Boardman,1986). In summary, boiler operation is improved by:
• returning condensate as feed water• pre-heating air for combustion of fuel• insulating the boiler• recovering heat from the flue.
Computer control of boiler operation is described by Wells and Swientek (1983).Energy savings in steam supply to processing areas are achieved by:
• proper insulation of steam and hot-water pipes• minimising steam leaks• fitting steam traps.
Individual processing equipment is designed for energy saving. Examples includeregeneration of heat in heat exchangers (Delashmit et al., 1983) (examples in Chapters 10,11, 16 and 17), multiple-effect or vapour recompression systems (Chapter 13) and automaticdefrosting and correct insulation of freezing equipment (Chapters 19–21). Microprocessorcontrol of processing equipment (Chapter 2) is widely used to reduce energy consumption.Recovery of heat from drying air is more difficult than from steam or vapours because air isnot recompressible. However, a number of heat exchanger designs are used to recover wasteheat from air or gases (for example the ‘thermal wheel’ in Fig. 1.11).
Commercial applications of this equipment are described in Chapter 15 (baking ovens)and Chapter 16 (deep-fat fryers). If the humidity of air is reduced, it is reheated moreeconomically. The ‘rotaire wheel’ (Fig. 1.12) and heat pump are examples ofdehumidifying equipment. Heat pumps are similar to refrigeration plant (see Chapter19, Fig. 19.1) but operate by removing heat from a low-temperature source and using it toheat air or water. The application of heat pumps to low-temperature drying of
Table 1.10 Comparative energy inputs in potato processing
Energy input (MJ t�1)
Hot air Freeze Retortdried dried Canned pouched Frozen
Processing 8 42 6 4 5Packaging 1 2 14 7 7Storage 0.1 0.1 0.1 0.1 32(Home) 0 0 0 0 (24)Transport 2 2 8 8 8Total 11 46 28 19 52
Reported in Kelford (1982).
Properties of foods and processing theory 39

confectionery is described by Anon. (1983a, b, c). The use of air knives for packagedrying is described by Anon. (1983d) and Beevers (1985). Other energy-savingtechniques during dehydration are described by Senhaji and Bimbenet (1984), Flink(1977) and Green (1982).
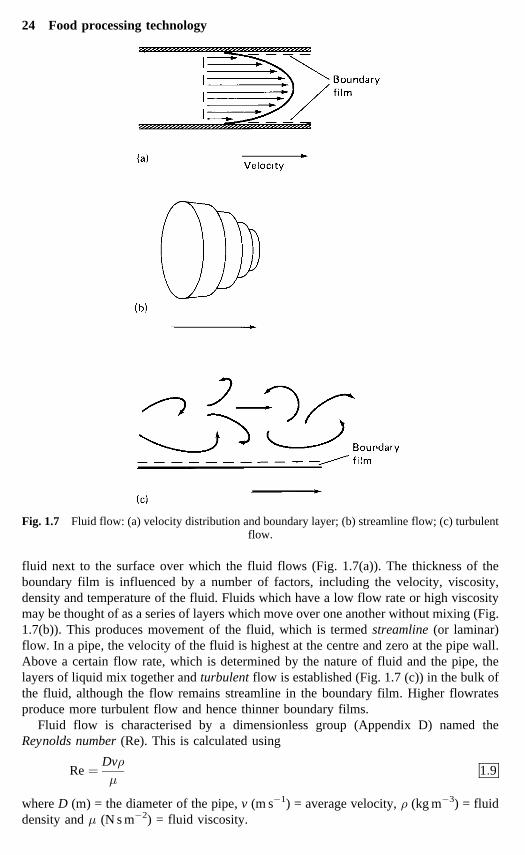
1.4.5 Effect of heat on micro-organismsThe preservative effect of heat processing is due to the denaturation of proteins, whichdestroys enzyme activity and enzyme-controlled metabolism in micro-organisms. Therate of destruction is a first-order reaction; that is when food is heated to a temperaturethat is high enough to destroy contaminating micro-organisms, the same percentage die ina given time interval regardless of the numbers present initially. This is known as thelogarithmic order of death and is described by a death rate curve (Fig. 1.13).
The time needed to destroy 90% of the micro-organisms (to reduce their numbers by afactor of 10) is referred to as the decimal reduction time or D value (5 min in Fig. 1.13). Dvalues differ for different microbial species (Table 1.11), and a higher D value indicatesgreater heat resistance.
Fig. 1.11 Thermal wheel (Courtesy of the Electricity Council.)
Fig 1.12 Rotaire wheel (Courtesy of the Electricity Council.)
40 Food processing technology
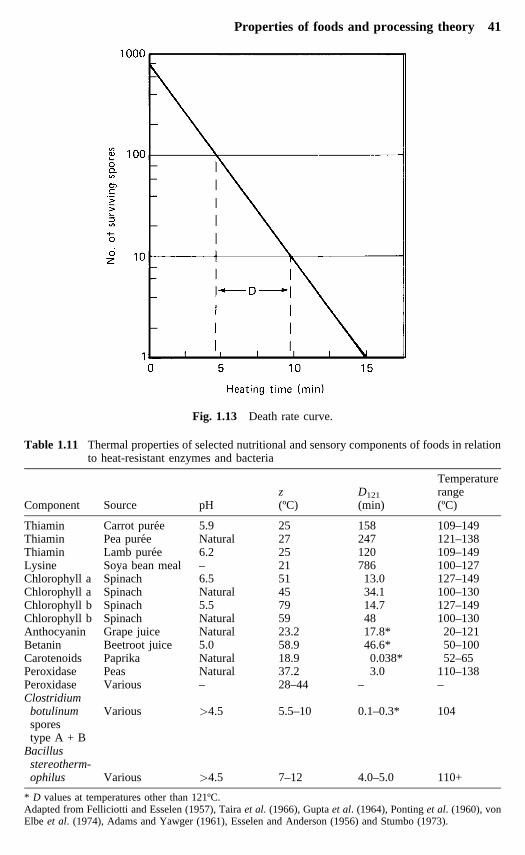
Fig. 1.13 Death rate curve.
Table 1.11 Thermal properties of selected nutritional and sensory components of foods in relationto heat-resistant enzymes and bacteria
Temperaturez D121 range
Component Source pH (ºC) (min) (ºC)
Thiamin Carrot puree 5.9 25 158 109–149Thiamin Pea puree Natural 27 247 121–138Thiamin Lamb puree 6.2 25 120 109–149Lysine Soya bean meal – 21 786 100–127Chlorophyll a Spinach 6.5 51 13.0 127–149Chlorophyll a Spinach Natural 45 34.1 100–130Chlorophyll b Spinach 5.5 79 14.7 127–149Chlorophyll b Spinach Natural 59 48 100–130Anthocyanin Grape juice Natural 23.2 17.8* 20–121Betanin Beetroot juice 5.0 58.9 46.6* 50–100Carotenoids Paprika Natural 18.9 0.038* 52–65Peroxidase Peas Natural 37.2 3.0 110–138Peroxidase Various – 28–44 – –Clostridiumbotulinum Various 4.5 5.5–10 0.1–0.3* 104sporestype A + B
Bacillusstereotherm-ophilus Various 4.5 7–12 4.0–5.0 110+
* D values at temperatures other than 121ºC.Adapted from Felliciotti and Esselen (1957), Taira et al. (1966), Gupta et al. (1964), Ponting et al. (1960), vonElbe et al. (1974), Adams and Yawger (1961), Esselen and Anderson (1956) and Stumbo (1973).
Properties of foods and processing theory 41

There are two important implications arising from the decimal reduction time: first,the higher the number of micro-organisms present in a raw material, the longer it takes toreduce the numbers to a specified level. In commercial operation the number of micro-organisms varies in each batch of raw material, but it is difficult to recalculate processtimes for each batch of food. A specific temperature–time combination is therefore usedto process every batch of a particular product, and adequate preparation procedures(Chapter 3) are used to ensure that the raw material has a satisfactory and uniformmicrobiological quality. Second, because microbial destruction takes place logarith-mically, it is theoretically possible to destroy all cells only after heating for an infinitetime. Processing therefore aims to reduce the number of surviving micro-organisms by apre-determined amount. This gives rise to the concept of commercial sterility, which isdiscussed further in Chapters 10–12.
The destruction of micro-organisms is temperature dependent; cells die more rapidlyat higher temperatures. By collating D values at different temperatures, a thermal deathtime (TDT) curve is constructed (Fig. 1.14). The slope of the TDT curve is termed the zvalue and is defined as the number of degrees Celsius required to bring about a ten-foldchange in decimal reduction time (10.5ºC in Fig. 1.14). The D value and z value are usedto characterise the heat resistance of a micro-organism and its temperature dependencerespectively.
There are a large number of factors which determine the heat resistance of micro-organisms, but general statements of the effect of a given variable on heat resistance arenot always possible. The following factors are known to be important.
Fig. 1.14 TDT curve. Microbial destruction is faster at higher temperatures (for example 100 minat 102.5ºC has the same lethal effect as 10 min at 113ºC).
42 Food processing technology

1. Type of micro-organism. Different species and strains show wide variation in theirheat resistance (Table 1.11). Spores are much more heat resistant than vegetativecells.
2. Incubation conditions during cell growth or spore formation. These include:(a) temperature (spores produced at higher temperatures are more resistant than
those produced at lower temperatures)(b) age of the culture (the stage of growth of vegetative cells affects their heat
resistance)(c) culture medium used (for example mineral salts and fatty acids influence the
heat resistance of spores).3. Conditions during heat treatment. The important conditions are:
(a) pH of the food (pathogenic and spoilage bacteria are more heat resistant near toneutrality; yeasts and fungi are able to tolerate more acidic conditions but areless heat resistant than bacterial spores)
(b) water activity of the food (section 1.5) influences the heat resistance ofvegetative cells; in addition moist heat is more effective than dry heat for sporedestruction
(c) composition of the food (proteins, fats and high concentration of sucroseincrease the heat resistance of micro-organisms; the low concentration ofsodium chloride used in most foods does not have a significant effect; thephysical state of the food, particularly the presence of colloids, affects the heatresistance of vegetative cells)
(d) the growth media and incubation conditions, used to assess recovery of micro-organisms in heat resistance studies, affect the number of survivors observed.
Most enzymes have D and z values within a similar range to micro-organisms, and aretherefore inactivated during normal heat processing. However, some enzymes are veryheat resistant. These are particularly important in acidic foods, where they may not becompletely denaturated by the relatively short heat treatments and lower temperaturesrequired for microbial destruction. The factors which influence heat resistance ofenzymes are similar to those described for micro-organisms and are discussed in detail byWhitaker (1972).
A knowledge of the heat resistance of the enzymes and/or micro-organisms found in aspecific food is used to calculate the heating conditions needed for their destruction. Inpractice the most heat resistant enzyme or micro-organism likely to be present in a givenfood is used as a basis for calculating process conditions. It is assumed that other lessheat-resistant species are also destroyed. Methods for the calculation of processing timeare described in Chapter 12.
1.4.6 Effect of heat on nutritional and sensory characteristicsThe destruction of many vitamins, aroma compounds and pigments by heat follows asimilar first-order reaction to microbial destruction. Examples of D and z values ofselected vitamins and pigments are shown in Table 1.11. In general both values are higherthan those of micro-organisms and enzymes. As a result, nutritional and sensory propertiesare better retained by the use of higher temperatures and shorter times during heatprocessing. It is therefore possible to select particular time-temperature combinations froma TDT curve (all of which achieve the same degree of enzyme or microbial destruction), tooptimise a process for nutrient retention or preservation of desirable sensory qualities. This
Properties of foods and processing theory 43

concept forms the basis of individual quick blanching (Chapter 10), high-temperatureshort-time (HTST) pasteurisation (Chapter 11), ultrahigh-temperature sterilisation(Chapter 12) and HTST extrusion (Chapter 14). The loss of nutrients and changes tosensory quality during heat processing are reported in Chapters 10–18.
1.5 Water activity
Deterioration of foods by micro-organisms can take place rapidly, whereas enzymic andchemical reactions take place more slowly during storage. In either case the water contentis a very important factor controlling the rate of deterioration. The moisture content offoods can be expressed either on a wet-weight basis:
m � mass of watermass of sample
� 100 1�28
m � mass of watermass of water � solids
� 100 1�29
or on a dry-weight basis
m � mass of watermass of solids
1�30
(Lewis, 1990).The dry-weight basis is more commonly used for processing calculations, whereas the
wet-weight basis is frequently quoted in food composition tables. It is important,however, to note which system is used when expressing a result. Wet-weight basis is usedthroughout this text unless otherwise stated.
A knowledge of the moisture content alone is not sufficient to predict the stability offoods. Some foods are unstable at a low moisture content (for example peanut oildeteriorates if the moisture content exceeds 0.6%), whereas other foods are stable atrelatively high moisture contents (for example potato starch is stable at 20% moisture)(van den Berg, 1986). It is the availability of water for microbial, enzymic or chemicalactivity that determines the shelf life of a food, and this is measured by the water activity(aw) of a food, also known as the Relative Vapour Pressure (RVP).
Examples of unit operations that reduce the availability of water in foods include thosethat physically remove water (dehydration (Chapter 15), evaporation (Chapter 13) andfreeze drying or freeze concentration (Chapter 22)) and those that immobilise water in thefood (for example by the use of humectants in ‘intermediate-moisture’ foods and byformation of ice crystals in freezing (Chapter 21)). Examples of the moisture content andaw of foods are shown in Table 1.12 and the effect of reduced aw on food stability isshown in Table 1.13.
Water in food exerts a vapour pressure. The size of the vapour pressure dependson:
• the amount of water present• the temperature• the concentration of dissolved solutes (particularly salts and sugars) in the water.
Water activity is defined as ‘the ratio of the vapour pressure of water in a food to thesaturated vapour pressure of water at the same temperature’ (equation 1.31):
44 Food processing technology

Table 1.12 Moisture content and water activity of foods
Moisturecontent Water
Food (%) activity Degree of protection required
Ice (0ºC) 100 1.00a
Fresh meat 70 0.985Bread 40 0.96 Package to prevent moisture lossIce (�10ºC) 100 0.91a
Marmalade 35 0.86Ice (�20ºC) 100 0.82a
Wheat flour 14.5 0.72Ice (�50ºC) 100 0.62a Minimum protection or no packagingRaisins 27 0.60 requiredMacaroni 10 0.45
Cocoa powder 0.40Boiled sweets 3.0 0.30Biscuits 5.0 0.20 Package to prevent moisture uptakeDried milk 3.5 0.11Potato crisps 1.5 0.08a Vapour pressure of ice divided by vapour pressure of water.Adapted from Troller and Christian (1978), van den Berg (1986) and Brenndorfer et al. (1985).
Table 1.13 The importance of water activity in foods
�w Phenomenon Examples
1.00 Highly perishable fresh foods0.95 Pseudomonas, Bacillus, Clostridium
perfringens and some yeasts inhibitedFoods with 40% sucrose or 7% salt,cooked sausages, bread
0.90 Lower limit for bacterial growth (general),Salmonella, Vibrio parahaemolyticus,Clostridium botulinum, Lactobacillus, and someyeasts and fungi inhibited
Foods with 55% sucrose, 12% salt,cured ham, medium-age chesse.Intermediate-moisture foods(aw � 0�90 � 0�55�
0.85 Many yeasts inhibited Foods with 65% sucrose, 15% salt,salami, mature cheese, margarine
0.80 Lower limit for most enzyme activity andgrowth of most fungi; Straphlococcus aureusinhibited
Flour, rice (15–17% water) fruit cake,sweetened condensed milk, fruitsyrups, fondant
0.75 Lower limit for halophilic bacteria Marzipan (15–17% water), jams0.70 Lower limit for growth of most xerophilic fungi0.65 Maximum velocity of Maillard reactions Rolled oats (10% water), fudge,
molasses, nuts0.60 Lower limit for growth of osmophilic or
xerophilic yeasts and fungiDried fruits (15–20% water), toffees,caramels (8% water), honey
0.55 Deoxyribonucleic acid becomes disordered(lower limit for life to continue)
0.50 Dried foods (aw � 0–0.55), spices,noodles
0.40 Minimum oxidation velocity Whole egg powder (5% water)0.30 Crackers, bread crusts (3–5% water)0.25 Maximum heat resistance of bacterial spores0.20 Whole milk powder (2–3% water),
dried vegetables (5% water),cornflakes (5% water)
Properties of foods and processing theory 45

aw � PP0
1�31
where P (Pa) � vapour pressure of the food, P0 (Pa) � vapour pressure of pure water atthe same temperature. aw is related to the moisture content by a number of equations,including the following:
aw
M�1 � aw� �1
M1C� C � 1
M1Caw 1�32
where aw � water activity, M � moisture as percentage dry weight, M1 � moisture (dry-weight basis) of a monomolecular layer and C � a constant. A sample calculation isdescribed by Karel (1975).
A proportion of the total water in a food is strongly bound to specific sites (for examplehydroxyl groups of polysaccharides, carbonyl and amino groups of proteins, and hydrogenbonding). When all sites are (statistically) occupied by adsorbed water the moisture contentis termed the BET (Brunauer–Emmett–Teller) monolayer value (Fennema, 1996). Typicalexamples include gelatin (11%), starch (11%), amorphous lactose (6%) and whole spray-dried milk (3%). The BET monolayer value therefore represents the moisture content atwhich the food is most stable. At moisture contents below this level, there is a higher rate oflipid oxidation and, at higher moisture contents, Maillard browning and then enzymic andmicrobiological activities are promoted (Fig. 1.15).
The movement of water vapour from a food to the surrounding air depends upon both thefood (moisture content and composition) and the condition of the air (temperature andhumidity). At a constant temperature, the moisture content of food changes until it comes intoequilibrium with water vapour in the surrounding air. The food then neither gains nor losesweight on storage under those conditions. This is called the equilibrium moisture content ofthe food and the relative humidity of the storage atmosphere is known as the equilibriumrelative humidity. When different values of relative humidity versus equilibrium moisturecontent are plotted, a curve known as a water sorption isotherm is obtained (Fig. 1.16).
Each food has a unique set of sorption isotherms at different temperatures. The preciseshape of the sorption isotherm is caused by differences in the physical structure, chemicalcomposition and extent of water binding within the food, but all sorption isotherms havea characteristic shape, similar to that shown in Fig. 1.16. The first part of the curve, topoint A, represents monolayer water, which is very stable, unfreezable and not removedby drying. The second, relatively straight part of the curve (AB) represents wateradsorbed in multilayers within the food and solutions of soluble components. The thirdportion, (above point B) is ‘free’ water condensed within the capillary structure or in thecells of a food. It is mechanically trapped within the food and held by only weak forces. Itis easily removed by drying and easily frozen, as indicated by the steepness of the curve.Free water is available for microbial growth and enzyme activity, and a food which has amoisture content above point B on the curve is likely to be susceptible to spoilage.
The sorption isotherm indicates the aw at which a food is stable and allows predictions ofthe effect of changes in moisture content on aw and hence on storage stability. It is used todetermine the rate and extent of drying (Chapter 15), the optimum frozen storagetemperatures (Chapter 21) and the moisture barrier properties required in packagingmaterials (Chapter 24).
The rate of change in aw on a sorption isotherm differs according to whether moisture isremoved from a food (desorption) or whether it is added to dry food (absorption) (Fig.1.16). This is termed a hysteresis loop. The difference is large in some foods (for example
46 Food processing technology

rice) and is important for example in determining the protection required against moistureuptake.
1.5.1 Effect of aw on foodsThe effect of aw on microbiological and selected biochemical reactions is shown in Fig. 1.15and Table 1.13. Almost all microbial activity is inhibited below aw � 0.6, most fungi areinhibited below aw � 0.7, most yeasts are inhibited below aw � 0.8 and most bacteria belowaw � 0.9. The interaction of aw with temperature, pH, oxygen and carbon dioxide, orchemical preservatives has an important effect on the inhibition of microbial growth. Whenany one of the other environmental conditions is sub-optimal for a given micro-organism,the effect of reduced aw is enhanced. This permits the combination of several mild controlmechanisms which result in the preservation of food without substantial loss of nutritionalvalue or sensory characteristics (Table 1.14) (see also the ‘Hurdle effect’ in Section 1.8.2).
Fig. 1.15 Effect of water activity on microbial, enzymic and chemical changes to foods.(After Karel (1975).)
Properties of foods and processing theory 47

Enzymic activity virtually ceases at aw values below the BET monolayer value. This isdue to the low substrate mobility and its inability to diffuse to the reactive site on theenzyme. Chemical changes are more complex. The two most important that occur infoods which have a low aw are Maillard browning and oxidation of lipids. The aw thatcauses the maximum rate of browning varies with different foods. However, in general, alow aw restricts the mobility of the reactants and browning is reduced. At a higher aw,browning reaches a maximum. Water is a product of the condensation reaction inbrowning and, at higher moisture levels, browning is slowed by ‘end product inhibition’.At high moisture contents, water dilutes the reactants and the rate of browning falls.
Oxidation of lipids occurs at low aw values owing to the action of free radicals. Abovethe BET monolayer value, anti-oxidants and chelating agents (which sequester tracemetal catalysts) become soluble and reduce the rate of oxidation. At higher aw values thecatalytic activity of metals is reduced by hydration and the formation of insolublehydroxides but, at high aw values, metal catalysts become soluble, and the structure of thefood swells to expose more reactive sites (Fig. 1.15).
1.6 Effects of processing on the sensory characteristics of foods
There are a number of definitions of ‘quality’ of foods, which are discussed by Cardello(1998). To the consumer, the most important quality attributes of a food are its sensory
Fig. 1.16 Water sorption isotherm.
Table 1.14 Interaction of aw, pH and temperature in selected foods
Food pH aw Shelf life Notes
Fresh meat 4.5 0.95 days Preserve by chillingCooked meat 4.5 0.95 weeks Ambient storage when packagedDry sausage 4.5 0.90 months Preserved by salt and low aw
Fresh vegetables 4.5 0.95 weeks ‘Stable’ while respiringPickles 4.5 0.90 months Low pH maintained by packagingBread 4.5 0.95 daysFruit cake 4.5 0.90 weeks Preserved by heat and low aw
Milk 4.5 0.95 days Preserved by chillingYoghurt 4.5 0.95 weeks Preserved by low pH and chillingDried milk 4.5 0.90 months Preserved by low aw
48 Food processing technology

characteristics (texture, flavour, aroma, shape and colour). These determine anindividual’s preference for specific products, and small differences between brands ofsimilar products can have a substantial influence on acceptability. A continuing aim offood manufacturers is to find improvements in processing technology which retain orcreate desirable sensory qualities or reduce the damage to food caused by processing.Examples of such improvements are described in subsequent chapters.
1.6.1 TextureThe texture of foods is mostly determined by the moisture and fat contents, and the typesand amounts of structural carbohydrates (cellulose, starches and pectic materials) andproteins that are present. Changes in texture are caused by loss of moisture or fat,formation or breakdown of emulsions and gels, hydrolysis of polymeric carbohydrates,and coagulation or hydrolysis of proteins. Detailed information on the texturalcharacteristics of food is given by Mohsenin (1980), Lewis (1990) and Szczesniak(1983). The effect of food composition and structure on texture is described by Stanleyand Tung (1976) and Sherman (1976).
1.6.2 Taste, flavour and aromaTaste attributes consist of saltiness, sweetness, bitterness and acidity and some of theseattributes can be detected in very low thresholds in foods (Table 1.15). The taste of foodsis largely determined by the formulation used for a particular food and is mostlyunaffected by processing. Exceptions to this include increased sweetness due to
Table 1.15 Detection thresholds for common food components
Compound Taste or odour Threshold
Taste compoundsHydrochloric acid Sour 0.0009 NCitric acid Sour 0.0016 NLactic acid Sour 0.0023 NSodium chloride Salty 0.01 MPotassium chloride Bitter/salty 0.017 MSucrose 0.01 MSweetGlucose Sweet 0.08 MSodium saccharine Sweet 0.000023 MQuinine sulphate Bitter 0.000008 MCaffeine Bitter 0.0007 M
Odour compoundsCitral Lemon 0.000003 mg/lLimonene Lemon 0.1 mg/lButyric acid Rancid butter 0.009 mg/lBenzaldehyde Bitter almond 0.003 mg/lEthyl acetate Fruity 0.0036 mg/lMethyl salicylate Wintergreen 0.1 mg/lHydrogen sulphide Rotten eggs 0.00018 mg/lAmyl acetate Banana oil 0.039 mg/lSafrol Sassafras 0.005 mg/lEthyl mercaptan Rotten cabbage 0.00000066 mg/l
From Cardello (1998).
Properties of foods and processing theory 49

respiratory changes in fresh foods (Chapter 19) and changes in acidity or sweetnessduring food fermentations (Chapter 7). Fresh foods contain complex mixtures of volatilecompounds, which give characteristic flavours and aromas, some of which are detectableat extremely low concentrations (Table 1.15). These compounds may be lost duringprocessing, which reduces the intensity of flavour or reveals other flavour/aromacompounds. Volatile aroma compounds are also produced by the action of heat, ionisingradiation, oxidation or enzyme activity on proteins, fats and carbohydrates. Examplesinclude the Maillard reaction between amino acids and reducing sugars or carbonylgroups and the products of lipid degradation (Chapter 16), or hydrolysis of lipids to fattyacids and subsequent conversion to aldehydes, esters and alcohols. The perceived aromaof foods arises from complex combinations of many hundreds of compounds, some ofwhich act synergistically (Maruniak and MacKay-Sim, 1984). In addition, the perceivedflavour of foods is influenced by the rate at which flavour compounds are released duringchewing, and hence is closely associated with the texture of foods and the rate ofbreakdown of food structure during mastication (Clark, 1990). Research into flavourrelease is described by Wyeth and Kilcast (1991) and Plattig (1984) and more detaileddescriptions of the production of aroma compounds or loss of naturally occurring aromacompounds are given by Lindsay (1996) and in subsequent chapters.
1.6.3 ColourMethods to assess the colour and appearance of foods are described by MacDougall (1984).Many naturally occurring pigments are destroyed by heat processing, chemically altered bychanges in pH or oxidised during storage (Table 1.16). As a result the processed food maylose its characteristic colour and hence its value. Synthetic pigments (Appendix C) aremore stable to heat, light and changes in pH, and they are therefore added to retain thecolour of some processed foods. Details of changes to naturally occurring pigments aredescribed in Chapters 10–17. Maillard browning is an important cause of both desirablechanges in food colour (for example in baking or frying (Chapters 16 and 17), and in thedevelopment of off-colours (for example during canning and drying (Chapters 12 and 15)).
1.7 Effects of processing on nutritional properties
Many unit operations, especially those that do not involve heat, have little or no effect onthe nutritional quality of foods. Examples include mixing, cleaning, sorting, freeze dryingand pasteurisation. Unit operations that intentionally separate the components of foods(Chapters 3, 4 and 6) alter the nutritional quality of each fraction compared with the rawmaterial. Unintentional separation of water-soluble nutrients (minerals, water-solublevitamins and sugars) also occurs in some unit operations (for example blanching (Chapter10), and in drip losses from roast or frozen foods (Chapters 16 and 21)).
Heat processing is a major cause of changes to nutritional properties of foods. Forexample gelatinisation of starches and coagulation of proteins improve their digestibility,and anti-nutritional compounds (for example a trypsin inhibitor in legumes) aredestroyed. However, heat also destroys some types of heat-labile vitamin (Fig. 1.17),reduces the biological value of proteins (owing to destruction of amino acids or Maillardbrowning reactions) and promotes lipid oxidation. The effects of heat on proteins andlipids are described in detail by Mauron (1982) and Witting and Dimick (1982)respectively.
50 Food processing technology

Oxidation is a second important cause of nutritional changes to foods. This occurswhen food is exposed to air (for example in size reduction or hot-air drying (Chapters 4and 15)) or as a result of the action of heat or oxidative enzymes (for example peroxidaseor lipoxygenase). The main nutritional effects of oxidation are:
• the degeneration of lipids to hydroperoxides and subsequent reactions to form a widevariety of carbonyl compounds, hydroxy compounds and short chain fatty acids, andin frying oils to toxic compounds (Chapter 17)
• the destruction of oxygen-sensitive vitamins (Fig. 1.17 and Appendix A).
Changes to lipids are discussed by Zapsalis and Beck (1985) and a discussion of theproperties of vitamins and losses during processing is given by Bender (1978), Harris andKarmas (1975) and De Ritter (1982). Examples of vitamin losses caused by individualunit operations are described in subsequent chapters.
The importance of nutrient losses during processing depends on the nutritional valueof a particular food in the diet. Some foods (for example bread, potatoes and milk inWestern countries and rice or maize in Eastern and developing countries) are an
Table 1.16 Naturally occurring pigments in foods
Oil or Stability to the followingTypical water
Pigment source soluble Heat Light Oxygen pH change
Anthocyanins Fruits Water High High High Lowsoluble
Betalaines Beetroot Water Moderate High High Highsoluble
Bixin Seed coat Oil Moderate Low High –of Bixa soluble to loworellana
Canxanthin Oil Moderate Moderate Moderate Moderatesoluble
Caramel Heated Water High High High Highsugar soluble
Carotenes Leaves Oil Moderate Low Low Highsoluble to low
Chlorophylls Leaves Water High High High Lowsoluble
Cochineala Insect Water High High – Moderate(Dactylopius soluble to highcoccus)
Curcumin Turmeric Water Low Low Low –soluble
Norbixin See Bixin Water Moderate Low High –soluble to low
Oxymyoglobin Animals Water Low – High Lowsoluble
Polyphenols Tea leaf Water High High High Highsoluble
Quinones Roots, bark Water High Moderate – Moderatesoluble
Xanthophylls Fruits Water Moderate High High Lowsoluble
a As aluminium lake.From the data of Zapsalis and Beck (1985) and Coultate (1984).
Properties of foods and processing theory 51

important source of nutrients for large numbers of people. Vitamin losses are thereforemore significant in these foods than in those which either are eaten in small quantities orhave low concentrations of nutrients.
In industrialised countries, the majority of the population achieve an adequate supplyof nutrients from the mixture of foods that is eaten. Losses due to processing of onecomponent of the diet are therefore insignificant to the long-term health of an individual.In an example described by Bender (1987), complete meals which initially contained16.5�g of vitamin A lost 50% on canning and 100% after storage for 18 months.Although the losses appear to be significant, the original meal contained only 2% of therecommended daily intake (RDA), and the extent of loss is therefore of minorimportance. The same meal contained 9 mg of thiamin and lost 75% after 18 months’storage. The thiamin content is ten times the RDA, and adequate quantities thereforeremained. Possible exceptions are the special dietary needs of pre-term infants, pregnantwomen and the elderly. In these groups there may be either a special need for certainnutrients or a more restricted diet than normal. These special cases are discussed in detailby Watson (1986) and Francis (1986).
Reported vitamin losses during processing are included in subsequent chapters to givean indication of the severity of each unit operation. However, such data should be treatedwith caution. Variation in nutrient losses between cultivars or varieties can exceeddifferences caused by alternative methods of processing. Growth conditions, or handlingand preparation procedures prior to processing, also cause substantial variation in nutrientloss. Data on nutritional changes cannot be directly applied to individual commercialoperations, because of differences in ingredients, processing conditions and equipmentused by different manufacturers.
1.8 Food safety, good manufacturing practice and quality assurance
Traditionally, quality control systems were based on the inspection of a product atvarious points within a process, and rejection of any product that did not meet agreedstandards. This reactive approach to food quality focused mainly on end-product testing,which is now recognised to be a waste of resources (resources have already been spent onproducing the food by the time it is tested and rejection means a financial loss). A moreproactive preventative approach to food safety and quality management, termed ‘QualityAssurance’ was developed during the 1980s, based on the principles of GoodManufacturing Practice (GMP) (Anon., 1998). It aimed to ensure that quality and safety
Fig. 1.17 Stability of vitamins in foods.
52 Food processing technology

are maintained throughout a process and thus prevent product rejection and financiallosses.
The pressures for this development came from two sources: first, commercialpressures including:
• increasing competition between companies• the need to access expanding national and international food markets• product quality management systems required by major retailers.
These all required an effective food monitoring and control system to controlresources and ensure that safe, high quality products were consistently manufactured, andled to the concept of Total Quality Management (TQM). Second, new legislationdemanded systems that would both maintain quality and safety, and prove that a businessis in control of these. The initial quality assurance legislation (BS 5750/BS EN ISO 9000standards) has now been expanded to take all business operations into account. The aimof TQM is therefore for companies to define and understand all of their processes, toimplement controls, monitor performance and measure improvements. The standard BS7850 defines TQM as ‘management philosophy and company practices that aim toharness the human and material resources of an organisation in the most effective way toachieve the objectives of the organisation’. This concept takes into account separatestandards for production operations and new product development (BS EN ISO 9001),production facilities (BS EN ISO 9002), environmental and waste management (ISO14001, also Chapter 26), employment rights, health and safety (BS 8800), laboratorymanagement (EN 45000) as well as food quality and safety.
As part of a TQM programme, food manufacturers must also take into account therequirements of a food safety management system termed ‘HACCP’ (Hazard AnalysisCritical Control Point), which was developed by Codex Alimentarius. This provides thekey control measures needed to understand the mechanisms for producing safe food andthe basis to create production control systems to ensure product quality. A major shift inemphasis from national legislation to international legislation occurred in 1994, when aGATT2 agreement recommended acceptance of HACCP as the required standard for freeinternational movement of food. The WTO now evaluates both technical barriers to tradeand sanitary controls with reference to Codex HACCP standards (Mitchell, 1996).
More recently in the UK, the British Retail Consortium has issued a ‘TechnicalStandard for Companies Supplying Retailer Branded Food Products’, which is being usedby retailers as the definitive standard for suppliers, and forms the basis of their terms ofbusiness (Rose, 2000). It covers six key areas: HACCP systems, quality managementsystems, factory environmental standards, product control, process control and personnel,and is implemented through third-party inspection bodies (e.g. the European Food SafetyInspection Service (EFSIS)).
TQM is therefore broader than quality control, and is a management philosophy thatseeks to continually improve the effectiveness and competitiveness of the business as awhole. It is an integrated system which ensures that all areas of the business arecontrolled, to enable customers to consistently receive quality products that meet theirneeds and expectations. The approach requires collective responsibility and commitmentat all levels in a business, and can only be achieved through trusting workingrelationships and good communications. Quality management systems are usuallydeveloped with reference to an international standard or specific legislative standards
2. General Agreement on Tariffs and Trade, later replaced by the World Trade Organisation (WTO).
Properties of foods and processing theory 53

(e.g. 91/493 European standard for fisheries products). However, any reference standardis only a framework on which a company builds its own performance standards to meetthe requirements of the law, the customers and the company’s own requirements.
In outline, a TQM system covers the following areas:
• raw materials, purchasing and control (including agreed specifications, supplierauditing, raw material storage, stock control, traceability, inspection, investigation ofnon-conformity to specification)
• process control (including identification, verification and monitoring of critical controlpoints in a HACCP scheme, hygienic design of plant and layouts to minimise cross-contamination, cleaning schedules, recording of critical production data, samplingprocedures and contingency plans to cover safety issues)
• premises (including methods of construction to minimise contamination, maintenance,waste disposal)
• quality control (including product specifications and quality standards for non-safetyquality issues, monitoring and verification of quality before distribution)
• personnel (including training, personal hygiene, clothing and medical screening)• final product (including types and levels of inspection to determine conformity with
quality specifications, isolating non-conforming products, packaging checks, inspec-tion records, complaints monitoring systems)
• distribution (to maintain the product integrity throughout the chain, batch traceabilityand product recall systems).
Mann and Adebanjo (1997) and Rose (2000) have produced overviews of TQM, andDillon (1999) describes a practical approach to beginning TQM projects in smallerbusinesses.
A TQM system requires a company to have a level of organisation and managementthat enables it to meet the TQM objectives and this requires the company to:
• have a defined organisational structure• clearly allocate authority and division of responsibilities• define procedures• link the components of the system• prepare key documentation• allocate sufficient resources for implementation of the system (Dillon and Griffith,
1996).
Rose (2000) has emphasised the need for commitment by senior management toimplementation of a TQM system and the need for senior managers to review and updatethe effectiveness of systems that are in place. The component procedures for introducinga quality management system include:
• development of audit methods• procedures for corrective action• procedures for management review and• documentation of the system.
Effective implementation requires the combined use of all resources, includingpeople, and Dillon (1996) has emphasised that many systems fail because inadequateattention is paid to the staff who will implement the system. Audits are the regularsystematic collection and feedback of objective information by competent independentpersonnel. They are used for example to monitor suppliers’ ability to meet agreed
54 Food processing technology

requirements or to monitor production routines. They are an effective tool formonitoring the success of a quality system and are described in detail by Sayle (1998),Mortimer and Wallace (1998) and Dillon and Griffith (1997). The types of non-conformance with specifications, performance standards, customer requirements orlegislation for a particular operation in a factory department must be clearly definedand appropriate action agreed if a failure occurs. For example, if deviation is a legalissue, the appropriate action is to quarantine the product, or if it is deviation from acustomer requirement, the action may involve informing customer and sale at reducedprice.
Management review is an essential component of any system and managers mustconsider the feedback from the system and decide on appropriate action, using formalmeetings with standard agendas, actions and responsibilities. The need to manageinformation by document control ensures that documents are approved, issued and storedin agreed places in filing cabinets, computer diskettes or hard drives or on CD. Agreedreference codes, directory structures, storage procedures, archiving instructions andbackup mechanisms are essential. There is a hierarchy of documents, from manualsoutlining policy, procedures that link key activities, detailed work instructions and outputrecords which requires an organisation to prove that a system gives the necessary control.Document control rules therefore need to be agreed and put in place early in thedevelopment of a control system. Procedures for corrective action are needed to prevent arecurrence of any deficiencies within the system.
The benefits of a properly implemented TQM system are stated by Rose (2000) as:
• economic (more cost-effective production by ‘getting it right first time’, reduction inwasted materials, fewer customer complaints, improved machine efficiency andincreased manufacturing capacity)
• marketing (consistently meeting customer needs, increased customer confidence andsales)
• internal (improved staff morale, increased levels of communication, better trainedstaff and awareness/commitment to quality, improved management control andconfidence in the operation)
• legislative (demonstrating due diligence, providing evidence of commitment to qualityand ability to improve).
1.8.1 HACCPHazard analysis is ‘the identification of potentially hazardous ingredients, storageconditions, packaging, critical process points and relevant human factors which mayaffect product safety or quality’. HACCP enables potential hazards in a process to beidentified, assessed, and controlled or eliminated. It sets tolerances for hazards anddefines appropriate control measures, the frequency of their application, samplingprocedures, specific tests to be used and the criteria for product acceptance. The system isbased on monitoring of critical control points3 and the action to be taken when results ofmonitoring are outside the pre-set limits (Fig 1.18). HACCP is used throughout eachstage of a process, and includes raw materials, processing, storage and distribution. It canbe used for all potential hazards, including inadequate quality as well as safety, and can
3. These are processing factors of which a loss of control would result in an unacceptable food safety orquality risk.
Properties of foods and processing theory 55

identify areas of control where failure has not yet been experienced, making itparticularly useful for new operations.
Implementation of a HACCP scheme involves the following stages:
1. Produce a detailed flow diagram of the process, including production methods andschedules, preparation and transport of raw materials, in-process stock etc.,confirmed by a site visit.
2. Identify the essential characteristics of the product and its use and define the hazardsor potential hazards that could threaten the consumer or the product. Included in thisis the product formulation, handling procedures and storage conditions, packaging,expected customer handling and the target consumer groups.
3. Consider all stages in the process, including realistic process deviations, and identifycritical stages (critical control points (CCPs)) which must be controlled to assuresafety. The judgement of risk is made using one of three methods: probabilistic,comparative or pragmatic, and should be made by people who have a high degree ofexpertise and experience.
4. Devise target levels and critical limits for each CCP and produce effectiveprocedures to monitor them, to verify them and to implement corrective action.
Fig. 1.18 Critical control point decision tree.(From Fellows et al. (1995).)
56 Food processing technology

Monitoring may be by physical, microbiological or chemical tests, or by visual orsensory observations. All monitoring procedures should be recorded and they shouldalso include the location of the CCP, the frequency of monitoring and satisfactorycompliance criteria. Examples include cleaning procedures (what is cleaned, howand when it is cleaned, who cleans it and what with), temperatures of foods,processing conditions, recipe formulations, hygienic practices, opportunities forcross-contamination and workers’ illness or infections.
5. Establish documentation to record the HACCP system and the procedures needed toreview it.
Examples of HACCP applications are described by Dillon and Griffith (1996),Mortimer and Wallace (1998) and Fellows et al. (1995).
1.8.2 Hurdle technologyIn traditionally preserved foods, such as smoked fish or meat, jams and other preserves,there are a combination of factors that ensure microbiological safety and stability of thefood, and thus enable it to be preserved. In smoked products for example, thiscombination includes heat, reduced moisture content and anti-microbial chemicalsdeposited from the smoke onto the surface of the food. Some smoked foods may also bedipped or soaked in brine or rubbed with salt before smoking, to impregnate the fleshwith salt and thus add a further preservative mechanism. Smoked products may also bechilled or packed in modified atmospheres to further extend the shelf life. In jams andother fruit preserves, the combined factors are heat, a high solids content (reduced wateractivity (Section 1.5)), and high acidity. These preservative factors also stronglyinfluence the sensory characteristics of the product and contribute to importantdifferences in flavour, texture or colour between different products. In vegetablefermentation (Chapter 7), the desired product quality and microbial stability are achievedby a sequence of factors that arise at different stages in the fermentation process: theaddition of salt selects the initial microbial population which uses up the availableoxygen in the brine. This reduces the redox potential and inhibits the growth of aerobicspoilage micro-organisms and favours the selection of lactic acid bacteria. These thenacidify the product and stabilise it. Further treatments may include pasteurisation(Chapter 11) and packaging (Chapter 24) to extend the shelf life and facilitatedistribution.
The demand by consumers for high quality foods having ‘fresh’ or ‘natural’characteristics, that require a minimum amount of preparation has led to the developmentof ready-to-eat and convenience foods that are preserved using mild technologies. Themain preservation technique is refrigeration (Chapter 19), but because of the difficulty inmaintaining sufficiently low temperatures throughout the production, distribution andstorage chain, additional barriers (or ‘hurdles’) are required to control the growth ofspoilage or pathogenic micro-organisms. The concept of combining several factors topreserve foods has been developed by Leistner (1995) and others into the Hurdle effect(each factor is a hurdle that micro-organisms must overcome). This in turn has led to theapplication of Hurdle Technology,4 where an understanding of the complex interactionsof temperature, water activity, pH, chemical preservatives, etc. (Table 1.17) is used todesign a series of hurdles that ensure microbiological safety of processed foods. The
4. Also known as ‘combined processes’, ‘combination preservation’ or ‘combination techniques’.
Properties of foods and processing theory 57

hurdles are also used to improve the quality of foods and the economic properties (forexample, the weight of water that can be added to a food, consistent with its microbialstability). To be successful, the hurdles must take into account the initial numbers andtypes of micro-organisms that are likely to be present in the food. The hurdles that areselected should be ‘high enough’ so that the anticipated numbers of these micro-organisms cannot overcome them. However, the same hurdles that satisfactorily preservea food when it is properly prepared (Fig. 1.19a), are overcome by a larger initialpopulation of micro-organisms (Fig. 1.19b), when for example raw materials are notadequately cleaned (Chapter 3). In this example, the main hurdles are low water activityand chemical preservatives in the product, with storage temperature, pH and redoxpotential having a smaller effect. Blanching vegetables or fruits (Chapter 10) has asimilar effect in reducing initial numbers of micro-organisms before freezing or drying. If
Table 1.17 Examples of hurdles used to preserve foods
Type of hurdle Examples Chapter
Physicalhurdles
Aseptic packagingElectromagnetic energy (microwave, radio frequency, pulsedmagnetic fields, high electric fields)High temperatures (blanching, pasteurisation, sterilisation,evaporation, extrusion, baking, frying)Ionising radiationLow temperatures (chilling, freezing)Modified atmospheresPackaging films (including active packaging, edible coatings)Photodynamic inactivationUltra-high pressuresUltrasonicationUltraviolet radiation
12, 259, 18
10–17
819, 2120249999
Physico-chemicalhurdles
Carbon dioxideEthanolLactic acidLactoperoxidaseLow pHLow redox potentialLow water activityMaillard reaction productsOrganic acidsOxygenOzonePhenolsPhosphatesSaltSmokingSodium nitrite/nitrateSodium or potassium sulphiteSpices and herbsSurface treatment agents
20777
15–16, 221, 167
Microbiallyderivedhurdles
AntibioticsBacteriocinsCompetitive floraProtective cultures
77
Chapter numbers indicate sources of more detailed information.Adapted from Leistner and Gorris (1995).
58 Food processing technology
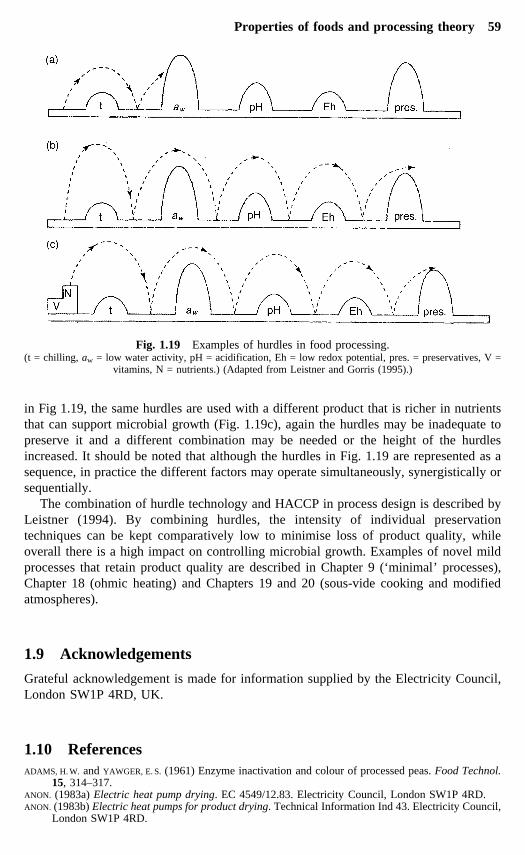
in Fig 1.19, the same hurdles are used with a different product that is richer in nutrientsthat can support microbial growth (Fig. 1.19c), again the hurdles may be inadequate topreserve it and a different combination may be needed or the height of the hurdlesincreased. It should be noted that although the hurdles in Fig. 1.19 are represented as asequence, in practice the different factors may operate simultaneously, synergistically orsequentially.
The combination of hurdle technology and HACCP in process design is described byLeistner (1994). By combining hurdles, the intensity of individual preservationtechniques can be kept comparatively low to minimise loss of product quality, whileoverall there is a high impact on controlling microbial growth. Examples of novel mildprocesses that retain product quality are described in Chapter 9 (‘minimal’ processes),Chapter 18 (ohmic heating) and Chapters 19 and 20 (sous-vide cooking and modifiedatmospheres).
1.9 Acknowledgements
Grateful acknowledgement is made for information supplied by the Electricity Council,London SW1P 4RD, UK.
1.10 ReferencesADAMS, H. W. and YAWGER, E. S. (1961) Enzyme inactivation and colour of processed peas. Food Technol.
15, 314–317.ANON. (1983a) Electric heat pump drying. EC 4549/12.83. Electricity Council, London SW1P 4RD.ANON. (1983b) Electric heat pumps for product drying. Technical Information Ind 43. Electricity Council,
London SW1P 4RD.
Fig. 1.19 Examples of hurdles in food processing.(t = chilling, aw = low water activity, pH = acidification, Eh = low redox potential, pres. = preservatives, V =
vitamins, N = nutrients.) (Adapted from Leistner and Gorris (1995).)
Properties of foods and processing theory 59

ANON. (1983c) Heat recovery for industry. Technical Information Ind 18. Electricity Council, LondonSW1P 4RD.
ANON. (1983d) Air knife drying. EC 4401/3.83. Electricity Council, London SW1P 4RD.ANON. (1996) The Pearson Square – common calculations simplified. Food Chain, 17, (March), from
ITDG Broughton Hall, Broughton on Dunsmore, Rugby CV23 9QZ, UK.ANON. (1998) Food and Drink Good Manufacturing Practice. Institute of Food Science and Technology
(IFST), Cambridge Court, London W6 7NJ, UK.BEEVERS, A. (1985) How to save energy. Food Manuf. 39, 41–43.BENDER, A. E. (1978) Food Processing and Nutrition. Academic Press, London, pp. 3–57.BENDER, A. E. (1987) The nutritional aspects of food processing. In: A. Turner (ed.) Food Technology
International Europe. Sterling Publications International, London, pp. 273–275.VAN DEN BERG, C. (1986) Water activity. In: D. MacCarthy (ed.) Concentration and Drying of Foods.
Elsevier Applied Science, Barking, Essex, pp. 11–36.BLANSHARD, J. M. V. (1995) The glass transition, its nature and significance in food processing. In: S. T
Beckett (ed.) Physico-Chemical Aspects of Food Processing. Blackie Academic and Professional,London, pp. 17–48.
BOARDMAN, J. (1986) Effecting efficient energy usage. Food Process. May 29–31.BOURNE, M. C. (1978) Texture profile analysis. Food Technol. 7, 62.BOURNE, M. C. (1982) Food Texture and Viscosity. Academic Press, New York.BRENNAN, J. G. (1984) Texture perception and measurement. In: J.R. Piggott (ed.) Sensory Analysis of
Foods. Elsevier Applied Science, London, pp. 59–92.BRENNAN, J. G., BUTTERS, J. R., COWELL, N. D. and LILLEY, A. E. V. (1990) Food Engineering Operations, 3rd
edn. Elsevier Applied Science, London.BRENNDORFER, B., KENNEDY, L., OSWIN-BATEMAN, C. O. and TRIM, D. S. (1985) Solar Dryers, Commonwealth
Science Council, Commonwealth Secretariat, London SW1Y 5HX.CARDELLO, A. V. (1998) Perception of food quality. In: I. A. Taub and R. P. Singh (eds) Food Storage
Stability. CRC Press, Boca Raton, FL, pp. 1–38.CLARK, R. C. (1990) Flavour and texture factors in model gel systems. In: A. Turner (ed.) Food Technology
International Europe. Sterling Publications International, London, pp. 271–277.COULTATE, T. P. (1984) Food, the Chemistry of its Components, Royal Society of Chemistry, London, pp.
102–129.DELASHMIT, R., DOUGHERTY, M. and ROBE, K. (1983) Spiral heat exchanger reuses 79% of ‘lost’ heat. Food
Process. (USA), October 106–107.DE RITTER, E. (1982) Effect of processing on nutrient content of food: vitamins. In: M. Rechcigl (ed.)
Handbook of Nutritive Value of Processed Food, Vol. 1. CRC Press, Boca Raton, Florida, pp. 473–510.
DILLON, M. (1996) Role of Training in Business Development. NFI Conference, Washington.DILLON, M. (1999) Cost Effective Food Control. The Global Hygiene Forum, Helsinki.DILLON, M. and GRIFFITH, C. (1996) How to HACCP, 2nd edn. MD Associates, 32a Hainton Ave., Grimsby
DN32 9BB, UK.DILLON, M. and GRIFFITH, C. (1997) How to Audit, Verifying Food Control Systems. MD Associates,
Grimsby.EARLE, R. L. (1983) Unit Operations in Food Processing, 2nd edn. Pergamon Press, Oxford, pp. 24–38,
46–63.VON ELBE, J. H., MAING, I. Y. and AMUNDSON, C. H. (1974) Colour stability of betanin. J. Food Sci. 39, 334–
337.ESSELEN, W. B. and ANDERSON, A. A. (1956) Food Res. 21, 322.FARRALL, A. W. (1979) Food Engineering Systems, Vol. 2. AVI, Westport, Connecticut, pp. 117–128.FELLICOTTI, E. and ESSELEN, W. B. (1957) Thermal destruction rates of thiamine in pureed meats and
vegetables. Food Technol. 11, 77–84.FELLOWS, P. J., AXTELL, B. L. and DILLON, M. (1995) Quality assurance for small scale rural food industries.
FAO Agricultural Services Bulletin 117, FAO, Rome, Italy.FENNEMA, O. R. (1996) Water and ice. In: O. R. Fennema (ed.) Food Chemistry, 3rd edn. Marcel Dekker,
New York, pp. 17–94.FLINK, J.M. (1977) Energy analysis in dehydration processes. Food Technol. 31 (3), 77.FRANCIS, D. (1986) Nutrition for Children, Blackwell, Oxford.GREEN, R. H. (1982) Energy performance of heat pumps and continuous dryers. In: J. Ashworth (ed.)
Proceedings of the Third International Drying Symposium. Drying Research Ltd, Wolverhampton.GUPTA, S. M., EL-BISI, H. M. and FRANCIS, F. J. (1964) Kinetics of the thermal degradation of chlorophyll in
spinach puree. J. Food Sci. 29, 379.HARRIS, R. S. and KARMAS, E. (1975) Nutritional Evaluation of Food Processing, 2nd edn. AVI, Wesport,
Connecticut.HAYHURST, A. N. (1997) Introduction to heat transfer. In: P.J. Fryer, D.L. Pyle and C.D. Rielly (eds)
Chemical Engineering for the Food Processing Industry, Blackie Academic and Professional,London, pp. 105–152.
60 Food processing technology

HENDERSON, S. M. and PERRY, R. L. (1955) Agricultural Process Engineering. John Wiley, New York.JACKSON, A.T. and LAMB, J. (1981) Calculations in Food and Chemical Engineering. Macmillan, London,
pp. 1–57.JOWITT, R., ESCHER, F., HALLSTROM, B., MEFFERT, H. F. Th., SPIESS, W. and VOS, G. (1983) Physical Properties of
Foods. Applied Science, London.KAREL, M. (1975) Water activity and food preservation. In: O. R. Fennema (ed.) Principles of Food
Science, Part 2. Marcel Dekker, New York, pp. 237–263.KEFFORD, J. F. (1982) Energy consumption in different food processing technologies. CSIRO Food Res. Q.
42, 60–64.KILCAST, D. (1999) Sensory techniques to study food texture. In: A. J. Rosenthal (ed.) Food Texture. Aspen
Publishers, Gaithersburg, MA, pp. 30–64.KRAMER, A. and SZCZESNIAK, A. S. (1973) (eds) Texture Measurement of Foods. D. Reidel, Dordrecht.KUNII, D. and LEVENSPIEL, O. (1969) Fluidization Engineering. John Wiley, New York.LAWLESS, H. T. and HEYMAN, H. (1998) Sensory Evaluation of Food – Principles and Practice. Aspen
Publishers, Gaithersburg, MA, pp. 379–405.LEISTNER, L. (1994) In: L. Leistner and L. G. M. Gorris (eds) Food Preservation by Combined Processes,
Final Report of FLAIR Concerted Action No 7, Subgroup B, (EUR 15776 EN) Commission of theEuropean Community, Brussels, Belgium, pp. 25.
LEISTNER, L. (1995) Principle and applications of Hurdle Technology. In: G. W. Gould (ed.) New Methodsof Food Preservation, Blackie Academic and Professional, London, pp. 1–21.
LEISTNER, L. and GORRIS, L. G. M. (1995) Food Preservation by Hurdle Technology, Trends in Food Scienceand Technology, 6, 41–46.
LENIGER, H. A. and BEVERLOO, W. A. (1987) Food Process Engineering. D. Reidel, Dordrecht.LEWIS, M. J. (1990) Physical Properties of Foods and Food Processing Systems. Woodhead Publishing,
Cambridge, UK.LINDSAY, R. C. (1996) Flavours. In: O. R. Fennema (ed.) Food Chemistry, 3rd edn. Marcel Dekker, New
York, pp. 723–765.LONCIN, M. and MERSON, R. L. (1979) Food engineering – Principles and Selected Applications. Academic
Press, New York.MACDOUGALL, D. B. (1984) Colour vision and appearance measurement. In: J. R. Piggott (ed.) Sensory
Analysis of Foods. Elsevier Applied Science, London, pp. 93–116.MANN, R. and ADEBANJO, O. (1997). Business Excellence in Food and Drink Industry: Practical ways to
improve performance. Leatherhead Food R.A.MARUNIAK, J. A. and MACKAY-SIM, A. (1984). In: J. R. Piggott (ed.) Sensory Analysis of Foods. Elsevier
Applied Science, London, pp. 23–58.MAURON, J. (1982). Effect of processing on nutritive value of food: protein. In M. Rechcigl (ed.)
Handbook of Nutritive Value of Processed Foods, Vol. 1. CRC Press, Boca Raton, Florida, pp.429–471.
MILSON, A. and KIRK D. (1980) Principles of Design and Operation of Catering Equipment. Ellis Horwood,Chichester.
MITCHELL, R. T. (1996) HACCP – An International Overview. Flair-Flow Europe, Cardiff Institute ofHigher Education.
MOHSENIN, N. N. (1970) Physical Properties of Plant and Animal Materials, Vol. 1 Structure, physicalcharacteristics and mechanical properties. Gordon and Breach, London.
MOHSENIN, N. N. (1980) Thermal Properties of Foods and Agricultural Materials. Gordon and Breach,London.
MORTIMER, S. and WALLACE, C. (1998) HACCP – A Practical Approach, 2nd edn. Aspen Publishers,Gaithersburg, MA.
NEDDERMAN, R. M. (1997) Newtonian fluid mechanics. In: P. J. Fryer, D. L Pyle and C. D. Rielly (eds)Chemical Engineering for the Food Processing Industry, Blackie Academic and Professional,London, pp. 63–104.
PELEG, M. (1983) Physical characteristics of food powders. In: M. Peleg and E. B. Bagley (eds) PhysicalProperties of Foods. AVI, Westport, Connecticut.
PELEG, M. and BAGLEY, E. B. (1983) Physical Properties of Foods. AVI, Westport, Connecticut.PLATTIG, K. H. (1984) The sense of taste. In: J. R. Piggott (ed.) Sensory Analysis of Foods, Elsevier Applied
Science, London, pp. 1–22.POLLEY, S. L., SNYDER, O. P. and KOTNOUR, P. (1980) A compilation of thermal properties of foods. Food
Technol. 11, 76.PONTING, J. D., SANSHUCK, D. W. and BREKKE, J. E. (1960) Color measurement and deterioration in grape and
berry juices and concentrates. J. Food Sci. 25, 471–478.PRENTICE, J. H. (1984) Measurements in the Rheology of Foodstuffs. Elsevier Applied Science, London.RAHMAN, M. S. (1999) Glass transition and other structural changes in foods. In: M. S. Rahman (ed.)
Handbook of Food Preservation. Marcel Dekker, New York, pp. 75–94.RIELLY, C. D. (1997) Food rheology. In: P. J. Fryer, D. L. Pyle and C. D. Rielly (eds) Chemical Engineering
for the Food Processing Industry, Blackie Academic and Professional, London, pp. 195–233.
Properties of foods and processing theory 61

ROSE, D. (2000) Total quality management. In: M. Stringer and C. Dennis (eds) Chilled Foods, 2nd edn.Ellis Horwood, Chichester, ch. 14.
ROSENTHAL, A. J. (1999) Relation between instrumental and sensory measures of food texture. In: A.J.Rosenthal (ed.) Food Texture, Aspen Publishers, Gaithersburg, MA, pp. 1–17.
SAYLE, A. J. (1988) Management Audits: The Assessment of Quality Management Systems, 2nd edn. AllanJ. Sayle Ltd.
SENHAJI, F. A. and BIMBENET, J. J. (1984) Energy saving in drying biological materials. In: B. M. McKenna(ed.) Engineering and Food. Elsevier Applied Science, Barking, Essex, pp. 947–954.
SHERMAN, P. (1976) The textural characteristics of dairy products. In: J. M. De Man, P. W. Voisey, V. F.Rasper and D. W. Stanley (eds) Rheology and Texture in Food Quality. AVI, Westport,Connecticut, pp. 382–404.
SHERMAN, P. (1979) (ed.) Food Texture and Rheology. Academic Press, London.STANLEY, D. W. and TUNG, M. A. (1976) Microstructure of food and its relation to texture. In: J. M. De Man,
P. W. Voisey, V. F. Rasper and D. W. Stanley (eds) Rheology and Texture in Food Quality. AVI,Westport, Connecticut, pp. 28–78.
STUMBO, C. R. (1973) Thermobacteriology in Food Processing 2nd edn. Academic Press, New York.SZCZESNIAK, A. S. (1963) Classification of textural characteristics. J. Food Sci. 28, 385–389.SZCZESNIAK, A. S. (1983) Physical properties of foods: what they are and their relation to other food
properties. In: M. Peleg and E. B. Bagley (eds) Physical Properties of Foods. AVI, Westport,Connecticut, pp. 1–41.
TAIRA, H., TAIRA, H. and SUKURAI, Y. (1966) Studies on amino acid contents of processed soybean, Part 8.Jpn. J. Nutr. Food 18, 359.
TOLEDO, R. T. (1999) Fundamentals of Food Process Engineering, 2nd edn. Aspen Publishers, Aspen, MA.TROLLER, J. A. and CHRISTIAN, J. H. B. (1978) Water Activity and Food. Academic Press, London.WATSON, R. R. (1986) Nutrition for the Aged. CRC Press, Boca Raton, Florida.WELLS, R. D. and SWIENTEK, R. J. (1983) Computerized energy management saves $1.4 million/yr in fuel.
Food Process. (USA) January 96–98.WHITAKER, J. R. (1972) Principles of Enzymology for the Food Sciences. Marcel Dekker, New York.WHITMAN, W. E., CRAWFORD, A. G. and ELSEN, C. R. (1981) Energy Use in the Food Manufacturing Industry,
Final Report to the Commission of the European Communities, No. EUR 7073 en. Commission ofthe European Communities, Brussels.
WITTING, L. A. and DIMICK, P. S. (1982) Effects of processing on food lipids. In: M. Rechcigl (ed.) Handbookof Nutritive Value of Processed Food, Vol. 1. CRC Press, Boca Raton, Florida, pp. 403–428.
WOODAMS, E. E. and NOWREY, J. E. (1968) Literature values of thermal conductivity of foods. Food Technol.22 (4), 150–158.
WYETH, L. and KILCAST, D. (1991) Sensory analysis technique and flavour release. In: A. Turner (ed.) FoodTechnology International Europe, Sterling Publications International, London, pp. 239–242.
ZAPSALIS, C. and BECK, R. A. (1985) Food Chemistry and Nutritional Biochemistry. John Wiley, New York,pp. 549–579, 415–504.
62 Food processing technology