Embed Size (px)
Citation preview

Part 6: Templates and Forms
Overview
In this Part This Part covers the following topics
Topic See Page
Section 1: Planning and Set Up Templates 6-1-1
Section 2: Forms for STEPS Field Work 6-2-1
Section 3: Reporting Templates (Fact Sheet, Data Book
and Country Report Templates)
6-3-1


Part 6: Templates and Forms 6-1-1
Section 1: Planning and Set Up Templates WHO STEPS Surveillance
Last Updated: 26 January 2017
Section 1: Planning and Set Up Templates
Overview
Introduction This section includes some document templates that can be used during the
stage that involves planning and preparing a STEPS survey.
Intended
audience This section is primarily designed to be used by those fulfilling the following
roles:
• STEPS Survey Coordinator
• STEPS Coordinating Committee
In this section This section contains the following topics.
Topic See Page
STEPS Implementation Plan 6-1-2
Budget Template 6-1-7
Ethical Approval Form 6-1-10

Part 6: Templates and Forms 6-1-2
Section 1: Planning and Set Up Templates WHO STEPS Surveillance
Last Updated: 26 January 2017
STEPS Implementation Plan
Executive Summary
Introduction
Current
situation
Goals
Scope and
methods
Resources
Budget
Current Situation
Introduction
Previous NCD
risk factor
surveys
Specify if an NCD risk factor survey has already been conducted in this
country.
Data
availability Specify NCD risk factor data availability in this country.
Infrastructure
and capacity Specify if there is already an infrastructure (human capacity, equipment,
other) on which STEPS could be built.
Rationale Specify the rationale for conducting NCD risk factor surveillance. (See Part 1,
Section 1, Rationale for Surveillance).

Part 6: Templates and Forms 6-1-3
Section 1: Planning and Set Up Templates WHO STEPS Surveillance
Last Updated: 26 January 2017
Goals and Objectives
Introduction
Goals Identify the planned goals or use for the information gathered. For example,
as a contribution to ongoing data collection to:
• Describe the current levels of risk factors for NCDs in this population
• Track the direction and magnitude of trends in risk factors
• Plan or evaluate a health promotion or preventive campaign
• Collect data from which to predict likely future demands for health services.
Objectives Specify objectives that support gathering 'essential' information only.
Scope and Methods
Introduction
Overview of
scope Specify the scope of the survey to be conducted over time, ie Step 1, Step 2
and Step 3, plus coverage of core, expanded and optional items.
Geographical
coverage Identify geographical coverage.
Sampling Identify the sample size and sample frame that will be used. Describe the
sampling methodology.
Timeframe Describe the broad timeframes.
Sustainability
and future
surveys
Specify if STEPS sustainability can be assured and plans for future surveys.
Part 6: Templates and Forms 6-1-4
Section 1: Planning and Set Up Templates WHO STEPS Surveillance
Last Updated: 26 January 2017
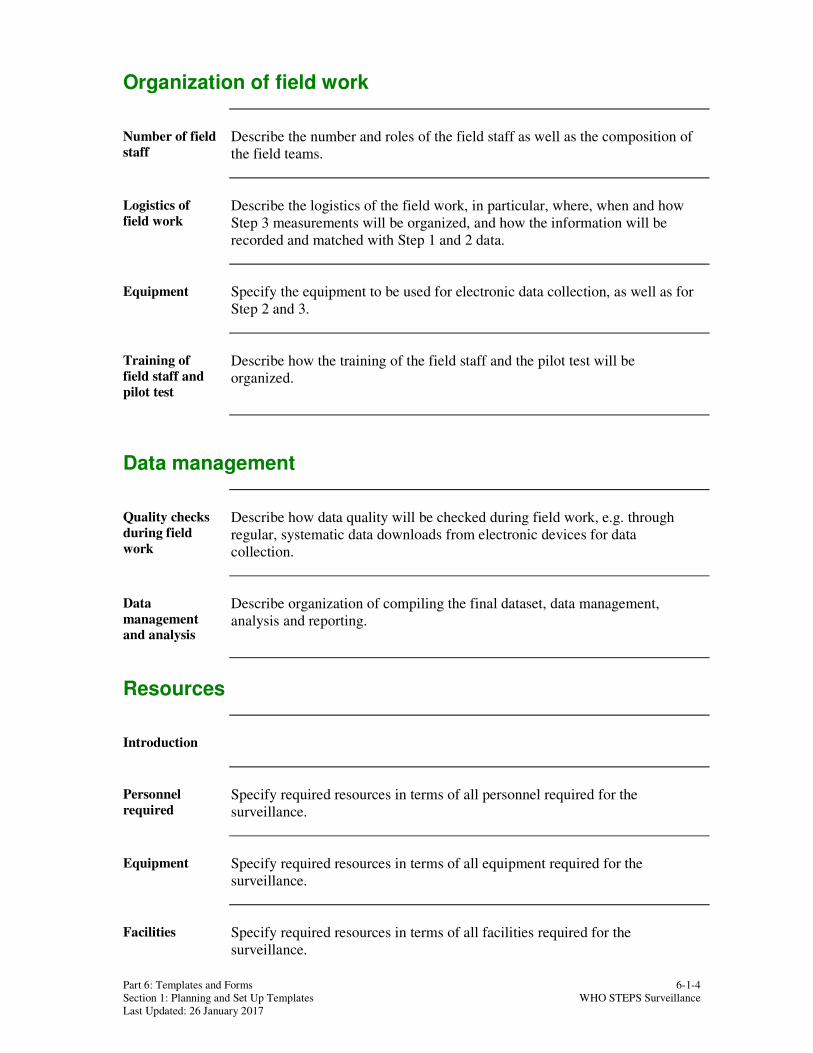
Organization of field work
Number of field
staff Describe the number and roles of the field staff as well as the composition of
the field teams.
Logistics of
field work Describe the logistics of the field work, in particular, where, when and how
Step 3 measurements will be organized, and how the information will be
recorded and matched with Step 1 and 2 data.
Equipment Specify the equipment to be used for electronic data collection, as well as for
Step 2 and 3.
Training of
field staff and
pilot test
Describe how the training of the field staff and the pilot test will be
organized.
Data management
Quality checks
during field
work
Describe how data quality will be checked during field work, e.g. through
regular, systematic data downloads from electronic devices for data
collection.
Data
management
and analysis
Describe organization of compiling the final dataset, data management,
analysis and reporting.
Resources
Introduction
Personnel
required Specify required resources in terms of all personnel required for the
surveillance.
Equipment Specify required resources in terms of all equipment required for the
surveillance.
Facilities Specify required resources in terms of all facilities required for the
surveillance.

Part 6: Templates and Forms 6-1-5
Section 1: Planning and Set Up Templates WHO STEPS Surveillance
Last Updated: 26 January 2017
Resources
already
committed
Describe resources that have already been committed or which are expected,
including support from WHO.
Resources
required from
other
organizations
Specify resources required from other organizations involved.
Action Plan
Introduction
Plan Provide a chart of the main tasks with estimated start dates and timeframes
for completion of each phase.
Communication Strategy and Publicity
Introduction
Publicity plan Specify methods for informing and involving community leaders and
community groups in the STEPS survey project.

Part 6: Templates and Forms 6-1-6
Section 1: Planning and Set Up Templates WHO STEPS Surveillance
Last Updated: 26 January 2017
Reporting and Disseminating Results
Introduction
Reporting Describe to whom and how the results will be reported and disseminated.
Budget
Introduction
Budget Provide a detailed budget that includes:
• total funds required for each year planned to implement all STEPS activities
as identified in the scope,
• source of funds, and
• funding gap.
Item USD

Part 6: Templates and Forms 6-1-7
Section 1: Planning and Set Up Templates WHO STEPS Surveillance
Last Updated: 26 January 2017
Budget Template
Budget
template The items and subline items that should be covered in the calculation of a
realistic and detailed budget are listed in the Budget Template below.
However, items or subline items may need to be added or removed as the
template is adapted to the local context.
An excel tool with integrated formula and examples is available on the WHO
STEPS website, and on request from the WHO STEPS team.
Use of the
template For each subline item, the following information should be listed in a table:
• quantity or number required (units)
• unit cost (in local currency)
• unit cost (converted to USD)
• total cost (in USD)
• responsible organization
• comments.
Phase 1 – STEPS Planning and Preparation
Line item Subline item Cost
Personnel
Preparation of the STEPS implementation plan
Sample design development
Adaptation of the STEPS Instrument and testing
STEPS
Implementation
workshop (3 days) or
planning meetings
Transportation costs
Accommodation (for out-of-town participants)
Venue
Food/refreshments
Audio-visual equipment
Supplies and stationary
Supplies and services Translation costs
Communication costs
Subtotal
Phase 2 – STEPS Field Work
Personnel
Trainers
IT specialist/Data Manager
Translators if required during the training
Salary or per diem for interviewers (including mapping
and listing, and data collection)
Salary or per diem for field team supervisors (including
mapping and listing, and data collection)
Salary or per diem for Step 3 data collectors (blood
testing) and lab technician (urine testing)
Honoraria for field guides or village councilors
Salary or per diem for drivers
Salary or per diem for additional staff hired for the survey

Part 6: Templates and Forms 6-1-8
Section 1: Planning and Set Up Templates WHO STEPS Surveillance
Last Updated: 26 January 2017
Phase 2 – STEPS Field Work, continued
Line item Subline item Cost
Data collector’s
training
Transportation costs for training
Venue of the training
Accommodation of the training participants
Meals and refreshments during the training
Photocopying/printing of training materials, forms for
field work and show-cards
Transportation
Transportation costs (bus, train, planes etc.)
Vehicle Rental for the household mapping and listing
Vehicle Rental for the pretest
Vehicle Rental for the full survey data collection - Field
Teams
Vehicle Rental for the full survey data collection -
Monitoring
Petrol
Survey equipment
Android devices for data collection with cables
External battery packs
Laptops for data checks
Carry bags for equipment
Devices for height and weight measurement
Constant tension tape
Digital blood pressure monitor
Devices for blood testing
Test strips for blood testing
Lancets, capillary tubes for collection of the right
amount of blood, cotton balls, gloves, disposable
containers
Containers for urine samples
Carrier boxes for transport of urine samples
Spare batteries for equipment
Transport of urine samples to laboratory
Additional costs for
urine analysis
Urine sample analysis

Part 6: Templates and Forms 6-1-9
Section 1: Planning and Set Up Templates WHO STEPS Surveillance
Last Updated: 26 January 2017
Line item Subline item Cost
Phase 3 – STEPS Data Management, Analysis and Report writing
Personnel
Trainers
IT specialist/Data Manager and Analysis Team
Technical focal points for report writing and proof reading
Layout of the report
Translators
Data analysis and
reporting workshop
Transportation costs for workshop
Venue of the workshop
Accommodation of the workshop participants
Meals and refreshments during the workshop
Supplies and stationary
Data dissemination
Report/Fact Sheet layout and printing
Translation of the Fact Sheet and Report
Costs related to an official Fact Sheet/release event
Subtotal
Phase 4 – Application and Program Planning Workshop (Data to Action)
Line item Subline item Cost
Personnel Workshop organizers
Workshop participants
Application and
Program Planning
Workshop
Transportation costs for workshop
Venue of the workshop
Accommodation of the workshop participants
Meals and refreshments during the workshop
Supplies and stationary
Communication costs
Workshop report printing and layout
Subtotal
GRAND TOTAL

Part 6: Templates and Forms 6-1-10
Section 1: Planning and Set Up Templates WHO STEPS Surveillance
Last Updated: 26 January 2017
Ethical Approval Form
General Information
Introduction
Survey tile The title of the proposed survey is:
[Country name] STEPS NCD Risk Factor Survey.
Key personnel A STEPS coordinating committee has been set up to oversee and manage the
planning, preparation and implantation of the proposed survey and includes
the following people.
Name Organization and qualifications
Dates The proposed survey dates are:
Phase Dates
Start Date
Completion Date
Survey duration (including planning,
field work, analysis and reporting)
6 - 9 months

Part 6: Templates and Forms 6-1-11
Section 1: Planning and Set Up Templates WHO STEPS Surveillance
Last Updated: 26 January 2017
Scientific Assessment
Introduction
Scientific basis
Summary of
report

Part 6: Templates and Forms 6-1-12
Section 1: Planning and Set Up Templates WHO STEPS Surveillance
Last Updated: 26 January 2017
Survey Scope
Introduction
Goals Identify the planned goals or use for the information gathered. For example,
as a contribution to ongoing data collection to:
• Describe the current levels of risk factors for NCDs in this population
• Track the direction and magnitude of trends in risk factors
• Plan or evaluate a health promotion or preventive campaign
• Collect data from which to predict likely future demands for health services
Objectives Specify objectives that support gathering 'essential' information only.
Overview of
scope Specify the scope of survey to be conducted i.e. Step 1, Step 2 and Step 3,
plus coverage of core, expanded and optional items.
Sampling Identify the sample size and sample frame that will be used. Describe the
sampling methodology.
Geographical
coverage Identify geographical coverage of the survey.
Resources Describe resources that:
• are required,
• have already been committed, and
• are expected, including support from WHO.
Cultural/ethical
issues Describe any aspects of the survey that might raise specific cultural or ethical
issues.
Reporting and
use of results Describe:
• To whom and how the results will be reported and disseminated;
• Any restrictions on results;
• Confidentiality of personal identification information;
• Use of results once the survey is complete;
• Methods for informing and involving community leaders and community
groups in the STEPS survey project.
Continued on next page

Part 6: Templates and Forms 6-1-13
Section 1: Planning and Set Up Templates WHO STEPS Surveillance
Last Updated: 26 January 2017
Survey Scope, Continued
Budget Provide a detailed budget that includes:
• total funds required for each year planned to implement all STEPS activities
as identified in the Scope;
• source of funds;
• funding gap.
Item USD

Part 6: Templates and Forms 6-1-14
Section 1: Planning and Set Up Templates WHO STEPS Surveillance
Last Updated: 26 January 2017
Declarations
Introduction
Declaration by
principal
investigator
The information supplied in this application is, to the best of my knowledge
and belief, accurate. I have considered the ethical issues involved in this
research and believe that I have adequately addressed them in this application.
I understand that if the protocol for this research changes in any way I must
inform the Research Ethics Review Committee.
Name:
Signature:
Date:
Declaration by
head of
department
I have read the application and believe it to be scientifically and ethically
sound. I approve the research design. I give my consent for the application
to be forwarded to the Ethics Committee.
Name:
Signature:
Date:
Note: Where the head of department is also one of the investigators, the head
of department declaration must be signed by the appropriate Dean, or relevant
senior officer.

Part 6: Templates and Forms 6-2-1
Section 2: Interview, Blood Collection and Data Entry Forms WHO STEPS Surveillance
Last Updated: 9 February 2017
Section 2: Forms for STEPS Field Work
Overview
Introduction This section includes some document templates that can be used during the
STEPS Field Work.
In this section This section contains the following forms for use during the survey.
Topic See Page
Notification of WHO STEPS Survey Visit 6-2-2
Script for Data Collectors 6-2-3
Interview Tracking Form 6-2-4
Participant Information Form (Step 1, 2 and 3) 6-2-5
Consent Form 1 (Steps 1 and 2) 6-2-8
Consent Form 2 (Step 3) 6-2-9
Participant Feedback Form (Step 2) 6-2-10
Participant Feedback Form (Step 3) 6-2-11
BMI Classification Chart 6-2-13
Step 3 Appointment Card 6-2-14
Instructions for Spot Urine Collection (Step 3) 6-2-15
Fasting Instructions (Step 3) 6-2-17
Step 3 Registration Form 6-2-18
Part 6: Templates and Forms 6-2-2
Section 2: Interview, Blood Collection and Data Entry Forms WHO STEPS Surveillance
Last Updated: 9 February 2017
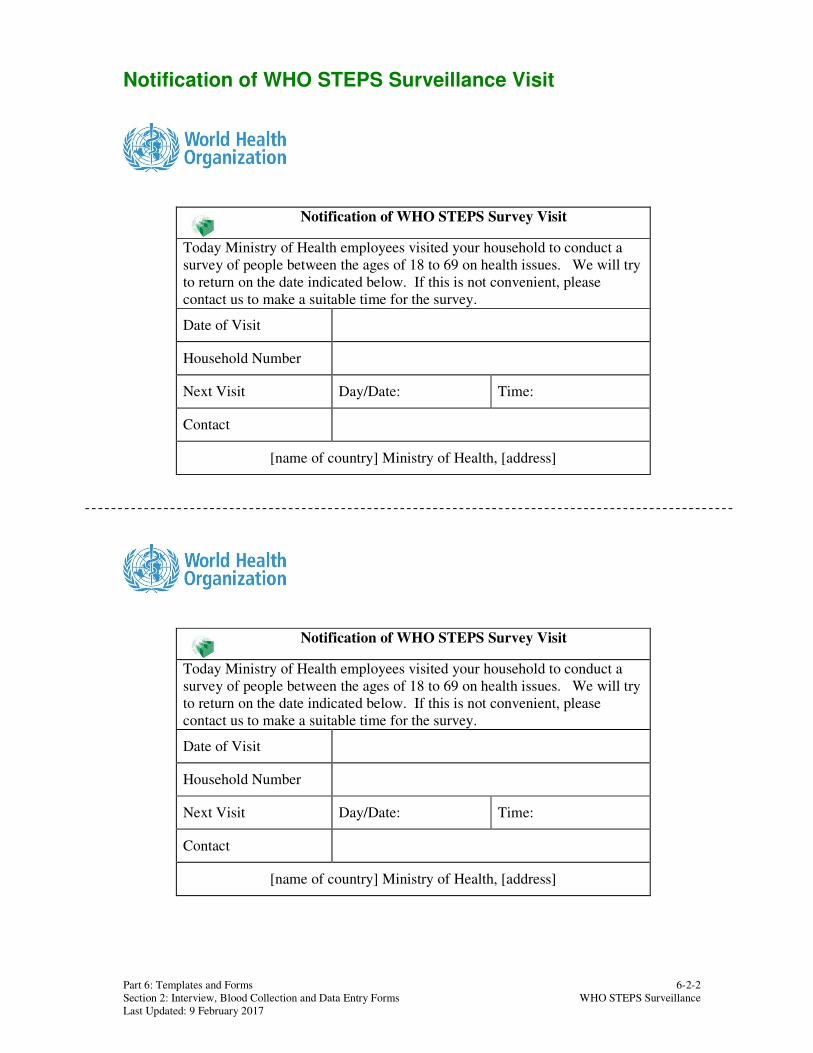
Notification of WHO STEPS Surveillance Visit
Notification of WHO STEPS Survey Visit
Today Ministry of Health employees visited your household to conduct a
survey of people between the ages of 18 to 69 on health issues. We will try
to return on the date indicated below. If this is not convenient, please
contact us to make a suitable time for the survey.
Date of Visit
Household Number
Next Visit Day/Date: Time:
Contact
[name of country] Ministry of Health, [address]

Part 6: Templates and Forms 6-2-3
Section 2: Interview, Blood Collection and Data Entry Forms WHO STEPS Surveillance
Last Updated: 9 February 2017
Script for Data Collectors
My name is _______ and this is________.
We are employees of the <Ministry of
Health>and we are working in a team to
conduct a survey on health issues. We are
hoping that the people in this house will
participate in this survey. We would like
to find out the number of people usually
residing in this house between the ages of
18-69. Can you please give me the first
name of those who usually live in this
house between the ages 18-69 (starting, for
example, with the oldest male)?

Part 6: Templates and Forms 6-2-4
Section 2: Interview, Blood Collection and Data Entry Forms WHO STEPS Surveillance
Last Updated: 9 February 2017
Interview Tracking Form
Hou
seh
old
ID
Nu
mb
er
No. E
ligib
le i
n
Hou
seh
old
Parti
cip
an
t ID
At
Hom
e
Male Female Step 1 Step 2 Step 3
Ap
poin
tmen
t
Tim
e
Individual Comment
Vis
it 1
Vis
it 2
18-2
9
30-4
4
45-5
9
60-6
9
18-2
9
30-4
4
45-5
9
60-6
9
Yes
Dec
lin
e
Yes
Dec
lin
e
Yes
Dec
lin
e
Note:
- Fill in form by using "y/n" for At home (corresponds with participant at home yes/no) and using an "x" for the correct responses in Male, Female, Step 1, Step 2,
Step 3"
Cluster No. ________________________________
Interviewer ID ____________________________

Part 6: Templates and Forms 6-2-5
Section 2: Interview, Blood Collection and Data Entry Forms WHO STEPS Surveillance
Last Updated: 9 February 2017
Participant Information Form (Step 1, 2 and 3)
Introduction This form describes what participation in the WHO STEPS survey means.
Title of survey The title of this survey is the STEPS Survey of Risk Factors for
Noncommunicable Diseases (NCDs)
Aim of the
survey This survey will determine the extent in [name of country] of several of the
major risk factors for major NCDs (e.g. diseases not caused by infections).
These diseases and their risk factors include:
• Tobacco use
• Alcohol consumption
• Low intake of fruit and vegetables
• Diet high in salt
• Physical inactivity
• Raised blood pressure
• Obesity
• Raised blood glucose
• High levels of fat in the blood
Data collection
methods We will collect information from [insert sample size] participants throughout
the area in which the survey is being conducted.
Information will be gathered through 3 steps of data collection:
• Step 1 - Interview questions
• Step 2 - Measurements of blood pressure, height, weight, waist and hip
• Step 3 – Urine tests for salt and blood tests for sugar and fats
What’s
involved The table below shows each of the steps involved. You will be given time to
consider your participation.
Step Action
1 We will describe the STEPS survey to you.
2 You may ask any questions you may have.
3 We will ask you to sign a consent form.
Continued on next page

Part 6: Templates and Forms 6-2-6
Section 2: Interview, Blood Collection and Data Entry Forms WHO STEPS Surveillance
Last Updated: 9 February 2017
Participant Information Form (Step 1, 2 and 3), Continued
What’s involved (cont.)
Step Action
4 You will be asked to participate in Step 1. This will involve a data
collector asking you some questions about your:
• Age
• Education
• Employment and income
• Tobacco and alcohol use
• Fruit and vegetable intake
• Consumption of salt
• Physical activity
• History of raised blood pressure, diabetes, raised cholesterol, and
cardio-vascular diseases
• Lifestyle advice
• Cervical cancer screening
5 You will then be asked to participate in Step 2. This will involve a
data collector taking some simple measurements of your:
• Blood pressure
• Height
• Weight
• Waist and hip circumference
6 You will also be asked to participate in Step 3. This will involve
you collecting a urine sample that will be tested for salt, and health
staff taking a small amount of blood from the tip of your finger to
test for sugar and fat levels in your blood after you have fasted
overnight. This may cause some mild pain.
Timeframe It is estimated that Step 1 and 2 of the survey will take approximately 1 hour.
Community
benefits The results of this study will be used to assist the Ministry of Health in
developing public health programmes that target efforts to lower the risk
factors that lead to NCDs.
Your rights It is your right to:
• decline to take part in the study;
• withdraw your consent at any time;
• decline to answer any question in the interview that you do not wish to
answer.
Continued on next page

Part 6: Templates and Forms 6-2-7
Section 2: Interview, Blood Collection and Data Entry Forms WHO STEPS Surveillance
Last Updated: 9 February 2017
Participant Information Form (Step 1, 2 and 3), Continued
Confidentiality You will be asked to provide your name and contact information so that you
can be contacted if there is any need to follow up with you after the survey is
conducted.
Your participation and data provided will be completely confidential.
Your name will not be used in any report of the study.
Results The results of this survey will be used to help plan strategies in reducing the
risk factors that contribute to NCDs in your community.
The results will be published in research publications, media briefings, fact
sheets, and reports and can be made available to you through the local
researchers.
Ethical
approval This study has received ethical approval from the Research Ethics Review
Committee of [insert name of institution and of location].

Part 6: Templates and Forms 6-2-8
Section 2: Interview, Blood Collection and Data Entry Forms WHO STEPS Surveillance
Last Updated: 9 February 2017
Consent Form 1 (Steps 1 and 2)
Dear Participant,
Random
selection You have been randomly selected to be part of this survey and this is why we
would like to interview you. This survey is conducted by the World Health
Organization in collaboration with the Ministry of Health and the WHO
Regional Office and will be carried out by professional interviewers from
[name of institution]. This survey is currently taking place in several
countries around the world.
Confidentiality The information you provide is totally confidential and will not be disclosed
to anyone. It will only be used for research purposes. Your name, address,
and other personal information will be removed, and only a code will be used
to connect your name and your answers without identifying you. You may be
contacted by the survey team again only if it is necessary to complete the
information on the survey.
Voluntary
participation Your participation is voluntary and you can withdraw from the survey after
having agreed to participate. You are free to refuse to answer any question
that is asked in the questionnaire. If you have any questions about this survey
you may ask me or contact [name of institution and contact details] or
[STEPS Survey Coordinator].
Consent to
participate Signing this consent indicates that you understand what will be expected of
you and are willing to participate in this survey.
Read by Participant Interviewer
Agreed Refused
Signatures I hereby provide INFORMED CONSENT to take part in Steps 1 and 2 of the
Risk Factors Study.
Name:
Sign:
Witness:
Sign:

Part 6: Templates and Forms 6-2-9
Section 2: Interview, Blood Collection and Data Entry Forms WHO STEPS Surveillance
Last Updated: 9 February 2017
Consent Form 2 (Step 3)
Dear Participant
Random
selection You have been randomly selected to be part of this survey and this is why we
would like to interview you. This survey is conducted by the World Health
Organization in collaboration with the Ministry of Health and the WHO
Regional Office and will be carried out by professional interviewers from
[name of institution]. This survey is currently taking place in several
countries around the world.
Confidentiality The information you provide is totally confidential and will not be disclosed
to anyone. It will only be used for research purposes. Your name, address,
and other personal information will be removed, and only a code will be used
to connect your name and your answers without identifying you. You may be
contacted by the Survey Team again only if it is necessary to complete the
information on the survey.
Voluntary
participation Your participation is voluntary and you can withdraw from the survey after
having agreed to participate. You are free to refuse to answer any question
that is asked in the questionnaire. If you have any questions about this survey
you may ask me or contact [name of institution and contact details] or
[STEPS Survey Coordinator].
What’s
involved You will be asked to collect a urine sample to be tested for salt, and you will
have a small amount of blood taken from the tip of your finger to be tested
for sugar and fat after you have fasted overnight. This may cause some mild
pain. You will be informed about the results of the test with your blood
sample.
Consent to
participate Signing this consent indicates that you understand what will be expected of
you and are willing to participate in this survey.
Read by Participant Interviewer
Agreed Refused
Signatures I hereby provide INFORMED CONSENT to take part in Step 3 of the Risk
Factor Study.
Name:
Sign:
Witness:
Sign:

Part 6: Templates and Forms 6-2-10
Section 2: Interview, Blood Collection and Data Entry Forms WHO STEPS Surveillance
Last Updated: 9 February 2017
Participant Feedback Form (Step 2)
Dear Participant,
We thank you very much for participating in the STEPS Survey of Risk Factors for
Noncommunicable Diseases in [name of country], conducted by [name of institution].
This study was undertaken in order to gather information on the following risk factors for
noncommunicable diseases in [name of country]: tobacco use, alcohol consumption, low intake
of fruit and vegetables, diet high in salt, physical inactivity, raised blood pressure, obesity,
raised blood glucose, and high levels of blood cholesterol.
We would like to provide you with an overview of your results from the physical
measurements.
Blood pressure
Systolic: ______________________ mmHg (reading 3)
Diastolic: _____________________ mmHg (reading 3)
Blood pressure
classification
Normal (SBP< 140 and DBP< 90)
Elevated (SBP 140-159 and/or DBP 90-99)
Raised (SBP≥160 and/or DBP≥100)
Currently on medication
Heart rate Beats per minute: ________________ (reading 3)
Height Height: _______________________ cm
Weight Weight: _______________________ kg
Body Mass
Index BMI: ________________________ kg/m
2 (weight in kg divided by height in
meters squared; ex. for height 170 cm and weight 68 kg BMI=(68/(1.72)=23.5)
BMI
classification
Underweight (BMI< 18.5)
Normal weight (BMI 18.5-24.9)
Overweight (BMI 25-29.9)
Obese (BMI≥30)
Waist
circumference Waist: ______________________ cm
Hip
circumference Hip: ________________________ cm

Part 6: Templates and Forms 6-2-11
Section 2: Interview, Blood Collection and Data Entry Forms WHO STEPS Surveillance
Last Updated: 9 February 2017
Participant Feedback Form (Step 3 – mmol/L)
Dear Participant,
We thank you very much for participating in the STEPS Survey of Risk Factors for
Noncommunicable Diseases in [name of country], conducted by [name of institution].
This study was undertaken in order to gather information on the following risk factors for
noncommunicable diseases in [name of country]: tobacco use, alcohol consumption, low intake
of fruit and vegetables, diet high in salt, physical inactivity, raised blood pressure, obesity,
raised blood glucose, and high levels of blood cholesterol.
We would like to provide you with an overview of your results from the biochemical
measurements.
Fasting blood
glucose Fasting blood glucose: ______________________ mmol/l
Fasting blood
glucose
classification
Normal (< 6.1 mmol/l)
Raised (≥6.1 mmol/l)
Currently on medication
Total blood
cholesterol Total cholesterol: ______________________ mmol/l
Total blood
cholesterol
classification
Normal (<5.0 mmol/l)
Elevated (5.0-6.1 mmol/l)
High (≥6.2 mmol/l)
HDL
cholesterol HDL cholesterol: ______________________ mmol/l
HDL
cholesterol
classification
Normal (≥1.03 mmol/l for Men, ≥ 1.29 mmol/l for Women)
Low (< 1.03 mmol/l for Men, < 1.29 mmol/l for Women)
Triglycerides Triglycerides: ______________________ mmol/l
Triglycerides
classification
Normal (<1.7 mmol/l)
Raised (≥1.7 mmol/l)

Part 6: Templates and Forms 6-2-12
Section 2: Interview, Blood Collection and Data Entry Forms WHO STEPS Surveillance
Last Updated: 9 February 2017
Participant Feedback Form (Step 3 – mg/dL)
Dear Participant,
We thank you very much for participating in the STEPS Survey of Risk Factors for
Noncommunicable Diseases in [name of country], conducted by [name of institution].
This study was undertaken in order to gather information on the following risk factors for
noncommunicable diseases in [name of country]: tobacco use, alcohol consumption, low intake
of fruit and vegetables, diet high in salt, physical inactivity, raised blood pressure, obesity,
raised blood glucose, and high levels of blood cholesterol.
We would like to provide you with an overview of your results from the biochemical
measurements.
Fasting blood
glucose Fasting blood glucose: ______________________ mg/dl
Fasting blood
glucose
classification
Normal (<110 mg/dl)
Raised (≥110 mg/dl)
Currently on medication
Total blood
cholesterol Total cholesterol: ______________________ mg/dl
Total blood
cholesterol
classification
Normal (<190 mg/dl)
Elevated (190-239 mg/dl)
High (≥240 mg/dl)
HDL
cholesterol HDL cholesterol: ______________________ mg/dl
HDL
cholesterol
classification
Normal (≥40 mg/dl for Men, ≥50 mg/dl for Women)
Low (<40 mg/dl for Men, <50 mg/dl for Women)
Triglycerides Triglycerides: ______________________ mg/dl
Triglycerides
classification
Normal (<150 mg/dl)
Raised (≥150 mg/dl)
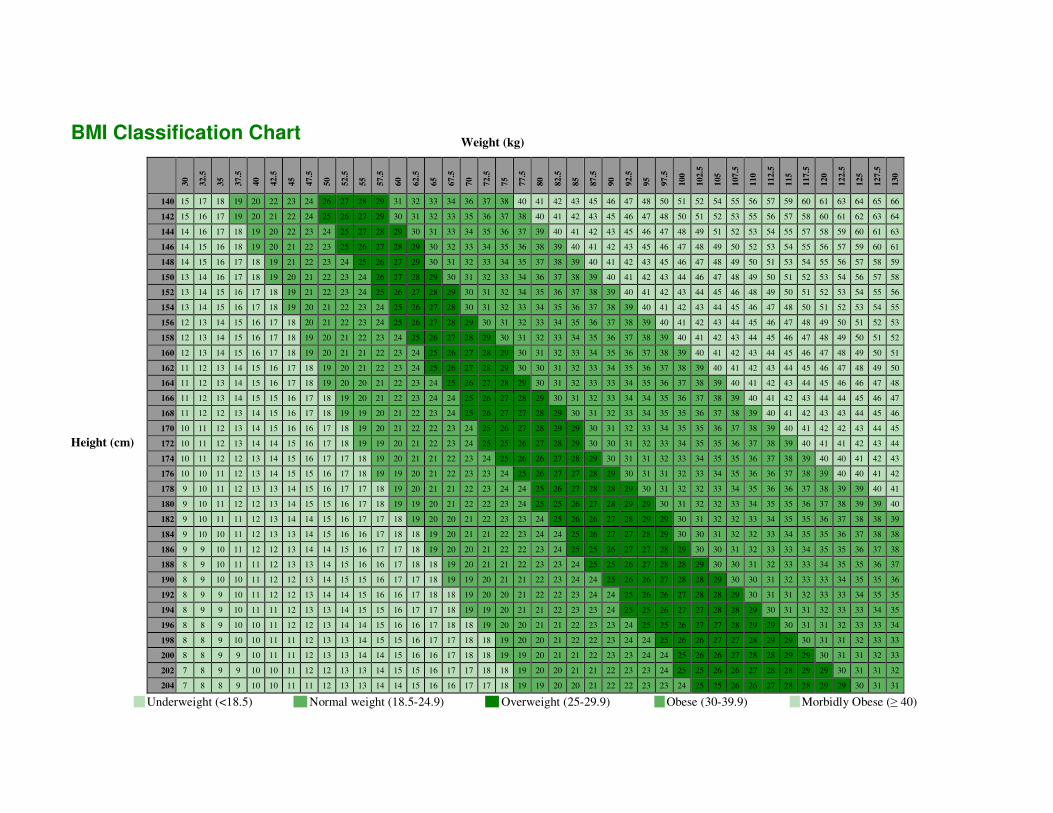
BMI Classification Chart
30
32.5
35
37.5
40
42.5
45
47.5
50
52.5
55
57.5
60
62.5
65
67.5
70
72.5
75
77.5
80
82.5
85
87.5
90
92.5
95
97.5
100
102.5
105
107.5
110
112.5
115
117.5
120
122.5
125
127.5
130
140 15 17 18 19 20 22 23 24 26 27 28 29 31 32 33 34 36 37 38 40 41 42 43 45 46 47 48 50 51 52 54 55 56 57 59 60 61 63 64 65 66
142 15 16 17 19 20 21 22 24 25 26 27 29 30 31 32 33 35 36 37 38 40 41 42 43 45 46 47 48 50 51 52 53 55 56 57 58 60 61 62 63 64
144 14 16 17 18 19 20 22 23 24 25 27 28 29 30 31 33 34 35 36 37 39 40 41 42 43 45 46 47 48 49 51 52 53 54 55 57 58 59 60 61 63
146 14 15 16 18 19 20 21 22 23 25 26 27 28 29 30 32 33 34 35 36 38 39 40 41 42 43 45 46 47 48 49 50 52 53 54 55 56 57 59 60 61
148 14 15 16 17 18 19 21 22 23 24 25 26 27 29 30 31 32 33 34 35 37 38 39 40 41 42 43 45 46 47 48 49 50 51 53 54 55 56 57 58 59
150 13 14 16 17 18 19 20 21 22 23 24 26 27 28 29 30 31 32 33 34 36 37 38 39 40 41 42 43 44 46 47 48 49 50 51 52 53 54 56 57 58
152 13 14 15 16 17 18 19 21 22 23 24 25 26 27 28 29 30 31 32 34 35 36 37 38 39 40 41 42 43 44 45 46 48 49 50 51 52 53 54 55 56
154 13 14 15 16 17 18 19 20 21 22 23 24 25 26 27 28 30 31 32 33 34 35 36 37 38 39 40 41 42 43 44 45 46 47 48 50 51 52 53 54 55
156 12 13 14 15 16 17 18 20 21 22 23 24 25 26 27 28 29 30 31 32 33 34 35 36 37 38 39 40 41 42 43 44 45 46 47 48 49 50 51 52 53
158 12 13 14 15 16 17 18 19 20 21 22 23 24 25 26 27 28 29 30 31 32 33 34 35 36 37 38 39 40 41 42 43 44 45 46 47 48 49 50 51 52
160 12 13 14 15 16 17 18 19 20 21 21 22 23 24 25 26 27 28 29 30 31 32 33 34 35 36 37 38 39 40 41 42 43 44 45 46 47 48 49 50 51
162 11 12 13 14 15 16 17 18 19 20 21 22 23 24 25 26 27 28 29 30 30 31 32 33 34 35 36 37 38 39 40 41 42 43 44 45 46 47 48 49 50
164 11 12 13 14 15 16 17 18 19 20 20 21 22 23 24 25 26 27 28 29 30 31 32 33 33 34 35 36 37 38 39 40 41 42 43 44 45 46 46 47 48
166 11 12 13 14 15 15 16 17 18 19 20 21 22 23 24 24 25 26 27 28 29 30 31 32 33 34 34 35 36 37 38 39 40 41 42 43 44 44 45 46 47
168 11 12 12 13 14 15 16 17 18 19 19 20 21 22 23 24 25 26 27 27 28 29 30 31 32 33 34 35 35 36 37 38 39 40 41 42 43 43 44 45 46
170 10 11 12 13 14 15 16 16 17 18 19 20 21 22 22 23 24 25 26 27 28 29 29 30 31 32 33 34 35 35 36 37 38 39 40 41 42 42 43 44 45
172 10 11 12 13 14 14 15 16 17 18 19 19 20 21 22 23 24 25 25 26 27 28 29 30 30 31 32 33 34 35 35 36 37 38 39 40 41 41 42 43 44
174 10 11 12 12 13 14 15 16 17 17 18 19 20 21 21 22 23 24 25 26 26 27 28 29 30 31 31 32 33 34 35 35 36 37 38 39 40 40 41 42 43
176 10 10 11 12 13 14 15 15 16 17 18 19 19 20 21 22 23 23 24 25 26 27 27 28 29 30 31 31 32 33 34 35 36 36 37 38 39 40 40 41 42
178 9 10 11 12 13 13 14 15 16 17 17 18 19 20 21 21 22 23 24 24 25 26 27 28 28 29 30 31 32 32 33 34 35 36 36 37 38 39 39 40 41
180 9 10 11 12 12 13 14 15 15 16 17 18 19 19 20 21 22 22 23 24 25 25 26 27 28 29 29 30 31 32 32 33 34 35 35 36 37 38 39 39 40
182 9 10 11 11 12 13 14 14 15 16 17 17 18 19 20 20 21 22 23 23 24 25 26 26 27 28 29 29 30 31 32 32 33 34 35 35 36 37 38 38 39
184 9 10 10 11 12 13 13 14 15 16 16 17 18 18 19 20 21 21 22 23 24 24 25 26 27 27 28 29 30 30 31 32 32 33 34 35 35 36 37 38 38
186 9 9 10 11 12 12 13 14 14 15 16 17 17 18 19 20 20 21 22 22 23 24 25 25 26 27 27 28 29 30 30 31 32 33 33 34 35 35 36 37 38
188 8 9 10 11 11 12 13 13 14 15 16 16 17 18 18 19 20 21 21 22 23 23 24 25 25 26 27 28 28 29 30 30 31 32 33 33 34 35 35 36 37
190 8 9 10 10 11 12 12 13 14 15 15 16 17 17 18 19 19 20 21 21 22 23 24 24 25 26 26 27 28 28 29 30 30 31 32 33 33 34 35 35 36
192 8 9 9 10 11 12 12 13 14 14 15 16 16 17 18 18 19 20 20 21 22 22 23 24 24 25 26 26 27 28 28 29 30 31 31 32 33 33 34 35 35
194 8 9 9 10 11 11 12 13 13 14 15 15 16 17 17 18 19 19 20 21 21 22 23 23 24 25 25 26 27 27 28 28 29 30 31 31 32 33 33 34 35
196 8 8 9 10 10 11 12 12 13 14 14 15 16 16 17 18 18 19 20 20 21 21 22 23 23 24 25 25 26 27 27 28 29 29 30 31 31 32 33 33 34
198 8 8 9 10 10 11 11 12 13 13 14 15 15 16 17 17 18 18 19 20 20 21 22 22 23 24 24 25 26 26 27 27 28 29 29 30 31 31 32 33 33
200 8 8 9 9 10 11 11 12 13 13 14 14 15 16 16 17 18 18 19 19 20 21 21 22 23 23 24 24 25 26 26 27 28 28 29 29 30 31 31 32 33
202 7 8 9 9 10 10 11 12 12 13 13 14 15 15 16 17 17 18 18 19 20 20 21 21 22 23 23 24 25 25 26 26 27 28 28 29 29 30 31 31 32
204 7 8 8 9 10 10 11 11 12 13 13 14 14 15 16 16 17 17 18 19 19 20 20 21 22 22 23 23 24 25 25 26 26 27 28 28 29 29 30 31 31
Weight (kg)
Height (cm)
Underweight (<18.5) Normal weight (18.5-24.9) Overweight (25-29.9) Obese (30-39.9) Morbidly Obese (≥ 40)

Step 3 Appointment Card
APPOINTMENT TIME
Thank you for agreeing to participate in the STEPS survey.
Participant ID: _____________________
APPOINTMENT
Centre: ______________________
Date: ___________________________
Time: ___________________________
PLEASE BRING THIS FORM WITH YOU
WHEN YOU COME FOR AN APPOINTMENT

Instructions for Spot Urine Collection (Step 3)
Participant ID: _________________
INSTRUCTIONS FOR SPOT URINE COLLECTION DATE:
We are asking you to collect a sample of your
urine (pee) in the evening before you commence
your fast.
When you go the bathroom (toilet) void urine
(pee) into the container. Once the container is
half full finish voiding in the toilet. Screw on the
lid tightly and place the container in the zip
closable plastic bag (do not remove labels).
Write down the time you collect your sample
TIME OF COLLECTION: ____ ____
Place container filled with urine (pee) in a zip
closable plastic bag and store upright in a cool,
dark place.
Bring your container filled with urine in the zip
closable plastic bag and this instruction sheet to
the collection centre
If there is anything you are unsure about please contact: ________________________________
1
2
3
4

Frequently
Asked
Questions
Why do I have a participant identification number (ID)?
An ID number will be assigned to your information and samples to ensure
confidentiality.
Why is it important to complete a spot urine sample? The spot sample will allow us to determine information related to the salt
intake in your diet.
What are you testing in the urine sample? A number of nutritional factors including sodium and creatinine [optional
potassium/iodine].
Will the urine sample be tested for drugs? No. Your urine sample will only be analysed for nutritional markers.
What happens if I spill some urine? It is important that spillages do not occur, however simply clean up the
spillage.
I take prescribed medications - can I still take part?
Yes you can.
Do I still take my medications on the day I provide my urine sample? Yes, absolutely.
Do I need to fill up the container? No, half full is perfect.
What if I have my period? We ask that you use a tampon, if available, when collecting your urine
samples; otherwise we ask you not to participate.
What if I am feeling sick? Please collect the urine sample if you are able to.
Is there any health risks involved in providing a urine sample? No - there is no risk to your health or the health of others.
Where do I keep my urine container? It is best to keep the container and contents in a cool, dark place.
Will insurance companies or any other body find out my results?
No.

Fasting Instructions (Step 3)
Introduction To get accurate results from the blood test it is very important that you have
fasted.
Fasting
instructions Please ensure that you DO NOT have anything to eat or drink including
chewing gum (except plain water) for at least 8 hours (12 hours if
triglycerides are also measured) BEFORE blood collection. This means that
if you have your appointment in the morning, please do not eat or drink after
10:00 PM the night before the appointment.
Note for
diabetics If you have diabetes controlled with tablets and/or insulin, please AVOID
taking these on the morning of your appointment, but bring them with you to
take after testing is completed. Please take any other morning medications as
usual.

Step 3 Registration Form
Date Participant
ID
Name Consent
form
(place a √)
If did not fast properly,
appointment of next
visit

Part 6: Templates and Forms 6-3-1
Section 3: Reporting Templates WHO STEPS Surveillance
Last Updated: 26 January 2017
Section 3: Reporting Templates (Fact Sheet, Fact Sheet Analysis Guide, Data Book and Country Report Template)
Overview
Introduction This section includes templates that can be used to report both the
comprehensive and summary results of the STEPS survey.
In this section This section contains the following Report Templates:
Topic See Page
Fact Sheet Template 6-3A-1
Fact Sheet Analysis Guide 6-3B-1
Data Book Template 6-3C-1
Country Report Template 6-3D-1


WHO STEPS noncommunicable disease risk factor surveillance 6-3A-1 www.who.int/chp/steps fact sheet
<Country> STEPS Survey <year>
Fact Sheet
The STEPS survey of noncommunicable disease (NCD) risk factors in [country name] was carried out from [insert month
and year] to [insert month and year]. [country name] carried out Step 1, Step 2 and Step 3. Socio demographic and
behavioural information was collected in Step 1. Physical measurements such as height, weight and blood pressure were
collected in Step 2. Biochemical measurements were collected to assess blood glucose and cholesterol levels in Step 3.
The survey was a population-based survey of adults aged 18-69 [adjust as necessary]. A [insert type of sampling design]
sample design was used to produce representative data for that age range in [insert country name]. A total of [insert
sample size] adults participated in the survey. The overall response rate was [insert response rate (x%)]. A repeat survey
is planned for [insert year] if funds permit.
Results for adults aged 18-69 years (incl. 95% CI) (adjust if necessary) Both Sexes Males Females
Step 1 Tobacco Use
Percentage who currently smoke tobacco 77.1% (66.2 – 88.1)
77.2% (66.2 – 88.1)
77.4% (66.2 – 88.1)
Percentage who currently smoke tobacco daily
For those who smoke tobacco daily
Average age started smoking (years)
Percentage of daily smokers smoking manufactured cigarettes
Mean number of manufactured cigarettes smoked per day (by smokers of manufactured cigarettes)
Step 1 Alcohol Consumption
Percentage who are lifetime abstainers
Percentage who are past 12 month abstainers
Percentage who currently drink (drank alcohol in the past 30 days)
Percentage who engage in heavy episodic drinking (6 or more drinks on any occasion in the past 30 days)
Step 1 Diet
Mean number of days fruit consumed in a typical week
Mean number of servings of fruit consumed on average per day
Mean number of days vegetables consumed in a typical week
Mean number of servings of vegetables consumed on average per day
Percentage who ate less than 5 servings of fruit and/or vegetables on average per day
Percentage who always or often add salt or salty sauce to their food before eating or as they are eating
Percentage who always or often eat processed foods high in salt
Step 1 Physical Activity
Percentage with insufficient physical activity (defined as < 150 minutes of moderate-intensity activity per week, or equivalent)*
Median time spent in physical activity on average per day (minutes) (presented with inter-quartile range)
Percentage not engaging in vigorous activity
* For complete definitions of insufficient physical activity, refer to the GPAQ Analysis Guide (http://www.who.int/chp/steps/GPAQ/en/index.html) or to the WHO Global recommendations on physical activity for health (http://www.who.int/dietphysicalactivity/factsheet_recommendations/en/index.html)

WHO STEPS noncommunicable disease risk factor surveillance 6-3A-1 www.who.int/chp/steps fact sheet
<Country> STEPS Survey <year >
Fact Sheet
Results for adults aged 18-69 years (incl. 95% CI) (adjust if necessary) Both Sexes Males Females
Step 1 Cervical Cancer Screening
Percentage of women aged 30-49 years who have ever had a screening test for cervical cancer
Step 2 Physical Measurements
Mean body mass index - BMI (kg/m2)
Percentage who are overweight (BMI ≥ 25 kg/m2)
Percentage who are obese (BMI ≥ 30 kg/m2)
Average waist circumference (cm)
Mean systolic blood pressure - SBP (mmHg), including those currently on medication for raised BP
Mean diastolic blood pressure - DBP (mmHg), including those currently on medication for raised BP
Percentage with raised BP (SBP ≥ 140 and/or DBP ≥ 90 mmHg or currently on medication for raised BP)
Percentage with raised BP (SBP ≥ 140 and/or DBP ≥ 90 mmHg or currently on medication for raised BP) who are not currently on medication for raised BP
Step 3 Biochemical Measurement
Mean fasting blood glucose, including those currently on medication for raised blood glucose [choose accordingly: mmol/L or mg/dl]
Percentage with impaired fasting glycaemia as defined below • plasma venous value ≥6.1 mmol/L (110 mg/dl) and <7.0 mmol/L (126 mg/dl)
• capillary whole blood value ≥5.6 mmol/L (100 mg/dl) and <6.1 mmol/L (110 mg/dl)
Percentage with raised fasting blood glucose as defined below or currently on medication for raised blood glucose • plasma venous value ≥ 7.0 mmol/L (126 mg/dl)
• capillary whole blood value ≥ 6.1 mmol/L (110 mg/dl)
Mean total blood cholesterol, including those currently on medication for raised cholesterol [choose accordingly: mmol/L or mg/dl]
Percentage with raised total cholesterol (≥ 5.0 mmol/L or ≥ 190 mg/dl or currently on medication for raised cholesterol)
Mean intake of salt per day (in grams)
Cardiovascular disease (CVD) risk
Percentage aged 40-69 years with a 10-year CVD risk ≥ 30%, or with existing CVD**
Summary of combined risk factors
• current daily smokers
• less than 5 servings of fruits & vegetables per day
• insufficient physical activity
• overweight (BMI ≥ 25 kg/m2)
• raised BP (SBP ≥ 140 and/or DBP ≥ 90 mmHg or currently on medication for raised BP)
Percentage with none of the above risk factors
Percentage with three or more of the above risk factors, aged 18 to 44 years
Percentage with three or more of the above risk factors, aged 45 to 69 years
Percentage with three or more of the above risk factors, aged 18 to 69 years
** A 10-year CVD risk of ≥30% is defined according to age, sex, blood pressure, smoking status (current smokers OR those who quit smoking less than 1 year before the assessment), total cholesterol, and diabetes (previously diagnosed OR a fasting plasma glucose concentration >7.0 mmol/l (126 mg/dl).
For additional information, please contact: STEPS Survey Coordinator [name, email addresses]

WHO STEPS chronic disease risk factor surveillance 6-3B-1 www.who.int/chp/steps
Country STEPS Survey <year>
Fact Sheet Analysis Guide
Please use this as a guide when you are altering your instrument as it will provide you with a guideline for which questions are needed in order to calculate these basic indicators. To calculate the basic indicators that are presented on the Fact Sheet refer to the Data Analysis section of the user manual (Part 4, Section 3)
Results for adults aged 18-69 years (incl. 95% CI) (adjust if necessary) Questions required to calculate result (based
on coding column) Epi Info Program Name
Step 1 Tobacco Use
Percentage who currently smoke tobacco T1, T2, T8 TsmokestatusWT
Percentage who currently smoke tobacco daily T1, T2, T8 TsmokestatusWT
For those who smoke tobacco daily
Average age started smoking (years) T1, T2, T3, T4a-c TsmokeagetimeWT
Percentage of daily smokers smoking manufactured cigarettes T1, T2, T5a TsmokemanWT
Mean number of manufactured cigarettes smoked per day (by smokers of manufactured cigarettes)
T1, T2, T5a TsmoketypeWT
Step 1 Alcohol Consumption
Percentage who are lifetime abstainers A1, A2, A5 AconsumptionWT
Percentage who are past 12 month abstainers A1, A2, A5 AconsumptionWT
Percentage who currently drink (drank alcohol in the past 30 days) A1, A2, A5 AconsumptionWT
Percentage who engage in heavy episodic drinking (6 or more drinks on any occasion in the past 30 days)
A1, A2, A5, A9 AepisodicWT
Step 1 Diet
Mean number of days fruit consumed in a typical week D1, D3 DdaysWT
Mean number of servings of fruit consumed on average per day D1, D2, D3, D4 DservingsWT
Mean number of days vegetables consumed in a typical week D1, D3 DdaysWT
Mean number of servings of vegetables consumed on average per day D1, D2, D3, D4 DservingsWT
Percentage who ate less than 5 servings of fruit and/or vegetables on average per day
D1, D2, D3, D4 DfiveormoreWT
Percentage who always or often add salt or salty sauce to their food before eating or as they are eating
D5 DeatingWT
Percentage who always or often eat processed foods high in salt D7 DprocessedWT
Step 1 Physical Activity
Percentage with insufficient physical activity (defined as < 150 minutes of moderate-intensity activity per week, or equivalent)*
P1-P15b PnotmeetingrecsWT
Median time spent in physical activity on average per day (minutes) P1-P15b PtotalmedianWT
Percentage not engaging in vigorous activity P1-P15b PnovigorousWT
Step 1 Cervical Cancer Screening
Percentage of women aged 30-49 years who have ever had a screening test for cervical cancer
CX1 HcervcancerWT
* For complete definitions of low and high levels of physical activity, other conditions are specified in the GPAQ Analysis Guide, available at: http://www.who.int/chp/steps/GPAQ/en/index.html
WHO STEPS chronic disease risk factor surveillance 6-3B-1 www.who.int/chp/steps
Country STEPS Survey <year>
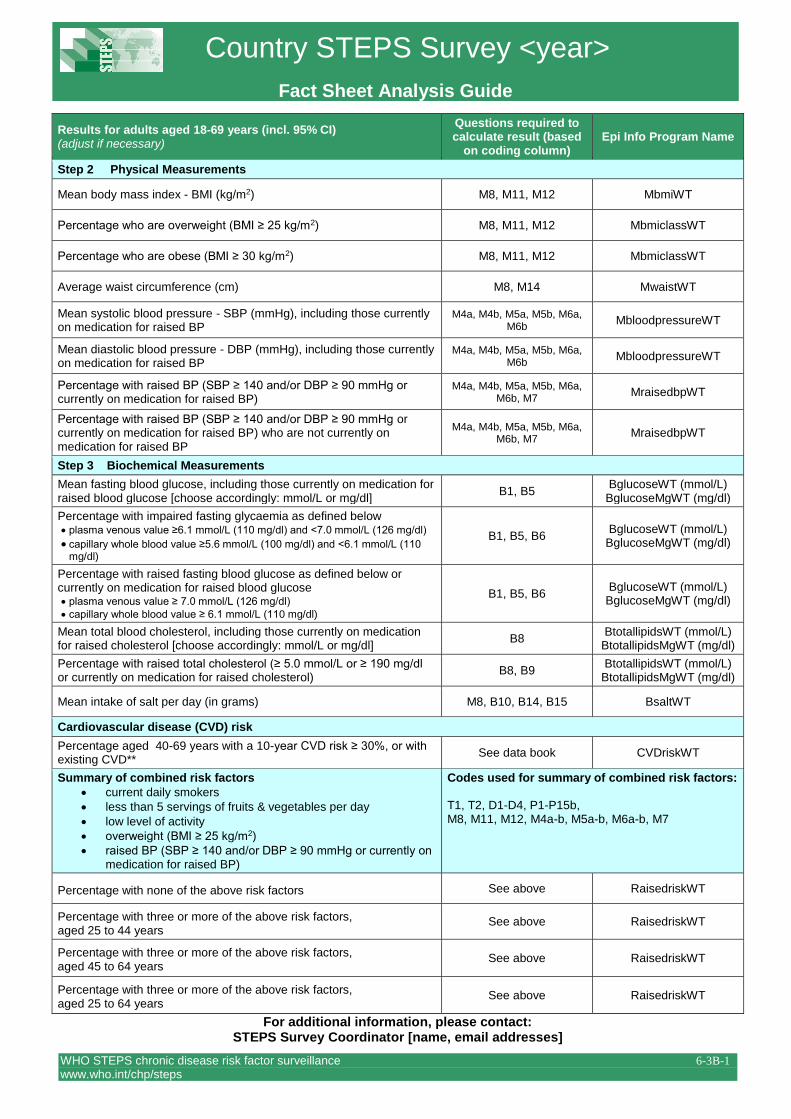
Fact Sheet Analysis Guide
Results for adults aged 18-69 years (incl. 95% CI) (adjust if necessary)
Questions required to calculate result (based
on coding column) Epi Info Program Name
Step 2 Physical Measurements
Mean body mass index - BMI (kg/m2) M8, M11, M12 MbmiWT
Percentage who are overweight (BMI ≥ 25 kg/m2) M8, M11, M12 MbmiclassWT
Percentage who are obese (BMI ≥ 30 kg/m2) M8, M11, M12 MbmiclassWT
Average waist circumference (cm) M8, M14 MwaistWT
Mean systolic blood pressure - SBP (mmHg), including those currently on medication for raised BP
M4a, M4b, M5a, M5b, M6a, M6b
MbloodpressureWT
Mean diastolic blood pressure - DBP (mmHg), including those currently on medication for raised BP
M4a, M4b, M5a, M5b, M6a, M6b
MbloodpressureWT
Percentage with raised BP (SBP ≥ 140 and/or DBP ≥ 90 mmHg or currently on medication for raised BP)
M4a, M4b, M5a, M5b, M6a, M6b, M7
MraisedbpWT
Percentage with raised BP (SBP ≥ 140 and/or DBP ≥ 90 mmHg or currently on medication for raised BP) who are not currently on medication for raised BP
M4a, M4b, M5a, M5b, M6a, M6b, M7
MraisedbpWT
Step 3 Biochemical Measurements
Mean fasting blood glucose, including those currently on medication for raised blood glucose [choose accordingly: mmol/L or mg/dl]
B1, B5 BglucoseWT (mmol/L)
BglucoseMgWT (mg/dl)
Percentage with impaired fasting glycaemia as defined below • plasma venous value ≥6.1 mmol/L (110 mg/dl) and <7.0 mmol/L (126 mg/dl)
• capillary whole blood value ≥5.6 mmol/L (100 mg/dl) and <6.1 mmol/L (110 mg/dl)
B1, B5, B6 BglucoseWT (mmol/L)
BglucoseMgWT (mg/dl)
Percentage with raised fasting blood glucose as defined below or currently on medication for raised blood glucose • plasma venous value ≥ 7.0 mmol/L (126 mg/dl)
• capillary whole blood value ≥ 6.1 mmol/L (110 mg/dl)
B1, B5, B6 BglucoseWT (mmol/L)
BglucoseMgWT (mg/dl)
Mean total blood cholesterol, including those currently on medication for raised cholesterol [choose accordingly: mmol/L or mg/dl]
B8 BtotallipidsWT (mmol/L)
BtotallipidsMgWT (mg/dl)
Percentage with raised total cholesterol (≥ 5.0 mmol/L or ≥ 190 mg/dl or currently on medication for raised cholesterol)
B8, B9 BtotallipidsWT (mmol/L)
BtotallipidsMgWT (mg/dl)
Mean intake of salt per day (in grams) M8, B10, B14, B15 BsaltWT
Cardiovascular disease (CVD) risk
Percentage aged 40-69 years with a 10-year CVD risk ≥ 30%, or with existing CVD**
See data book CVDriskWT
Summary of combined risk factors
• current daily smokers
• less than 5 servings of fruits & vegetables per day
• low level of activity
• overweight (BMI ≥ 25 kg/m2)
• raised BP (SBP ≥ 140 and/or DBP ≥ 90 mmHg or currently on medication for raised BP)
Codes used for summary of combined risk factors: T1, T2, D1-D4, P1-P15b, M8, M11, M12, M4a-b, M5a-b, M6a-b, M7
Percentage with none of the above risk factors See above RaisedriskWT
Percentage with three or more of the above risk factors, aged 25 to 44 years
See above RaisedriskWT
Percentage with three or more of the above risk factors, aged 45 to 64 years
See above RaisedriskWT
Percentage with three or more of the above risk factors, aged 25 to 64 years
See above RaisedriskWT
For additional information, please contact: STEPS Survey Coordinator [name, email addresses]
Part 6: Templates and Forms 6-3C-1
Section 3C: Data Book Template WHO STEPS Surveillance
WHO STEPS
Noncommunicable Disease Risk Factor Survey
DATA BOOK FOR
<INSERT COUNTRY NAME>
Part 6: Templates and Forms 6-3C-2
Section 3C: Data Book Template WHO STEPS Surveillance
Table of Contents
Introduction ......................................................................................................................... 3 Sampling and Response Proportions ................................................................................... 6
Demographic Information Results ...................................................................................... 7 Tobacco Use ...................................................................................................................... 14 Alcohol Consumption ....................................................................................................... 34 Diet .................................................................................................................................... 50 Physical Activity ............................................................................................................... 61
History of Raised Blood Pressure ..................................................................................... 72 History of Diabetes ............................................................................................................ 75 History of Raised Total Cholesterol .................................................................................. 78
History of Cardiovascular Diseases .................................................................................. 81 Lifestyle Advice ................................................................................................................ 83 Cervical Cancer Screening ................................................................................................ 85 Physical Measurements ..................................................................................................... 86
Biochemical Measurements .............................................................................................. 95 Cardiovascular disease risk ............................................................................................. 105 Summary of Combined Risk Factors .............................................................................. 107
IMPORTANT:
• ALL analyses use the variables AgeRange, Sex, and Valid. You may use the AgeRange1869
and MissingAgeSex programs to generate these variables from C1, C2, and C3.
• ALL weighted programs use the variables PSU, Stratum, and one of either WStep1,
WStep2, or WStep3.
• Unweighted tables will not have confidence intervals associated with them.

Part 6: Templates and Forms 6-3D-3
Section 3D: Data Book Template WHO STEPS Surveillance
Introduction
Purpose of the
data book This data book is a tool used to compile a complete set of data results relating
to each question and measurement in the STEPS Instrument. The STEPS
data book
• Provides detailed information for the data analyst on producing the
results for the tables.
• Provides examples of which tables to use in the country report.
• Provides examples and suggestions on the layout of tables.
Format of the
data book
Each page in the data book contains a different table with:
• Title and description of the table
• Data tables for men, women and both sexes
• Questions used to produce the table (actual question text)
• Analysis information (Epi Info program name to produce the table).
Global Action
Plan 2013-2020
and Global
Monitoring
Framework
STEPS captures 11 of the 25 indicators outlined in the Global Action Plan
2013-2020 and the Comprehensive Global Monitoring Framework for the
Prevention and Control of NCDs1, relating to 7 of the 9 global targets.
Indicators captured in STEPS are marked in bold and italic in the table
below.
Tables in the
data book
relating to the
Global
Monitoring
Framework
Tables in the data book relating to the Global Monitoring Framework are
identified with this symbol:
1 World Health Organization. Global action plan for the prevention and control of NCDs 2013-
2020. Geneva: World Health Organization; 2013.

Part 6: Templates and Forms 6-3D-4
Section 3D: Data Book Template WHO STEPS Surveillance
Framework Element
Target Indicator
MORTALITY AND MORBIDITY
Premature mortality from noncommunicable disease
1. A 25% relative reduction in the overall mortality from CVDs, cancer, diabetes, or chronic respiratory diseases
1. Unconditional probability of dying between ages of 30 and 70 from cardiovascular diseases, cancer, diabetes or chronic respiratory diseases
Additional indicator 2. Cancer incidence, by type of cancer, per 100 000 population
BEHAVIOURAL RISK FACTORS
Harmful use of alcohol
2. At least 10% relative reduction in the harmful use of alcohol, as appropriate, within the national context
3. Total (recorded and unrecorded) alcohol per capita (aged 15+ years old) consumption within a calendar year in litres of pure alcohol, as appropriate, within the national context 4. Age-standardized prevalence of heavy episodic drinking among adolescents and adults, as appropriate, within the national context 5. Alcohol-related morbidity and mortality among adolescents and adults, as appropriate, within the national context
Physical inactivity 3. A 10% relative reduction in prevalence of insufficient physical activity
6. Prevalence of insufficiently physically active adolescents, defined as less than 60 minutes of moderate to vigorous intensity activity daily 7. Age-standardized prevalence of insufficiently physically active persons aged 18+ years (defined as less than 150 minutes of moderate-intensity activity per week, or equivalent)
Salt/sodium intake 4. A 30% relative reduction in mean population intake of salt/sodium
8. Age-standardized mean population intake of salt (sodium chloride) per day in grams in persons aged 18+ years
Tobacco use 5. A 30% relative reduction in prevalence of current tobacco use
9. Prevalence of current tobacco use among adolescents 10. Age-standardized prevalence of current tobacco use among persons aged 18+ years
BIOLOGICAL RISK FACTORS
Raised blood pressure
6. A 25% relative reduction in the prevalence of raised blood pressure or contain the prevalence of raised blood pressure, according to national circumstances
11. Age-standardized prevalence of raised blood pressure among persons aged 18+ years (defined as systolic blood pressure ≥140 mmHg and/or diastolic blood pressure ≥90 mmHg) and mean systolic blood pressure
Diabetes and obesity
7. Halt the rise in diabetes & obesity
12. Age-standardized prevalence of raised blood glucose/diabetes among persons aged 18+ years (defined as fasting plasma glucose concentration ≥ 7.0 mmol/l (126 mg/dl) or on medication for raised blood glucose) 13. Prevalence of overweight and obesity in adolescents (defined according to the WHO growth reference for school-aged children and adolescents, overweight – one standard deviation body mass index for age and sex, and obese – two standard deviations body mass index for age and sex) 14. Age-standardized prevalence of overweight and obesity in persons aged 18+ years (defined as body mass index ≥ 25 kg/m² for overweight and body mass index ≥ 30 kg/m² for obesity)
Additional indicators 15. Age-standardized mean proportion of total energy intake from saturated fatty acids in persons aged 18+ years 16. Age-standardized prevalence of persons (aged 18+ years) consuming less than five total servings (400 grams) of fruit and vegetables per day 17. Age-standardized prevalence of raised total cholesterol among persons aged 18+ years (defined as total cholesterol ≥5.0 mmol/l or 190 mg/dl); and mean total cholesterol concentration
Part 6: Templates and Forms 6-3D-5
Section 3D: Data Book Template WHO STEPS Surveillance
Framework Element
Target Indicator
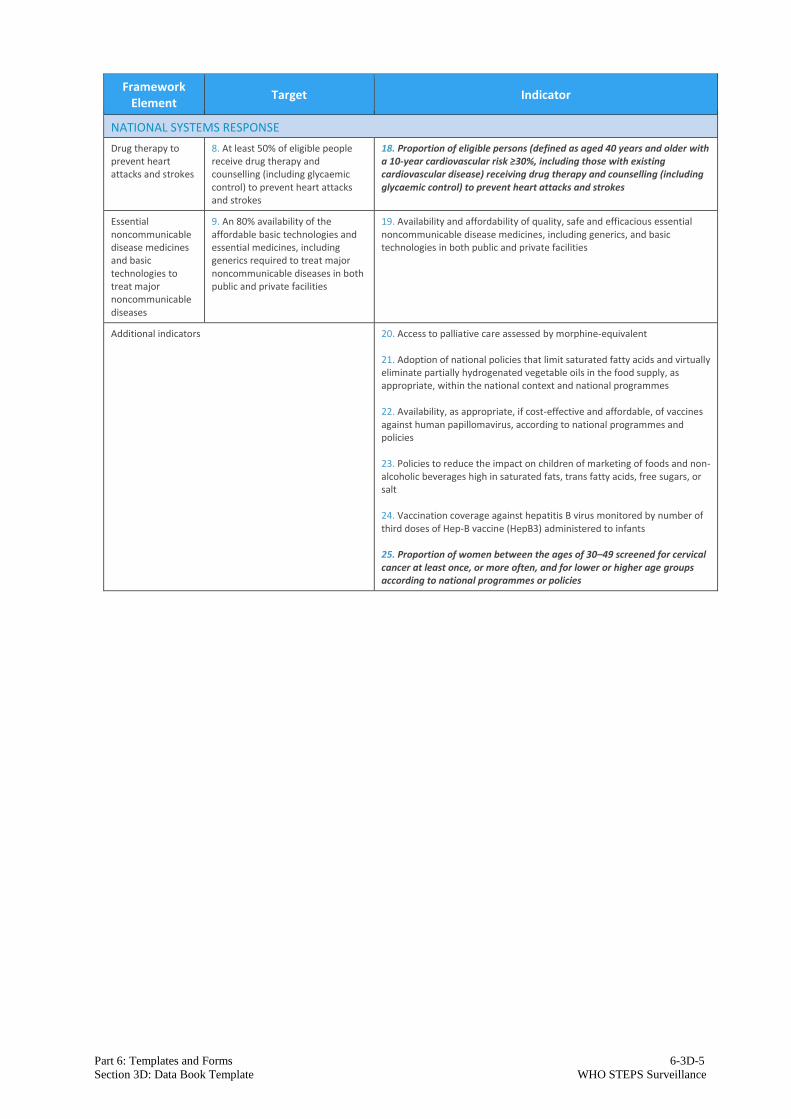
NATIONAL SYSTEMS RESPONSE
Drug therapy to prevent heart attacks and strokes
8. At least 50% of eligible people receive drug therapy and counselling (including glycaemic control) to prevent heart attacks and strokes
18. Proportion of eligible persons (defined as aged 40 years and older with a 10-year cardiovascular risk ≥30%, including those with existing cardiovascular disease) receiving drug therapy and counselling (including glycaemic control) to prevent heart attacks and strokes
Essential noncommunicable disease medicines and basic technologies to treat major noncommunicable diseases
9. An 80% availability of the affordable basic technologies and essential medicines, including generics required to treat major noncommunicable diseases in both public and private facilities
19. Availability and affordability of quality, safe and efficacious essential noncommunicable disease medicines, including generics, and basic technologies in both public and private facilities
Additional indicators 20. Access to palliative care assessed by morphine-equivalent 21. Adoption of national policies that limit saturated fatty acids and virtually eliminate partially hydrogenated vegetable oils in the food supply, as appropriate, within the national context and national programmes 22. Availability, as appropriate, if cost-effective and affordable, of vaccines against human papillomavirus, according to national programmes and policies 23. Policies to reduce the impact on children of marketing of foods and non-alcoholic beverages high in saturated fats, trans fatty acids, free sugars, or salt 24. Vaccination coverage against hepatitis B virus monitored by number of third doses of Hep-B vaccine (HepB3) administered to infants 25. Proportion of women between the ages of 30–49 screened for cervical cancer at least once, or more often, and for lower or higher age groups according to national programmes or policies

Part 6: Templates and Forms 6-3D-6
Section 3D: Data Book Template WHO STEPS Surveillance
Sampling and Response Proportions
Response
proportions Description: Summary results for overall response proportions.
Response proportions
Age Group (years)
Men Women Both Sexes
Eligible Responded Eligible Responded Eligible Responded
n n % n n % n n %
18-29
30-44
45-59
60-69
18-69
Analysis Information:
• Use the age and sex information for the non-responders (if available) plus the Epi Info
program Cagesex.

Part 6: Templates and Forms 6-3D-7
Section 3D: Data Book Template WHO STEPS Surveillance
Demographic Information Results
Age
group by
sex
Description: Summary information by age group and sex of the respondents.
Instrument question:
• Sex
• What is your date of birth?
Age group and sex of respondents
Age Group (years)
Men Women Both Sexes
n % n % n %
18-29
30-44
45-59
60-69
18-69
Analysis Information:
• Questions used: C1, C2, C3
• Epi Info program name: Cagesex (unweighted)
Education Description: Mean number of years of education among respondents.
Instrument question:
• In total, how many years have you spent at school or in full-time study (excluding
pre-school)?
Mean number of years of education
Age Group (years)
Men Women Both Sexes
n Mean n Mean n Mean
18-29
30-44
45-59
60-69
18-69
Analysis Information:
• Questions used: C4
• Epi Info program name: Ceduyears (unweighted)
Part 6: Templates and Forms 6-3D-8
Section 3D: Data Book Template WHO STEPS Surveillance
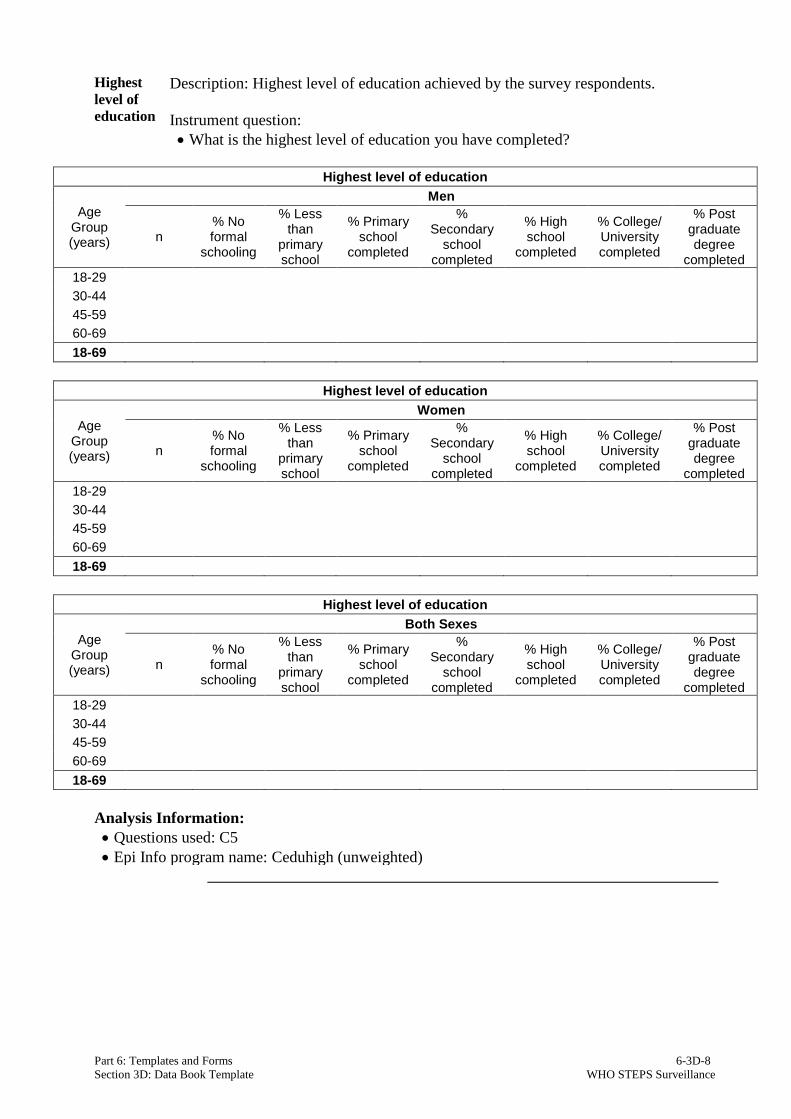
Highest
level of
education
Description: Highest level of education achieved by the survey respondents.
Instrument question:
• What is the highest level of education you have completed?
Highest level of education
Age Group (years)
Men
n % No formal
schooling
% Less than
primary school
% Primary school
completed
% Secondary
school completed
% High school
completed
% College/ University completed
% Post graduate degree
completed
18-29
30-44
45-59
60-69
18-69
Highest level of education
Age Group (years)
Women
n % No formal
schooling
% Less than
primary school
% Primary school
completed
% Secondary
school completed
% High school
completed
% College/ University completed
% Post graduate degree
completed
18-29
30-44
45-59
60-69
18-69
Highest level of education
Age Group (years)
Both Sexes
n % No formal
schooling
% Less than
primary school
% Primary school
completed
% Secondary
school completed
% High school
completed
% College/ University completed
% Post graduate degree
completed
18-29
30-44
45-59
60-69
18-69
Analysis Information:
• Questions used: C5
• Epi Info program name: Ceduhigh (unweighted)
Part 6: Templates and Forms 6-3C-9
Section 3C: Data Book Template WHO STEPS Surveillance
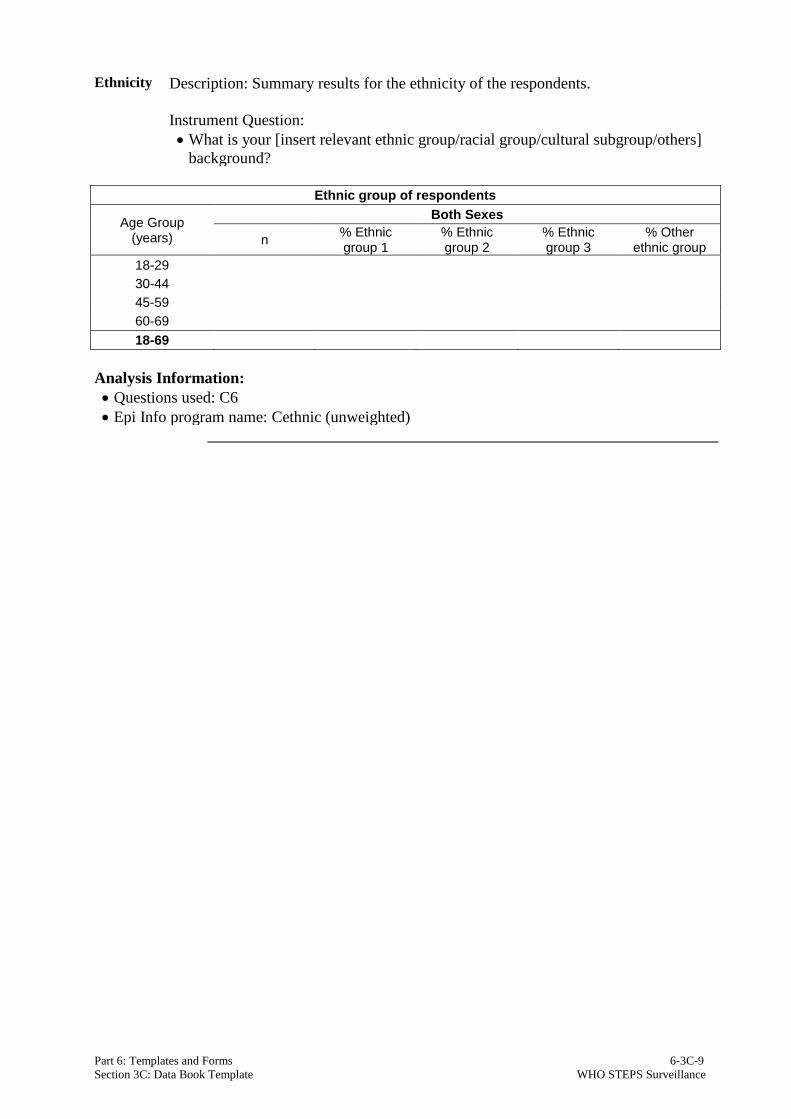
Ethnicity Description: Summary results for the ethnicity of the respondents.
Instrument Question:
• What is your [insert relevant ethnic group/racial group/cultural subgroup/others]
background?
Ethnic group of respondents
Age Group (years)
Both Sexes
n % Ethnic group 1
% Ethnic group 2
% Ethnic group 3
% Other ethnic group
18-29
30-44
45-59
60-69
18-69
Analysis Information:
• Questions used: C6
• Epi Info program name: Cethnic (unweighted)

Part 6: Templates and Forms 6-3C-10
Section 3C: Data Book Template WHO STEPS Surveillance
Martial
status Description: Marital status of survey respondents.
Instrument question:
• What is your marital status?
Marital status
Age Group (years)
Men
n % Never married
% Currently married
% Separated
% Divorced %
Widowed %
Cohabiting
18-29
30-44
45-59
60-69
18-69
Marital status
Age Group (years)
Women
n % Never married
% Currently married
% Separated
% Divorced %
Widowed %
Cohabiting
18-29
30-44
45-59
60-69
18-69
Marital status
Age Group (years)
Both Sexes
n % Never married
% Currently married
% Separated
% Divorced %
Widowed %
Cohabiting
18-29
30-44
45-59
60-69
18-69
Analysis Information:
• Questions used: C7
• Epi Info program name: Cmaritalstatus (unweighted)
Part 6: Templates and Forms 6-3C-11
Section 3C: Data Book Template WHO STEPS Surveillance
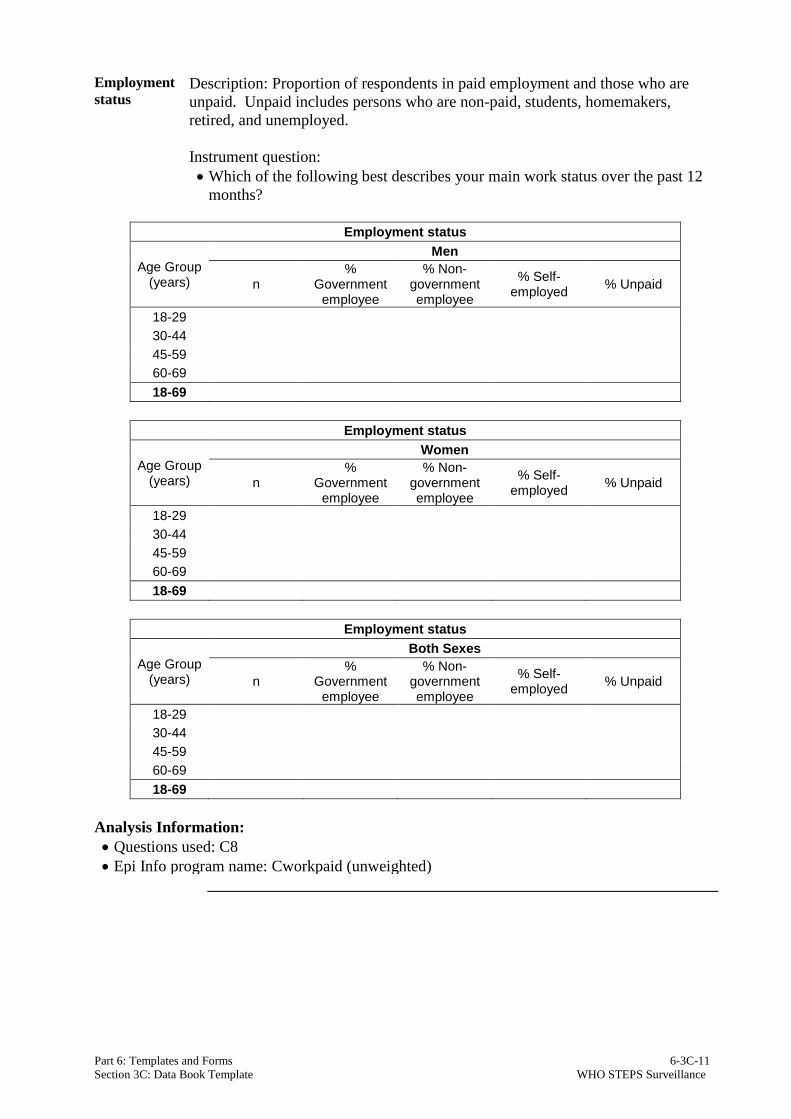
Employment
status Description: Proportion of respondents in paid employment and those who are
unpaid. Unpaid includes persons who are non-paid, students, homemakers,
retired, and unemployed.
Instrument question:
• Which of the following best describes your main work status over the past 12
months?
Employment status
Age Group (years)
Men
n %
Government employee
% Non-government employee
% Self-employed
% Unpaid
18-29
30-44
45-59
60-69
18-69
Employment status
Age Group (years)
Women
n %
Government employee
% Non-government employee
% Self-employed
% Unpaid
18-29
30-44
45-59
60-69
18-69
Employment status
Age Group (years)
Both Sexes
n %
Government employee
% Non-government employee
% Self-employed
% Unpaid
18-29
30-44
45-59
60-69
18-69
Analysis Information:
• Questions used: C8
• Epi Info program name: Cworkpaid (unweighted)

Part 6: Templates and Forms 6-3C-12
Section 3C: Data Book Template WHO STEPS Surveillance
Unpaid
work and
unemployed
Description: Proportion of respondents in unpaid work.
Instrument question:
• Which of the following best describes your main work status over the past 12
months?
Unpaid work and unemployed
Age Group (years)
Men
n % Non-
paid % Student
% Home- maker
% Retired
Unemployed
% Able to work
% Not able to work
18-29
30-44
45-59
60-69
18-69
Unpaid work and unemployed
Age Group (years)
Women
n % Non-
paid % Student
% Home- maker
% Retired Unemployed
% Able to work
% Not able to work
18-29
30-44
45-59
60-69
18-69
Unpaid work and unemployed
Age Group (years)
Both Sexes
n % Non-
paid % Student
% Home- maker
% Retired
Unemployed
% Able to work
% Not able to work
18-29
30-44
45-59
60-69
18-69
Analysis Information:
• Questions used: C8
• Epi Info program name: Cworknotpaid (unweighted)
Part 6: Templates and Forms 6-3C-13
Section 3C: Data Book Template WHO STEPS Surveillance
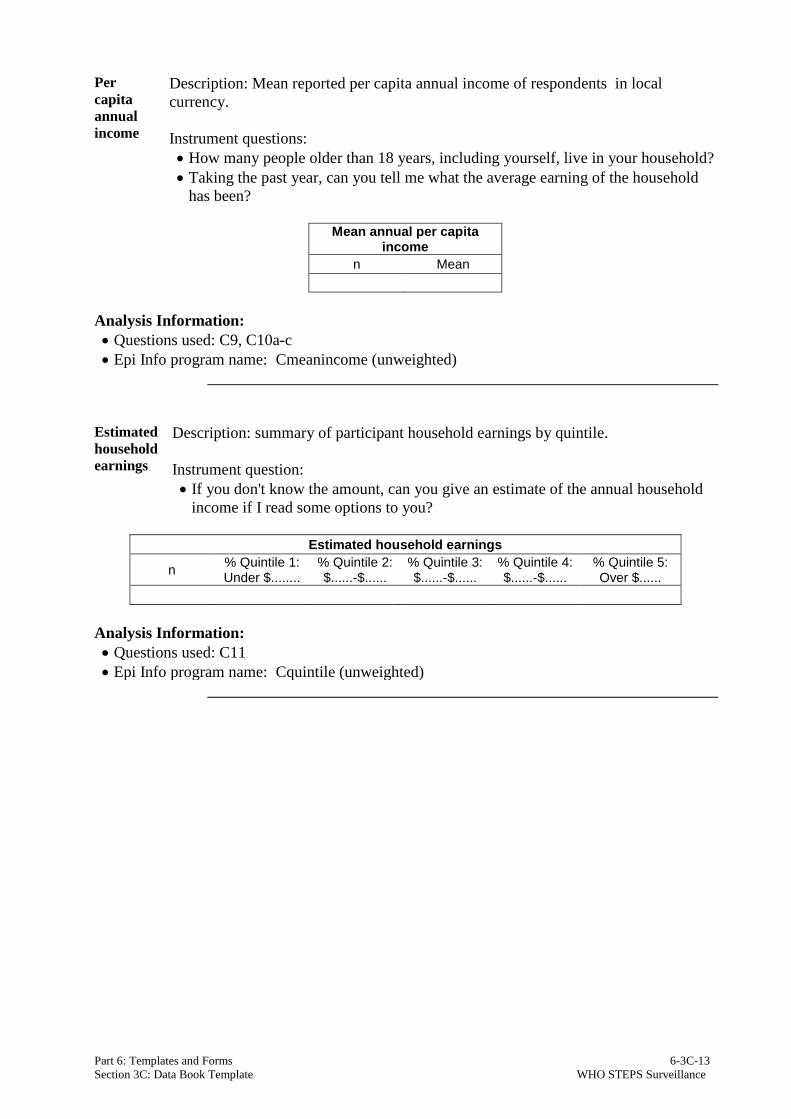
Per
capita
annual
income
Description: Mean reported per capita annual income of respondents in local
currency.
Instrument questions:
• How many people older than 18 years, including yourself, live in your household?
• Taking the past year, can you tell me what the average earning of the household
has been?
Mean annual per capita
income
n Mean
Analysis Information:
• Questions used: C9, C10a-c
• Epi Info program name: Cmeanincome (unweighted)
Estimated
household
earnings
Description: summary of participant household earnings by quintile.
Instrument question:
• If you don't know the amount, can you give an estimate of the annual household
income if I read some options to you?
Estimated household earnings
n % Quintile 1: Under $........
% Quintile 2: $......-$......
% Quintile 3: $......-$......
% Quintile 4: $......-$......
% Quintile 5: Over $......
Analysis Information:
• Questions used: C11
• Epi Info program name: Cquintile (unweighted)

Part 6: Templates and Forms 6-3C-14
Section 3C: Data Book Template WHO STEPS Surveillance
Tobacco Use
Current
smoking Description: Current smokers among all respondents.
Instrument question:
• Do you currently smoke any tobacco products, such as cigarettes, cigars, or pipes?
Percentage of current smokers
Age Group (years)
Men Women Both Sexes
n %
Current smoker
95% CI n %
Current smoker
95% CI n %
Current smoker
95% CI
18-29
30-44
45-59
60-69
18-69
Analysis Information:
• Questions used: T1, T2, T8
• Epi Info program name: Tsmokestatus (unweighted); TsmokestatusWT (weighted)
Part 6: Templates and Forms 6-3C-15
Section 3C: Data Book Template WHO STEPS Surveillance
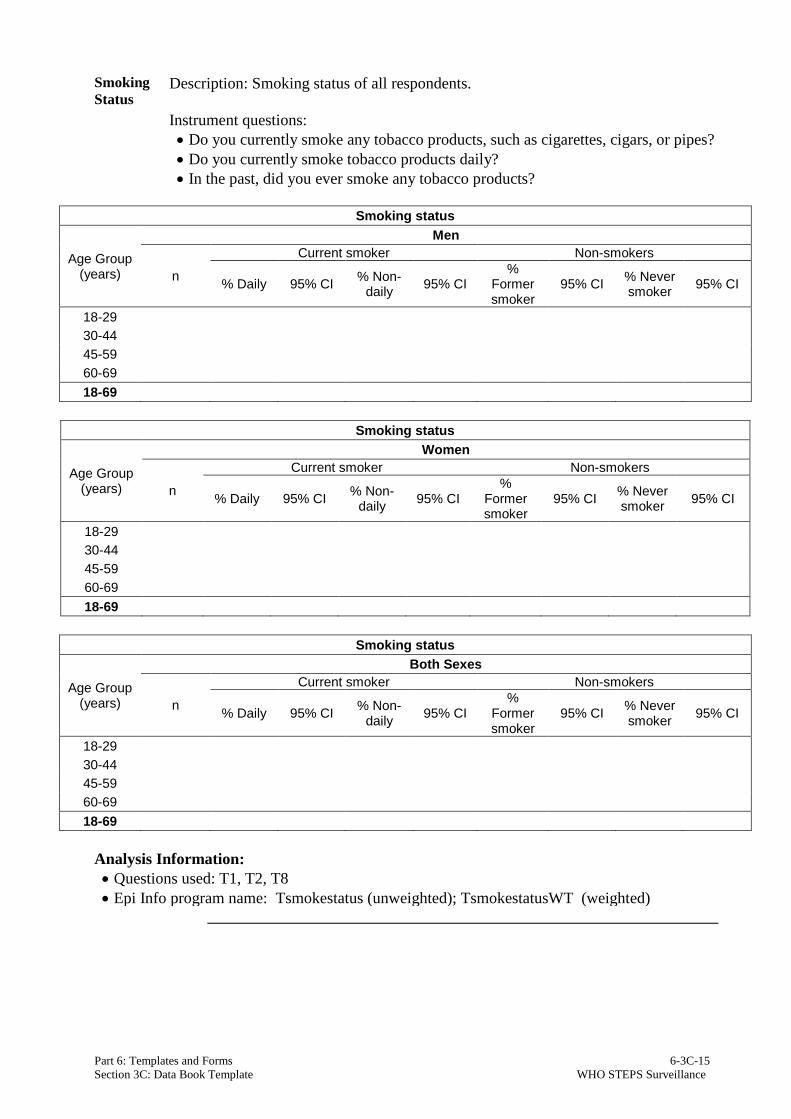
Smoking
Status Description: Smoking status of all respondents.
Instrument questions:
• Do you currently smoke any tobacco products, such as cigarettes, cigars, or pipes?
• Do you currently smoke tobacco products daily?
• In the past, did you ever smoke any tobacco products?
Smoking status
Age Group (years)
Men
n
Current smoker Non-smokers
% Daily 95% CI % Non-
daily 95% CI
% Former smoker
95% CI % Never smoker
95% CI
18-29
30-44
45-59
60-69
18-69
Smoking status
Age Group (years)
Women
n
Current smoker Non-smokers
% Daily 95% CI % Non-
daily 95% CI
% Former smoker
95% CI % Never smoker
95% CI
18-29
30-44
45-59
60-69
18-69
Smoking status
Age Group (years)
Both Sexes
n
Current smoker Non-smokers
% Daily 95% CI % Non-
daily 95% CI
% Former smoker
95% CI % Never smoker
95% CI
18-29
30-44
45-59
60-69
18-69
Analysis Information:
• Questions used: T1, T2, T8
• Epi Info program name: Tsmokestatus (unweighted); TsmokestatusWT (weighted)

Part 6: Templates and Forms 6-3C-16
Section 3C: Data Book Template WHO STEPS Surveillance
Daily
smoking Description: Percentage of current daily smokers among smokers.
Instrument questions:
• Do you currently smoke any tobacco products, such as cigarettes, cigars, or pipes?
• Do you currently smoke tobacco products daily?
Current daily smokers among smokers
Age Group (years)
Men Women Both Sexes
n % Daily smokers
95% CI n % Daily smokers
95% CI n % Daily smokers
95% CI
18-29
30-44
45-59
60-69
18-69
Analysis Information:
• Questions used: T1, T2
• Epi Info program name: Tsmokefreq (unweighted); TsmokefreqWT (weighted)
Initiation
and
duration
of
smoking
Description: Mean age of initiation and mean duration of smoking, in years, among
daily smokers (no total age group for mean duration of smoking as age influences
these values).
Instrument questions:
• Do you currently smoke any tobacco products, such as cigarettes, cigars, or pipes?
• Do you currently smoke tobacco products daily?
• How old were you when you first started smoking?
• Do you remember how long ago it was?
Mean age started smoking
Age Group (years)
Men Women Both Sexes
n Mean age
95% CI n Mean age
95% CI n Mean age
95% CI
18-29
30-44
45-59
60-69
18-69
Mean duration of smoking
Age Group (years)
Men Women Both Sexes
n Mean
duration 95% CI n
Mean duration
95% CI n Mean
duration 95% CI
18-29
30-44
45-59
60-69
Analysis Information:
• Questions used: T1, T2, T3, T4a-c
• Epi Info program name: Tsmokeagetime (unweighted); TsmokeagetimeWT (weighted)

Part 6: Templates and Forms 6-3C-17
Section 3C: Data Book Template WHO STEPS Surveillance
Manufactured
cigarette
smokers
Description: Percentage of smokers who use manufactured cigarettes among
daily smokers and among current smokers.
Instrument questions:
• Do you currently smoke any tobacco products, such as cigarettes, cigars, or
pipes?
• Do you currently smoke tobacco products daily?
• On average, how many of the following products do you smoke each day?
Manufactured cigarette smokers among daily smokers
Age Group (years)
Men Women Both Sexes
n
% Manu-
factured cigarette smoker
95% CI n
% Manu-
factured cigarette smoker
95% CI n
% Manu-
factured cigarette smoker
95% CI
18-29
30-44
45-59
60-69
18-69
Manufactured cigarette smokers among current smokers
Age Group (years)
Men Women Both Sexes
n
% Manu-
factured cigarette smoker
95% CI n
% Manu-
factured cigarette smoker
95% CI n
% Manu-
factured cigarette smoker
95% CI
18-29
30-44
45-59
60-69
18-69
Analysis Information:
• Questions used: T1, T2, T5a, T5aw
• Epi Info program name: Tsmokeman (unweighted); TsmokemanWT (weighted)

Part 6: Templates and Forms 6-3C-18
Section 3C: Data Book Template WHO STEPS Surveillance
Amount
of
tobacco
used
among
daily
smokers
by type
Description: Mean amount of tobacco used by daily smokers per day, by type.
Instrument questions:
• Do you currently smoke any tobacco products, such as cigarettes, cigars, or pipes?
• Do you currently smoke tobacco products daily?
• On average, how many of the following products do you smoke each day?
Mean amount of tobacco used by daily smokers by type
Age Group (years)
Men
n Mean # of
manufactured cig.
95% CI n Mean # of
hand-rolled cig.
95% CI n Mean # of pipes of tobacco
95% CI
18-29
30-44
45-59
60-69
18-69
Mean amount of tobacco used by daily smokers by type
Age Group (years)
Men
n
Mean # of cigars,
cheerots, cigarillos
95% CI n Mean # of
shisha sessions
95% CI n Mean # of other type of tobacco
95% CI
18-29
30-44
45-59
60-69
18-69
Mean amount of tobacco used by daily smokers by type
Age Group (years)
Women
n Mean # of
manufactured cig.
95% CI n Mean # of
hand-rolled cig.
95% CI n Mean # of pipes of tobacco
95% CI
18-29
30-44
45-59
60-69
18-69

Part 6: Templates and Forms 6-3C-19
Section 3C: Data Book Template WHO STEPS Surveillance
Mean amount of tobacco used by daily smokers by type
Age Group (years)
Women
n
Mean # of cigars,
cheerots, cigarillos
95% CI n Mean # of
shisha sessions
95% CI n Mean # of other type of tobacco
95% CI
18-29
30-44
45-59
60-69
18-69
Mean amount of tobacco used by daily smokers by type
Age Group (years)
Both Sexes
n Mean # of
manufactured cig.
95% CI n Mean # of
hand-rolled cig.
95% CI n Mean # of pipes of tobacco
95% CI
18-29
30-44
45-59
60-69
18-69
Mean amount of tobacco used by daily smokers by type
Age Group (years)
Both Sexes
n
Mean # of cigars,
cheerots, cigarillos
95% CI n Mean # of
shisha sessions
95% CI n Mean # of other type of tobacco
95% CI
18-29
30-44
45-59
60-69
18-69
Analysis Information:
• Questions used: T1, T2, T5a-T5f
• Epi Info program name: Tsmoketype (unweighted); TsmoketypeWT (weighted)

Part 6: Templates and Forms 6-3C-20
Section 3C: Data Book Template WHO STEPS Surveillance
Smoked
tobacco
consump-
tion
Description: Percentage of current smokers who smoke each of the following
products.
Instrument questions:
• Do you currently smoke any tobacco products, such as cigarettes, cigars, or pipes?
• Do you currently smoke tobacco products daily?
• On average, how many of the following products do you smoke each day/week?
Percentage of current smokers smoking each of the following products
Age Group (years)
Men
n % Manuf. cigs. 95% CI n % Hand-
rolled cigs.
95% CI n % Pipes
of tobacco
95% CI
18-29
30-44
45-59
60-69
18-69
Percentage of current smokers smoking each of the following products
Age Group (years)
Men
n % Cigars, cheroots, cigarillos
95% CI n % Shisha 95% CI n % Other 95% CI
18-29
30-44
45-59
60-69
18-69
Percentage of current smokers smoking each of the following products
Age Group (years)
Women
n % Manuf. cigs. 95% CI n % Hand-
rolled cigs.
95% CI n % Pipes
of tobacco
95% CI
18-29
30-44
45-59
60-69
18-69

Part 6: Templates and Forms 6-3C-21
Section 3C: Data Book Template WHO STEPS Surveillance
Percentage of current smokers smoking each of the following products
Age Group (years)
Women
n % Cigars, cheroots, cigarillos
95% CI n % Shisha 95% CI n % Other 95% CI
18-29
30-44
45-59
60-69
18-69
Percentage of current smokers smoking each of the following products
Age Group (years)
Both Sexes
n % Manuf. cigs. 95% CI n % Hand-
rolled cigs.
95% CI n % Pipes
of tobacco
95% CI
18-29
30-44
45-59
60-69
18-69
Percentage of current smokers smoking each of the following products
Age Group (years)
Both Sexes
n % Cigars, cheroots, cigarillos
95% CI n % Shisha 95% CI n % Other 95% CI
18-29
30-44
45-59
60-69
18-69
Analysis Information:
• Questions used: T1, T2, T5a-T5fw
• Epi Info program name: Tsmoketypeprev (unweighted); TsmoketypeprevWT (weighted)

Part 6: Templates and Forms 6-3C-22
Section 3C: Data Book Template WHO STEPS Surveillance
Frequency
of daily
cigarette
smoking
Description: Percentage of daily cigarette smokers smoking given quantities of
manufactured or hand-rolled cigarettes per day.
Instrument questions:
• Do you currently smoke any tobacco products, such as cigarettes, cigars, or pipes?
• Do you currently smoke tobacco products daily?
• On average, how many of the following products do you smoke each day?
Percentage of daily smokers smoking given quantities of manufactured or hand-rolled cigarettes per day
Age Group (years)
Men
n % <5 Cigs.
95% CI % 5-9 Cigs.
95% CI % 10-14
Cigs. 95% CI
% 15-24 Cigs.
95% CI %
≥ 25 Cigs.
95% CI
18-29
30-44
45-59
60-69
18-69
Percentage of daily smokers smoking given quantities of manufactured or hand-rolled cigarettes per day
Age Group (years)
Women
n % <5 Cigs.
95% CI % 5-9 Cigs.
95% CI % 10-14
Cigs. 95% CI
% 15-24 Cigs.
95% CI %
≥ 25 Cigs.
95% CI
18-29
30-44
45-59
60-69
18-69
Percentage of daily smokers smoking given quantities of manufactured or hand-rolled cigarettes per day
Age Group (years)
Both Sexes
n % <5 Cigs.
95% CI % 5-9 Cigs.
95% CI % 10-14
Cigs. 95% CI
% 15-24 Cigs.
95% CI %
≥ 25 Cigs.
95% CI
18-29
30-44
45-59
60-69
18-69
Analysis Information:
• Questions used: T1, T2, T5a, T5b
• Epi Info program name: Tcig (unweighted); TcigWT (weighted)

Part 6: Templates and Forms 6-3C-23
Section 3C: Data Book Template WHO STEPS Surveillance
Former
daily
smokers
and
former
smokers
Description: Percentage of former daily smokers among all respondents and among
ever daily smokers, and the mean duration, in years, since former smokers quit
smoking.
Instrument questions:
• Do you currently smoke any tobacco products, such as cigarettes, cigars, or pipes?
• Do you currently smoke tobacco products daily?
• In the past did you ever smoke any tobacco products?
• In the past, did you ever smoke daily?
• How old were you when you stopped smoking?
Former daily smokers (who don’t smoke currently) among all respondents
Age Group (years)
Men Women Both Sexes
n
% Former
daily smokers
95% CI n
% Former
daily smokers
95% CI n
% Former
daily smokers
95% CI
18-29
30-44
45-59
60-69
18-69
Former daily smokers (who don’t smoke currently) among ever daily smokers
Age Group (years)
Men Women Both Sexes
n
% Former
daily smokers
95% CI n
% Former
daily smokers
95% CI n
% Former
daily smokers
95% CI
18-29
30-44
45-59
60-69
18-69
Mean years since cessation
Age Group (years)
Men Women Both Sexes
n Mean years
95% CI n Mean years
95% CI n Mean years
95% CI
18-29
30-44
45-59
60-69
18-69
Analysis Information:
• Questions used: T1, T2, T8, T9, T10, T11a-c
• Epi Info program name: Tsmokeexdaily (unweighted); TsmokeexdailyWT (weighted)

Part 6: Templates and Forms 6-3C-24
Section 3C: Data Book Template WHO STEPS Surveillance
Cessation Description: Percentage of current smokers who have tried to stop smoking during
the past 12 months.
Instrument questions:
• Do you currently smoke any tobacco products, such as cigarettes, cigars, or pipes?
• During the past 12 months, have you tried to stop smoking?
Current smokers who have tried to stop smoking
Age Group (years)
Men Women Both Sexes
n % Tried to stop
smoking 95% CI n
% Tried to stop
smoking 95% CI n
% Tried to stop
smoking 95% CI
18-29
30-44
45-59
60-69
18-69
Analysis Information:
• Questions used: T1, T2, T6
• Epi Info program name: Tcessation (unweighted); TcessationWT (weighted)
Advice to
stop
smoking
Description: Percentage of current smokers who have been advised by a doctor or
other health worker to stop smoking, among those smokers who have had a visit to
a doctor or other health worker in the past 12 months.
Instrument questions:
• Do you currently smoke any tobacco products, such as cigarettes, cigars, or
pipes?
• During any visit to a doctor or other health worker in the past 12 months, were
you advised to quit smoking tobacco?
Current smokers who have been advised by doctor to stop smoking
Age Group (years)
Men Women Both Sexes
n
% Advised to stop
smoking
95% CI n
% Advised to stop
smoking
95% CI n
% Advised to stop
smoking
95% CI
18-29
30-44
45-59
60-69
18-69
Analysis Information:
• Questions used: T1, T2, T7
• Epi Info program name: Tcessation (unweighted); TcessationWT (weighted)

Part 6: Templates and Forms 6-3C-25
Section 3C: Data Book Template WHO STEPS Surveillance
Current
users of
smokeless
tobacco
Description: Percentage of current users of smokeless tobacco among all
respondents.
Instrument question:
• Do you currently use any smokeless tobacco such as [snuff, chewing tobacco,
betel]?
Current users of smokeless tobacco
Age Group (years)
Men Women Both Sexes
n %
Current users
95% CI n %
Current users
95% CI n %
Current users
95% CI
18-29
30-44
45-59
60-69
18-69
Analysis Information:
• Questions used: T12, T13, T15
• Epi Info program name: Tsmokelessstatus (unweighted); TsmokelessstatusWT (weighted)

Part 6: Templates and Forms 6-3C-26
Section 3C: Data Book Template WHO STEPS Surveillance
Status of
smokeless
tobacco
use
Description: Status of using smokeless tobacco among all respondents.
Instrument questions:
• Do you currently use any smokeless tobacco such as [snuff, chewing tobacco,
betel]?
• Do you currently use smokeless tobacco products daily?
• In the past, did you ever use smokeless tobacco such as [snuff, chewing tobacco,
betel]?
Smokeless tobacco use
Age Group (years)
Men
n
Current user Non user
% Daily 95% CI % Non-
daily 95% CI
% Past user
95% CI % Never
used 95% CI
18-29
30-44
45-59
60-69
18-69
Smokeless tobacco use
Age Group (years)
Women
n
Current user Non user
% Daily 95% CI % Non-
daily 95% CI
% Past user
95% CI % Never
used 95% CI
18-29
30-44
45-59
60-69
18-69
Smokeless tobacco use
Age Group (years)
Both Sexes
n
Current user Non user
% Daily 95% CI % Non-
daily 95% CI
% Past user
95% CI % Never
used 95% CI
18-29
30-44
45-59
60-69
18-69
Analysis Information:
• Questions used: T12, T13, T15
• Epi Info program name: Tsmokelessstatus (unweighted); TsmokelessstatusWT (weighted)

Part 6: Templates and Forms 6-3C-27
Section 3C: Data Book Template WHO STEPS Surveillance
Former
daily users
of
smokeless
tobacco
Description: Percentage of former daily users of smokeless tobacco among all
respondents and among ever daily users.
Instrument questions:
• Do you currently use any smokeless tobacco such as [snuff, chewing tobacco,
betel]?
• Do you currently use smokeless tobacco products daily?
• In the past, did you ever use smokeless tobacco such as [snuff, chewing tobacco,
betel]?
• In the past, did you ever use smokeless tobacco such as [snuff, chewing tobacco,
betel] daily?
Former daily smokeless tobacco users (who don't use tobacco currently) among all respondents
Age Group (years)
Men Women Both Sexes
n
% Former
daily users
95% CI n
% Former
daily users
95% CI n
% Former
daily users
95% CI
18-29
30-44
45-59
60-69
18-69
Analysis Information:
• Questions used: T12, T13, T15, T16
• Epi Info program name: Tsmokelessexdaily (unweighted); TsmokelessexdailyWT (weighted)
Former daily smokeless tobacco users (who don’t use tobacco currently) among ever daily users
Age Group (years)
Men Women Both Sexes
n
% Former
daily users
95% CI n
% Former
daily users
95% CI n
% Former
daily users
95% CI
18-29
30-44
45-59
60-69
18-69
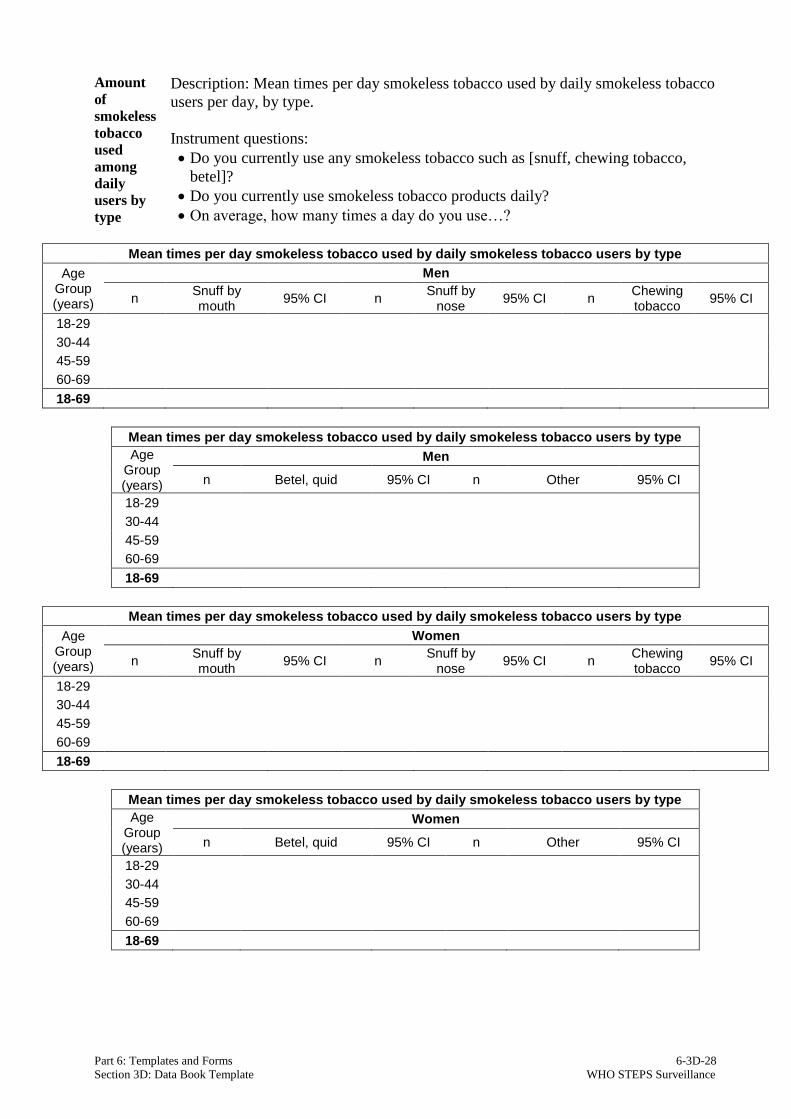
Part 6: Templates and Forms 6-3D-28
Section 3D: Data Book Template WHO STEPS Surveillance
Amount
of
smokeless
tobacco
used
among
daily
users by
type
Description: Mean times per day smokeless tobacco used by daily smokeless tobacco
users per day, by type.
Instrument questions:
• Do you currently use any smokeless tobacco such as [snuff, chewing tobacco,
betel]?
• Do you currently use smokeless tobacco products daily?
• On average, how many times a day do you use…?
Mean times per day smokeless tobacco used by daily smokeless tobacco users by type
Age Group (years)
Men
n Snuff by mouth
95% CI n Snuff by
nose 95% CI n
Chewing tobacco
95% CI
18-29
30-44
45-59
60-69
18-69
Mean times per day smokeless tobacco used by daily smokeless tobacco users by type
Age Group (years)
Men
n Betel, quid 95% CI n Other 95% CI
18-29
30-44
45-59
60-69
18-69
Mean times per day smokeless tobacco used by daily smokeless tobacco users by type
Age Group (years)
Women
n Snuff by mouth
95% CI n Snuff by
nose 95% CI n
Chewing tobacco
95% CI
18-29
30-44
45-59
60-69
18-69
Mean times per day smokeless tobacco used by daily smokeless tobacco users by type
Age Group (years)
Women
n Betel, quid 95% CI n Other 95% CI
18-29
30-44
45-59
60-69
18-69

Part 6: Templates and Forms 6-3C-29
Section 3C: Data Book Template WHO STEPS Surveillance
Mean times per day smokeless tobacco used by daily smokeless tobacco users by type
Age Group (years)
Both Sexes
n Snuff by mouth
95% CI n Snuff by
nose 95% CI n
Chewing tobacco
95% CI
18-29
30-44
45-59
60-69
18-69
Mean times per day smokeless tobacco used by daily smokeless tobacco users by type
Age Group (years)
Both Sexes
n Betel, quid 95% CI n Other 95% CI
18-29
30-44
45-59
60-69
18-69
Analysis Information:
• Questions used: T12, T13, T14a-otherw
• Epi Info program name: Tsmokelesstype (unweighted); TsmokelesstypeWT (weighted)

Part 6: Templates and Forms 6-3C-30
Section 3C: Data Book Template WHO STEPS Surveillance
Smokeless
tobacco
consump-
tion
Description: Percentage of current users of smokeless tobacco who use each of the
following products.
Instrument questions:
• Do you currently use any smokeless tobacco such as [snuff, chewing tobacco,
betel]?
• Do you currently use smokeless tobacco products daily?
• On average, how many times a day/week do you use…?
Percentage of current users of smokeless tobacco using each of the following products
Age Group (years)
Men
n % Snuff by
mouth 95% CI
% Snuff by nose
95% CI %
Chewing tobacco
95% CI Chewing tobacco
95% CI
18-29
30-44
45-59
60-69
18-69
Percentage of current users of smokeless tobacco using each of the following products
Age Group (years)
Men
n % Betel, quid 95% CI %
Other 95% CI 95% CI
18-29
30-44
45-59
60-69
18-69
Percentage of current users of smokeless tobacco using each of the following products
Age Group (years)
Women
n % Snuff by
mouth 95% CI
% Snuff by nose
95% CI %
Chewing tobacco
95% CI Chewing tobacco
95% CI
18-29
30-44
45-59
60-69
18-69
Percentage of current users of smokeless tobacco using each of the following products
Age Group (years)
Women
n % Betel, quid 95% CI %
Other 95% CI 95% CI
18-29
30-44
45-59
60-69
18-69

Part 6: Templates and Forms 6-3C-31
Section 3C: Data Book Template WHO STEPS Surveillance
Percentage of current users of smokeless tobacco using each of the following products
Age Group (years)
Both Sexes
n % Snuff by
mouth 95% CI
% Snuff by nose
95% CI %
Chewing tobacco
95% CI Chewing tobacco
95% CI
18-29
30-44
45-59
60-69
18-69
Percentage of current users of smokeless tobacco using each of the following products
Age Group (years)
Both Sexes
n % Betel, quid 95% CI %
Other 95% CI 95% CI
18-29
30-44
45-59
60-69
18-69
Analysis Information:
• Questions used: T12, T13, T14a-otherw
• Epi Info program name: Tsmokelesstypeprev (unweighted); TsmokelesstypeprevWT
(weighted)
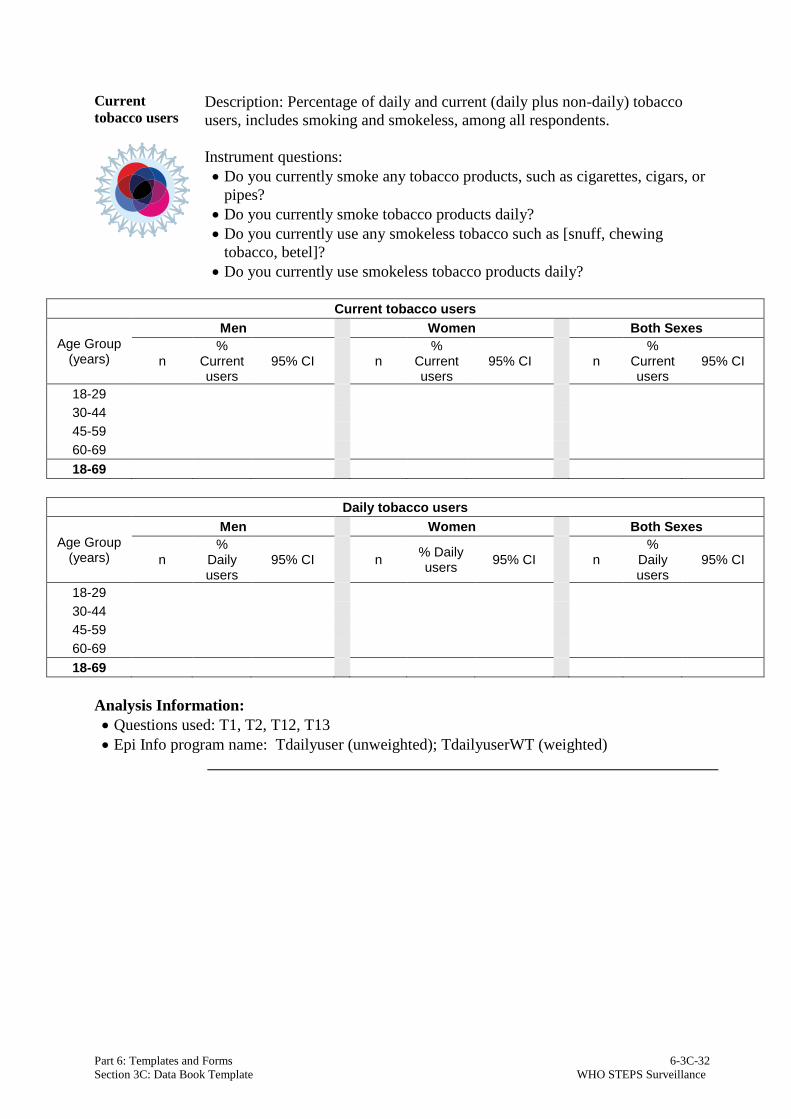
Part 6: Templates and Forms 6-3C-32
Section 3C: Data Book Template WHO STEPS Surveillance
Current
tobacco users
Description: Percentage of daily and current (daily plus non-daily) tobacco
users, includes smoking and smokeless, among all respondents.
Instrument questions:
• Do you currently smoke any tobacco products, such as cigarettes, cigars, or
pipes?
• Do you currently smoke tobacco products daily?
• Do you currently use any smokeless tobacco such as [snuff, chewing
tobacco, betel]?
• Do you currently use smokeless tobacco products daily?
Current tobacco users
Age Group (years)
Men Women Both Sexes
n %
Current users
95% CI n %
Current users
95% CI n %
Current users
95% CI
18-29
30-44
45-59
60-69
18-69
Daily tobacco users
Age Group (years)
Men Women Both Sexes
n %
Daily users
95% CI n % Daily users
95% CI n %
Daily users
95% CI
18-29
30-44
45-59
60-69
18-69
Analysis Information:
• Questions used: T1, T2, T12, T13
• Epi Info program name: Tdailyuser (unweighted); TdailyuserWT (weighted)

Part 6: Templates and Forms 6-3C-33
Section 3C: Data Book Template WHO STEPS Surveillance
Exposure
to second-
hand
smoke in
home in
past 30
days
Description: Percentage of respondents exposed second-hand smoke in the home in
the past 30 days.
Instrument question:
• In the past 30 days, did someone smoke in your home?
Exposed to second-hand smoke in home during the past 30 days
Age Group (years)
Men Women Both Sexes
n %
Exposed 95% CI n
% Exposed
95% CI n %
Exposed 95% CI
18-29
30-44
45-59
60-69
18-69
Analysis Information:
• Questions used: T17
• Epi Info program name: Tetshome (unweighted); TetshomeWT (weighted)
Exposure
to second-
hand
smoke in
the
workplace
in past 30
days
Description: Percentage of respondents exposed to second-hand smoke in the
workplace in the past 30 days.
Instrument question:
• During the past 30 days, did someone smoke in closed areas in your workplace
(in the building, in a work area or a specific office)?
Exposed to second-hand smoke in the workplace during the past 30 days
Age Group (years)
Men Women Both Sexes
n %
Exposed 95% CI n
% Exposed
95% CI n %
Exposed 95% CI
18-29
30-44
45-59
60-69
18-69
Analysis Information:
• Questions used: T18
• Epi Info program name: Tetswork (unweighted); TetsworkWT (weighted)

Part 6: Templates and Forms 6-3D-34
Section 3D: Data Book Template WHO STEPS Surveillance
Alcohol Consumption
Alcohol
consumption
status
Description: Alcohol consumption status of all respondents.
Instrument questions:
• Have you ever consumed any alcohol such as …?
• Have you consumed any alcohol in the past 12 months?
• Have you consumed any alcohol in the past 30 days?
Alcohol consumption status
Age Group (years)
Men
n
% Current drinker (past 30
days)
95% CI
% Drank in past 12 months,
not current
95% CI
% Past 12
months abstainer
95% CI %
Lifetime abstainer
95% CI
18-29
30-44
45-59
60-69
18-69
Alcohol consumption status
Age Group (years)
Women
n
% Current drinker (past 30
days)
95% CI
% Drank in past 12 months,
not current
95% CI
% Past 12
months abstainer
95% CI %
Lifetime abstainer
95% CI
18-29
30-44
45-59
60-69
18-69
Alcohol consumption status
Age Group (years)
Both Sexes
n
% Current drinker (past 30
days)
95% CI
% Drank in past 12 months,
not current
95% CI
% Past 12
months abstainer
95% CI %
Lifetime abstainer
95% CI
18-29
30-44
45-59
60-69
18-69
Analysis Information:
• Questions used: A1, A2, A5
• Epi Info program name: Aconsumption (unweighted); AconsumptionWT (weighted)

Part 6: Templates and Forms 6-3C-35
Section 3C: Data Book Template WHO STEPS Surveillance
Stopping
drinking
due to
health
reasons
Description: Percentage of former drinkers (those who did not drink during the past
12 months) who stopped drinking due to health reasons, such as a negative impact of
drinking on your health or as per advice of a doctor or other health worker among
those respondents who drank in their lifetime, but not in the last 12 months.
Instrument questions:
• Have you consumed any alcohol in the past 12 months?
• Did you stop drinking due to health reasons, such as a negative impact of drinking
on your health or as per advice of your doctor or other health worker?
Stopping drinking due to health reasons
Age Group (years)
Men Women Both Sexes
n
% stopping due to health
reasons
95% CI n
% stopping due to health
reasons
95% CI n
% stopping due to health
reasons
95% CI
18-29
30-44
45-59
60-69
18-69
Analysis Information:
• Questions used: A1, A2, A3
• Epi Info program name: Astopdrink (unweighted); AstopdrinkWT (weighted)

Part 6: Templates and Forms 6-3C-36
Section 3C: Data Book Template WHO STEPS Surveillance
Frequency
of alcohol
consumption
Description: Frequency of alcohol consumption in the past 12 months among
those respondents who drank in the last 12 months.
Instrument question:
• During the past 12 months, how frequently have you had at least one alcoholic
drink?
Frequency of alcohol consumption in the past 12 months
Age Group (years)
Men
n %
Daily 95% CI
% 5-6 days/ week
95% CI
% 3-4 days/ week
95% CI
% 1-2 days/ week
95% CI
% 1-3 days/ month
95% CI
% < once
a month
95% CI
18-29
30-44
45-59
60-69
18-69
Frequency of alcohol consumption in the past 12 months
Age Group (years)
Women
n %
Daily 95% CI
% 5-6 days/ week
95% CI
% 3-4 days/ week
95% CI
% 1-2 days/ week
95% CI
% 1-3 days/ month
95% CI
% < once
a month
95% CI
18-29
30-44
45-59
60-69
18-69
Frequency of alcohol consumption in the past 12 months
Age Group (years)
Both Sexes
n %
Daily 95% CI
% 5-6 days/ week
95% CI
% 3-4 days/ week
95% CI
% 1-2 days/ week
95% CI
% 1-3 days/ month
95% CI
% < once
a month
95% CI
18-29
30-44
45-59
60-69
18-69
Analysis Information:
• Questions used: A1, A2, A4
• Epi Info program name: Afrequency (unweighted); AfrequencyWT (weighted)

Part 6: Templates and Forms 6-3C-37
Section 3C: Data Book Template WHO STEPS Surveillance
Drinking
occasions
in the
past 30
days
Description: Mean number of occasions with at least one drink in the past 30 days
among current (past 30 days) drinkers.
Instrument question:
• During the past 30 days, on how many occasions did you have at least one
alcoholic drink?
Mean number of drinking occasions in the past 30 days among current (past 30 days) drinkers
Age Group (years)
Men Women Both Sexes
n Mean 95% CI n Mean 95% CI n Mean 95% CI
18-29
30-44
45-59
60-69
18-69
Analysis Information:
• Questions used: A1, A2, A5, A6
• Epi Info program name: Aoccasions (unweighted); AoccasionsWT (weighted)
Standard
drinks
per
drinking
occasion
Description: Mean number of standard drinks consumed on a drinking occasion
among current (past 30 days) drinkers.
Instrument question:
• During the past 30 days, when you drank alcohol, on average, how many standard
alcoholic drinks did you have during one occasion?
Mean number of standard drinks per drinking occasion among current (past 30 days) drinkers
Age Group (years)
Men Women Both Sexes
n Mean 95% CI n Mean 95% CI n Mean 95% CI
18-29
30-44
45-59
60-69
18-69
Analysis Information:
• Questions used: A1, A2, A5, A7
• Epi Info program name: Anumdrinkperday (unweighted); AnumdrinkperdayWT (weighted)

Part 6: Templates and Forms 6-3C-38
Section 3C: Data Book Template WHO STEPS Surveillance
Average
volume
drinking
levels
among all
respondents
Description: Percentage of respondents with different drinking levels.
A standard drink contains approximately 10g of pure alcohol.
Instrument questions:
• During the past 30 days, when you drank alcohol, on average, how many
standard alcoholic drinks did you have during one occasion?
Drinking at high-end level among all respondents (≥60g of pure alcohol on average per occasion among men
and ≥40g of pure alcohol on average per occasion among women)
Age Group (years)
Men Women Both Sexes
n % ≥60g 95% CI n % ≥40g 95% CI n % high-
end level 95% CI
18-29
30-44
45-59
60-69
18-69
Drinking at intermediate level among all respondents (40-59.9g of pure alcohol on average per occasion among
men and 20-39.9g of pure alcohol on average per occasion among women)
Age Group (years)
Men Women Both Sexes
n % 40-59.9g
95% CI n % 20-39.9g
95% CI n %
intermediate level
95% CI
18-29
30-44
45-59
60-69
18-69
Drinking at lower-end level among all respondents (<40g of pure alcohol on average per occasion among men
and <20g of pure alcohol on average per occasion among women)
Age Group (years)
Men Women Both Sexes
n % <40g 95% CI n % <20g 95% CI n % lower-end level
95% CI
18-29
30-44
45-59
60-69
18-69
Analysis Information:
• Questions used: A1, A2, A5, A7
• Epi Info program name: Acategories (unweighted); AcategoriesWT (weighted)

Part 6: Templates and Forms 6-3C-39
Section 3C: Data Book Template WHO STEPS Surveillance
Average
volume
drinking
levels
among
current
(past 30
days)
drinkers
Description: Percentage of current (past 30 days) drinkers with different drinking
levels.
A standard drink contains approximately 10g of pure alcohol.
Instrument questions:
• During the past 30 days, when you drank alcohol, on average, how many
standard alcoholic drinks did you have during one occasion?
High-end, intermediate, and lower-end level drinking among current (past 30 days) drinkers
Age Group (years)
Men
n % high-
end (≥60g)
95% CI %
intermediate (40-59.9g)
95% CI % lower-
end (<40g)
95% CI
18-29
30-44
45-59
60-69
18-69
High-end, intermediate, and lower-end level drinking among current (past 30 days) drinkers
Age Group (years)
Women
n % high-
end (≥40g)
95% CI %
intermediate (20-39.9g)
95% CI % lower-
end (<20g)
95% CI
18-29
30-44
45-59
60-69
18-69
High-end, intermediate, and lower-end level drinking among current (past 30 days) drinkers
Age Group (years)
Both sexes
n % high-
end 95% CI
% intermediate
95% CI % lower-
end 95% CI
18-29
30-44
45-59
60-69
18-69
Analysis Information:
• Questions used: A1, A2, A5, A7
• Epi Info program name: Acategories (unweighted); AcategoriesWT (weighted)
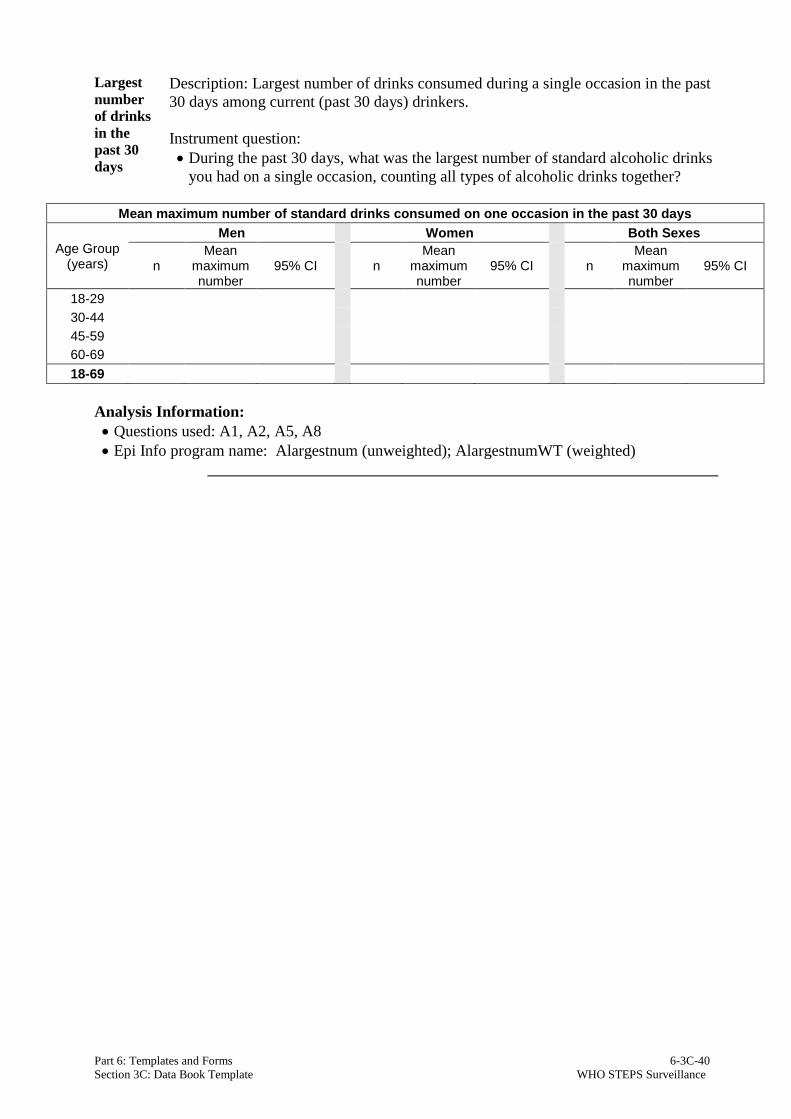
Part 6: Templates and Forms 6-3C-40
Section 3C: Data Book Template WHO STEPS Surveillance
Largest
number
of drinks
in the
past 30
days
Description: Largest number of drinks consumed during a single occasion in the past
30 days among current (past 30 days) drinkers.
Instrument question:
• During the past 30 days, what was the largest number of standard alcoholic drinks
you had on a single occasion, counting all types of alcoholic drinks together?
Mean maximum number of standard drinks consumed on one occasion in the past 30 days
Age Group (years)
Men Women Both Sexes
n Mean
maximum number
95% CI n Mean
maximum number
95% CI n Mean
maximum number
95% CI
18-29
30-44
45-59
60-69
18-69
Analysis Information:
• Questions used: A1, A2, A5, A8
• Epi Info program name: Alargestnum (unweighted); AlargestnumWT (weighted)

Part 6: Templates and Forms 6-3C-41
Section 3C: Data Book Template WHO STEPS Surveillance
Six or more
drinks on a
single occasion
(“heavy
episodic
drinking”)
Description: Percentage of respondents who had six or more drinks on any
occasion in the past 30 days during a single occasion among the total
population.
Instrument question:
• During the past 30 days, how many times did you have six or more
standard alcoholic drinks in a single drinking occasion?
Six or more drinks on a single occasion at least once during the past 30 days among total population
Age Group (years)
Men Women Both Sexes
n % ≥ 6 drinks
95% CI n % ≥ 6 drinks
95% CI n % ≥ 6 drinks
95% CI
18-29
30-44
45-59
60-69
18-69
Analysis Information:
• Questions used: A1, A2, A5, A9
• Epi Info program name: Aepisodic (unweighted); AepisodicWT (weighted)
Six or
more
drinks on
a single
occasion
Description: Mean number of times in the past 30 days on which current (past 30
days) drinkers consumed six or more drinks during a single occasion.
Instrument question:
• During the past 30 days, how many times did you have six or more
standard alcoholic drinks in a single drinking occasion?
Mean number of times with six or more drinks during a single occasion in the past 30 days among current drinkers
Age Group (years)
Men Women Both Sexes
n Mean
number of times
95% CI n Mean
number of times
95% CI n Mean
number of times
95% CI
18-29
30-44
45-59
60-69
18-69
Analysis Information:
• Questions used: A1, A2, A5, A9
• Epi Info program name: Aepisodic (unweighted); AepisodicWT (weighted)

Part 6: Templates and Forms 6-3C-42
Section 3C: Data Book Template WHO STEPS Surveillance
Past 7
days
drinking
Description: Frequency of alcohol consumption in the past 7 days by current (past
30 days) drinkers.
Instrument question:
• During each of the past 7 days, how many standard drinks of any alcoholic drink
did you have each day?
Frequency of alcohol consumption in the past 7 days
Age Group (years)
Men
n % Daily 95% CI % 5-6 days
95% CI % 3-4 days
95% CI % 1-2 days
95% CI % 0 days
95% CI
18-29
30-44
45-59
60-69
18-69
Frequency of alcohol consumption in the past 7 days
Age Group (years)
Women
n % Daily 95% CI % 5-6 days
95% CI % 3-4 days
95% CI % 1-2 days
95% CI % 0 days
95% CI
18-29
30-44
45-59
60-69
18-69
Frequency of alcohol consumption in the past 7 days
Age Group (years)
Both Sexes
n % Daily 95% CI % 5-6 days
95% CI % 3-4 days
95% CI % 1-2 days
95% CI % 0 days
95% CI
18-29
30-44
45-59
60-69
18-69
Analysis Information:
• Questions used: A1, A2, A5, A10a-g
• Epi Info program name: Apastweek (unweighted); ApastweekWT (weighted)

Part 6: Templates and Forms 6-3C-43
Section 3C: Data Book Template WHO STEPS Surveillance
Standard
drinks
per day
in the
past 7
days
Description: Mean number of standard drinks consumed on average per day in the
past 7 days among current (past 30 days) drinkers.
Instrument question:
• During each of the past 7 days, how many standard drinks of any alcoholic drink
did you have each day?
Mean number of standard drinks consumed on average per day in the past 7 days among current drinkers
Age Group (years)
Men Women Both Sexes
n Mean
number 95% CI n
Mean number
95% CI n Mean
number 95% CI
18-29
30-44
45-59
60-69
18-69
Analysis Information:
• Questions used: A1, A2, A5, A10a-g
• Epi Info program name: Apastweek (unweighted); ApastweekWT (weighted)
Consumption
of
unrecorded
alcohol
Description: Percentage of respondents that consumed unrecorded alcohol
(homebrewed alcohol, alcohol brought over the border, not intended for drinking
or other untaxed alcohol) during the past 7 days among current (past 30 days)
drinkers.
Instrument questions:
• Have you consumed any alcohol within the past 30 days?
• During the past 7 days, did you consume any homebrewed alcohol, any
alcohol brought over the border, not intended for drinking or other untaxed
alcohol?
Consumption of unrecorded alcohol
Age Group (years)
Men Women Both Sexes
n
% consuming unrecorded
alcohol
95% CI n
% consuming unrecorded
alcohol
95% CI n
% consuming unrecorded
alcohol
95% CI
18-29
30-44
45-59
60-69
18-69
Analysis Information:
• Questions used: A1, A2, A5, A10a-g, A11
• Epi Info program name: Aunrecorded (unweighted); AunrecordedWT (weighted)

Part 6: Templates and Forms 6-3C-44
Section 3C: Data Book Template WHO STEPS Surveillance
Standard
drinks of
unrecorded
alcohol per
day in the
past 7 days
Description: Mean number of standard drinks of unrecorded alcohol consumed on
average per day in the past 7 days among current (past 30 days) drinkers.
Instrument question:
• On average, how many standard drinks of the following did you consume
during the past 7 days?
Mean number of standard drinks of unrecorded alcohol consumed on average per day in the past 7 days
among current drinkers
Age Group (years)
Men Women Both Sexes
n Mean
number 95% CI n
Mean number
95% CI n Mean
number 95% CI
18-29
30-44
45-59
60-69
18-69
Analysis Information:
• Questions used: A1, A2, A5, A10a-g, A11, A12a-e
• Epi Info program name: Ameanunrecorded (unweighted); AmeanunrecordedWT (weighted)
Percent of
unrecorded
alcohol
from all
alcohol
consumed
Description: Percentage of unrecorded alcohol from all alcohol consumed during
the past 7 days among current (past 30 days) drinkers.
Instrument questions:
• During each of the past 7 days, how many standard drinks did you have each
day?
• During the past 7 days, did you consume any homebrewed alcohol, any alcohol
brought over the border, not intended for drinking or other untaxed alcohol?
• On average, how many standard drinks of the following did you consume
during the past 7 days?
Percentage of unrecorded alcohol from all alcohol consumed during past 7 days
Age Group (years)
Men Women Both Sexes
n
% unrecorded alcohol of all alcohol
95% CI n
% unrecorded alcohol of all alcohol
95% CI n
% unrecorded alcohol of all alcohol
95% CI
18-29
30-44
45-59
60-69
18-69
Analysis Information:
• Questions used: A1, A2, A5, A10a-g, A11, A12a-e
• Epi Info program name: Please contact the STEPS team.
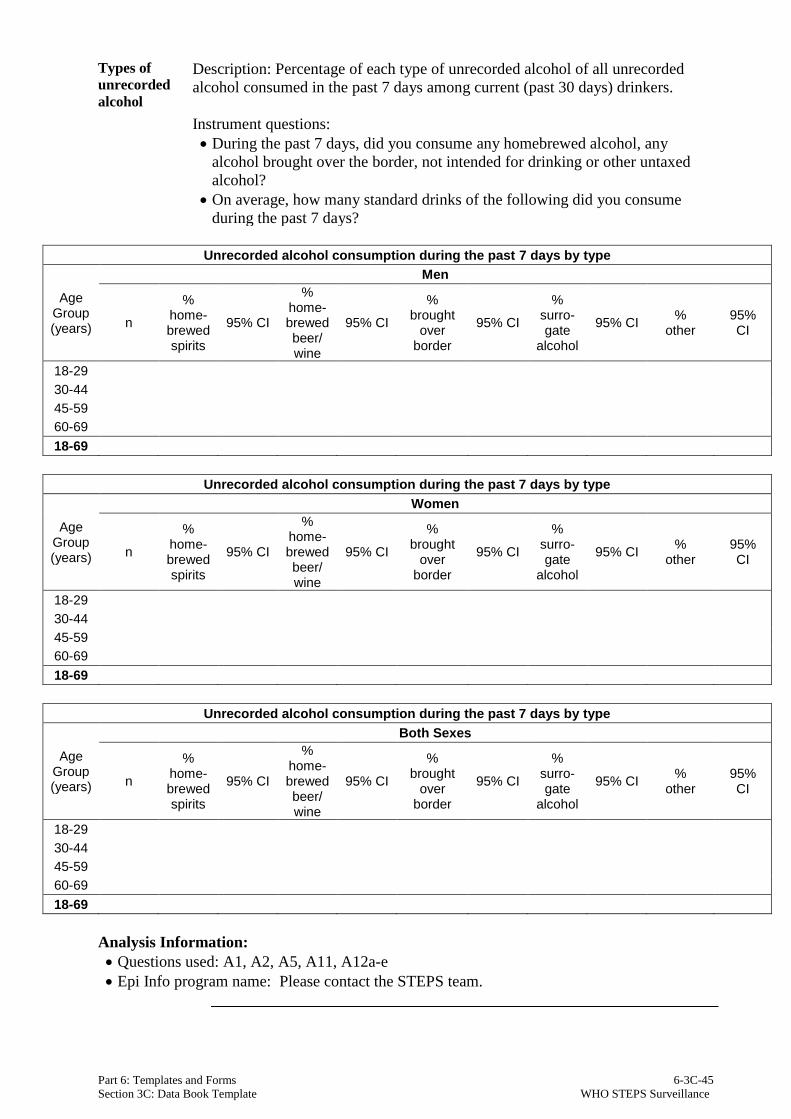
Part 6: Templates and Forms 6-3C-45
Section 3C: Data Book Template WHO STEPS Surveillance
Types of
unrecorded
alcohol
Description: Percentage of each type of unrecorded alcohol of all unrecorded
alcohol consumed in the past 7 days among current (past 30 days) drinkers.
Instrument questions:
• During the past 7 days, did you consume any homebrewed alcohol, any
alcohol brought over the border, not intended for drinking or other untaxed
alcohol?
• On average, how many standard drinks of the following did you consume
during the past 7 days?
Unrecorded alcohol consumption during the past 7 days by type
Age Group (years)
Men
n
% home-brewed spirits
95% CI
% home-brewed beer/ wine
95% CI
% brought
over border
95% CI
% surro-gate
alcohol
95% CI %
other 95% CI
18-29
30-44
45-59
60-69
18-69
Unrecorded alcohol consumption during the past 7 days by type
Age Group (years)
Women
n
% home-brewed spirits
95% CI
% home-brewed beer/ wine
95% CI
% brought
over border
95% CI
% surro-gate
alcohol
95% CI %
other 95% CI
18-29
30-44
45-59
60-69
18-69
Unrecorded alcohol consumption during the past 7 days by type
Age Group (years)
Both Sexes
n
% home-brewed spirits
95% CI
% home-brewed beer/ wine
95% CI
% brought
over border
95% CI
% surro-gate
alcohol
95% CI %
other 95% CI
18-29
30-44
45-59
60-69
18-69
Analysis Information:
• Questions used: A1, A2, A5, A11, A12a-e
• Epi Info program name: Please contact the STEPS team.

Part 6: Templates and Forms 6-3C-46
Section 3C: Data Book Template WHO STEPS Surveillance
Frequency
of
impaired
control
over
drinking
Description: Frequency of not being able to stop drinking once started during the
past 12 months among past 12 month drinkers.
Instrument questions:
• Have you consumed any alcohol within the past 12 months?
• How often during the past 12 months have you found that you were not able to
stop drinking once you had started?
Frequency of not being able to stop drinking once started during the past 12 months among past 12
month drinkers
Age Group (years)
Men
n
% monthly or more
frequently
95% CI % less than
monthly 95% CI % never 95% CI
18-29
30-44
45-59
60-69
18-69
Frequency of not being able to stop drinking once started during the past 12 months among past 12
month drinkers
Age Group (years)
Women
n
% monthly or more
frequently
95% CI % less than
monthly 95% CI % never 95% CI
18-29
30-44
45-59
60-69
18-69
Frequency of not being able to stop drinking once started during the past 12 months among past 12
month drinkers
Age Group (years)
Both Sexes
n
% monthly or more
frequently
95% CI % less than
monthly 95% CI % never 95% CI
18-29
30-44
45-59
60-69
18-69
Analysis Information:
• Questions used: A1, A2, A13
• Epi Info program name: Anotabletostop (unweighted); AnotabletostopWT (weighted)

Part 6: Templates and Forms 6-3C-47
Section 3C: Data Book Template WHO STEPS Surveillance
Frequency
of failing to
do what
was
normally
expected
because of
drinking
Description: Frequency of failing to do what was normally expected from you
because of drinking during the past 12 months among past 12 month drinkers.
Instrument questions:
• Have you consumed any alcohol within the past 12 months?
• How often during the past 12 months have you failed to do what was normally
expected from you because of drinking?
Frequency of failing to do what was normally expected from you during the past 12 months among past
12 month drinkers
Age Group (years)
Men
n
% monthly or more
frequently
95% CI % less than
monthly 95% CI % never 95% CI
18-29
30-44
45-59
60-69
18-69
Frequency of failing to do what was normally expected from you during the past 12 months among past
12 month drinkers
Age Group (years)
Women
n
% monthly or more
frequently
95% CI % less than
monthly 95% CI % never 95% CI
18-29
30-44
45-59
60-69
18-69
Frequency of failing to do what was normally expected from you during the past 12 months among past
12 month drinkers
Age Group (years)
Both Sexes
n
% monthly or more
frequently
95% CI % less than
monthly 95% CI % never 95% CI
18-29
30-44
45-59
60-69
18-69
Analysis Information:
• Questions used: A1, A2, A14
• Epi Info program name: Afailexpected (unweighted); AfailexpectedWT (weighted)
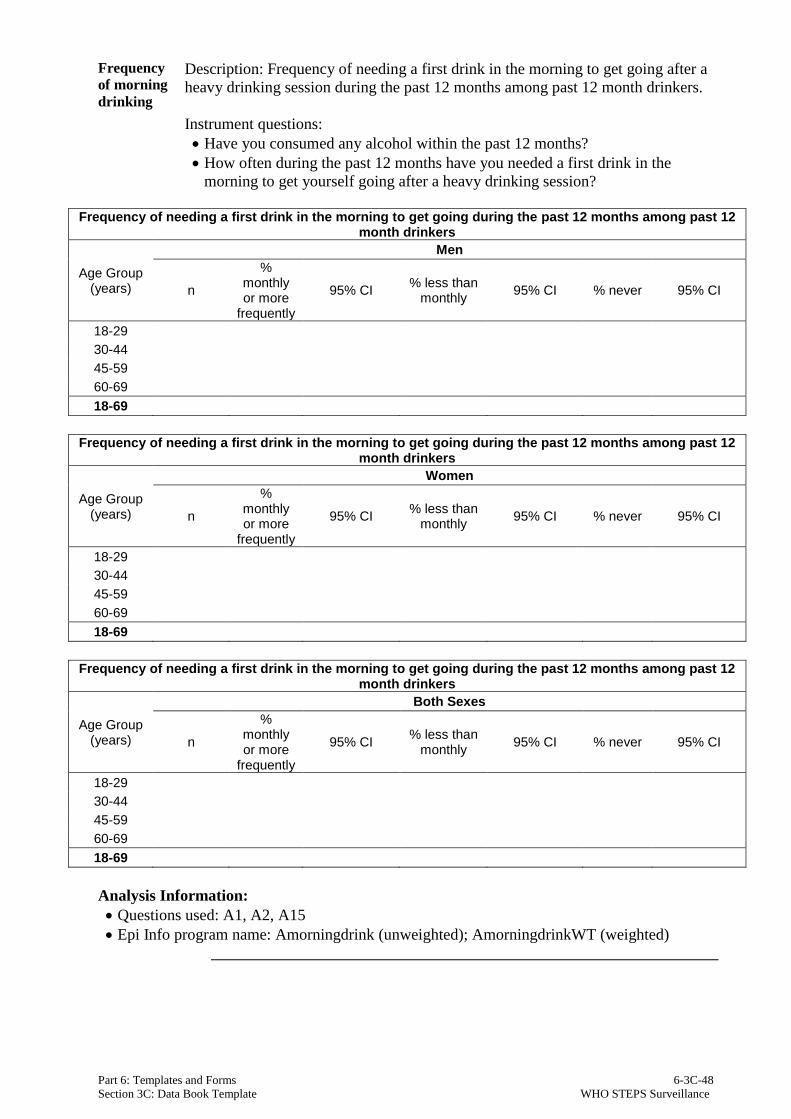
Part 6: Templates and Forms 6-3C-48
Section 3C: Data Book Template WHO STEPS Surveillance
Frequency
of morning
drinking
Description: Frequency of needing a first drink in the morning to get going after a
heavy drinking session during the past 12 months among past 12 month drinkers.
Instrument questions:
• Have you consumed any alcohol within the past 12 months?
• How often during the past 12 months have you needed a first drink in the
morning to get yourself going after a heavy drinking session?
Frequency of needing a first drink in the morning to get going during the past 12 months among past 12
month drinkers
Age Group (years)
Men
n
% monthly or more
frequently
95% CI % less than
monthly 95% CI % never 95% CI
18-29
30-44
45-59
60-69
18-69
Frequency of needing a first drink in the morning to get going during the past 12 months among past 12
month drinkers
Age Group (years)
Women
n
% monthly or more
frequently
95% CI % less than
monthly 95% CI % never 95% CI
18-29
30-44
45-59
60-69
18-69
Frequency of needing a first drink in the morning to get going during the past 12 months among past 12
month drinkers
Age Group (years)
Both Sexes
n
% monthly or more
frequently
95% CI % less than
monthly 95% CI % never 95% CI
18-29
30-44
45-59
60-69
18-69
Analysis Information:
• Questions used: A1, A2, A15
• Epi Info program name: Amorningdrink (unweighted); AmorningdrinkWT (weighted)

Part 6: Templates and Forms 6-3C-49
Section 3C: Data Book Template WHO STEPS Surveillance
Frequency of
problems with
family/ partner
due to someone
else’s drinking
Description: Frequency of having had problems with family or partner due to
someone else’s drinking in the past 12 months among all respondents.
Instrument question:
• Have you had family problems or problems with your partner due to
someone else’s drinking within the past 12 months?
Frequency of family/partner problems due to someone else’s drinking during the past 12 months among
all respondents
Age Group (years)
Men
n
% monthly or more
frequently
95% CI % less than
monthly 95% CI % never 95% CI
18-29
30-44
45-59
60-69
18-69
Frequency of family/partner problems due to someone else’s drinking during the past 12 months among
all respondents
Age Group (years)
Women
n
% monthly or more
frequently
95% CI % less than
monthly 95% CI % never 95% CI
18-29
30-44
45-59
60-69
18-69
Frequency of family/partner problems due to someone else’s drinking during the past 12 months among
all respondents
Age Group (years)
Both Sexes
n
% monthly or more
frequently
95% CI % less than
monthly 95% CI % never 95% CI
18-29
30-44
45-59
60-69
18-69
Analysis Information:
• Question used: A16
• Epi Info program name: Afamproblem (unweighted); AfamproblemWT (weighted)

Part 6: Templates and Forms 6-3C-50
Section 3C: Data Book Template WHO STEPS Surveillance
Diet
Mean
number of
days of fruit
and
vegetable
consumption
Description: mean number of days fruit and vegetables consumed.
Instrument questions:
• In a typical week, on how many days do you eat fruit?
• In a typical week, on how many days do you eat vegetables?
Mean number of days fruit consumed in a typical week
Age Group (years)
Men Women Both Sexes
n Mean
number of days
95% CI n Mean
number of days
95% CI n Mean
number of days
95% CI
18-29
30-44
45-59
60-69
18-69
Mean number of days vegetables consumed in a typical week
Age Group (years)
Men Women Both Sexes
n Mean
number of days
95% CI n Mean
number of days
95% CI n Mean
number of days
95% CI
18-29
30-44
45-59
60-69
18-69
Analysis Information:
• Questions used: D1, D3
• Epi Info program name: Ddays (unweighted); DdaysWT (weighted)

Part 6: Templates and Forms 6-3C-51
Section 3C: Data Book Template WHO STEPS Surveillance
Mean
number of
servings of
fruit and
vegetable
consumption
Description: mean number of fruit, vegetable, and combined fruit and vegetable
servings on average per day.
Instrument questions:
• In a typical week, on how many days do you eat fruit?
• How many servings of fruit do you eat on one of those days?
• In a typical week, on how many days do you eat vegetables?
• How many servings of vegetables do you eat on one of those days?
Mean number of servings of fruit on average per day
Age Group (years)
Men Women Both Sexes
n
Mean number
of servings
95% CI n
Mean number
of servings
95% CI n
Mean number
of servings
95% CI
18-29
30-44
45-59
60-69
18-69
Mean number of servings of vegetables on average per day
Age Group (years)
Men Women Both Sexes
n
Mean number
of servings
95% CI n
Mean number
of servings
95% CI n
Mean number
of servings
95% CI
18-29
30-44
45-59
60-69
18-69
Mean number of servings of fruit and/or vegetables on average per day
Age Group (years)
Men Women Both Sexes
n
Mean number
of servings
95% CI n
Mean number
of servings
95% CI n
Mean number
of servings
95% CI
18-29
30-44
45-59
60-69
18-69
Analysis Information:
• Questions used: D1, D2 , D3, D4
• Epi Info program name: Dservings (unweighted); DservingsWT (weighted)

Part 6: Templates and Forms 6-3C-52
Section 3C: Data Book Template WHO STEPS Surveillance
Fruit and
vegetable
consumption
per day
Description: Frequency of fruit and/or vegetable consumption.
Instrument questions:
• In a typical week, on how many days do you eat fruit?
• How many servings of fruit do you eat on one of those days?
• In a typical week, on how many days do you eat vegetables?
• How many servings of vegetables do you eat on one of those days?
Number of servings of fruit and/or vegetables on average per day
Age Group (years)
Men
n % no fruit
and/or vegetables
95% CI % 1-2
servings 95% CI
% 3-4 servings
95% CI % ≥5
servings 95% CI
18-29
30-44
45-59
60-69
18-69
Number of servings of fruit and/or vegetables on average per day
Age Group (years)
Women
n % no fruit
and/or vegetables
95% CI % 1-2
servings 95% CI
% 3-4 servings
95% CI % ≥5
servings 95% CI
18-29
30-44
45-59
60-69
18-69
Number of servings of fruit and/or vegetables on average per day
Age Group (years)
Both Sexes
n % no fruit
and/or vegetables
95% CI % 1-2
servings 95% CI
% 3-4 servings
95% CI % ≥5
servings 95% CI
18-29
30-44
45-59
60-69
18-69
Analysis Information:
• Questions used: D1, D2 , D3, D4
• Epi Info program name: Dfiveormore (unweighted); DfiveormoreWT (weighted)

Part 6: Templates and Forms 6-3C-53
Section 3C: Data Book Template WHO STEPS Surveillance
Fruit and
vegetable
consumption
per day
Description: Percentage of those eating less than five servings of fruit and/or
vegetables on average per day.
Instrument questions:
• In a typical week, on how many days do you eat fruit?
• How many servings of fruit do you eat on one of those days?
• In a typical week, on how many days do you eat vegetables?
• How many servings of vegetables do you eat on one of those days?
Less than five servings of fruit and/or vegetables on average per day
Age Group (years)
Men Women Both Sexes
n % < five servings per day
95% CI n % < five servings per day
95% CI n % < five servings per day
95% CI
18-29
30-44
45-59
60-69
18-69
Analysis Information:
• Questions used: D1, D2 , D3, D4
• Epi Info program name: Dfiveormore (unweighted); DfiveormoreWT (weighted)

Part 6: Templates and Forms 6-3C-54
Section 3C: Data Book Template WHO STEPS Surveillance
Adding
salt at
meal
Description: Percentage of all respondents who always or often add salt or salty
sauce to their food before eating or as they are eating.
Instrument question:
• How often do you add salt or a salty sauce such as soya sauce to your food
right before you eat it or as you are eating it?
Add salt always or often before eating or when eating
Age Group (years)
Men Women Both Sexes
n % 95% CI n % 95% CI n % 95% CI
18-29
30-44
45-59
60-69
18-69
Analysis Information:
• Question used: D5
• Epi Info program name: Deating (unweighted); DeatingWT (weighted)
Adding
salt when
cooking
Description: Percentage of all respondents who always or often add salt to their food
when cooking or preparing foods at home.
Instrument question:
• How often is salt, salty seasoning or a salty sauce added in cooking or
preparing foods in your household?
Add salt always or often when cooking or preparing food at home
Age Group (years)
Men Women Both Sexes
n % 95% CI n % 95% CI n % 95% CI
18-29
30-44
45-59
60-69
18-69
Analysis Information:
• Question used: D6
• Epi Info program name: Dooking (unweighted); DcookingWT (weighted)

Part 6: Templates and Forms 6-3C-55
Section 3C: Data Book Template WHO STEPS Surveillance
Salty
processed
food
consumption
Description: Percentage of all respondents who always or often eat processed
foods high in salt.
Instrument question:
• How often do you eat processed food high in salt?
Always or often consume processed food high in salt
Age Group (years)
Men Women Both Sexes
n % 95% CI n % 95% CI n % 95% CI
18-29
30-44
45-59
60-69
18-69
Analysis Information:
• Question used: D7
• Epi Info program name: Dprocessed (unweighted); DprocessedWT (weighted)
Salt
consumption Description: Percentage of all respondents who think they consume far too much
or too much salt.
Instrument question:
• How much salt or salty sauce do you think you consume?
Think they consume far too much or too much salt
Age Group (years)
Men Women Both Sexes
n % 95% CI n % 95% CI n % 95% CI
18-29
30-44
45-59
60-69
18-69

Part 6: Templates and Forms 6-3C-56
Section 3C: Data Book Template WHO STEPS Surveillance
Self-reported quantity of salt consumed
Age Group (years)
Men
n % Far
too much
95% CI % Too much
95% CI
% Just the right
amount
95% CI % Too little
95% CI % Far
too little 95% CI
18-29
30-44
45-59
60-69
18-69
Self-reported quantity of salt consumed
Age Group (years)
Women
n % Far
too much
95% CI % Too much
95% CI
% Just the right
amount
95% CI % Too little
95% CI % Far
too little 95% CI
18-29
30-44
45-59
60-69
18-69
Self-reported quantity of salt consumed
Age Group (years)
Both Sexes
n % Far
too much
95% CI % Too much
95% CI
% Just the right
amount
95% CI % Too little
95% CI % Far
too little 95% CI
18-29
30-44
45-59
60-69
18-69
Analysis Information:
• Question used: D8
• Epi Info program name: Dsaltquantity (unweighted); DsaltquantityWT (weighted)
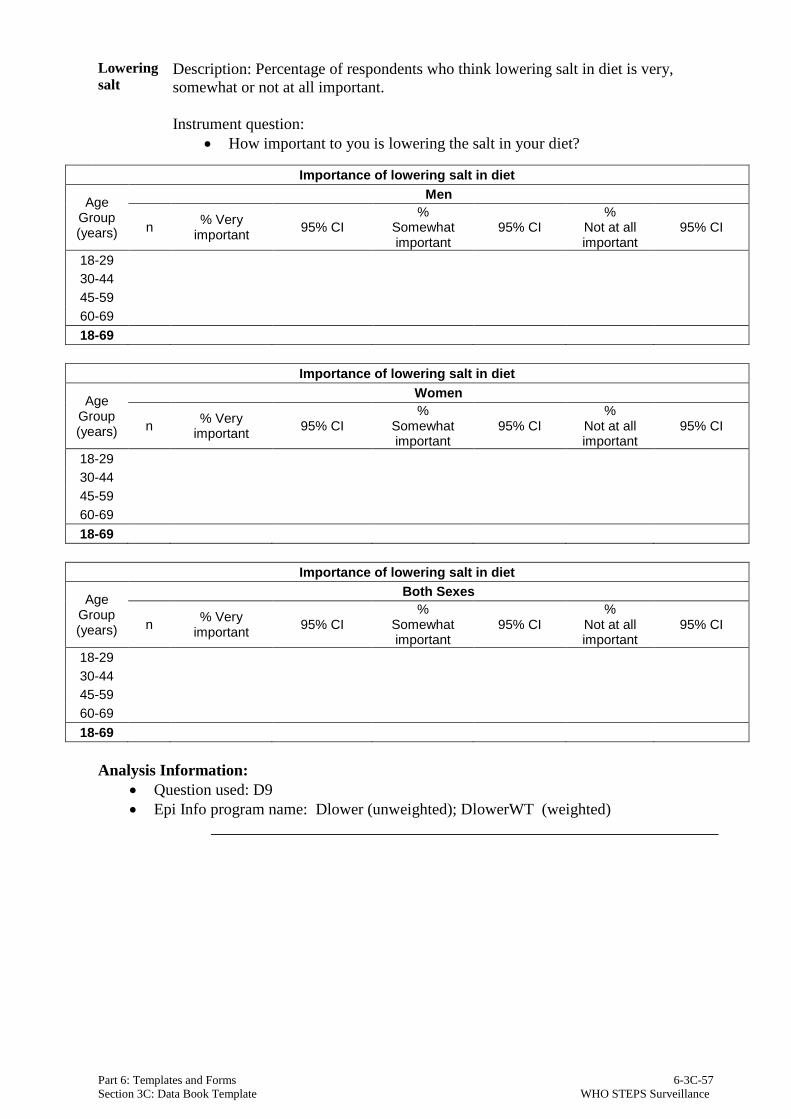
Part 6: Templates and Forms 6-3C-57
Section 3C: Data Book Template WHO STEPS Surveillance
Lowering
salt Description: Percentage of respondents who think lowering salt in diet is very,
somewhat or not at all important.
Instrument question:
• How important to you is lowering the salt in your diet?
Importance of lowering salt in diet
Age Group (years)
Men
n % Very
important 95% CI
% Somewhat important
95% CI %
Not at all important
95% CI
18-29
30-44
45-59
60-69
18-69
Importance of lowering salt in diet
Age Group (years)
Women
n % Very
important 95% CI
% Somewhat important
95% CI %
Not at all important
95% CI
18-29
30-44
45-59
60-69
18-69
Importance of lowering salt in diet
Age Group (years)
Both Sexes
n % Very
important 95% CI
% Somewhat important
95% CI %
Not at all important
95% CI
18-29
30-44
45-59
60-69
18-69
Analysis Information:
• Question used: D9
• Epi Info program name: Dlower (unweighted); DlowerWT (weighted)

Part 6: Templates and Forms 6-3C-58
Section 3C: Data Book Template WHO STEPS Surveillance
Salt
knowledge Description: Percentage of respondents who think consuming too much salt could
cause a serious health problem.
Instrument question:
• Do you think that too much salt or salty sauce in your diet could cause a
health problem?
Think consuming too much salt could cause serious health problem
Age Group (years)
Men Women Both Sexes
n % 95% CI n % 95% CI n % 95% CI
18-29
30-44
45-59
60-69
18-69
Analysis Information:
• Question used: D10
• Epi Info program name: Dhealth (unweighted); DhealthWT (weighted)

Part 6: Templates and Forms 6-3C-59
Section 3C: Data Book Template WHO STEPS Surveillance
Controlling
salt intake Description: Percentage of respondents who take specific action on a regular basis
to control salt intake.
Instrument question:
• Do you do any of the following on a regular basis to control your salt
intake?
Limit consumption of processed foods
Age Group (years)
Men Women Both Sexes
n % 95% CI n % 95% CI n % 95% CI
18-29
30-44
45-59
60-69
18-69
Look at the salt or sodium content on food labels
Age Group (years)
Men Women Both Sexes
n % 95% CI n % 95% CI n % 95% CI
18-29
30-44
45-59
60-69
18-69
Buy low salt/sodium alternatives
Age Group (years)
Men Women Both Sexes
n % 95% CI n % 95% CI n % 95% CI
18-29
30-44
45-59
60-69
18-69
Use spices other than salt when cooking
Age Group (years)
Men Women Both Sexes
n % 95% CI n % 95% CI n % 95% CI
18-29
30-44
45-59
60-69
18-69

Part 6: Templates and Forms 6-3C-60
Section 3C: Data Book Template WHO STEPS Surveillance
Avoid eating foods prepared outside of a home
Age Group (years)
Men Women Both Sexes
n % 95% CI n % 95% CI n % 95% CI
18-29
30-44
45-59
60-69
18-69
Do other things specifically to control your salt intake
Age Group (years)
Men Women Both Sexes
n % 95% CI n % 95% CI n % 95% CI
18-29
30-44
45-59
60-69
18-69
Analysis Information:
• Questions used: D11a-f
• Epi Info program name: Dcontrol (unweighted); DcontrolWT (weighted)

Part 6: Templates and Forms 6-3C-61
Section 3C: Data Book Template WHO STEPS Surveillance
Physical Activity
Introduction A population's physical activity (or inactivity) can be described in different ways.
The two most common ways are
(1) to estimate a population's mean or median physical activity using a continuous
indicator such as MET-minutes per week or time spent in physical activity, and
(2) to classify certain percentages of a population in specific groups by setting up
cut-points for a specific amount of physical activity.
When analyzing GPAQ data, both continuous as well as categorical indicators are
used.
Metabolic
Equivalent
(MET)
METs (Metabolic Equivalents) are commonly used to express the intensity of
physical activities, and are also used for the analysis of GPAQ data.
Applying MET values to activity levels allows us to calculate total physical
activity. MET is the ratio of a person's working metabolic rate relative to the
resting metabolic rate. One MET is defined as the energy cost of sitting quietly,
and is equivalent to a caloric consumption of 1 kcal/kg/hour. For the analysis of
GPAQ data, existing guidelines have been adopted: It is estimated that, compared
to sitting quietly, a person's caloric consumption is four times as high when being
moderately active, and eight times as high when being vigorously active.
Therefore, for the calculation of a person's total physical activity using GPAQ data,
the following MET values are used:
Domain MET value
Work • Moderate MET value = 4.0
• Vigorous MET value = 8.0
Transport Cycling and walking MET value = 4.0
Recreation • Moderate MET value = 4.0
• Vigorous MET value = 8.0
WHO
global
recommen-
dations on
physical
activity for
health
For the calculation of the categorical indicator on the recommended amount of
physical activity for health, the total time spent in physical activity during a
typical week and the intensity of the physical activity are taken into account.
Throughout a week, including activity for work, during transport and leisure time,
adults should do at least
• 150 minutes of moderate-intensity physical activity OR
• 75 minutes of vigorous-intensity physical activity OR
• An equivalent combination of moderate- and vigorous-intensity physical
activity achieving at least 600 MET-minutes.

Part 6: Templates and Forms 6-3C-62
Section 3C: Data Book Template WHO STEPS Surveillance
Former
recommen-
dations for
comparison
purposes
For comparison purposes, tables presenting cut-offs from former
recommendations are also included in GPAQ data analysis.
The three levels of physical activity suggested for classifying populations were
low, moderate, and high. The criteria for these levels are shown below.
• High
A person reaching any of the following criteria is classified in this category:
- Vigorous-intensity activity on at least 3 days achieving a minimum of at
least 1,500 MET-minutes/week OR
- 7 or more days of any combination of walking, moderate- or vigorous-
intensity activities achieving a minimum of at least 3,000 MET-minutes per
week.
• Moderate
A person not meeting the criteria for the "high" category, but meeting any of
the following criteria is classified in this category:
- 3 or more days of vigorous-intensity activity of at least 20 minutes per day
OR
- 5 or more days of moderate-intensity activity or walking of at least 30
minutes per day OR
- 5 or more days of any combination of walking, moderate- or vigorous-
intensity activities achieving a minimum of at least 600 MET-minutes per
week.
• Low
A person not meeting any of the above mentioned criteria falls in this
category.

Part 6: Templates and Forms 6-3C-63
Section 3C: Data Book Template WHO STEPS Surveillance
Not meeting WHO
recommendations on
physical activity for
health (“Insufficient
physical activity”)
Description: Percentage of respondents not meeting WHO
recommendations on physical activity for health (respondents doing less
than 150 minutes of moderate-intensity physical activity per week, or
equivalent).
Instrument questions
• activity at work
• travel to and from places
• recreational activities
Not meeting WHO recommendations on physical activity for health
Age Group (years)
Men Women Both Sexes
n % not
meeting recs
95% CI n % not
meeting recs
95% CI n % not
meeting recs
95% CI
18-29
30-44
45-59
60-69
18-69
Analysis Information:
• Questions used: P1-P15b
• Epi Info program name: Pnotmeetingrecs (unweighted); PnotmeetingrecsWT (weighted)

Part 6: Templates and Forms 6-3D-64
Section 3D: Data Book Template WHO STEPS Surveillance
Levels of
total
physical
activity
according
to former
recommen-
dations
Description: Percentage of respondents classified into three categories of total
physical activity according to former recommendations.
Instrument questions:
• activity at work
• travel to and from places
• recreational activities
Level of total physical activity according to former recommendations
Age Group (years)
Men
n % Low 95% CI %
Moderate 95% CI % High 95% CI
18-29
30-44
45-59
60-69
18-69
Level of total physical activity according to former recommendations
Age Group (years)
Women
n % Low 95% CI %
Moderate 95% CI % High 95% CI
18-29
30-44
45-59
60-69
18-69
Level of total physical activity according to former recommendations
Age Group (years)
Both Sexes
n % Low 95% CI %
Moderate 95% CI % High 95% CI
18-29
30-44
45-59
60-69
18-69
Analysis Information:
• Questions used: P1-P15b
• Epi Info program name: Ptotallevels (unweighted); PtotallevelsWT (weighted)

Part 6: Templates and Forms 6-3C-65
Section 3C: Data Book Template WHO STEPS Surveillance
Total
physical
activity-
mean
Description: Mean minutes of total physical activity on average per day.
Instrument questions
• activity at work
• travel to and from places
• recreational activities
Mean minutes of total physical activity on average per day
Age Group (years)
Men Women Both Sexes
n Mean
minutes 95% CI n
Mean minutes
95% CI n Mean
minutes 95% CI
18-29
30-44
45-59
60-69
18-69
Analysis Information:
• Questions used: P1-P15b
• Epi Info program name: Ptotal (unweighted); PtotalWT (weighted)
Total
physical
activity-
median
Description: Median minutes of total physical activity on average per day.
Instrument questions
• activity at work
• travel to and from places
• recreational activities
Median minutes of total physical activity on average per day
Age Group (years)
Men Women Both Sexes
n Median minutes
Inter-quartile range
(P25-P75)
n Median minutes
Inter-quartile range
(P25-P75)
n Median minutes
Inter-quartile range
(P25-P75)
18-29
30-44
45-59
60-69
18-69
Analysis Information:
• Questions used: P1-P15b
• Epi Info program name: Ptotal (unweighted); PtotalmedianWT (weighted)
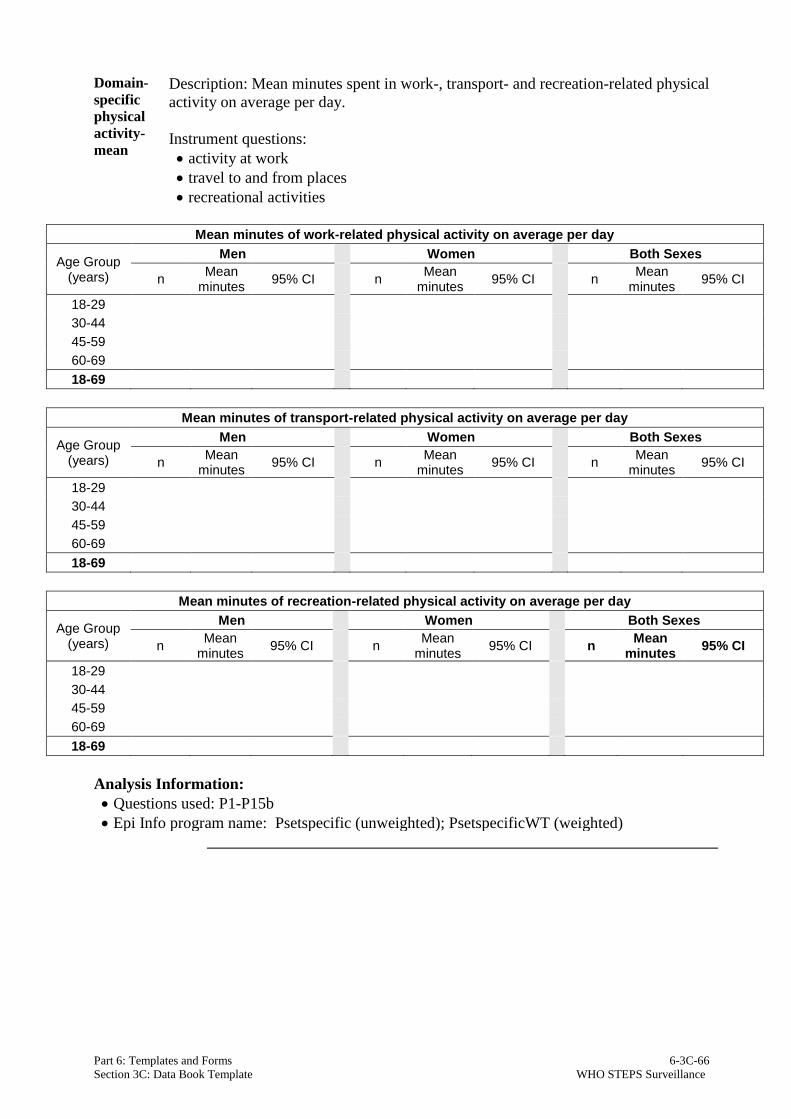
Part 6: Templates and Forms 6-3C-66
Section 3C: Data Book Template WHO STEPS Surveillance
Domain-
specific
physical
activity-
mean
Description: Mean minutes spent in work-, transport- and recreation-related physical
activity on average per day.
Instrument questions:
• activity at work
• travel to and from places
• recreational activities
Mean minutes of work-related physical activity on average per day
Age Group (years)
Men Women Both Sexes
n Mean
minutes 95% CI n
Mean minutes
95% CI n Mean
minutes 95% CI
18-29
30-44
45-59
60-69
18-69
Mean minutes of transport-related physical activity on average per day
Age Group (years)
Men Women Both Sexes
n Mean
minutes 95% CI n
Mean minutes
95% CI n Mean
minutes 95% CI
18-29
30-44
45-59
60-69
18-69
Mean minutes of recreation-related physical activity on average per day
Age Group (years)
Men Women Both Sexes
n Mean
minutes 95% CI n
Mean minutes
95% CI n Mean
minutes 95% CI
18-29
30-44
45-59
60-69
18-69
Analysis Information:
• Questions used: P1-P15b
• Epi Info program name: Psetspecific (unweighted); PsetspecificWT (weighted)

Part 6: Templates and Forms 6-3C-67
Section 3C: Data Book Template WHO STEPS Surveillance
Domain-
specific
physical
activity -
median
Description: Median minutes spent on average per day in work-, transport- and
recreation-related physical activity.
Instrument questions:
• activity at work
• travel to and from places
• recreational activities
Median minutes of work-related physical activity on average per day
Age Group (years)
Men Women Both Sexes
n Median minutes
Inter-quartile range
(P25-P75)
n Median minutes
Inter-quartile range
(P25-P75)
n Median minutes
Inter-quartile range
(P25-P75)
18-29
30-44
45-59
60-69
18-69
Median minutes of transport-related physical activity on average per day
Age Group (years)
Men Women Both Sexes
n Median minutes
Inter-quartile range
(P25-P75)
n Median minutes
Inter-quartile range
(P25-P75)
n Median minutes
Inter-quartile range
(P25-P75)
18-29
30-44
45-59
60-69
18-69
Median minutes of recreation-related physical activity on average per day
Age Group (years)
Men Women Both Sexes
n Median minutes
Inter-quartile range
(P25-P75)
n Median minutes
Inter-quartile range
(P25-P75)
n Median minutes
Inter-quartile range
(P25-P75)
18-29
30-44
45-59
60-69
18-69
Analysis Information:
• Questions used: P1-P15b
• Epi Info program name: Psetspecific (unweighted); PsetspecificmedianWT (weighted)

Part 6: Templates and Forms 6-3C-68
Section 3C: Data Book Template WHO STEPS Surveillance
No
physical
activity
by
domain
Description: Percentage of respondents classified as doing no work-, transport- or
recreational-related physical activity.
Instrument questions:
• activity at work
• travel to and from places
• recreational activities
No work-related physical activity
Age Group (years)
Men Women Both Sexes
n % no
activity at work
95% CI n % no
activity at work
95% CI n % no
activity at work
95% CI
18-29
30-44
45-59
60-69
18-69
No transport-related physical activity
Age Group (years)
Men Women Both Sexes
n
% no activity
for transport
95% CI n
% no activity
for transport
95% CI n
% no activity
for transport
95% CI
18-29
30-44
45-59
60-69
18-69
No recreation-related physical activity
Age Group (years)
Men Women Both Sexes
n % no
activity at recreation
95% CI n % no
activity at recreation
95% CI n % no
activity at recreation
95% CI
18-29
30-44
45-59
60-69
18-69
Analysis Information:
• Questions used: P1-P15b
• Epi Info program name: Pnoactivitybyset (unweighted); PnoactivitybysetWT (weighted)

Part 6: Templates and Forms 6-3C-69
Section 3C: Data Book Template WHO STEPS Surveillance
Composition
of total
physical
activity
Description: Percentage of work, transport and recreational activity contributing
to total activity.
Instrument questions:
• activity at work
• travel to and from places
• recreational activities
Composition of total physical activity
Age Group (years)
Men
n % Activity from work
95% CI % Activity
for transport
95% CI
% Activity during leisure time
95% CI
18-29
30-44
45-59
60-69
18-69
Composition of total physical activity
Age Group (years)
Women
n % Activity from work
95% CI % Activity
for transport
95% CI
% Activity during leisure time
95% CI
18-29
30-44
45-59
60-69
18-69
Composition of total physical activity
Age Group (years)
Both Sexes
n % Activity from work
95% CI % Activity
for transport
95% CI
% Activity during leisure time
95% CI
18-29
30-44
45-59
60-69
18-69
Analysis Information:
• Questions used: P1-P15b
• Epi Info program name: Pcomposition(unweighted); PcompositionWT (weighted)

Part 6: Templates and Forms 6-3C-70
Section 3C: Data Book Template WHO STEPS Surveillance
No
vigorous
physical
activity
Description: Percentage of respondents not engaging in vigorous physical activity.
Instrument questions:
• activity at work
• recreational activities
No vigorous physical activity
Age Group (years)
Men Women Both Sexes
n % no
vigorous activity
95% CI n % no
vigorous activity
95% CI n % no
vigorous activity
95% CI
18-29
30-44
45-59
60-69
18-69
Analysis Information:
• Questions used: P1-P15b
• Epi Info program name: Pnovigorous(unweighted); PnovigorousWT (weighted)

Part 6: Templates and Forms 6-3C-71
Section 3C: Data Book Template WHO STEPS Surveillance
Sedentary Description: Minutes spent in sedentary activities on a typical day.
Instrument question:
• sedentary behaviour
Minutes spent in sedentary activities on average per day
Age Group (years)
Men
n Mean
minutes 95% CI
Median minutes
Inter-quartile range
(P25-P75)
18-29
30-44
45-59
60-69
18-69
Minutes spent in sedentary activities on average per day
Age Group (years)
Women
n Mean
minutes 95% CI
Median minutes
Inter-quartile range
(P25-P75)
18-29
30-44
45-59
60-69
18-69
Minutes spent in sedentary activities on average per day
Age Group (years)
Both Sexes
n Mean
minutes 95% CI
Median minutes
Inter-quartile range
(P25-P75)
18-29
30-44
45-59
60-69
18-69
Analysis Information:
• Question used : P16a-b
• Epi Info program name: Psedentary (unweighted); PsedentaryWT and
PsedentarymedianWT (weighted)

Part 6: Templates and Forms 6-3C-72
Section 3C: Data Book Template WHO STEPS Surveillance
History of Raised Blood Pressure
Blood
pressure
measurement
and
diagnosis
Description: Blood pressure measurement and diagnosis among all respondents.
Instrument questions:
• Have you ever had your blood pressure measured by a doctor or other health
worker?
• Have you ever been told by a doctor or other health worker that you have
raised blood pressure or hypertension?
• Have you been told in the past 12 months?
Blood pressure measurement and diagnosis
Age Group (years)
Men
n % Never
measured 95% CI
% measured,
not diagnosed
95% CI
% diagnosed,
but not within past 12 months
95% CI
% diagnosed within past 12 months
95% CI
18-29
30-44
45-59
60-69
18-69
Blood pressure measurement and diagnosis
Age Group (years)
Women
n % Never
measured 95% CI
% measured,
not diagnosed
95% CI
% diagnosed,
but not within past 12 months
95% CI
% diagnosed within past 12 months
95% CI
18-29
30-44
45-59
60-69
18-69
Blood pressure measurement and diagnosis
Age Group (years)
Both sexes
n % Never
measured 95% CI
% measured,
not diagnosed
95% CI
% diagnosed,
but not within past 12 months
95% CI
% diagnosed within past 12 months
95% CI
18-29
30-44
45-59
60-69
18-69
Analysis Information:
• Questions used: H1, H2a, H2b
• Epi Info program name: Hbloodpressure (unweighted); HbloodpressureWT (weighted)

Part 6: Templates and Forms 6-3C-73
Section 3C: Data Book Template WHO STEPS Surveillance
Blood
pressure
treatment
among
those
diagnosed
Description: Raised blood pressure treatment results among those previously
diagnosed with raised blood pressure.
Instrument questions:
• Have you ever had your blood pressure measured by a doctor or other health
worker?
• Have you ever been told by a doctor or other health worker that you have raised
blood pressure or hypertension?
• In the past two weeks, have you taken any drugs (medication) for raised blood
pressure prescribed by a doctor or other health worker?
Currently taking drugs (medication) for raised blood pressure prescribed by doctor or health worker among
those diagnosed
Age Group (years)
Men Women Both Sexes
n % taking
meds 95% CI n
% taking meds
95% CI n % taking
meds 95% CI
18-29
30-44
45-59
60-69
18-69
Analysis Information:
• Questions used: H1, H2a, H3
• Epi Info program name: Hbloodpressure (unweighted); HbloodpressureWT (weighted)

Part 6: Templates and Forms 6-3C-74
Section 3C: Data Book Template WHO STEPS Surveillance
Blood
pressure
advice by
a
traditional
healer
Description: Percentage of respondents who have sought advice or received
treatment from a traditional healer for raised blood pressure among those previously
diagnosed with raised blood pressure.
Instrument questions:
• Have you ever had your blood pressure measured by a doctor or other health
worker?
• Have you ever been told by a doctor or other health worker that you have raised
blood pressure or hypertension?
• Have you ever seen a traditional healer for raised blood pressure?
• Are you currently taking any herbal or traditional remedy for your high blood
pressure?
Seen a traditional healer among those previously diagnosed
Age Group (years)
Men Women Both Sexes
n
% seen trad.
healer
95% CI n
% seen trad.
healer
95% CI n
% seen trad.
healer
95% CI
18-29
30-44
45-59
60-69
18-69
Currently taking herbal or traditional remedy for raised blood pressure among those previously diagnosed
Age Group (years)
Men Women Both Sexes
n
% taking trad. meds
95% CI n
% taking trad. meds
95% CI n
% taking trad. meds
95% CI
18-29
30-44
45-59
60-69
18-69
Analysis Information:
• Questions used: H1, H2a, H4, H5
• Epi Info program name: Hraisedbptrad (unweighted); HraisedbptradWT (weighted)

Part 6: Templates and Forms 6-3C-75
Section 3C: Data Book Template WHO STEPS Surveillance
History of Diabetes
Blood sugar
measurement
and
diagnosis
Description: Blood sugar measurement and diagnosis among all respondents.
Instrument questions:
• Have you ever had your blood sugar measured by a doctor or other health
worker?
• Have you ever been told by a doctor or other health worker that you have
raised blood sugar or diabetes?
• Have you been told in the past 12 months?
Blood sugar measurement and diagnosis
Age Group (years)
Men
n % Never
measured 95% CI
% measured,
not diagnosed
95% CI
% diagnosed,
but not within past 12 months
95% CI
% diagnosed within past 12 months
95% CI
18-29
30-44
45-59
60-69
18-69
Blood sugar measurement and diagnosis
Age Group (years)
Women
n % Never
measured 95% CI
% measured,
not diagnosed
95% CI
% diagnosed,
but not within past 12 months
95% CI
% diagnosed within past 12 months
95% CI
18-29
30-44
45-59
60-69
18-69
Blood sugar measurement and diagnosis
Age Group (years)
Both sexes
n % Never
measured 95% CI
% measured,
not diagnosed
95% CI
% diagnosed,
but not within past 12 months
95% CI
% diagnosed within past 12 months
95% CI
18-29
30-44
45-59
60-69
18-69
Analysis Information:
• Questions used: H6, H7a, H7b
• Epi Info program name: Hdiabetes (unweighted); HdiabetesWT (weighted)
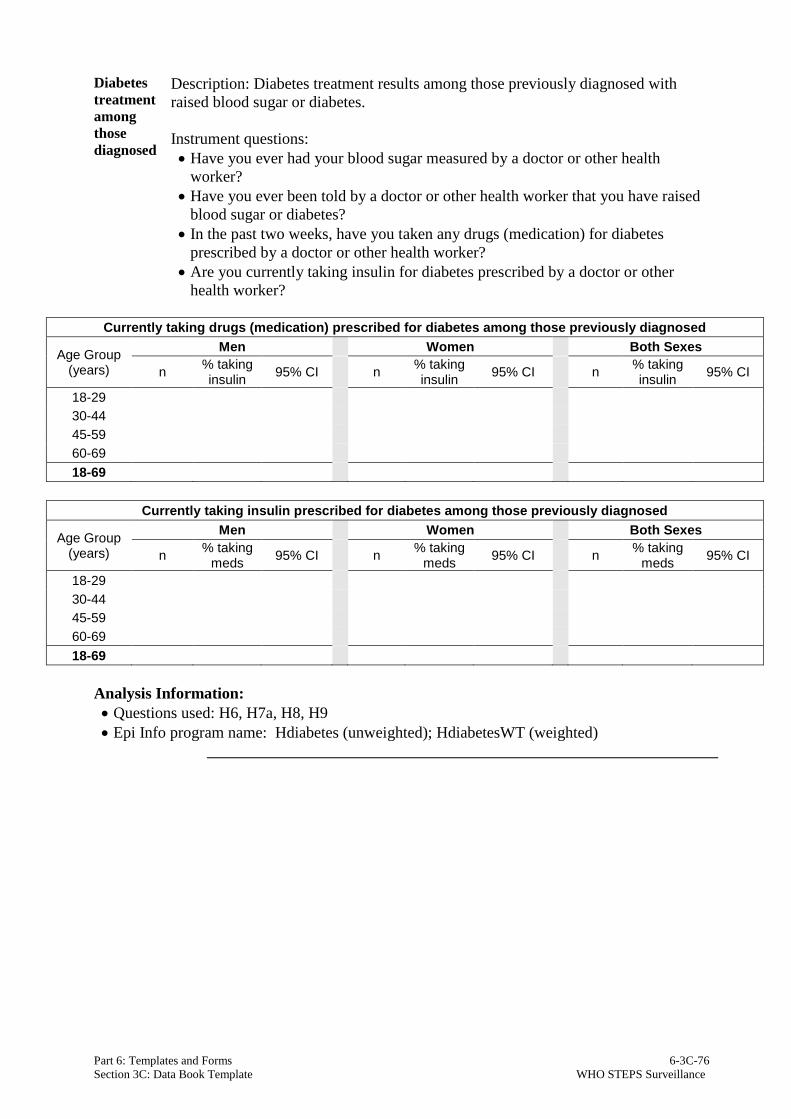
Part 6: Templates and Forms 6-3C-76
Section 3C: Data Book Template WHO STEPS Surveillance
Diabetes
treatment
among
those
diagnosed
Description: Diabetes treatment results among those previously diagnosed with
raised blood sugar or diabetes.
Instrument questions:
• Have you ever had your blood sugar measured by a doctor or other health
worker?
• Have you ever been told by a doctor or other health worker that you have raised
blood sugar or diabetes?
• In the past two weeks, have you taken any drugs (medication) for diabetes
prescribed by a doctor or other health worker?
• Are you currently taking insulin for diabetes prescribed by a doctor or other
health worker?
Currently taking drugs (medication) prescribed for diabetes among those previously diagnosed
Age Group (years)
Men Women Both Sexes
n % taking insulin
95% CI n % taking insulin
95% CI n % taking insulin
95% CI
18-29
30-44
45-59
60-69
18-69
Currently taking insulin prescribed for diabetes among those previously diagnosed
Age Group (years)
Men Women Both Sexes
n % taking
meds 95% CI n
% taking meds
95% CI n % taking
meds 95% CI
18-29
30-44
45-59
60-69
18-69
Analysis Information:
• Questions used: H6, H7a, H8, H9
• Epi Info program name: Hdiabetes (unweighted); HdiabetesWT (weighted)

Part 6: Templates and Forms 6-3C-77
Section 3C: Data Book Template WHO STEPS Surveillance
Diabetes
advice by
traditional
healer
Description: Percentage of respondents who are have sought advice or treatment
from a traditional healer for diabetes among those previously diagnosed.
Instrument questions:
• Have you ever had your blood sugar measured by a doctor or other health
worker?
• Have you ever been told by a doctor or other health worker that you have raised
blood sugar or diabetes?
• Have you ever seen a traditional healer for diabetes or raised blood sugar?
• Are you currently taking any herbal or traditional remedy for your diabetes?
Seen a traditional healer for diabetes among those previously diagnosed
Age Group (years)
Men Women Both Sexes
n
% seen trad.
healer
95% CI n
% seen trad.
healer
95% CI n
% seen trad.
healer
95% CI
18-29
30-44
45-59
60-69
18-69
Currently taking herbal or traditional treatment for diabetes among those previously diagnosed
Age Group (years)
Men Women Both Sexes
n
% taking trad. meds
95% CI n
% taking trad. meds
95% CI n
% taking trad. meds
95% CI
18-29
30-44
45-59
60-69
18-69
Analysis Information:
• Questions used: H6, H7a, H10, H11
• Epi Info program name: Hdiabetestrad (unweighted); HdiabetestradWT (weighted)

Part 6: Templates and Forms 6-3C-78
Section 3C: Data Book Template WHO STEPS Surveillance
History of Raised Total Cholesterol
Cholesterol
measurement
and
diagnosis
Description: Total cholesterol measurement and diagnosis among all respondents.
Instrument questions:
• Have you ever had your cholesterol (fat levels in your blood) measured by a
doctor or other health worker?
• Have you ever been told by a doctor or other health worker that you have
raised cholesterol?
• Have you been told in the past 12 months?
Total cholesterol measurement and diagnosis
Age Group (years)
Men
n % Never
measured 95% CI
% measured,
not diagnosed
95% CI
% diagnosed,
but not within past 12 months
95% CI
% diagnosed within past 12 months
95% CI
18-29
30-44
45-59
60-69
18-69
Total cholesterol measurement and diagnosis
Age Group (years)
Women
n % Never
measured 95% CI
% measured,
not diagnosed
95% CI
% diagnosed,
but not within past 12 months
95% CI
% diagnosed within past 12 months
95% CI
18-29
30-44
45-59
60-69
18-69
Total cholesterol measurement and diagnosis
Age Group (years)
Both sexes
n % Never
measured 95% CI
% measured,
not diagnosed
95% CI
% diagnosed,
but not within past 12 months
95% CI
% diagnosed within past 12 months
95% CI
18-29
30-44
45-59
60-69
18-69
Analysis Information:
• Questions used: H12, H13a, H13b
• Epi Info program name: Hchol (unweighted); HcholWT (weighted)

Part 6: Templates and Forms 6-3C-79
Section 3C: Data Book Template WHO STEPS Surveillance
Cholesterol
treatment
among
those
diagnosed
Description: Cholesterol treatment results among those previously diagnosed with
raised cholesterol.
Instrument questions:
• Have you ever had your cholesterol (fat levels in your blood) measured by a
doctor or other health worker?
• Have you ever been told by a doctor or other health worker that you have raised
cholesterol?
• In the past two weeks, have you taken oral treatment (medication) for raised
total cholesterol prescribed by a doctor or other health worker?
Currently taking oral treatment (medication) prescribed for raised total cholesterol among those previously
diagnosed
Age Group (years)
Men Women Both Sexes
n % taking
meds 95% CI n
% taking meds
95% CI n % taking
meds 95% CI
18-29
30-44
45-59
60-69
18-69
Analysis Information:
• Questions used: H12, H13a, H14
• Epi Info program name: Hchol (unweighted); HcholWT (weighted)
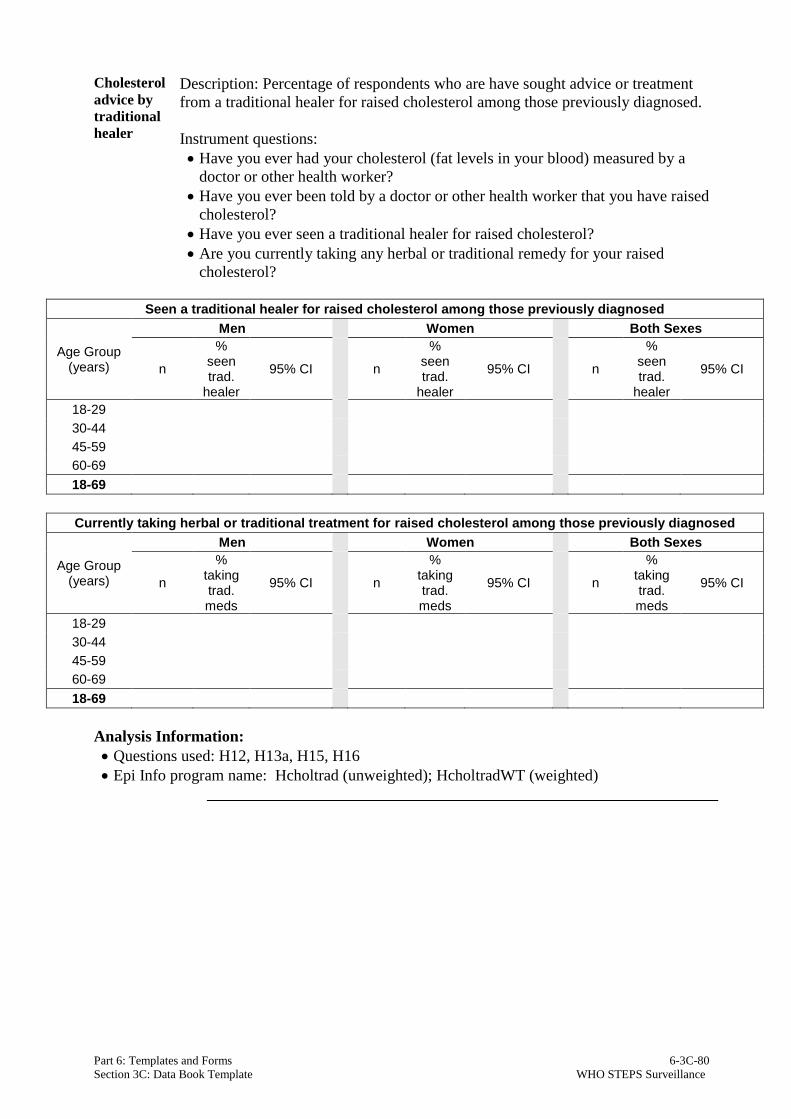
Part 6: Templates and Forms 6-3C-80
Section 3C: Data Book Template WHO STEPS Surveillance
Cholesterol
advice by
traditional
healer
Description: Percentage of respondents who are have sought advice or treatment
from a traditional healer for raised cholesterol among those previously diagnosed.
Instrument questions:
• Have you ever had your cholesterol (fat levels in your blood) measured by a
doctor or other health worker?
• Have you ever been told by a doctor or other health worker that you have raised
cholesterol?
• Have you ever seen a traditional healer for raised cholesterol?
• Are you currently taking any herbal or traditional remedy for your raised
cholesterol?
Seen a traditional healer for raised cholesterol among those previously diagnosed
Age Group (years)
Men Women Both Sexes
n
% seen trad.
healer
95% CI n
% seen trad.
healer
95% CI n
% seen trad.
healer
95% CI
18-29
30-44
45-59
60-69
18-69
Currently taking herbal or traditional treatment for raised cholesterol among those previously diagnosed
Age Group (years)
Men Women Both Sexes
n
% taking trad. meds
95% CI n
% taking trad. meds
95% CI n
% taking trad. meds
95% CI
18-29
30-44
45-59
60-69
18-69
Analysis Information:
• Questions used: H12, H13a, H15, H16
• Epi Info program name: Hcholtrad (unweighted); HcholtradWT (weighted)
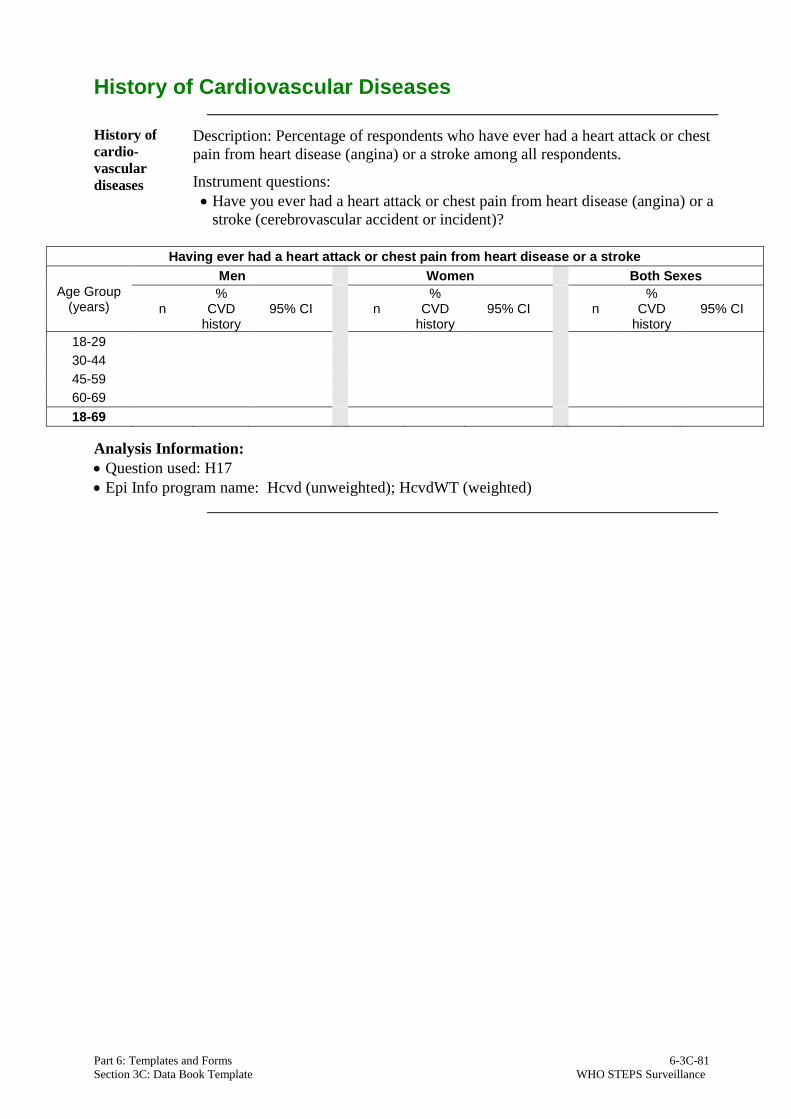
Part 6: Templates and Forms 6-3C-81
Section 3C: Data Book Template WHO STEPS Surveillance
History of Cardiovascular Diseases
History of
cardio-
vascular
diseases
Description: Percentage of respondents who have ever had a heart attack or chest
pain from heart disease (angina) or a stroke among all respondents.
Instrument questions:
• Have you ever had a heart attack or chest pain from heart disease (angina) or a
stroke (cerebrovascular accident or incident)?
Having ever had a heart attack or chest pain from heart disease or a stroke
Age Group (years)
Men Women Both Sexes
n %
CVD history
95% CI n %
CVD history
95% CI n %
CVD history
95% CI
18-29
30-44
45-59
60-69
18-69
Analysis Information:
• Question used: H17
• Epi Info program name: Hcvd (unweighted); HcvdWT (weighted)

Part 6: Templates and Forms 6-3C-82
Section 3C: Data Book Template WHO STEPS Surveillance
Prevention
and
treatment
of heart
disease
Description: Percentage of respondents who are currently taking aspirin or statins
regularly to prevent or treat heart disease.
Instrument questions:
• Are you currently taking aspirin regularly to prevent or treat heart disease?
• Are you currently taking statins (Lovostatin/Simvastatin/Atorvastatin or any
other statin) regularly to prevent or treat heart disease?
Currently taking aspirin regularly to prevent or treat heart disease
Age Group (years)
Men Women Both Sexes
n % taking aspirin
95% CI n % taking aspirin
95% CI n % taking aspirin
95% CI
18-29
30-44
45-59
60-69
18-69
Currently taking statins regularly to prevent or treat heart disease
Age Group (years)
Men Women Both Sexes
n % taking statins
95% CI n % taking statins
95% CI n % taking statins
95% CI
18-29
30-44
45-59
60-69
18-69
Analysis Information:
• Questions used: H18, H19
• Epi Info program name: Hcvdmeds (unweighted); HcvdmedsWT (weighted)

Part 6: Templates and Forms 6-3C-83
Section 3C: Data Book Template WHO STEPS Surveillance
Lifestyle Advice
Lifestyle
advice Description: Percentage of respondents who received lifestyle advice from a doctor
or health worker during the past three years among all respondents.
Instrument question:
• During the past three years, has a doctor or other health worker advised you to do
any of the following?
Advised by doctor or health worker to quit using tobacco or don’t start
Age Group (years)
Men Women Both Sexes
n %
advised 95% CI n
% advised
95% CI n %
advised 95% CI
18-29
30-44
45-59
60-69
18-69
Advised by doctor or health worker to reduce salt in the diet
Age Group (years)
Men Women Both Sexes
n %
advised 95% CI n
% advised
95% CI n %
advised 95% CI
18-29
30-44
45-59
60-69
18-69
Advised by doctor or health worker to eat at least five servings of fruit and/or vegetables each day
Age Group (years)
Men Women Both Sexes
n %
advised 95% CI n
% advised
95% CI n %
advised 95% CI
18-29
30-44
45-59
60-69
18-69
Advised by doctor or health worker to reduce fat in the diet
Age Group (years)
Men Women Both Sexes
n %
advised 95% CI n
% advised
95% CI n %
advised 95% CI
18-29
30-44
45-59
60-69
18-69

Part 6: Templates and Forms 6-3C-84
Section 3C: Data Book Template WHO STEPS Surveillance
Advised by doctor or health worker to start or do more physical activity
Age Group (years)
Men Women Both Sexes
n %
advised 95% CI n
% advised
95% CI n %
advised 95% CI
18-29
30-44
45-59
60-69
18-69
Advised by doctor or health worker to maintain a healthy body weight or to lose weight
Age Group (years)
Men Women Both Sexes
n %
advised 95% CI n
% advised
95% CI n %
advised 95% CI
18-29
30-44
45-59
60-69
18-69
Analysis Information:
• Questions used: H20a-f
• Epi Info program name: Hlifestyle (unweighted); HlifestyleWT (weighted)

Part 6: Templates and Forms 6-3C-85
Section 3C: Data Book Template WHO STEPS Surveillance
Cervical Cancer Screening
Cervical
cancer
screening
Description: Percentage of female respondents who have ever had a screening
test for cervical cancer among all female respondents.
Instrument question:
• Have you ever had a screening test for cervical cancer, using any of these
methods described above?
Age Group (years)
Women
n % ever tested
95% CI
18-29
30-44
45-59
60-69
18-69
Analysis Information:
• Question used: CX1
• Epi Info program name: Hcervcancer (unweighted); HcervcancerWT (weighted)
Cervical
cancer
screening
among
women aged
30-49 years
Description: Percentage of female respondents aged 30-49 years who have ever
had a screening test for cervical cancer among all female respondents aged 30-49
years.
Instrument question:
• Have you ever had a screening test for cervical cancer, using any of these
methods described above?
Analysis Information:
• Question used: CX1
• Epi Info program name: Hcervcancer (unweighted); HcervcancerWT (weighted)
Age Group (years)
Women
n % ever tested
95% CI
30-49

Part 6: Templates and Forms 6-3C-86
Section 3C: Data Book Template WHO STEPS Surveillance
Physical Measurements
Blood pressure
Description: Mean blood pressure among all respondents, including those
currently on medication for raised blood pressure.
Instrument question:
• Reading 1-3 systolic and diastolic blood pressure
Mean systolic blood pressure (mmHg)
Age Group (years)
Men Women Both Sexes
n Mean 95% CI n Mean 95% CI n Mean 95% CI
18-29
30-44
45-59
60-69
18-69
Mean diastolic blood pressure (mmHg)
Age Group (years)
Men Women Both Sexes
n Mean 95% CI n Mean 95% CI n Mean 95% CI
18-29
30-44
45-59
60-69
18-69
Analysis Information:
• Questions used: M4a, M4b, M5a, M5b, M6a, M6b
• Epi Info program name: Mbloodpressure (unweighted); MbloodpressureWT (weighted)

Part 6: Templates and Forms 6-3C-87
Section 3C: Data Book Template WHO STEPS Surveillance
Raised blood
pressure
Description: Percentage of respondents with raised blood pressure.
Instrument question:
• Reading 1-3 systolic and diastolic blood pressure
• During the past two weeks, have you been treated for raised blood pressure
with drugs (medication) prescribed by a doctor or other health worker?
SBP ≥140 and/or DBP ≥ 90 mmHg
Age Group (years)
Men Women Both Sexes
n % 95% CI n % 95% CI n % 95% CI
18-29
30-44
45-59
60-69
18-69
SBP ≥160 and/or DBP ≥ 100 mmHg
Age Group (years)
Men Women Both Sexes
n % 95% CI n % 95% CI n % 95% CI
18-29
30-44
45-59
60-69
18-69
SBP ≥140 and/or DBP ≥ 90 mmHg or currently on medication for raised blood pressure
Age Group (years)
Men Women Both Sexes
n % 95% CI n % 95% CI n % 95% CI
18-29
30-44
45-59
60-69
18-69
SBP ≥160 and/or DBP ≥ 100 mmHg or currently on medication for raised blood pressure
Age Group (years)
Men Women Both Sexes
n % 95% CI n % 95% CI n % 95% CI
18-29
30-44
45-59
60-69
18-69
Analysis Information:
• Questions used: H1, H2a, H3, M4a, M4b, M5a, M5b, M6a, M6b, M7
• Epi Info program name: Mraisedbp (unweighted); MraisedbpWT (weighted)

Part 6: Templates and Forms 6-3C-88
Section 3C: Data Book Template WHO STEPS Surveillance
Blood
pressure
diagnosis,
treatment
and control
Description: Raised blood pressure diagnosis, treatment and control among those
with raised blood pressure (SBP ≥ 140 and/or DBP ≥ 90 mmHg) or on
medication for raised blood pressure.
Instrument questions:
• Have you ever had your blood pressure measured by a doctor or other health
worker?
• Have you ever been told by a doctor or other health worker that you have
raised blood pressure or hypertension?
• During the past two weeks, have you been treated for raised blood pressure
with drugs (medication) prescribed by a doctor or other health worker?
• Reading 1-3 systolic and diastolic blood pressure
Raised blood pressure diagnosis, treatment and control among those with raised blood pressure (SBP ≥ 140
and/or DBP ≥ 90 mmHg) or on medication for raised blood pressure
Age Group (years)
Men
n
% with raised blood
pressure, not
previously diagnosed
95% CI
% with previously diagnosed
raised blood
pressure, not on
medication
95% CI
% with previously diagnosed
raised blood
pressure, on
medication but not
controlled
95% CI
% with previously diagnosed
raised blood
pressure, on
medication and blood pressure controlled
95% CI
18-29
30-44
45-59
60-69
18-69
Raised blood pressure diagnosis, treatment and control among those with raised blood pressure (SBP ≥ 140
and/or DBP ≥ 90 mmHg) or on medication for raised blood pressure
Age Group (years)
Women
n
% with raised blood
pressure, not
previously diagnosed
95% CI
% with previously diagnosed
raised blood
pressure, not on
medication
95% CI
% with previously diagnosed
raised blood
pressure, on
medication but not
controlled
95% CI
% with previously diagnosed
raised blood
pressure, on
medication and blood pressure controlled
95% CI
18-29
30-44
45-59
60-69
18-69

Part 6: Templates and Forms 6-3C-89
Section 3C: Data Book Template WHO STEPS Surveillance
Raised blood pressure diagnosis, treatment and control among those with raised blood pressure (SBP ≥ 140 and/or DBP ≥ 90 mmHg) or on medication for raised blood pressure
Age Group (years)
Both Sexes
n
% with raised blood
pressure, not
previously diagnosed
95% CI
% with previously diagnosed
raised blood
pressure, not on
medication
95% CI
% with previously diagnosed
raised blood
pressure, on
medication but not
controlled
95% CI
% with previously diagnosed
raised blood
pressure, on
medication and blood pressure controlled
95% CI
18-29
30-44
45-59
60-69
18-69
Analysis Information:
• Questions used: H1, H2a, H3, M4a, M4b, M5a, M5b, M6a, M6b, M7
• Epi Info program name: Mraisedbp (unweighted); MraisedbpWT (weighted)
Mean heart
rate Description: Mean heart rate (beats per minute).
Instrument question:
• Reading 1-3 heart rate
Mean heart rate (beats per minute)
Age Group (years)
Men Women Both Sexes
n mean 95% CI n mean 95% CI n mean 95% CI
18-29
30-44
45-59
60-69
18-69
Analysis Information:
• Questions used: M16a, M16b, M16c
• Epi Info program name: Mheartrate (unweighted); MheartrateWT (weighted)

Part 6: Templates and Forms 6-3C-90
Section 3C: Data Book Template WHO STEPS Surveillance
Height,
weight
and BMI
Description: Mean height, weight, and body mass index among all respondents
(excluding pregnant women).
Instrument questions:
• For women: Are you pregnant?
• Height
• Weight
Mean height (cm)
Age Group (years)
Men Women
n Mean 95% CI n Mean 95% CI
18-29
30-44
45-59
60-69
18-69
Mean weight (kg)
Age Group (years)
Men Women
n Mean 95% CI n Mean 95% CI
18-29
30-44
45-59
60-69
18-69
Mean BMI (kg/m2)
Age Group (years)
Men Women Both Sexes
n Mean 95% CI n Mean 95% CI n Mean 95% CI
18-29
30-44
45-59
60-69
18-69
Analysis Information:
• Questions used: M8, M11, M12
• Epi Info program name: Mbmi (unweighted); MbmiWT (weighted)

Part 6: Templates and Forms 6-3C-91
Section 3C: Data Book Template WHO STEPS Surveillance
BMI categories
Description: Percentage of respondents (excluding pregnant women) in each
BMI category.
Instrument questions:
• For women: Are you pregnant?
• Height
• Weight
BMI classifications
Age Group (years)
Men
n % Under-
weight <18.5
95% CI % Normal
weight 18.5-24.9
95% CI % BMI
25.0-29.9 95% CI
% Obese ≥30.0
95% CI
18-29
30-44
45-59
60-69
18-69
BMI classifications
Age Group (years)
Women
n % Under-
weight <18.5
95% CI % Normal
weight 18.5-24.9
95% CI % BMI
25.0-29.9 95% CI
% Obese ≥30.0
95% CI
18-29
30-44
45-59
60-69
18-69
BMI classifications
Age Group (years)
Both Sexes
n % Under-
weight <18.5
95% CI % Normal
weight 18.5-24.9
95% CI % BMI
25.0-29.9 95% CI
% Obese ≥30.0
95% CI
18-29
30-44
45-59
60-69
18-69
Analysis Information:
• Questions used: M8, M11, M12
• Epi Info program name: Mbmiclass (unweighted); MbmiclassWT (weighted)

Part 6: Templates and Forms 6-3C-92
Section 3C: Data Book Template WHO STEPS Surveillance
BMI ≥25
Description: Percentage of respondents (excluding pregnant women) classified
as overweight (BMI≥25).
Instrument questions:
• For women: Are you pregnant?
• Height
• Weight
BMI≥25
Age Group (years)
Men Women Both Sexes
n %
BMI≥25 95% CI n
% BMI≥25
95% CI n %
BMI≥25 95% CI
18-29
30-44
45-59
60-69
18-69
Analysis Information:
• Questions used: M8, M11, M12
• Epi Info program name: Mbmiclass (unweighted); MbmiclassWT (weighted)

Part 6: Templates and Forms 6-3C-93
Section 3C: Data Book Template WHO STEPS Surveillance
Waist
circumference Description: Mean waist circumference among all respondents (excluding
pregnant women).
Instrument questions:
• For women: Are you pregnant?
• Waist circumference measurement
Waist circumference (cm)
Age Group (years)
Men Women
n Mean 95% CI n Mean 95% CI
18-29
30-44
45-59
60-69
18-69
Analysis Information:
• Questions used: M8, M14
• Epi Info program name: Mwaist (unweighted); MwaistWT (weighted)
Hip
circumference Description: Mean hip circumference among all respondents (excluding
pregnant women).
Instrument questions:
• For women: Are you pregnant?
• Hip circumference measurement
Hip circumference (cm)
Age Group (years)
Men Women
n Mean 95% CI n Mean 95% CI
18-29
30-44
45-59
60-69
18-69
Analysis Information:
• Questions used: M8, M15
• Epi Info program name: Mhip (unweighted); MhipWT (weighted)

Part 6: Templates and Forms 6-3C-94
Section 3C: Data Book Template WHO STEPS Surveillance
Waist /
hip ratio Description: Mean waist-to-hip ratio among all respondents (excluding pregnant
women).
Instrument questions:
• For women: Are you pregnant?
• Waist circumference measurement
• Hip circumference measurement
Mean waist / hip ratio
Age Group (years)
Men Women
n Mean 95% CI n Mean 95% CI
18-29
30-44
45-59
60-69
18-69
Analysis Information:
• Questions used: M8, M14, M15
• Epi Info program name: Mwaisthipratio (unweighted); MwaisthipratioWT (weighted)

Part 6: Templates and Forms 6-3C-95
Section 3C: Data Book Template WHO STEPS Surveillance
Biochemical Measurements
Mean
fasting
blood
glucose
Description: mean fasting blood glucose results including those currently on
medication for diabetes (non-fasting recipients excluded).
Instrument questions:
• During the last 12 hours have you had anything to eat or drink, other than
water?
• Blood glucose measurement
Mean fasting blood glucose (mmol/L)
Age Group (years)
Men Women Both Sexes
n Mean 95% CI n Mean 95% CI n Mean 95% CI
18-29
30-44
45-59
60-69
18-69
Mean fasting blood glucose (mg/dl)
Age Group (years)
Men Women Both Sexes
n Mean 95% CI n Mean 95% CI n Mean 95% CI
18-29
30-44
45-59
60-69
18-69
Analysis Information:
• Questions used: B1, B5
• Epi Info program name:
• measurement in mmol/L: Bglucose (unweighted); BglucoseWT (weighted)
• measurement in mg/dl: BglucoseMg (unweighted); BglucoseMgWT (weighted)

Part 6: Templates and Forms 6-3C-96
Section 3C: Data Book Template WHO STEPS Surveillance
Raised blood
glucose
Description: Categorization of respondents into blood glucose level categories
and percentage of respondents currently on medication for raised blood glucose
(non-fasting recipients excluded).
Instrument questions:
• In the past two weeks, have you taken any drugs (medication) for diabetes
prescribed by a doctor or other health worker?
• Are you currently taking insulin for diabetes prescribed by a doctor or other
health worker?
• During the last 12 hours have you had anything to eat or drink, other than
water?
• Blood glucose measurement
• Today, have you taken insulin or other drugs (medication) that have been
prescribed by a doctor or other health worker?
Impaired Fasting Glycaemia*
Age Group (years)
Men Women Both Sexes
n % 95% CI n % 95% CI n % 95% CI
18-29
30-44
45-59
60-69
18-69
Raised blood glucose or currently on medication for diabetes**
Age Group (years)
Men Women Both Sexes
n % 95% CI n % 95% CI n % 95% CI
18-29
30-44
45-59
60-69
18-69
Currently on medication for diabetes
Age Group (years)
Men Women Both Sexes
n % 95% CI n % 95% CI n % 95% CI
18-29
30-44
45-59
60-69
18-69
Analysis Information:
• Questions used: H8, H9, B1, B5, B6
Epi Info program name:
• measurement in mmol/L: Bglucose (unweighted); BglucoseWT (weighted)
• measurement in mg/dl: BglucoseMg (unweighted); BglucoseMgWT (weighted)
* Impaired fasting glycaemia is defined as either
• plasma venous value: ≥6.1mmol/L (110mg/dl) and <7.0mmol/L (126mg/dl)
• capillary whole blood value: ≥5.6mmol/L (100mg/dl) and <6.1mmol/L (110mg/dl)
** Raised blood glucose is defined as either
• plasma venous value: ≥ 7.0 mmol/L (126 mg/dl)
• capillary whole blood value: ≥ 6.1 mmol/L (110 mg/dl)

Part 6: Templates and Forms 6-3C-97
Section 3C: Data Book Template WHO STEPS Surveillance
Blood glucose
diagnosis and
treatment
Description: Raised blood glucose diagnosis and treatment among all
respondents.
Instrument questions:
• Have you ever had your blood sugar measured by a doctor or other health
worker?
• Have you ever been told by a doctor or other health worker that you have
raised blood sugar or diabetes?
• In the past two weeks, have you taken any drugs (medication) for diabetes
prescribed by a doctor or other health worker?
• Are you currently taking insulin for diabetes prescribed by a doctor or other
health worker?
• During the last 12 hours have you had anything to eat or drink, other than
water?
• Blood glucose measurement
• Today, have you taken insulin or other drugs (medication) that have been
prescribed by a doctor or other health worker?
Raised blood glucose diagnosis and treatment among all respondents
Age Group (years)
Men
n
% with raised blood
glucose, not
previously diagnosed
95% CI
% with previously diagnosed
raised blood
glucose, not on
medication
95% CI
% with previously diagnosed
raised blood
glucose, on
medication
95% CI
18-29
30-44
45-59
60-69
18-69
Raised blood glucose diagnosis and treatment among all respondents
Age Group (years)
Women
n
% with raised blood
glucose, not
previously diagnosed
95% CI
% with previously diagnosed
raised blood
glucose, not on
medication
95% CI
% with previously diagnosed
raised blood
glucose, on
medication
95% CI
18-29
30-44
45-59
60-69
18-69

Part 6: Templates and Forms 6-3C-98
Section 3C: Data Book Template WHO STEPS Surveillance
Raised blood glucose diagnosis and treatment among all respondents
Age Group (years)
Both Sexes
n
% with raised blood
glucose, not
previously diagnosed
95% CI
% with previously diagnosed
raised blood
glucose, not on
medication
95% CI
% with previously diagnosed
raised blood
glucose, on
medication
95% CI
18-29
30-44
45-59
60-69
18-69
Analysis Information:
• Questions used: H6, H7a, H8, H9, B1, B5, B6
• Epi Info program name:
• measurement in mmol/L: Bglucose (unweighted); BglucoseWT (weighted)
• measurement in mg/dl: BglucoseMg (unweighted); BglucoseMgWT (weighted)

Part 6: Templates and Forms 6-3C-99
Section 3C: Data Book Template WHO STEPS Surveillance
Total
cholesterol
Description: Mean total cholesterol among all respondents including those
currently on medication for raised cholesterol.
Instrument question:
• Total cholesterol measurement
Mean total cholesterol (mmol/L)
Age Group (years)
Men Women Both Sexes
n Mean 95% CI n Mean 95% CI n Mean 95% CI
18-29
30-44
45-59
60-69
18-69
Mean total cholesterol (mg/dl)
Age Group (years)
Men Women Both Sexes
n Mean 95% CI n Mean 95% CI n Mean 95% CI
18-29
30-44
45-59
60-69
18-69
Analysis Information:
• Questions used: B8
• Epi Info program name:
• measurement in mmol/L: Btotallipids (unweighted); BtotallipidsWT (weighted)
• measurement in mg/dl: BtotallipidsMg (unweighted); BtotallipidsMgWT (weighted)

Part 6: Templates and Forms 6-3C-100
Section 3C: Data Book Template WHO STEPS Surveillance
Raised total
cholesterol
Description: Percentage of respondents with raised total cholesterol.
Instrument questions:
• Total cholesterol measurement
Total cholesterol ≥ 5.0 mmol/L or ≥ 190 mg/dl
Age Group (years)
Men Women Both Sexes
n % 95% CI n % 95% CI n % 95% CI
18-29
30-44
45-59
60-69
18-69
Total cholesterol ≥ 6.2 mmol/L or ≥ 240 mg/dl
Age Group (years)
Men Women Both Sexes
n % 95% CI n % 95% CI n % 95% CI
18-29
30-44
45-59
60-69
18-69
Analysis Information:
• Questions used: B8
• Epi Info program name:
• measurement in mmol/L: Btotallipids (unweighted); BtotallipidsWT (weighted)
• measurement in mg/dl: BtotallipidsMg (unweighted); BtotallipidsMgWT (weighted)

Part 6: Templates and Forms 6-3C-101
Section 3C: Data Book Template WHO STEPS Surveillance
Raised
total
cholesterol
Description: Percentage of respondents with raised total cholesterol and percentage
of respondents currently on medication for raised cholesterol.
Instrument questions:
• Total cholesterol measurement
• During the past two weeks, have you been treated for raised cholesterol with
drugs (medication) prescribed by a doctor or other health worker?
Total cholesterol ≥ 5.0 mmol/L or ≥ 190 mg/dl or currently on medication for raised cholesterol
Age Group (years)
Men Women Both Sexes
n % 95% CI n % 95% CI n % 95% CI
18-29
30-44
45-59
60-69
18-69
Total cholesterol ≥ 6.2 mmol/L or ≥ 240 mg/dl or currently on medication for raised cholesterol
Age Group (years)
Men Women Both Sexes
n % 95% CI n % 95% CI n % 95% CI
18-29
30-44
45-59
60-69
18-69
Analysis Information:
• Questions used: B8, B9
• Epi Info program name:
• measurement in mmol/L: Btotallipids (unweighted); BtotallipidsWT (weighted)
• measurement in mg/dl: BtotallipidsMg (unweighted); BtotallipidsMgWT (weighted)

Part 6: Templates and Forms 6-3C-102
Section 3C: Data Book Template WHO STEPS Surveillance
Introduction
to intake of
salt per day
Levels of sodium and creatinine in spot urine samples are used in STEPS to
estimate population 24 hour salt intake, using the INTERSALT equation:
Estimated 24 hour sodium (Na) intake in mmol for males: 23.51+0.45*spot Na
concentration (mmol/L) -3.09*spot creatinine concentration
(mmol/L)+4.16*BMI+0.22*Age
Estimated 24 hour sodium (Na) intake in mmol for females: 3.74+0.33* spot Na
concentration (mmol/L)-2.44* spot creatinine concentration (mmol/L)+2.42* BMI
+2.34* Age -0.03* Age ^2
The 24 hour sodium values in mmol are divided by 17.1 in order to get grams of salt.
WHO
recommen-
dation
The WHO recommendation is less than 5 grams of salt or 2 grams of sodium per
person per day.
Intake of salt
per day
Description: Mean intake of salt in grams per day among all respondents
Instrument question:
• Are you pregnant?
• Had you been fasting prior to urine collection?
• Urinary sodium measurement
• Urinary creatinine measurement
Mean salt intake (g/day)
Age Group (years)
Men Women Both Sexes
n Mean 95% CI n Mean 95% CI n Mean 95% CI
18-29
30-44
45-59
60-69
18-69
Analysis Information:
• Questions used: M8, B10, B14, B15
• Epi Info program name: Bsalt (unweighted); BsaltWT (weighted)

Part 6: Templates and Forms 6-3C-103
Section 3C: Data Book Template WHO STEPS Surveillance
Mean HDL (mmol/L)
Age Group (years)
Men Women Both Sexes
n Mean 95% CI n Mean 95% CI n Mean 95% CI
18-29
30-44
45-59
60-69
18-69
Mean HDL (mg/dl)
Age Group (years)
Men Women Both Sexes
n Mean 95% CI n Mean 95% CI n Mean 95% CI
18-29
30-44
45-59
60-69
18-69
Percentage of respondents with HDL
<1.03mmol/L or <40 mg/dl
Age Group (years)
Men
n % 95% CI
18-29
30-44
45-59
60-69
18-69
Analysis Information:
• Questions used: B16
• Epi Info program name:
• measurement in mmol/L: Bhdlipids (unweighted); BhdlipidsWT (weighted)
• measurement in mg/dl: BhdlipidsMg (unweighted); BhdlipidsMgWT (weighted)
High
density
lipoprotein
(HDL)
Description: Mean HDL among all respondents and percentage of respondents with
low HDL.
Instrument question:
• HDL cholesterol measurement
Percentage of respondents with HDL <1.29mmol/L or <50 mg/dl
Age Group (years)
Women
n % 95% CI
18-29
30-44
45-59
60-69
18-69

Part 6: Templates and Forms 6-3C-104
Section 3C: Data Book Template WHO STEPS Surveillance
Triglycerides Description: Mean fasting triglycerides among all respondents and percentage of
respondents with raised fasting triglycerides (non-fasting recipients excluded).
Instrument questions:
• During the last 12 hours have you had anything to eat or drink, other than
water?
• Triglyceride measurement
Mean fasting triglycerides (mmol/L)
Age Group (years)
Men Women Both Sexes
n Mean 95% CI n Mean 95% CI n Mean 95% CI
18-29
30-44
45-59
60-69
18-69
Mean fasting triglycerides (mg/dl)
Age Group (years)
Men Women Both Sexes
n Mean 95% CI n Mean 95% CI n Mean 95% CI
18-29
30-44
45-59
60-69
18-69
Percentage of respondents with fasting triglycerides ≥ 1.7 mmol/L or ≥ 150 mg/dl
Age Group (years)
Men Women Both Sexes
n % 95% CI n % 95% CI n % 95% CI
18-29
30-44
45-59
60-69
18-69
Percentage of respondents with fasting triglycerides ≥ 2.0 mmol/L or ≥ 180 mg/dl
Age Group (years)
Men Women Both Sexes
n % 95% CI n % 95% CI n % 95% CI
18-29
30-44
45-59
60-69
18-69
Analysis Information:
• Questions used: B1, B17
• Epi Info program name:
• measurement in mmol/L: Btriglyceride (unweighted); BtriglycerideWT (weighted)
• measurement in mg/dl: BtriglycerideMg (unweighted); BtriglycerideMgWT
(weighted)

Part 6: Templates and Forms 6-3C-105
Section 3C: Data Book Template WHO STEPS Surveillance
Cardiovascular disease risk
CVD risk of
≥30% or
existing
CVD
Description: Percentage of respondents aged 40-69 years with a 10-year
cardiovascular disease (CVD) risk* ≥30% or with existing CVD
Instrument questions: combined from Step 1, 2 and 3
• Gender, age
• Current and former smoking
• History of diabetes, CVD
• Systolic blood pressure measurements
• Fasting status, glucose and total cholesterol measurements.
Percentage of respondents with a 10-year CVD risk ≥30% or with existing CVD
Age Group (years)
Men Women Both Sexes
n % 95% CI n % 95% CI n % 95% CI
40-54
55-69
40-69
Analysis Information:
• Questions used: C1, C2, C3, T1, T8T10, T11a-c, H6, H7a, H17, M4a, M5a, M6a, M7, B1, B5,
B8
• Epi Info program name: CVDrisk (unweighted); CVDriskWT (weighted)
* A 10-year CVD risk of ≥30% is defined according to age, sex, blood pressure, smoking status (current smokers OR those
who quit smoking less than 1 year before the assessment), total cholesterol, and diabetes (previously diagnosed OR a fasting
plasma glucose concentration >7.0 mmol/l (126 mg/dl)).

Part 6: Templates and Forms 6-3C-106
Section 3C: Data Book Template WHO STEPS Surveillance
Drug therapy
and counseling
for those with
CVD risk
≥30% or
existing CVD
Description: Percentage of eligible persons (defined as aged 40-69 years with a
10-year cardiovascular disease (CVD) risk* ≥30%, including those with
existing CVD) receiving drug therapy and counseling** (including glycaemic
control) to prevent heart attacks and strokes.
Instrument questions: combined from Step 1, 2 and 3
• Gender, age
• Current and former smoking
• History of diabetes, CVD
• Lifestyle advice
• Systolic blood pressure measurements
• Fasting status, glucose and total cholesterol measurements.
Percentage of eligible persons receiving drug therapy and counseling to prevent heart attacks and strokes
Age Group (years)
Men Women Both Sexes
n % 95% CI n % 95% CI n % 95% CI
40-54
55-69
40-69
Analysis Information:
• Questions used: C1, C2, C3, T1, T8T10, T11a-c, H6, H7a, H8, H9, H13a, H14, H17, H18,
H19, H20a-f, M4a, M5a, M6a, M7, B1, B5, B8
• Epi Info program name: CVDrisk (unweighted); CVDriskWT (weighted)
* A 10-year CVD risk of ≥30% is defined according to age, sex, blood pressure, smoking status (current smokers OR those
who quit smoking less than 1 year before the assessment), total cholesterol, and diabetes (previously diagnosed OR a fasting
plasma glucose concentration >7.0 mmol/l (126 mg/dl)).
**Counseling is defined as receiving advice from a doctor or other health worker to quit using tobacco or not start, reduce salt
in diet, eat at least five servings of fruit and/or vegetables per day, reduce fat in diet, start or do more physical activity,
maintain a healthy body weight or lose weight.

Part 6: Templates and Forms 6-3C-107
Section 3C: Data Book Template WHO STEPS Surveillance
Summary of Combined Risk Factors
Summary
of
Combined
Risk
Factors
Description: Percentage of respondents with 0, 1-2, or 3-5 of the following risk
factors:
• Current daily smoking
• Less than five servings of fruit and/or vegetables per day
• Not meeting WHO recommendations on physical activity for health (<150
minutes of moderate activity per week, or equivalent)
• Overweight or obese (BMI ≥ 25 kg/m2)
• Raised BP (SBP ≥ 140 and/or DBP ≥ 90 mmHg or currently on medication
for raised BP).
Instrument questions: combined from Step 1 and Step 2
Summary of Combined Risk Factors
Age Group (years)
Men
n % with 0
risk factors
95% CI % with 1-2
risk factors
95% CI % with 3-5
risk factors
95% CI
18-44
45-69
18-69
Summary of Combined Risk Factors
Age Group (years)
Women
n % with 0
risk factors
95% CI % with 1-2
risk factors
95% CI % with 3-5
risk factors
95% CI
18-44
45-69
18-69
Summary of Combined Risk Factors
Age Group (years)
Both Sexes
n % with 0
risk factors
95% CI % with 1-2
risk factors
95% CI % with 3-5
risk factors
95% CI
18-44
45-69
18-69
Analysis Information:
• Questions used: T1, T2, D1-D4, P1-P15b, M4a-M6b, M7, M8, M11, M12
• Epi Info program name: Raisedrisk (unweighted); RaisedriskWT (weighted)

Part 6: Templates and Forms 6-3C-108
Section 3C: Data Book Template WHO STEPS Surveillance

Part 6: Templates and Forms 6-3D-1
Section 3D: Country Report Template WHO STEPS Surveillance
[Country] STEPS Report [year]
Cover and Content Pages
Introduction The cover and content pages at the front of the STEPS country report provide
the formal information needed for library indexing and purchasing, and give
the reader an idea of the structure and content of the report.
Content guide Follow the guidelines in the table below to help prepare the title page and
other leading pages.
Part Include
Title page • title of the report
• authors' names
• institution(s) involved
• release date
Publication details • copyright details
• publishing and indexing information
• address to obtain further copies
• citation of the report
Table of Contents • part and/or section headings with page numbers
• sub level headings
• appendices
• list of tables
• list of figures
Other leading
pages (optional) • list of abbreviations or terms used
• brief notes about the authors
• preface or foreword from a leading authority who
endorses the report
Acknowledgments • all sponsors, including government and other bodies
• consultants and advisers
• staff who have contributed to the survey and the
report
• others providing services and/or support
• participants in the survey

Part 6: Templates and Forms 6-3D-2
Section 3D: Country Report Template WHO STEPS Surveillance
Executive Summary
Introduction The executive summary provides an overview of the entire report in one to
two pages. It should outline the rationale, methodology, key results and
recommendations.
Content guide Follow the guidelines in the table below to help complete the sections of the
executive summary.
Heading Guidelines for completion
Rationale Outline the main reasons for the STEPS survey.
Methodology Briefly describe:
• the scope of the survey;
• the sampling method used;
• methods of data collection and data analysis;
• how the results are presented, for example "weighted
to represent the total national population aged 18 to 69
years".
Key results • Briefly describe the study population and its
characteristics.
• Mention response-rates.
• Select the most important variables (chosen according
to those of most relevance to NCDs in your country)
and present the key results for those variables.
• Mention the other variables that are also included in
the report, but limit results for them.
Conclusion /
Recommendations • Identify the reasons why the findings are important,
and the impact they are likely to be having on the
health of the population.
• Briefly discuss how the results may be useful and
recommended actions.

Part 6: Templates and Forms 6-3D-3
Section 3D: Country Report Template WHO STEPS Surveillance
Introduction
Introduction The introduction should include introductory comments to the report,
outlining the background and purpose for your STEPS survey, and provide a
brief description of STEPS and what the survey results will be used for.
Content guide Follow the guidelines in the table below to help complete the sections of the
introduction.
Heading Guidelines for completion
Introduction • Introduce the STEPS Country Report as the main
report of your STEPS survey.
Background • Provide the reader with background information on
NCDs and their risk factors in your country.
• Include previous surveys that have been done as well
as gaps in knowledge with regards to NCDs and their
risk factors.
• Describe the relevance of each risk factor/item that
will be captured by your STEPS survey.
Description of
STEPS • Provide a brief description of what STEPS is (i.e.
surveillance of key risk factors for NCDs).
Purpose • Explain the general purpose as well as specific
objectives of the STEPS survey in your country.

Part 6: Templates and Forms 6-3D-4
Section 3D: Country Report Template WHO STEPS Surveillance
Methods
Introduction The methods should explain the scope of the STEPS survey, the methods
used for data collection, and the implementation process. Also describe the
sample and analytical methods in sufficient detail to demonstrate that the
survey results are reliable and represent the intended population(s).
Content guide Follow the guidelines in the table below to help complete the methods
section.
Heading Guidelines for completion
Scope • Identify which core Steps (1-3) were covered and if
any expanded and optional items have been added.
Study population • Explain who the results/findings will be representative
for (Geographical coverage, age-groups, general
population).
• Mention inclusion/exclusion criteria (e.g., pregnant
women excluded for height and weight
measurements).
• If the whole country was not covered, explain the
reasons.
Sample size • Explain how the initial sample size was calculated.
Sampling • Describe the sampling method used for the survey
• Mention what sampling frame was used.
• Describe how the sampling units were derived, and
how this was applied in the field.
• Detail the use of clusters (if relevant).
Timeframes • Include information on the overall starting and
completion dates of the survey.
• Specify dates/seasons of data collection.
Staff recruitment
and training • Describe the training programmes provided for the
survey personnel, the number of persons trained, and
the background of trainees.
• Describe the format, content and duration of the
training provided for the survey.
Pilot study • Mention whether a pilot study was done before
conducting the actual survey.
• Explain how the pilot study has been conducted.
Continued on next page
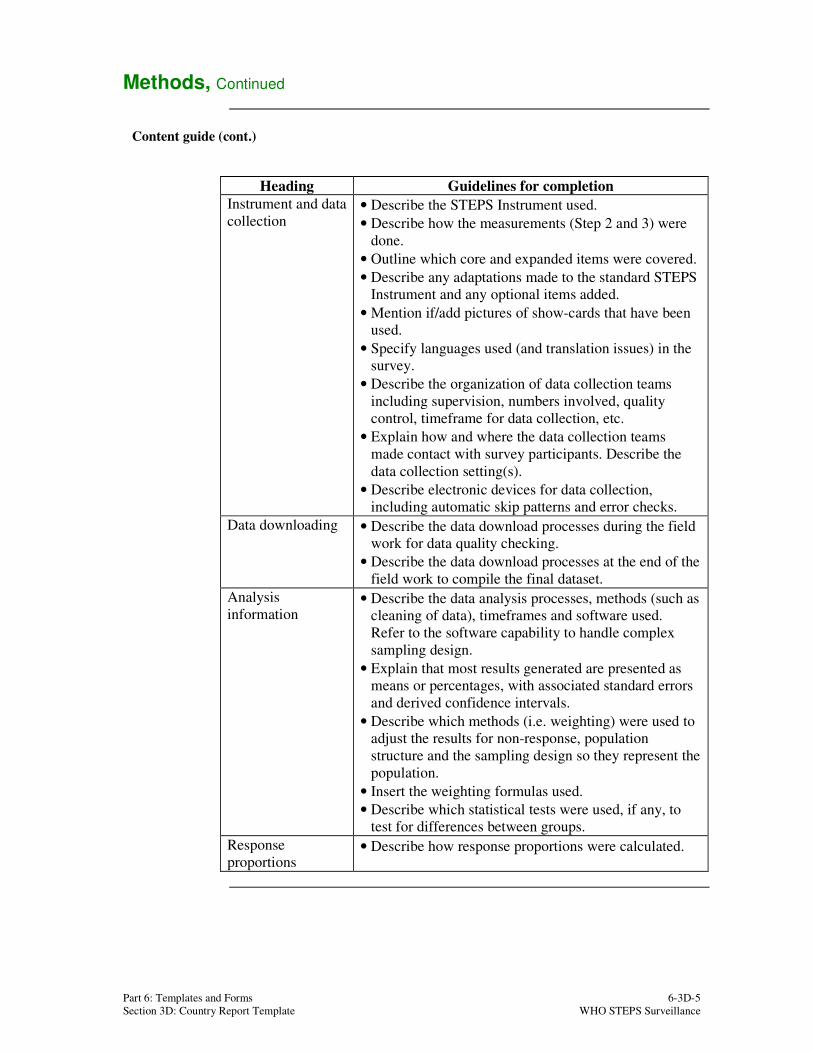
Part 6: Templates and Forms 6-3D-5
Section 3D: Country Report Template WHO STEPS Surveillance
Methods, Continued
Content guide (cont.)
Heading Guidelines for completion
Instrument and data
collection • Describe the STEPS Instrument used.
• Describe how the measurements (Step 2 and 3) were
done.
• Outline which core and expanded items were covered.
• Describe any adaptations made to the standard STEPS
Instrument and any optional items added.
• Mention if/add pictures of show-cards that have been
used.
• Specify languages used (and translation issues) in the
survey.
• Describe the organization of data collection teams
including supervision, numbers involved, quality
control, timeframe for data collection, etc.
• Explain how and where the data collection teams
made contact with survey participants. Describe the
data collection setting(s).
• Describe electronic devices for data collection,
including automatic skip patterns and error checks.
Data downloading • Describe the data download processes during the field
work for data quality checking.
• Describe the data download processes at the end of the
field work to compile the final dataset.
Analysis
information • Describe the data analysis processes, methods (such as
cleaning of data), timeframes and software used.
Refer to the software capability to handle complex
sampling design.
• Explain that most results generated are presented as
means or percentages, with associated standard errors
and derived confidence intervals.
• Describe which methods (i.e. weighting) were used to
adjust the results for non-response, population
structure and the sampling design so they represent the
population.
• Insert the weighting formulas used.
• Describe which statistical tests were used, if any, to
test for differences between groups.
Response
proportions • Describe how response proportions were calculated.

Part 6: Templates and Forms 6-3D-6
Section 3D: Country Report Template WHO STEPS Surveillance
Results
Introduction The results should describe the actual sample obtained and the levels of
participation achieved. Describe the demographic characteristics of the
participants, as well as the results for each risk factor covered in the
Instrument.
Demographic
and response
information
Follow the guidelines in the table below to help prepare information on
demographics and response proportions of the results section.
Heading Guidelines for completion
Demographic
characteristics • Describe the demographic characteristics of the
participants, using the data book for examples.
• Include:
− age-sex distribution
− geographic distribution
− ethnic groups.
Population
distribution • Show the age groups and sex distribution of the
population at the last census if available, e. g., in a
pyramid chart.
Response
proportions • Present the response proportions achieved for Step 1,
2, and 3 as appropriate, using the data book for
examples.
Continued on next page

Part 6: Templates and Forms 6-3D-7
Section 3D: Country Report Template WHO STEPS Surveillance
Results, Continued
Risk factors Present results for each of the following individual risk factors covered in the
Instrument:
• tobacco use
• alcohol consumption
• unhealthy diet (low fruit and vegetable consumption, diet high in salt)
• insufficient physical activity
• overweight and obesity
• raised blood pressure
• raised blood glucose
• abnormal blood lipids.
Risk factor
content guide Follow the guidelines in the table below to help prepare content for each of
the risk factors listed above.
Heading Guidelines for completion
Text description of
main findings • State the main findings in relation to each risk factor.
• Describe any key subgroup differences, e.g., based
on confidence intervals.
• Refer for detail to specific tables from the data book.
Tables and figures • Present in tables, plots or graphs as appropriate the
results, by age and sex groups. Use the data book as
a guide on how to present information in tables.
• Include sample sizes (n) for all age- and sex groups
presented.
• Label carefully to identify if the data are weighted.
• Include measures of confidence when appropriate
(confidence intervals or standard errors).
Additional
description • Describe in words any interesting results.
• If these vary by age or sex, then consider presenting
separately.
Continued on next page

Part 6: Templates and Forms 6-3D-8
Section 3D: Country Report Template WHO STEPS Surveillance
Results, Continued
Combined risk
factors Follow the guidelines in the table below to help prepare content on combined
risk factors.
Heading Guidelines for completion
Relevance of
combining risk
factors
• Briefly outline the relevance of looking at a
combination of risk factors in your country.
• See data book and fact sheet for the risk factors to
combine.
Text description of
main findings • State the main findings in relation to both low risk
(none of the risk factors present) and raised risk
(presence of three or more of the selected risk
factors).
• Describe any key subgroup differences. Refer for
detail to specific tables from the data book.
Tables • Present in tables, plots or graphs as appropriate the
results, by age and sex group. Use the data book as a
guide on how to present information in tables.
• Include sample sizes (n) for all age- and sex groups
presented.
• Label carefully to identify if the data are weighted.
• Include measures of confidence when appropriate
(confidence intervals or standard errors).
Additional
description • Describe in words any interesting results.
• If these vary by age or sex, then consider presenting
separately.

Part 6: Templates and Forms 6-3D-9
Section 3D: Country Report Template WHO STEPS Surveillance
Discussion
Introduction In this part of the STEPS report, any new knowledge derived from the STEPS
survey as well as importance of the findings should be discussed. Discuss the
strengths and weaknesses of the methods used and the results presented, and
any reservations in their interpretation or use.
Content guide Follow the guidelines in the table below to help prepare content of the
discussion.
Heading Guidelines for completion
Representation • Comment on the extent to which the results apply
to the whole population or only to the individuals
who were surveyed (depends on if data are
weighted).
Comment on
participation
Discuss the impact on the interpretation of results of
any sampling or participation issues such as:
• the participation levels varied between population
groups such as older vs. younger men;
• recruiting did not proceed as planned and a non-
random sample was selected.
Key results and new
knowledge
Repeat key results, mention their importance and
how they can be used for prevention planning and
to formulate policy. Include, for example:
• what was known before about these topics for this
population?
• what is added by this report?
• what are the key new findings of importance and
why are these important?
• what impact will these have on the health of the
population, in particular in respect to the burden
of NCDs either currently or in the future?
Previous surveys • Mention any previous STEPS surveys or similar
surveys and how the findings relate.
Limitations and
strengths • Comment on the quality of the survey and
measures, and therefore their reliability.
• Identify where issues have arisen during data
collection or analysis that may mean caution is
needed when interpreting some results.
• Also mention the strengths of the survey, such as
representativeness, Step 2 and 3 measurements,
etc.
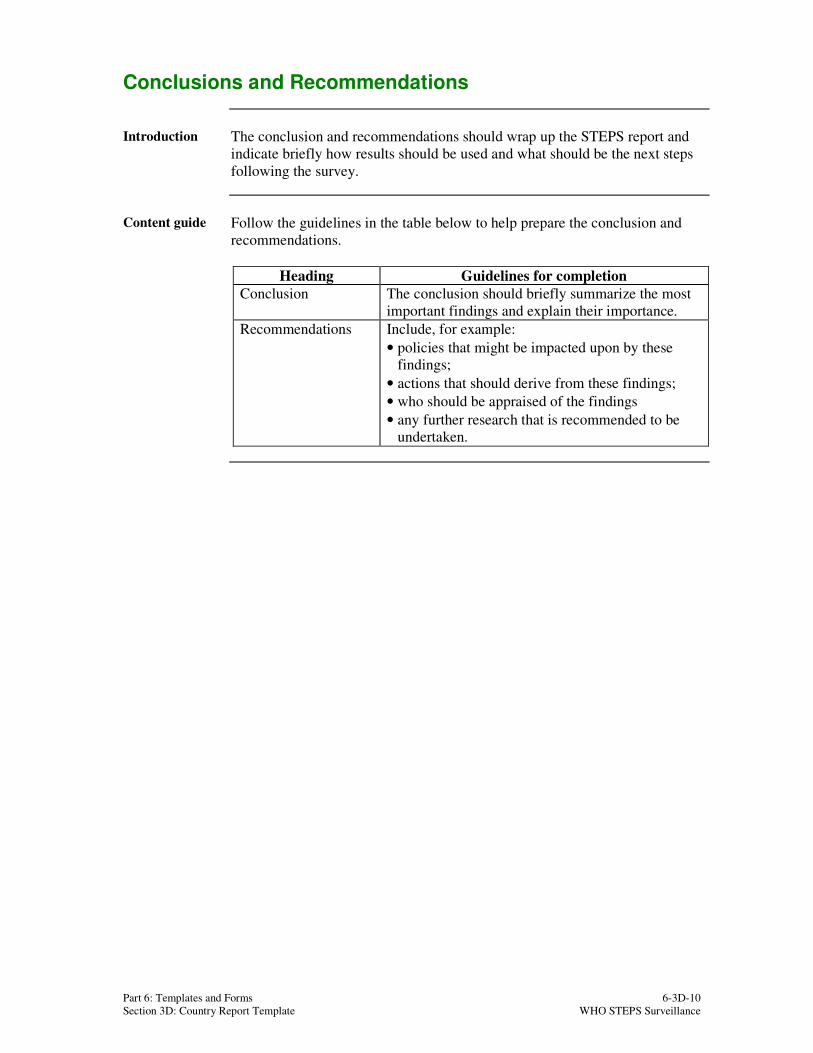
Part 6: Templates and Forms 6-3D-10
Section 3D: Country Report Template WHO STEPS Surveillance
Conclusions and Recommendations
Introduction The conclusion and recommendations should wrap up the STEPS report and
indicate briefly how results should be used and what should be the next steps
following the survey.
Content guide Follow the guidelines in the table below to help prepare the conclusion and
recommendations.
Heading Guidelines for completion
Conclusion The conclusion should briefly summarize the most
important findings and explain their importance.
Recommendations Include, for example:
• policies that might be impacted upon by these
findings;
• actions that should derive from these findings;
• who should be appraised of the findings
• any further research that is recommended to be
undertaken.

Part 6: Templates and Forms 6-3D-11
Section 3D: Country Report Template WHO STEPS Surveillance
References
Introduction The reference section should contain a reference list of any sources used to
write the report.
Note: All figures used in the report that are not the results of the current survey
need to have accompanying references in the reference section of the report.

Part 6: Templates and Forms 6-3D-12
Section 3D: Country Report Template WHO STEPS Surveillance
Appendices
Appendix A Country-specific STEPS Instrument
Appendix B Show cards used
Appendix C Survey Implementation Plan
Appendix D Fact Sheet
Appendix E Data Book


![topic6 actionview [Schreibgeschützt] [Kompatibilitätsmodus] · Overview ActionView ERB-Templates Layouts Partials Helper Methods Forms Basic Techniques and AJAXBasic Techniques](https://img.dokumen.tips/doc/110x75/5ed1f867190a062286779456/topic6-actionview-schreibgeschtzt-kompatibilittsmodus-overview-actionview.jpg)