Embed Size (px)
Citation preview
CairnsPlan 2016 Version 2.1 Part 4 │ Page 34
Part 4 Local government infrastructure plan
4.1 Preliminary
(1) This local government infrastructure plan has been prepared in accordance with the requirements of the Planning Act 2016.
(2) The purpose of the local government infrastructure plan is to:
(a) integrate infrastructure planning with the land-use planning identified in the planning scheme;
(b) provide transparency regarding a local government’s intentions for the provision of trunk infrastructure;
(c) enable a local government to estimate the cost of infrastructure provision to assist its long-term financial planning;
(d) ensure that trunk infrastructure is planned and provided in an efficient and orderly manner;
(e) provide a basis for the imposition of conditions about infrastructure on development approvals.
(3) The local government infrastructure plan:
(a) states in Section 4.2 (planning assumptions) the assumptions about future growth and urban development including the assumptions of demand for each trunk infrastructure network;
(b) identifies in Section 4.3 (priority infrastructure area) the prioritised area to accommodate urban growth up to 2028;
(c) states in Section 4.4 (desired standards of service) for each trunk infrastructure network the desired standard of performance;
(d) identifies in Section 4.5 (plans for trunk infrastructure) the existing and future trunk infrastructure for the following networks:
(i) water supply;
(ii) wastewater;
(iii) stormwater;
(iv) transport (roads);
(v) transport (pedestrian and cycle movement);
(vi) parks and land for community facilities.
(e) Identifies in Section 4.6 (extrinsic material) a list of supporting documents that assist in the interpretation of the local government infrastructure plan.
4.2 Planning assumptions
(1) The planning assumptions state the assumptions about:
(a) population and employment growth;
(b) the type, scale, location and timing of development including the demand for each trunk infrastructure network.
(2) The planning assumptions together with the desired standards of service, form the basis for the planning of the trunk infrastructure networks and the determination of the priority infrastructure area.
CairnsPlan 2016 Version 2.1 Part 4 │ Page 35
(3) The planning assumptions have been prepared for:
(a) the base date 2018 and the following projection years:
(i) mid 2021;
(ii) mid 2026;
(iii) mid 2031;
(iv) mid 2036;
(v) ultimate development.
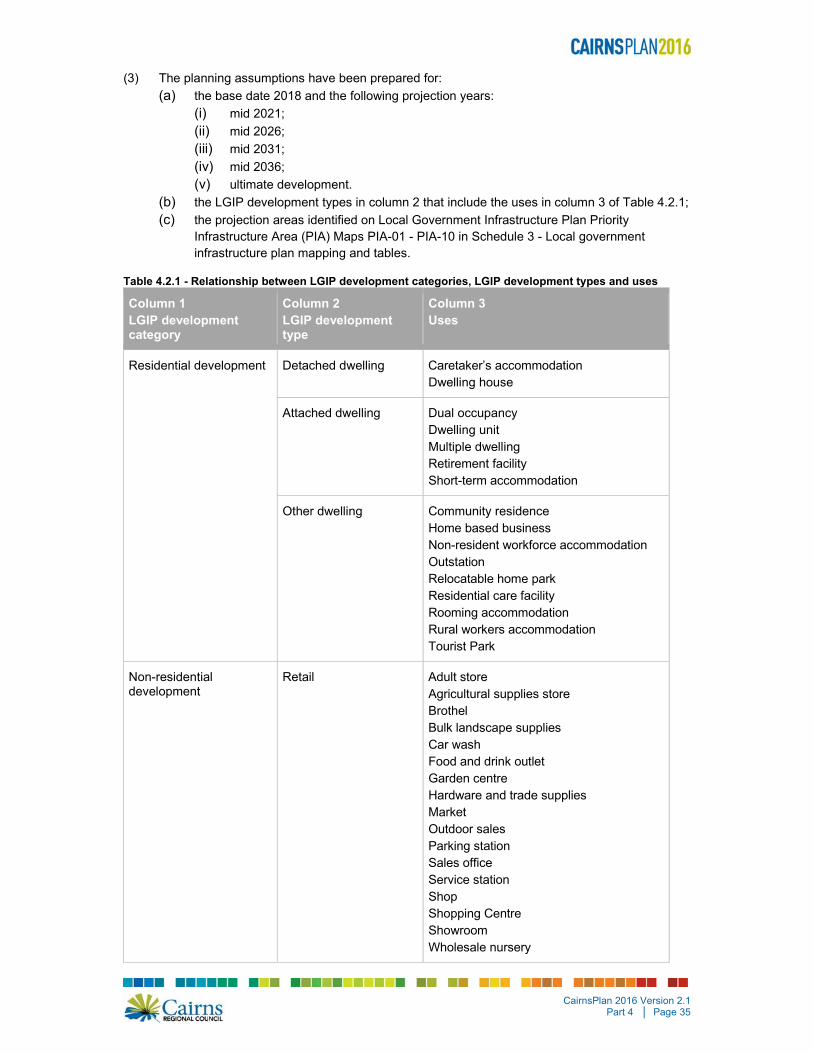
(b) the LGIP development types in column 2 that include the uses in column 3 of Table 4.2.1;
(c) the projection areas identified on Local Government Infrastructure Plan Priority Infrastructure Area (PIA) Maps PIA-01 - PIA-10 in Schedule 3 - Local government infrastructure plan mapping and tables.
Table 4.2.1 - Relationship between LGIP development categories, LGIP development types and uses
Column 1 LGIP development category
Column 2 LGIP development type
Column 3 Uses
Residential development Detached dwelling Caretaker’s accommodation Dwelling house
Attached dwelling Dual occupancy Dwelling unit Multiple dwelling Retirement facility Short-term accommodation
Other dwelling Community residence Home based business Non-resident workforce accommodation Outstation Relocatable home park Residential care facility Rooming accommodation Rural workers accommodation Tourist Park
Non-residential development
Retail Adult store Agricultural supplies store Brothel Bulk landscape supplies Car wash Food and drink outlet Garden centre Hardware and trade supplies Market Outdoor sales Parking station Sales office Service station Shop Shopping Centre Showroom Wholesale nursery

CairnsPlan 2016 Version 2.1 Part 4 │ Page 36
Column 1 LGIP development category
Column 2 LGIP development type
Column 3 Uses
Commercial Bar Club Function facility Hotel Indoor sport and recreation Nature-based tourism Nightclub entertainment facility Office Resort complex Theatre Tourist attraction Veterinary services
Industry Extractive Industry High impact industry Low impact industry Marine industry Medium impact industry Research and technology industry Service industry Special industry Transport depot Warehouse
Community Purposes Cemetery Child care centre Community care centre Crematorium Community use Detention facility Educational establishment Emergency services Funeral parlour Health care services Hospital Major sport, recreation and entertainment facility Motor sport facility Outdoor sport and recreation Park Place of Worship
Other Uses Air services Animal Husbandry Animal keeping Aquaculture Cropping Environment facility Intensive animal industry
CairnsPlan 2016 Version 2.1 Part 4 │ Page 37
Column 1 LGIP development category
Column 2 LGIP development type
Column 3 Uses
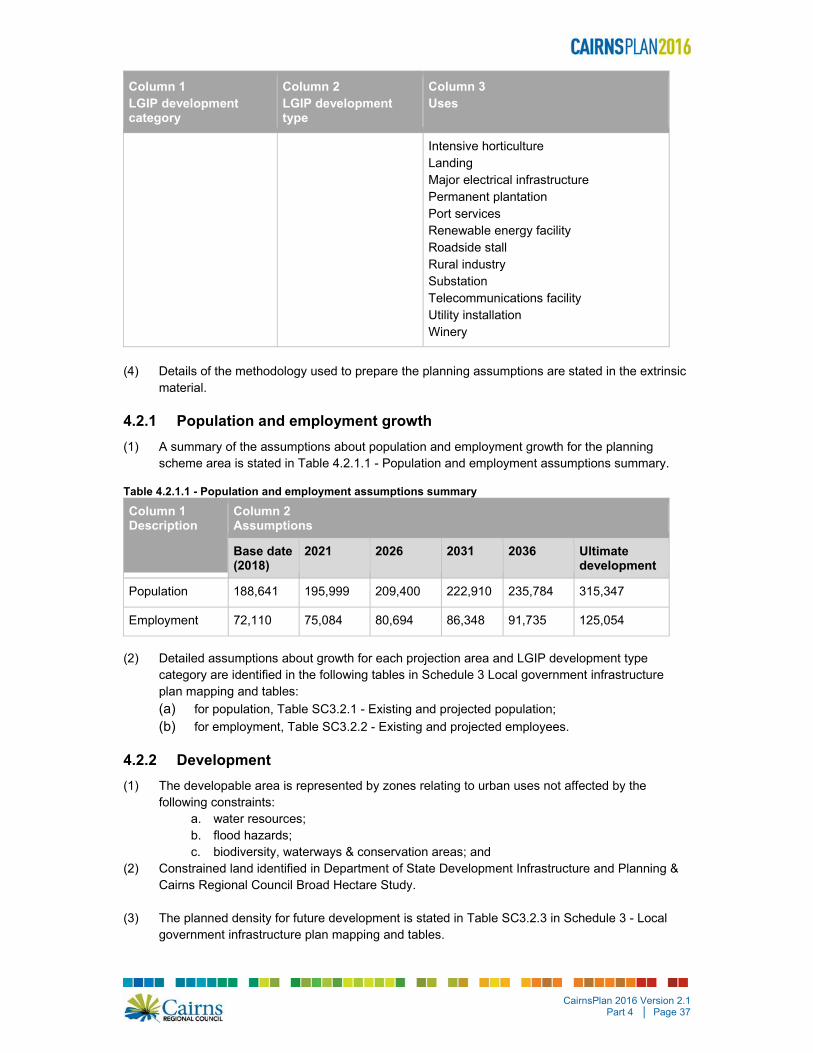
Intensive horticulture Landing Major electrical infrastructure Permanent plantation Port services Renewable energy facility Roadside stall Rural industry Substation Telecommunications facility Utility installation Winery
(4) Details of the methodology used to prepare the planning assumptions are stated in the extrinsic
material.
4.2.1 Population and employment growth
(1) A summary of the assumptions about population and employment growth for the planning scheme area is stated in Table 4.2.1.1 - Population and employment assumptions summary.
Table 4.2.1.1 - Population and employment assumptions summary
Column 1 Description
Column 2 Assumptions
Base date (2018)
2021 2026 2031 2036 Ultimate development
Population 188,641 195,999 209,400 222,910 235,784 315,347
Employment 72,110 75,084 80,694 86,348 91,735 125,054
(2) Detailed assumptions about growth for each projection area and LGIP development type
category are identified in the following tables in Schedule 3 Local government infrastructure plan mapping and tables:
(a) for population, Table SC3.2.1 - Existing and projected population;
(b) for employment, Table SC3.2.2 - Existing and projected employees.
4.2.2 Development
(1) The developable area is represented by zones relating to urban uses not affected by the following constraints:
a. water resources; b. flood hazards; c. biodiversity, waterways & conservation areas; and
(2) Constrained land identified in Department of State Development Infrastructure and Planning & Cairns Regional Council Broad Hectare Study.
(3) The planned density for future development is stated in Table SC3.2.3 in Schedule 3 - Local government infrastructure plan mapping and tables.

CairnsPlan 2016 Version 2.1 Part 4 │ Page 38
(4) A summary of the assumptions about future residential and non-residential development for the planning scheme area is stated in Table 4.2.2.1 - Residential dwellings and non-residential floor space assumptions summary.
Table 4.2.2.1 - Residential dwellings and non-residential floor space assumptions summary
Column 1 Description
Column 2 Assumptions
Base date (2018)
2021 2026 2031 2036 Ultimate development
Residential dwellings
75,294 78,657 84,744 90,898 96,438 128,980
Non-residential floor space (m2 GFA)
3,767,562 3,922,964 4,216,079 4,511,471 4,792,941 6,533,779
(5) Detailed assumptions about future development for each projection area and LGIP development
type are identified in the following tables in Schedule 3 Local government infrastructure plan mapping and tables:
(a) for residential development, Table SC3.2.5 - Existing and projected residential dwellings;
(b) for non-residential development, Table SC3.2.6 - Existing and projected non-residential floor space.
4.2.3 Infrastructure demand
(1) The demand generation rate for a trunk infrastructure network is stated in Column 3 of Table SC3.2.4 - Planned density and demand generation rate for a trunk infrastructure network in Schedule 3 Local government infrastructure plan mapping and tables.
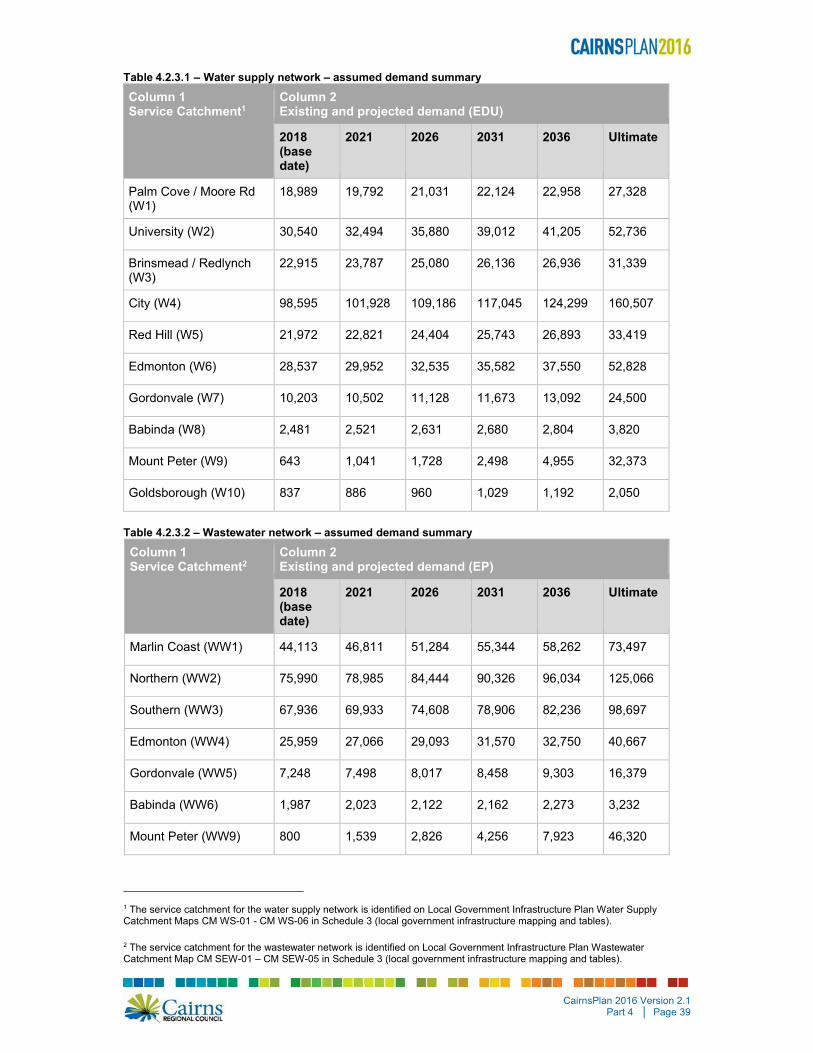
(2) A summary of the projected infrastructure demand for each service catchment is stated in:
(a) for the water supply network, Table 4.2.3.1 – Water supply network – assumed demand summary;
(b) for the wastewater network, Table 4.2.3.2 – Wastewater network – assumed demand summary;
(c) for the stormwater network, Table 4.2.3.3 – Stormwater network – assumed summary;
(d) for the transport (roads) network, Table 4.2.3.4 – Transport (roads) network – assumed demand summary;
(e) for the transport (pedestrian and cycle) network, Table 4.2.3.5 –Transport (pedestrian and cycle movement) network – assumed demand summary;
(f) for the parks and land for community facilities network, Table 4.2.3.6 – parks and land for community facilities network – assumed demand summary.
CairnsPlan 2016 Version 2.1 Part 4 │ Page 39
Table 4.2.3.1 – Water supply network – assumed demand summary
Column 1 Service Catchment1
Column 2 Existing and projected demand (EDU)
2018 (base date)
2021 2026 2031 2036 Ultimate
Palm Cove / Moore Rd (W1)
18,989 19,792 21,031 22,124 22,958 27,328
University (W2) 30,540 32,494 35,880 39,012 41,205 52,736
Brinsmead / Redlynch (W3)
22,915 23,787 25,080 26,136 26,936 31,339
City (W4) 98,595 101,928 109,186 117,045 124,299 160,507
Red Hill (W5) 21,972 22,821 24,404 25,743 26,893 33,419
Edmonton (W6) 28,537 29,952 32,535 35,582 37,550 52,828
Gordonvale (W7) 10,203 10,502 11,128 11,673 13,092 24,500
Babinda (W8) 2,481 2,521 2,631 2,680 2,804 3,820
Mount Peter (W9) 643 1,041 1,728 2,498 4,955 32,373
Goldsborough (W10) 837 886 960 1,029 1,192 2,050
Table 4.2.3.2 – Wastewater network – assumed demand summary
Column 1 Service Catchment2
Column 2 Existing and projected demand (EP)
2018 (base date)
2021 2026 2031 2036 Ultimate
Marlin Coast (WW1) 44,113 46,811 51,284 55,344 58,262 73,497
Northern (WW2) 75,990 78,985 84,444 90,326 96,034 125,066
Southern (WW3) 67,936 69,933 74,608 78,906 82,236 98,697
Edmonton (WW4) 25,959 27,066 29,093 31,570 32,750 40,667
Gordonvale (WW5) 7,248 7,498 8,017 8,458 9,303 16,379
Babinda (WW6) 1,987 2,023 2,122 2,162 2,273 3,232
Mount Peter (WW9) 800 1,539 2,826 4,256 7,923 46,320
1 The service catchment for the water supply network is identified on Local Government Infrastructure Plan Water Supply Catchment Maps CM WS-01 - CM WS-06 in Schedule 3 (local government infrastructure mapping and tables).
2 The service catchment for the wastewater network is identified on Local Government Infrastructure Plan Wastewater Catchment Map CM SEW-01 – CM SEW-05 in Schedule 3 (local government infrastructure mapping and tables).

CairnsPlan 2016 Version 2.1 Part 4 │ Page 40
Table 4.2.3.3 – Stormwater network – assumed demand summary
Column 1 Service Catchment3
Column 2 Existing and projected demand (Impervious Ha)
2018 (base date)
2021 2026 2031 2036 Ultimate
Palm Cove (SW1) 32 32 33 34 35 41
Sweet Creek (SW2) 29 30 32 33 35 44
Delaney Creek (SW3) 33 34 37 39 41 52
Deadmans Gully/Clifton Beach (SW4)
38 39 40 41 42 47
Deep Creek/Kewarra Beach (SW5)
112 115 120 125 129 152
Cayley Street Drain/Trinity Beach (SW6)
85 86 88 90 92 99
Moores Gully/Trinity Park (SW7)
86 90 95 101 105 133
Smithfield/Yorkeys Knob/Moon River (SW8)
251 266 289 311 330 435
Barron River Delta (SW9)
46 48 52 56 59 77
Richters/Thomatis Creek (SW9a)
42 43 44 46 47 53
Barr Creek (SW9b) 50 51 53 55 56 62
Redden Creek (SW9c) 21 21 22 23 23 26
Stony Creek/Rainforest Estate (SW10)
9 9 9 9 9 10
Kamerunga (SW11) 14 15 16 16 17 20
Lower Freshwater (SW12)
65 67 70 72 74 87
Stratford (SW13) 45 46 47 48 49 55
Redlynch (SW14) 28 29 31 33 34 42
Marinos (SW15) 31 33 36 39 41 55
Shaws Road (SW16) 4 4 5 5 5 5
3 The service catchment for the wastewater network is identified on Local Government Infrastructure Plan Stormwater Catchment Map CM SW-01 – CM SW-06 in Schedule 3 (local government infrastructure mapping and tables).

CairnsPlan 2016 Version 2.1 Part 4 │ Page 41
Bella Vista Main Drain (SW17)
81 82 84 86 87 95
Rices Gully (SW18) 32 33 34 35 35 39
Freshwater Creek (SW19)
84 87 93 98 103 130
Cheepi Creek (SW20) 6 6 6 6 7 7
Saltwater Creek (SW21) 402 408 420 431 441 490
Cairns Business District (SW22)
205 207 211 215 219 240
Fearnley Street Drain (SW23)
191 195 202 209 216 250
Chinaman Creek (SW24)
636 648 669 690 708 805
Clarkes Creek (SW25) 79 80 83 85 87 96
Gordon Creek (SW26) 116 119 123 127 131 150
Crowleys Creek (SW27) 61 62 63 65 67 77
Sawpit Gully (SW28) 84 85 88 90 92 106
Skeleton Creek (SW30) 208 213 221 229 236 288
Blackfellows Creek (SW31)
152 163 180 200 219 383
Collinson Mckinnon Creek (SW32)
139 146 159 173 187 303
Stony Creek (SW33) 17 18 21 24 27 55
Wrights Creek (SW34) 21 36 60 86 119 411
Mackey Creek (SW35) 38 46 59 73 91 244
O'learys Creek (SW36) 103 106 112 117 124 169
Fishery Falls/Deeral (SW37)
10 10 11 12 12 15

CairnsPlan 2016 Version 2.1 Part 4 │ Page 42
Babinda (SW38) 56 59 65 70 76 117
Bramston Beach (SW39) 13 13 14 14 15 19
Vico Street (SW40) 27 28 30 31 33 42
River Stone (SW41) 62 64 68 72 77 116
Table 4.2.3.4 – Transport (roads) network – assumed demand summary
Column 1 Service Catchment4
Column 2 Existing and projected demand (Trips)
2018 (base date)
2021 2026 2031 2036 Ultimate
Cairns Urban (TR1) 823,708 870,216 946,718 1,025,106 1,095,098 1,522,514
Gordonvale / Goldsborough (TR2)
35,006 36,451 38,805 40,856 45,333 76,649
Babinda (TR3) 8,964 9,275 9,908 10,216 10,895 16,289
Rural Lands (TR4) 19,226 19,752 20,550 21,307 22,435 27,492
Table 4.2.3.5 – Transport (pedestrian and cycle) network – assumed demand summary
Column 1 Service Catchment5
Column 2 Existing and projected demand (EDU)
2018 (base date)
2021 2026 2031 2036 Ultimate
Cairns Urban (TR1) 623,744 656,837 708,570 761,820 807,814 1,074,287
Gordonvale / Goldsborough (TR2)
27,463 28,516 30,158 31,454 34,865 57,020
Babinda (TR3) 5,986 6,088 6,167 6,271 6,367 6,963
Rural Lands (TR4) 14,263 14,634 15,144 15,612 16,464 19,817
4 The service catchment for the transport (roads) network is identified on Local Government Infrastructure Plan Transport Catchment Map CM TR-01 – CM TR-03 in Schedule 3 (local government infrastructure mapping and tables).
5 The service catchment for the transport (pedestrian and cycle) network is identified on Local Government Infrastructure Plan Transport Catchment Map CM TR-P-01 – CM TR-P-03 in Schedule 3 (local government infrastructure mapping and tables).

CairnsPlan 2016 Version 2.1 Part 4 │ Page 43
Table 4.2.3.6 – Parks and land for community facilities network – assumed demand summary
Column 1 Service Catchment6
Column 2 Existing and projected demand (Persons)
2018 (base date)
2021 2026 2031 2036 Ultimate
Cairns Beaches (N1) 22,703 23,585 25,284 26,910 28,098 33,858
Barron - Smithfield (N2) 19,427 20,360 22,195 23,783 24,784 30,038
Freshwater - Stratford - Aeroglen (C1)
4,269 4,346 4,524 4,668 4,769 5,410
Redlynch Valley (C2) 9,133 9,488 10,102 10,589 10,925 12,825
Inner Suburbs (C3) 64,749 65,798 69,897 73,488 76,083 87,521
CBD - North Cairns (C4) 17,994 18,988 20,690 23,169 26,097 38,935
Portsmith - Woree Industrial (C5)
966 1,032 1,102 1,175 1,242 1,568
White Rock - Edmonton (C6)
32,683 33,561 35,613 38,039 38,975 44,462
Mt Peter (S1) 472 810 1,402 2,068 4,599 33,120
Gordonvale – Goldsborough (S2)
5,541 5,628 5,917 6,113 6,772 11,538
Babinda (R1) 1,506 1,499 1,512 1,517 1,531 1,671
Rural Towns and Villages (R2)
1,316 1,305 1,319 1,330 1,435 1,865
Northern (N1 & N2) 43,740 45,545 49,100 52,331 54,551 65,711
Central (C1 to C6) 132,370 135,755 144,481 153,692 160,676 193,428
Sothern (S1 & S2) 8,253 8,717 9,703 10,661 14,089 48,631
Remainder (R1 & R2) 5,730 5,740 5,869 5,974 6,210 7,284
Cairns City (All Areas) 190,093 195,756 209,152 222,658 235,525 315,054
6 The service catchment for the transport (pedestrian and cycle) network is identified on Local Government Infrastructure Plan Transport Catchment Map CM TR-P-01 – CM TR-P-03 in Schedule 3 (local government infrastructure mapping and tables).

CairnsPlan 2016 Version 2.1 Part 4 │ Page 44
4.3 Priority infrastructure area
(1) The priority infrastructure area identifies the area prioritised for the provision of trunk infrastructure to service the existing and assumed future urban development up to 2028.
(2) The priority infrastructure area is identified on Local Government Infrastructure Plan Priority Infrastructure Area (PIA) Maps PIA-01 – PIA-10 in Schedule 3 - Local government infrastructure plan mapping and tables.
4.4 Desired standards of service
(1) This section states the key standards of performance for a trunk infrastructure network.
(2) Details of the standard of service for a trunk infrastructure networks are identified in the extrinsic material.
4.4.1 Water supply network
Table 4.4.1.1 – Desired Standards of Service – Water Supply
Planning Standard Community Outcome
Ensure drinking water complies with the NHMRC Australian Drinking Water Guidelines.
Provides uniform quality of water monitored in relation to recognised standards
Provide a safe and reliable water supply Safeguards community health
Water infrastructure provides for system operation and monitoring in accordance with recognised standards.
Ensures environmental controls are maintained
Ensures potable water is provided in a manner consistent with environmental standards
Reduce non-revenue water (water that has been produced and is ‘lost’ before it reaches the customer, including physical losses or leakages, commercial losses such as water meter inaccuracies, unauthorised consumption, and data handling errors, and unbilled authorised consumption such as water used for firefighting).
Extend asset life Improve environmental flows Reduced greenhouse gas emissions Reduce extraction of water from source
Provide infrastructure which optimises whole of life costs.
Cost effective service for community Reduced energy cost Reduced greenhouse gas emissions Reduced maintenance costs Reduced overall operation costs Reduced replacement costs Reduction in disposal of waste Reduced environmental effects from
chemical production
CairnsPlan 2016 Version 2.1 Part 4 │ Page 45
Design Standard Community Outcome
Design water supply infrastructure to comply with: Far North Queensland Regional
Organisation of Councils (FNQROC) Development Manual, where relevant to Trunk Infrastructure
Customer Service Standards Water Act 2000 Plans for Trunk Infrastructure – Water
Supply
Provides uniform quality of water monitored in relation to recognised standards
Provide a safe and reliable water supply Safeguards community health
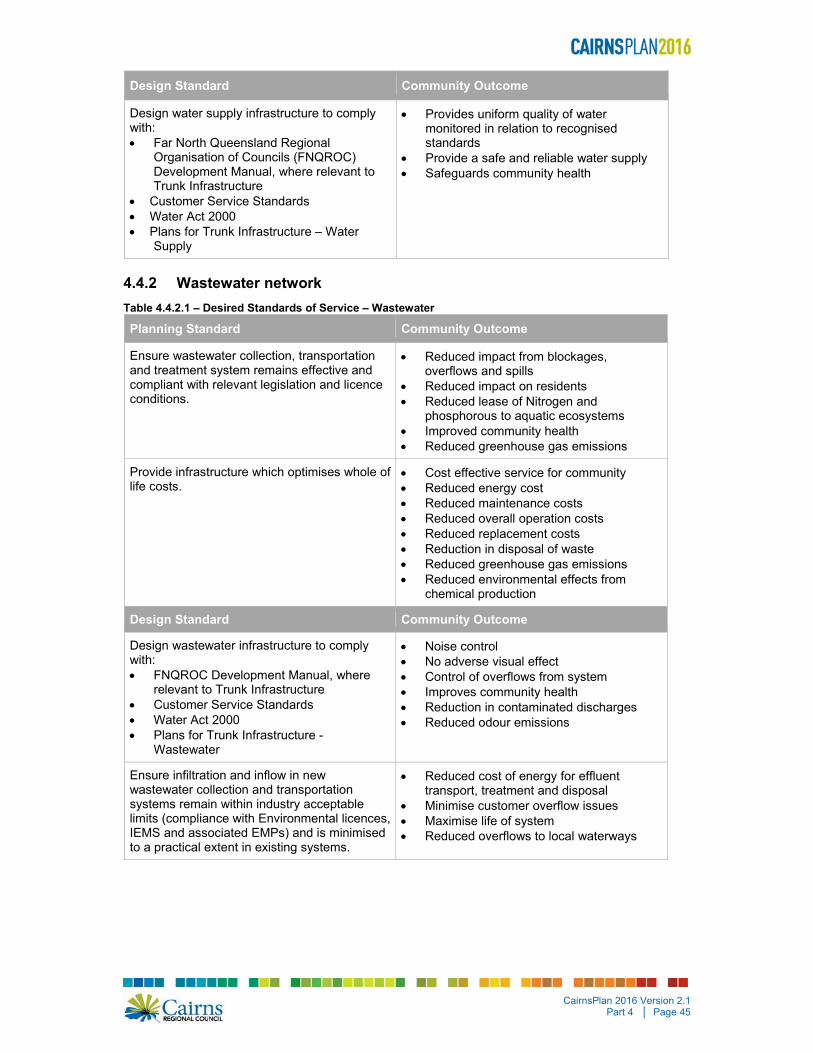
4.4.2 Wastewater network
Table 4.4.2.1 – Desired Standards of Service – Wastewater
Planning Standard Community Outcome
Ensure wastewater collection, transportation and treatment system remains effective and compliant with relevant legislation and licence conditions.
Reduced impact from blockages, overflows and spills
Reduced impact on residents Reduced lease of Nitrogen and
phosphorous to aquatic ecosystems Improved community health Reduced greenhouse gas emissions
Provide infrastructure which optimises whole of life costs.
Cost effective service for community Reduced energy cost Reduced maintenance costs Reduced overall operation costs Reduced replacement costs Reduction in disposal of waste Reduced greenhouse gas emissions Reduced environmental effects from
chemical production
Design Standard Community Outcome
Design wastewater infrastructure to comply with: FNQROC Development Manual, where
relevant to Trunk Infrastructure Customer Service Standards Water Act 2000 Plans for Trunk Infrastructure -
Wastewater
Noise control No adverse visual effect Control of overflows from system Improves community health Reduction in contaminated discharges Reduced odour emissions
Ensure infiltration and inflow in new wastewater collection and transportation systems remain within industry acceptable limits (compliance with Environmental licences, IEMS and associated EMPs) and is minimised to a practical extent in existing systems.
Reduced cost of energy for effluent transport, treatment and disposal
Minimise customer overflow issues Maximise life of system Reduced overflows to local waterways

CairnsPlan 2016 Version 2.1 Part 4 │ Page 46
4.4.3 Stormwater network
Table 4.4.3.1 – Desired Standards of Service – Stormwater
Planning Standard Community Outcome
Provide a system of shared stormwater infrastructure allowing for safe drainage of urban land while maintaining or improving the quality of run-off.
Minimises inundation of habitable areas Minimises the damage and risk associated
with flooding Minimises the impact of development on
the ecological health and water quality within waterway corridor
Ensure the use of Water Sensitive Urban Design and other types of on-site infrastructure to minimise impact on the natural environment
Provides waterways infrastructure at the lowest life cycle cost
Reduces the scale of built infrastructure by optimising on site solutions
Improves water quality at the point of discharge to benefit the natural waterway corridor’s health
Ensure sufficient buffers from urban development are along waterway corridors for ecological links (including the rehabilitation of degraded waterway corridor banks, where required).
Maintain or improves environment amenity such as scenic values and natural construction
Erosion and sedimentation run off is minimised
Negative impacts on adjoining and downstream properties are minimised
Protects environmentally sensitive areas from development
Ensure natural stream processes are maintained within waterway corridors.
Reduces the need for costly structural treatments of waterway corridor banks
Provides for natural processes of accretion, erosion and sedimentation and reduces environmental effects from pollution
Increases regional water quality
Design Standard Community Outcome
Design stormwater infrastructure to comply with: Far North Queensland Regional
Organisation of Councils (FNQROC) Design Manual
Queensland Urban Drainage Manual (QUDM)
EPA requirements and guidelines Plans for trunk infrastructure - Stormwater
Free and safe drainage of urban land Maintain or improve water quality and
ecological health
Implement Water Sensitive Urban Design principles to achieve maximum on-site quantity and quality treatment and minimise offsite discharge.
Maximise the water quality on site Negative impacts on adjoining and
downstream properties are minimised
Implement regional and on-site detention facilities to minimise the impact of peak run-off for the full range of Annual Exceedance Probability (AEP) events (100% AEP to 1% AEP) from developments, taking into account safety and risk.
Reduces the cumulative impact from existing and future developments on peak flow levels
Reduces the need to increase the size of waterway corridors and underground drainage

CairnsPlan 2016 Version 2.1 Part 4 │ Page 47
Design detention basins to maintain pre-development peak flow levels from the development site for all flood events (100% AEP to 1% AEP). Design Detention Basins in the same catchment to ensure that the coincident peak discharge at downstream control points is not increased.
Increases active and passive recreation opportunities
Minimises the impact on the environmental values of downstream waterway corridors by maintaining pre-development flows and velocities
Reduces downstream sedimentation by slowing flow velocities
Design bridges and culverts with appropriate flood immunity and capacity to convey floodwater, taking into account the Council’s road hierarchy. Construction of bridges and culverts must not adversely impact on the natural environment, such as through the loss of vegetation and undesirable impacts on bio-diversity. Design bridges and culverts to maintain fauna and recreational links.
Ensures road crossings operate safely in times of inundation
Reduces the risk of flooding for surrounding properties
Provides opportunities for extended pedestrian and bicycle links
Enhances ecological links
4.4.4 Transport network
Table 4.4.4.1 – Desired Standards of Service – Transport
Planning Standard Community Outcome
Road Network
The existing and future role and function of the road network is defined by a functional road hierarchy for the Region.
The road hierarchy supports the preferred settlement patterns as well as the expected growth and development of the Region
A functional, safe and efficient transport network is established
Transport infrastructure is provided in an integrated and timely manner
Pedestrian and Cycle Movement Network
A safe, efficient and attractive pedestrian and cycle movement network is established for the Region.
The pedestrian and cycle movement network: promotes active transport opportunities Improves connectivity in the Region Active transport infrastructure is provided
in an integrated and timely manner.
Design Standard Community Outcome
Road Network
Road network system is designed and provided in accordance with: Queensland Streets, Queensland
Residential Design Guidelines, FNQROC Development Manual, DTMR and Australian Standards
Plans for Trunk Infrastructure – Road Network
A functional, safe and efficient transport network is established
Transport infrastructure is provided in an integrated and timely manner
Infrastructure provided meets recognised standards

CairnsPlan 2016 Version 2.1 Part 4 │ Page 48
Pedestrian and Cycle Movement Network
Pedestrian and Cycle movement network is designed and provided in accordance with: FNQROC Development Manual Queensland Streets, Queensland
Residential Design Guidelines Austroads, DTMR and Australian Standards
Plans for Trunk Infrastructure – Pedestrian and Cycle Movement Network
Active transport opportunities are promoted
Connectivity is improved in the Region Infrastructure provided meets recognised
standards
4.4.5 Parks and land for community facilities network
Table 4.4.5.1 – Desired Standards of Service – Parks and land for community facilities
Planning Standard Community Outcome
Provide a connected and accessible network of parks, open space, and community facilities that meet the needs of the City’s residents and visitors.
Provides opportunities for access and increased usage of open space, recreational and community facilities
Provides for an appropriate balance of land uses and ensures high levels of amenity in the urban form
Provides a basis for a healthy and active community
Ensure strong linkages and, where possible, co-location of existing and future parks, open space and community facilities.
Ensures utilisation of existing and future assets while maintaining maximum access
Provide embellishments to parks, commensurate with the range of activities envisaged.
Provides open space embellishments that meet the needs of the community by providing a range of facilities for social activities and/or fitness/recreational pursuits
Ensures activities are met and contained within designated areas - reducing potential off-site impacts to other more sensitive areas in the Local government
Ensure that existing and future parks, open space and community facilities with significant environmental, waterway or cultural heritage value are managed appropriately.
Protects and enhances items of cultural interest in the Local government for the benefit of current and future communities in the Local government
Provides a basis for tourism opportunities Protection of the natural landscape
ensures maintenance of quality of air, water and land resources reducing negative impacts requiring amelioration
Recreational and sporting parks promote the health and well-being of the Local government’s residents
Design Standard Community Outcome
Parks and community land areas are provided in accordance with the preferred quantity, distribution (City Wide, district, local, sporting, community), quality and level of development specified in the ‘Cairns Public Open Space
Provides a standard of service reflecting the communities’ needs as identified by the local government’s adopted strategies
Provides access to recreation and sporting parks with a diverse range of activity opportunities and landscape settings to
CairnsPlan 2016 Version 2.1 Part 4 │ Page 49
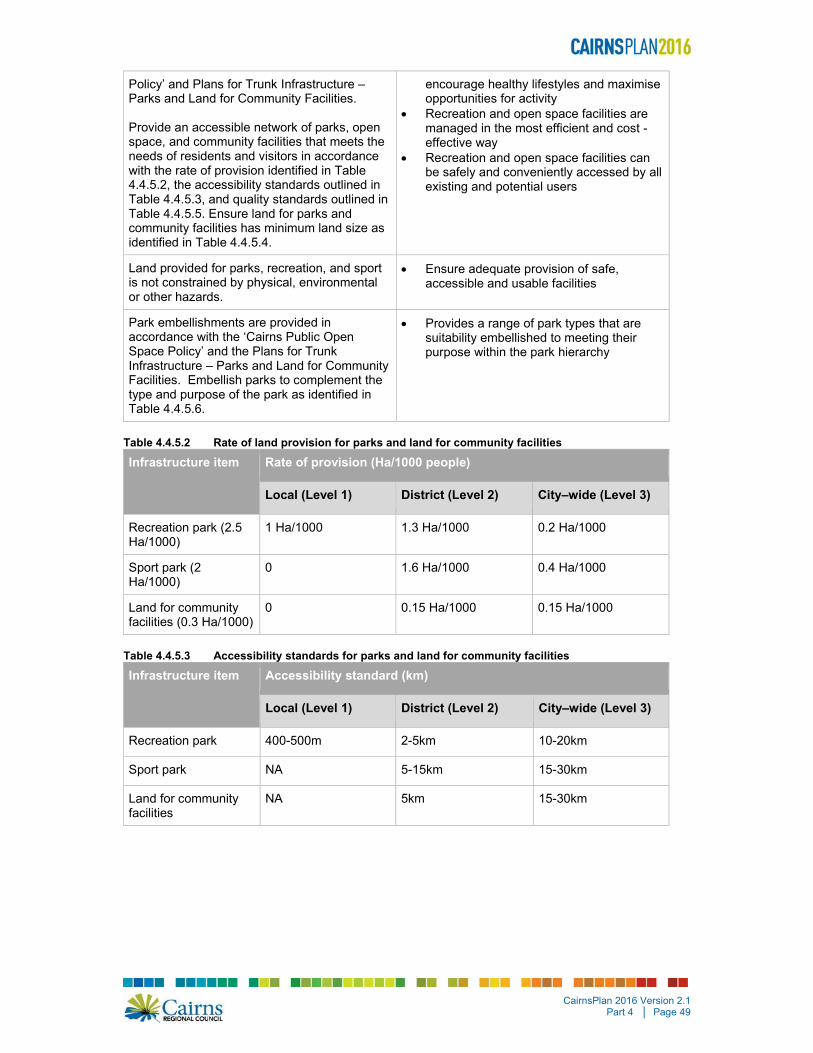
Policy’ and Plans for Trunk Infrastructure – Parks and Land for Community Facilities. Provide an accessible network of parks, open space, and community facilities that meets the needs of residents and visitors in accordance with the rate of provision identified in Table 4.4.5.2, the accessibility standards outlined in Table 4.4.5.3, and quality standards outlined in Table 4.4.5.5. Ensure land for parks and community facilities has minimum land size as identified in Table 4.4.5.4.
encourage healthy lifestyles and maximise opportunities for activity
Recreation and open space facilities are managed in the most efficient and cost -effective way
Recreation and open space facilities can be safely and conveniently accessed by all existing and potential users
Land provided for parks, recreation, and sport is not constrained by physical, environmental or other hazards.
Ensure adequate provision of safe, accessible and usable facilities
Park embellishments are provided in accordance with the ‘Cairns Public Open Space Policy’ and the Plans for Trunk Infrastructure – Parks and Land for Community Facilities. Embellish parks to complement the type and purpose of the park as identified in Table 4.4.5.6.
Provides a range of park types that are suitability embellished to meeting their purpose within the park hierarchy
Table 4.4.5.2 Rate of land provision for parks and land for community facilities
Infrastructure item Rate of provision (Ha/1000 people)
Local (Level 1) District (Level 2) City–wide (Level 3)
Recreation park (2.5 Ha/1000)
1 Ha/1000 1.3 Ha/1000 0.2 Ha/1000
Sport park (2 Ha/1000)
0 1.6 Ha/1000 0.4 Ha/1000
Land for community facilities (0.3 Ha/1000)
0 0.15 Ha/1000 0.15 Ha/1000
Table 4.4.5.3 Accessibility standards for parks and land for community facilities
Infrastructure item Accessibility standard (km)
Local (Level 1) District (Level 2) City–wide (Level 3)
Recreation park 400-500m 2-5km 10-20km
Sport park NA 5-15km 15-30km
Land for community facilities
NA 5km 15-30km

CairnsPlan 2016 Version 2.1 Part 4 │ Page 50
Table 4.4.5.4 Size of parks and land for community facilities
Infrastructure item Minimum size (Ha)
Local (Level 1) District (Level 2) City–wide (Level 3)
Recreation park Standalone – 1 Ha pref, 0.5 Ha min Rec node7 – 0.2 Ha
Standalone – 2-5 Ha Rec Node – 2 Ha
Standalone – Not specific, depends on key features. Rec Node – 5 Ha
Sport park NA 10 Ha 20 Ha
Land for community facilities
NA Cultural Activity Space (CAS) 1500m2
Community Meeting & Activity Space (CMS) 2000m2
Community Service Facility (CSF) 1000m2
Formal Memorial Space (FMS) 1000m2
CAS 1 Ha CMS 1 Ha CSF 1 Ha FMS 10 Ha
Table 4.4.5.5 Land quality standards for parks and land for community facilities
Park/ Community Facility Type
Road frontage minimum
Useable area for main purpose8
Slope and Topography (Maximum)
Flooding9 and other hazards
Other comments
Local Recreation Park
50% 0.2 Ha 1: 20 for main use area 1: 6 for remainder
Whole area free of regular flooding (i.e.: above ARI 5) with the Main Purpose Area or 10 % (whichever is the greater) of total area above ARI 50. Free of hazards
Should have good visibility from surrounding residences. Narrow linear shapes are not preferred.
District Recreation Park DP
50% 1-2 Ha 1: 20 for main use area Variable topography for remainder
Whole area free of regular flooding (i.e.: above ARI 5) with Main Purpose Area or 10 % (whichever is the greater) of total area above ARI 50. Free of hazards
Will also provide local recreation park function for immediate n’hood.
7 Refers to a local park facility provided as part of a larger open space area such as a district sports field or open space corridor. 8 Useable area refers to the space within the park available for sport or recreation activity and facilities. This therefore excludes creeks, stands of vegetation, water bodies, wetlands, steeply sloping land and other “constrained” land. 9 Flooding is expressed as the Average Recurrence Interval. This means the average no of years to exceed a given rainfall total (or in this case level of inundation). However the probability of exceeding this level in any one year (AEP) is a different value. E.g. an ARI 5 means there is an 18% chance of this level being exceeded in any one year.

CairnsPlan 2016 Version 2.1 Part 4 │ Page 51
Park/ Community Facility Type
Road frontage minimum
Useable area for main purpose8
Slope and Topography (Maximum)
Flooding9 and other hazards
Other comments
District Sport Park DSP
50% 7 Ha (allows for 3 fields and ancillary)
1: 50 for field and court areas 1: 10 elsewhere.
Main sporting use areas above ARI 50. Total area to be above ARI 5. Built Facilities above ARI 100. Free of hazards
Also expected to provide local or district recreation nodes.
Community Facilities CF
50% 100% 1:20 max slope Whole of site to be above ARI 100. Free of Hazards.
Integrated into community precinct- shops and services. Parking provided
City Wide Recreation Park CWP
25-50% Design dependant
Use areas 1: 20
Free of hazards. Facilities above ARI 100 At least 50% of park to be above ARI 50
Usually master planned and located due to key feature.
City Wide Sports Park/ Precinct CSP
25%- external. Served by internal road network
15 Ha 1: 50 for all playing surfaces
Free of hazards. Fields/ courts above ARI 50. Built Facilities above ARI 100
Expected to provide local or district recreation nodes as well. Usually master planned.
All Parks and Land for Community Facilities
All land free of hazards and constraints to community use. Unacceptable land includes: Land listed on Contaminated Land Register or Environmental Management
Register. Land known or suspected as being contaminated. Land under High Voltage Power lines or within 50m of the Line easement. Land constrained by Easements. Land constrained by proximity to noxious uses. Minimum Widths Land should be greater than 15m wide unless part of a linkage or minor
entry point then 5m minimum applies. Land for sporting use must be 200 or greater for any dimension. Safety and Design All location choice and development of parks and community facilities
should consider CPTED principles and any urban design guidelines for public spaces and facilities adopted by Council.
Buffers and adjacent land use

CairnsPlan 2016 Version 2.1 Part 4 │ Page 52
Park/ Community Facility Type
Road frontage minimum
Useable area for main purpose8
Slope and Topography (Maximum)
Flooding9 and other hazards
Other comments
Parks should consider adjacent land uses and be adequately buffered from incompatible uses. Solutions may include vegetation corridors, planted mounds and fencing.
Constructed Drains and Flooding Constructed drains and overland flow paths are not suitable for parkland. Detention and Retention Basins are not suitable for parkland. All Parkland should be above the ARI 5 inundation line.
Table 4.4.5.6 Standard facilities/embellishments for parks10
Embellishment type Recreation parks Sport parks
Local District City–wide District City–wide
Water connection/tap
Drinking Fountain
Lighting (street lights only)
Fencing (bollard)
Playground equipment (incl. soft fall)
Seating
Picnic Shelter
BBQ
Earthworks – Field preparation/ Kickabout
Sports facilities (e.g. courts, goalposts)
Informal Activity Facilities (e.g. off leash areas, space for informal kickabout)
Informal Activity Facilities (e.g skate bowl, half courts)
Spectator seating
Landscaping
Power
Irrigation (new parks)
10 Refer to the Cairns Public Open Space Policy, ‘Table 6 - Minimum Level of Developments (Embellishments)’ for further detail on minimum standards.

CairnsPlan 2016 Version 2.1 Part 4 │ Page 53
Embellishment type Recreation parks Sport parks
Local District City–wide District City–wide
Public Toilet
Path/bikeways
Car parking and access works
(on street only)
Bins
4.5 Plans for trunk infrastructure
The plans for trunk infrastructure identify the trunk infrastructure networks intended to service the existing and assumed future urban development at the desired standard of service.
4.5.1 Plans for trunk infrastructure maps
(1) The existing and future trunk infrastructure networks are shown on the following maps in Schedule 3 - Local government infrastructure plan mapping and tables:
(a) Local Government Infrastructure Plan Maps WS-01 to WS-17 - Plans for trunk infrastructure - water supply;
(b) Local Government Infrastructure Plan Maps SEW-01 to SEW-14 - Plans for trunk infrastructure – wastewater;
(c) Local Government Infrastructure Plan Maps SW-01 to SW-18 – Plans for trunk infrastructure - stormwater
(d) Local Government Infrastructure Plan Maps TR-R-01 to TR-R-30 - Plans for trunk infrastructure - transport (roads);
(e) Local Government Infrastructure Plan Maps TP-01 to TP-15 - Plans for trunk infrastructure - transport (pedestrian and cycle movement);
(f) Local Government Infrastructure Plan Maps EX PLCF-01 to EX PCLF-22 - Plans for trunk infrastructure - existing parks and land for community facilities;
(g) Local Government Infrastructure Plan Maps FUT PLCF-01 to FUT PLCF-19 - Plans for trunk infrastructure - future parks and land for community facilities.
(2) The State infrastructure forming part of transport trunk infrastructure network has been identified using information provided by the relevant State infrastructure supplier.
4.5.2 Schedules of works
(1) Details of the existing and future trunk infrastructure networks are identified in the electronic Excel schedule of works model which can be viewed here: Excel Schedule of Works Model
(2) The future trunk infrastructure is identified in Schedule 3 - Local government infrastructure plan mapping and tables:
(a) for the water supply network, Table SC3.3.1;
(b) for the wastewater network, Table SC3.3.2;
(c) for the stormwater network, Table SC3.3.3;
(d) for the transport (roads) network, Table SC3.3.4;
(e) for the transport (pedestrian and cycle) network, Table SC3.3.5;
(f) for the parks and land for community facilities network, Table SC3.2.6.

CairnsPlan 2016 Version 2.1 Part 4 │ Page 54
4.6 Extrinsic material
(1) Section 3.4 in Schedule 3 identifies the documents that assist in the interpretation of the local government infrastructure plan and are extrinsic material under the Statutory Instruments Act 1992.