Embed Size (px)
Citation preview

CairnsPlan 2016 version 1.2 Part 4 │ Page 35
Part 4 Local government infrastructure plan
4.1 Preliminary (1) This local government infrastructure plan has been prepared in accordance with the
requirements of the Sustainable Planning Act 2009.
(2) The purpose of the local government infrastructure plan is to: (a) integrate infrastructure planning with the land use planning identified in the planning
scheme; (b) provide transparency regarding a local government’s intentions for the provision of trunk
infrastructure; (c) enable a local government to estimate the cost of infrastructure provision to assist its long
term financial planning; (d) ensure that trunk infrastructure is planned and provided in an efficient and orderly
manner; (e) provide a basis for the imposition of conditions about infrastructure on development
approvals.
(3) The local government infrastructure plan: (a) states in Section 4.2 (planning assumptions) the assumptions about future growth and
urban development including the assumptions of demand for each trunk infrastructure network;
(b) identifies in Section 4.3 (priority infrastructure area) the prioritised area to accommodate urban growth up to 2028;
(c) states in Section 4.4 (desired standards of service) for each trunk infrastructure network the desired standard of performance;
(d) identifies in Section 4.5 (plans for trunk infrastructure) the existing and future trunk infrastructure for the following networks: (i) Water supply; (ii) Wastewater; (iii) Transport (roads); (iv) Transport (pedestrian and cycle movement); (v) Stormwater; (vi) Public parks and land for community facilities.
(e) provides a list of supporting documents that assist in the interpretation of the local government infrastructure plan in the Editor’s note – Extrinsic material at the end of Section 4.
4.2 Planning assumptions (1) The planning assumptions state the assumptions about:
(a) population and employment growth; (b) the type, scale, location and timing of development including the demand for each trunk
infrastructure network.
(2) The planning assumptions together with the desired standards of service form a basis for the planning of the trunk infrastructure networks and the determination of the priority infrastructure area.
(3) The planning assumptions have been prepared for:

CairnsPlan 2016 version 1.2 Part 4 │ Page 36
(a) the base date 2013 and the following projection years to accord with future Australian Bureau of Statistics census years: (i) mid 2016; (ii) mid 2021; (iii) mid 2026; (iv) mid 2031; (v) ultimate development.
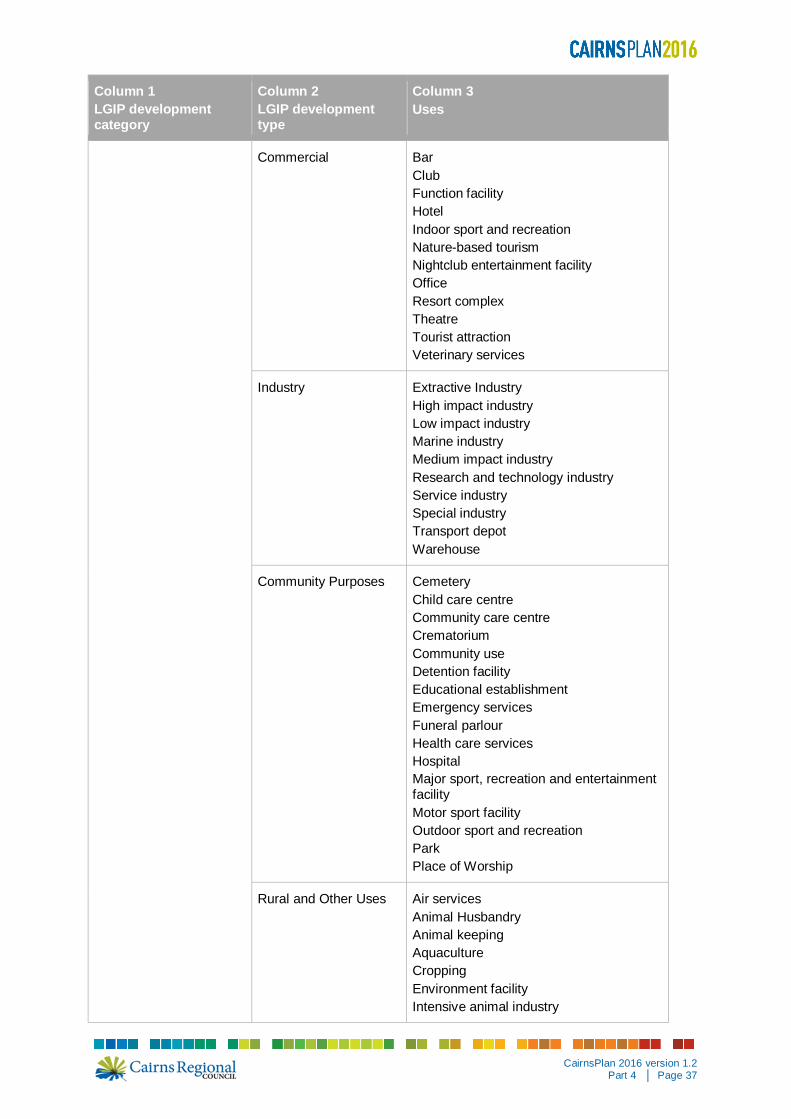
(b) the LGIP development types in Column 2 that include the uses in Column 3 of Table 4.2.1.a.
(c) the projection areas identified on Local Government Infrastructure Plan Priority Infrastructure Area (PIA) Maps PIA-01 - PIA-10 in Schedule 3 - Local government infrastructure plan mapping and tables.
Table 4.2.1.a - Relationship between LGIP development categories, LGIP development types and uses
Column 1 LGIP development category
Column 2 LGIP development type
Column 3 Uses
Residential development Detached dwelling Caretaker’s accommodation Dwelling house
Attached dwelling Dual occupancy Dwelling unit Multiple dwelling Retirement facility Short-term accommodation
Other dwelling Community residence Home based business Non-resident workforce accommodation Relocatable home park Residential care facility Rooming accommodation Rural workers accommodation Tourist Park
Non-residential development
Retail Adult store Agricultural supplies store Brothel Bulk landscape supplies Car wash Food and drink outlet Garden centre Hardware and trade supplies Market Outdoor sales Parking station Sales office Service station Shop Shopping Centre Showroom Wholesale nursery
CairnsPlan 2016 version 1.2 Part 4 │ Page 37
Column 1 LGIP development category
Column 2 LGIP development type
Column 3 Uses
Commercial Bar Club Function facility Hotel Indoor sport and recreation Nature-based tourism Nightclub entertainment facility Office Resort complex Theatre Tourist attraction Veterinary services
Industry Extractive Industry High impact industry Low impact industry Marine industry Medium impact industry Research and technology industry Service industry Special industry Transport depot Warehouse
Community Purposes Cemetery Child care centre Community care centre Crematorium Community use Detention facility Educational establishment Emergency services Funeral parlour Health care services Hospital Major sport, recreation and entertainment facility Motor sport facility Outdoor sport and recreation Park Place of Worship
Rural and Other Uses Air services Animal Husbandry Animal keeping Aquaculture Cropping Environment facility Intensive animal industry

CairnsPlan 2016 version 1.2 Part 4 │ Page 38
Column 1 LGIP development category
Column 2 LGIP development type
Column 3 Uses
Intensive horticulture Landing Major electrical infrastructure Permanent plantation Port services Renewable energy facility Roadside stall Rural industry Substation Telecommunications facility Utility installation Winery
(4) Details of the methodology used to prepare the planning assumptions are stated in the extrinsic
material.
4.2.1 Population and employment growth (1) A summary of the assumptions about population and employment growth for the planning
scheme area is stated in Table 4.2.1.1.a - Population and employment assumptions summary.
Table 4.2.1.1.a - Population and employment assumptions summary Column 1 Description
Column 2 Assumptions
Base date (2013)
2016 2021 2026 2031 Ultimate development
Population 176,846 188,908 210,053 231,624 253,320 299,156
Employment 67,495 72,495 80,674 89,161 100,158 115,473
(2) Detailed assumptions about growth for each projection area and LGIP development type
category are identified in the following tables in Schedule 3 Local government infrastructure plan mapping and tables: (a) for population, Table SC3.2.1.a - Existing and projected population; (b) for employment, Table SC3.2.2.a - Existing and projected employees.
4.2.2 Development (1) The developable area is identified on Local Government Infrastructure Plan Priority
Infrastructure Area (PIA) Maps PIA-01 – PIA-10 in Schedule 3 - Local government infrastructure plan mapping and tables.
(2) The planned density for future development is stated in Table SC3.2.3.a in Schedule 3 -Local government infrastructure plan mapping and tables.
(3) A summary of the assumptions about future residential and non-residential development for the planning scheme area is stated in Table 4.2.2.1.a - Residential dwellings and non-residential floor space assumptions summary.

CairnsPlan 2016 version 1.2 Part 4 │ Page 39
Table 4.2.2.1.a - Residential dwellings and non-residential floor space assumptions summary Column 1 Description
Column 2 Assumptions
Base date (2013)
2016 2021 2026 2031 Ultimate development
Residential dwellings
70,821 76,818 86,528 96,445 106,592 127,017
Non-residential floor space (m2 GFA)
3,219,854 3,457,091 3,839,555 4,237,655 4,723,527 5,468,996
(4) Detailed assumptions about future development for each projection area and LGIP development
type are identified in the following tables in Schedule 3 Local government infrastructure plan mapping and tables: (a) for residential development, Table SC3.2.5.a - Existing and projected residential
dwellings; (b) for non-residential development, Table SC3.2.6.a - Existing and projected non-residential
floor space.
4.2.3 Infrastructure demand (1) The demand generation rate for a trunk infrastructure network is stated in Column 3 of Table
SC3.2.4 - Planned density and demand generation rate for a trunk infrastructure network in Schedule 3 Local government infrastructure plan mapping and tables.
(2) A summary of the projected infrastructure demand for each service catchment is stated in: (a) for the water supply network, Table 4.2.3.1.a – Water supply network – assumed demand
summary; (b) for the wastewater network, Table 4.2.3.2.a – Wastewater network – assumed demand
summary; (c) for the transport (roads) network, Table 4.2.3.3.a – Transport (roads) network – assumed
demand summary; (d) for the transport (pedestrian and cycle) network, Table 4.2.3.4.a – Transport (pedestrian
and cycle movement) network – assumed demand summary; (e) for the stormwater network, Table 4.2.3.5.a – Stormwater network – assumed demand
summary; (f) for the public parks and land for community facilities network, Table 4.2.3.6.a – Public
parks and land for community facilities network – assumed demand summary.

CairnsPlan 2016 version 1.2 Part 4 │ Page 40
Table 4.2.3.1.a – Water supply network – assumed demand summary Column 1 Service Catchment1
Column 2 Existing and projected demand (EDU)
2013 (base date)
2016 2021 2026 2031 Ultimate
Palm Cove / Moore Rd (W1)
6,378 6,921 7,763 8,540 9,171 9,844
University (W2) 9,785 11,214 13,487 15,740 17,511 19,206
Brinsmead / Redlynch (W3)
7,701 8,282 9,184 10,059 10,708 11,008
City (W4) 33,604 36,208 40,816 45,594 50,526 57,558
Red Hill (W5) 7,432 8,076 9,106 10,079 10,989 12,163
Edmonton (W6) 9,528 10,732 12,805 14,939 16,632 22,326
Gordonvale (W7) 3,309 3,675 4,287 4,996 5,814 6,339
Babinda (W8) 846 871 928 1,022 1,119 1,312
Goldsborough (W10) 280 318 378 440 492 690
Table 4.2.3.2.a – Wastewater network – assumed demand summary Column 1 Service Catchment2
Column 2 Existing and projected demand (EDU)
2013 (base date)
2016 2021 2026 2031 Ultimate
Marlin Coast (WW1) 14,348 16,214 19,155 22,013 24,248 26,538
Northern (WW2) 25,755 27,894 31,521 35,211 38,804 43,974
Southern (WW3) 23,367 24,975 27,737 30,512 33,176 35,883
Edmonton (WW4) 8,736 9,810 11,659 13,560 14,937 19,225
Gordonvale (WW5) 2,347 2,614 3,061 3,595 4,217 4,679
Babinda (WW6) 660 681 725 807 891 1,061
1 The service catchment for the water supply network is identified on Local Government Infrastructure Plan Water Supply Catchment Maps CM WS-01 - CM WS-06 in Schedule 3 (local government infrastructure mapping and tables). 2 The service catchment for the wastewater network is identified on Local Government Infrastructure Plan Wastewater Catchment Map CM SEW-01 – CM SEW-05 in Schedule 3 (local government infrastructure mapping and tables).

CairnsPlan 2016 version 1.2 Part 4 │ Page 41
Table 4.2.3.3.a – Transport (roads) network – assumed demand summary Column 1 Service Catchment3
Column 2 Existing and projected demand (EDU)
2013 (base date)
2016 2021 2026 2031 Ultimate
Cairns Urban (TR1) 77,904 85,244 97,626 110,124 122,239 150,323
Gordonvale / Goldsborough (TR2)
3,329 3,663 4,213 4,853 6,039 7,343
Babinda (TR3) 854 887 953 1,095 1,240 1,536
Rural Lands (TR4) 1,871 2,027 2,283 2,544 2,805 2,677
Table 4.2.3.4.a – Transport (pedestrian and cycle) network – assumed demand summary Column 1 Service Catchment4
Column 2 Existing and projected demand (EDU)
2013 (base date)
2016 2021 2026 2031 Ultimate
Cairns Urban (TR1) 58,920 63,895 72,165 80,460 88,165 106,032
Gordonvale / Goldsborough (TR2)
2,621 2,860 3,248 3,710 4,651 5,424
Babinda (TR3) 589 599 617 634 650 674
Rural Lands (TR4) 1,398 1,509 1,688 1,871 2,052 1,946
Table 4.2.3.5.a – Stormwater network – assumed demand summary Column 1 Service Catchment5
Column 2 Existing and projected demand (Impervious Ha)
2013 (base date)
2016 2021 2026 2031 Ultimate
Palm Cove (SW1) 31 32 34 36 38 41
Sweet Creek (SW2) 28 30 33 36 39 44
Delaney Creek (SW3) 31 34 38 41 45 52
Deadmans Gully/Clifton Beach (SW4)
37 39 40 42 44 47
3 The service catchment for the transport (roads) network is identified on Local Government Infrastructure Plan Transport Catchment Map CM TR-01 – CM TR-03 in Schedule 3 (local government infrastructure mapping and tables). 4 The service catchment for the transport (pedestrian and cycle) network is identified on Local Government Infrastructure Plan Transport Catchment Map CM TR-P-01 – CM TR-P-03 in Schedule 3 (local government infrastructure mapping and tables). 5 The service catchment for the stormwater network is identified on Local Government Infrastructure Plan Stormwater Catchment Map CM SW-01 – CM SW-06 in Schedule 3 (local government infrastructure mapping and tables).

CairnsPlan 2016 version 1.2 Part 4 │ Page 42
Column 1 Service Catchment5
Column 2 Existing and projected demand (Impervious Ha)
2013 (base date)
2016 2021 2026 2031 Ultimate
Deep Creek/Kewarra Beach (SW5)
109 115 123 132 140 152
Cayley Street Drain/Trinity Beach (SW6)
84 86 89 92 95 98
Moores Gully/Trinity Park (SW7)
83 89 100 110 120 137
Smithfield/Yorkeys Knob/Moon River (SW8)
240 265 305 344 382 434
Barron River Delta (SW9)
44 48 55 61 67 76
Richters/Thomatis Creek (SW9a)
41 43 45 48 50 52
Barr Creek (SW9b) 49 51 55 58 60 62
Redden Creek (SW9c) 21 22 23 25 26 26
Stony Creek/Rainforest Estate (SW10)
8 9 9 10 10 10
Kamerunga (SW11) 13 14 16 17 19 20
Lower Freshwater (SW12)
65 68 73 78 83 88
Stratford (SW13) 44 45 47 50 52 54
Redlynch (SW14) 27 29 32 35 38 43
Marinos (SW15) 28 30 34 37 41 46
Shaws Road (SW16) 6 6 6 7 7 7
Bella Vista Main Drain (SW17)
80 82 85 89 93 95
Rices Gully (SW18) 30 31 33 35 37 38
Freshwater Creek (SW19)
78 84 93 102 111 124
Cheepi Creek (SW20) 9 9 10 10 11 11
Saltwater Creek (SW21) 403 415 435 456 478 498
Cairns Business District (SW22)
207 211 219 226 235 247

CairnsPlan 2016 version 1.2 Part 4 │ Page 43
Column 1 Service Catchment5
Column 2 Existing and projected demand (Impervious Ha)
2013 (base date)
2016 2021 2026 2031 Ultimate
Fearnley Street Drain (SW23)
191 198 211 223 237 253
Chinaman Creek (SW24) 622 644 679 716 757 798
Clarkes Creek (SW25) 78 80 84 88 93 96
Gordon Creek (SW26) 119 123 130 138 146 154
Crowleys Creek (SW27) 56 58 61 65 68 73
Sawpit Gully (SW28) 84 87 91 96 100 107
Skeleton Creek (SW30) 203 214 231 248 269 310
Blackfellows Creek (SW31)
145 164 196 229 271 371
Collinson Mckinnon Creek (SW32)
132 147 170 194 225 298
Stony Creek (SW33) 16 4 8 12 20 88
Wrights Creek (SW34) 11 8 22 40 74 384
Mackey Creek (SW35) 28 9 17 28 47 220
O'learys Creek (SW36) 103 111 125 140 155 181
Fishery Falls/Deeral (SW37)
10 11 12 14 16 15
Babinda (Sw38) 53 58 66 78 91 116
Bramston Beach (SW39) 12 13 15 17 19 19
Vico Street (SW40) 27 29 32 36 38 42
River Stone (SW41) 58 63 73 82 93 114

CairnsPlan 2016 version 1.2 Part 4 │ Page 44
Table 4.2.3.6.a – Public parks and land for community facilities network – assumed demand summary Column 1 Service Catchment6
Column 2 Existing and projected demand (EDU)
2013 (base date)
2016 2021 2026 2031 Ultimate
Cairns Beaches (N 1) 7,671 8,401 9,542 10,644 11,524 12,470
Barron - Smithfield (N 2) 6,262 7,081 8,351 9,583 10,491 11,111
Freshwater - Stratford - Aeroglen (C 1)
1,479 1,564 1,703 1,846 1,954 1,997
Redlynch Valley (C 2) 3,086 3,401 3,875 4,329 4,635 4,698
Inner Suburbs (C 3) 22,284 23,573 25,821 28,133 30,348 32,097
CBD - North Cairns (C 4) 6,008 6,729 7,983 9,277 10,684 13,543
Portsmith - Woree Industrial (C 5)
320 367 435 480 511 522
White Rock - Edmonton (C 6)
10,942 11,877 13,307 14,670 15,661 16,262
Mt Peter (S 1) 74 91 304 620 1,444 12,365
Gordonvale – Goldsborough (S 2)
1,932 2,116 2,416 2,791 3,665 4,239
Babinda (R 1) 582 592 609 626 642 665
Rural Towns and Villages (R 2)
1,363 1,470 1,643 1,818 1,993 1,890
Northern (N 1 & N 2) 14,199 15,757 18,183 20,532 22,336 23,923
Central (C 1 to C 6) 44,644 48,049 53,683 59,316 64,397 69,745
Southern (S 1 & S 2) 2,698 2,951 3,552 4,331 6,095 17,788
Remainder (R 1 & R 2) 1,987 2,108 2,305 2,504 2,701 2,620
Cairns City (All Areas) 63,528 68,857 77,705 86,654 95,489 114,075
6 The service catchment for the public parks and land for community facilities network is identified on Local Government Infrastructure Plan Public Parks and Land for Community Facilities Catchment Map CM PPCLF-01 – CM PPCLF-03 in Schedule 3 (local government infrastructure mapping and tables).

CairnsPlan 2016 version 1.2 Part 4 │ Page 45
4.3 Priority infrastructure area (1) The priority infrastructure area identifies the area prioritised for the provision of trunk
infrastructure to service the existing and assumed future urban development up to 2028.
(2) The priority infrastructure area is identified on Local Government Infrastructure Plan Priority Infrastructure Area (PIA) Maps PIA-01 – PIA-10 in Schedule 3 - Local government infrastructure plan mapping and tables.
4.4 Desired standards of service (1) This section states the key standards of performance for a trunk infrastructure network.
(2) Details of the standard of service for a trunk infrastructure networks are identified in the extrinsic
material.
4.4.1 Water supply network Table 4.4.1.1.a – Desired Standards of Service – Water Supply
Planning Standard Community Outcome
Ensure drinking water complies with the NHMRC Australian Drinking Water Guidelines.
• Provides uniform quality of water monitored in relation to recognised standards
• Provide a safe and reliable water supply • Safeguards community health
Water infrastructure provides for system operation and monitoring in accordance with recognised standards.
• Ensures environmental controls are maintained
• Ensures potable water is provided in a manner consistent with environmental standards
Reduce non-revenue water (water that has been produced and is ‘lost’ before it reaches the customer, including physical losses or leakages, commercial losses such as water meter inaccuracies, unauthorised consumption, and data handling errors, and unbilled authorised consumption such as water used for firefighting).
• Extend asset life • Improve environmental flows • Reduced greenhouse gas emissions • Reduce extraction of water from source
Provide infrastructure which optimises whole of life costs.
• Cost effective service for community • Reduced energy cost • Reduced greenhouse gas emissions • Reduced maintenance costs • Reduced overall operation costs • Reduced replacement costs • Reduction in disposal of waste • Reduced environmental effects from
chemical production
Design water supply infrastructure to comply with: • Far North Queensland Regional
Organisation of Councils (FNQROC) Development Manual, where relevant to Trunk Infrastructure
• Customer Service Standards
• Provides uniform quality of water monitored in relation to recognised standards
• Provide a safe and reliable water supply • Safeguards community health

CairnsPlan 2016 version 1.2 Part 4 │ Page 46
• Water Act 2000 • Plans for Trunk Infrastructure – Water
Supply
Design Standard Community Outcome
Design water supply infrastructure to comply with: • Far North Queensland Regional
Organisation of Councils (FNQROC) Development Manual, where relevant to Trunk Infrastructure
• Customer Service Standards • Water Act 2000 • Plans for Trunk Infrastructure – Water
Supply
• Provides uniform quality of water monitored in relation to recognised standards
• Provide a safe and reliable water supply • Safeguards community health
4.4.2 Wastewater network Table 4.4.2.1.a – Desired Standards of Service – Wastewater
Planning Standard Community Outcome
Ensure wastewater collection, transportation and treatment system remains effective and compliant with relevant legislation and licence conditions.
• Reduced impact from blockages, overflows and spills
• Reduced impact on residents • Reduced lease of Nitrogen and
phosphorous to aquatic ecosystems • Improved community health • Reduced greenhouse gas emissions
Provide infrastructure which optimises whole of life costs.
• Cost effective service for community • Reduced energy cost • Reduced maintenance costs • Reduced overall operation costs • Reduced replacement costs • Reduction in disposal of waste • Reduced greenhouse gas emissions • Reduced environmental effects from
chemical production
Design Standard Community Outcome
Design wastewater infrastructure to comply with: • FNQROC Development Manual, where
relevant to Trunk Infrastructure • Customer Service Standards • Water Act 2000 • Plans for Trunk Infrastructure -
Wastewater
• Noise control • No adverse visual effect • Control of overflows from system • Improves community health • Reduction in contaminated discharges • Reduced odour emissions
Ensure infiltration and inflow in new wastewater collection and transportation systems remain within industry acceptable limits (compliance with Environmental licences, IEMS and associated EMPs) and is minimised to a practical extent in existing systems.
• Reduced cost of energy for effluent transport, treatment and disposal
• Minimise customer overflow issues • Maximise life of system • Reduced overflows to local waterways

CairnsPlan 2016 version 1.2 Part 4 │ Page 47
4.4.3 Transport network Table 4.4.3.1.a – Desired Standards of Service – Transport
Planning Standard Community Outcome
Road Network
The existing and future role and function of the road network is defined by a functional road hierarchy for the Region.
• The road hierarchy supports the preferred settlement patterns as well as the expected growth and development of the Region
• A functional, safe and efficient transport network is established
• Transport infrastructure is provided in an integrated and timely manner
Pedestrian and Cycle Movement Network
A safe, efficient and attractive pedestrian and cycle movement network is established for the Region.
The pedestrian and cycle movement network: • promotes active transport opportunities • Improves connectivity in the Region • Active transport infrastructure is provided
in an integrated and timely manner.
Design Standard Community Outcome
Road Network
Road network system is designed and provided in accordance with: • Queensland Streets, Queensland
Residential Design Guidelines, FNQROC Development Manual, DTMR and Australian Standards
• Plans for Trunk Infrastructure – Road Network
• A functional, safe and efficient transport network is established
• Transport infrastructure is provided in an integrated and timely manner
• Infrastructure provided meets recognised standards
Pedestrian and Cycle Movement Network
Pedestrian and Cycle movement network is designed and provided in accordance with: • FNQROC Development Manual • Queensland Streets, Queensland
Residential Design Guidelines Austroads, DTMR and Australian Standards
• Plans for Trunk Infrastructure – Pedestrian and Cycle Movement Network
• Active transport opportunities are promoted
• Connectivity is improved in the Region • Infrastructure provided meets recognised
standards
4.4.4 Stormwater network Table 4.4.4.1.a – Desired Standards of Service – Stormwater
Planning Standard Community Outcome
Provide a system of shared stormwater infrastructure allowing for safe drainage of urban land while maintaining or improving the quality of run-off.
• Minimises inundation of habitable areas • Minimises the damage and risk associated
with flooding • Minimises the impact of development on
the ecological health and water quality within waterway corridor

CairnsPlan 2016 version 1.2 Part 4 │ Page 48
Ensure the use of Water Sensitive Urban Design and other types of on-site infrastructure to minimise impact on the natural environment
• Provides waterways infrastructure at the lowest life cycle cost
• Reduces the scale of built infrastructure by optimising on site solutions
• Improves water quality at the point of discharge to benefit the natural waterway corridor’s health
Ensure sufficient buffers from urban development are along waterway corridors for ecological links (including the rehabilitation of degraded waterway corridor banks, where required).
• Maintain or improves environment amenity such as scenic values and natural construction
• Erosion and sedimentation run off is minimised
• Negative impacts on adjoining and downstream properties are minimised
• Protects environmentally sensitive areas from development
Ensure natural stream processes are maintained within waterway corridors.
• Reduces the need for costly structural treatments of waterway corridor banks
• Provides for natural processes of accretion, erosion and sedimentation and reduces environmental effects from pollution
• Increases regional water quality
Design Standard Community Outcome
Design stormwater infrastructure to comply with: • Far North Queensland Regional
Organisation of Councils (FNQROC) Design Manual
• Queensland Urban Drainage Manual (QUDM)
• EPA requirements and guidelines
• Free and safe drainage of urban land • Maintain or improve water quality and
ecological health
Implement Water Sensitive Urban Design principles to achieve maximum on site quantity and quality treatment and minimise offsite discharge.
• Maximise the water quality on site • Negative impacts on adjoining and
downstream properties are minimised
Implement regional and on-site detention facilities to minimise the impact of peak run-off for the full range of Annual Exceedance Probability (AEP) events (100% AEP to 1% AEP) from developments, taking into account safety and risk. Design detention basins to maintain pre-development peak flow levels from the development site for all flood events (100% AEP to 1% AEP). Design Detention Basins in the same catchment to ensure that the coincident peak discharge at downstream control points is not increased.
• Reduces the cumulative impact from existing and future developments on peak flow levels
• Reduces the need to increase the size of waterway corridors and underground drainage
• Increases active and passive recreation opportunities
• Minimises the impact on the environmental values of downstream waterway corridors by maintaining pre-development flows and velocities
• Reduces downstream sedimentation by slowing flow velocities

CairnsPlan 2016 version 1.2 Part 4 │ Page 49
Design bridges and culverts with appropriate flood immunity and capacity to convey floodwater, taking into account the Council’s road hierarchy. Construction of bridges and culverts must not adversely impact on the natural environment, such as through the loss of vegetation and undesirable impacts on bio-diversity. Design bridges and culverts to maintain fauna and recreational links.
• Ensures road crossings operate safely in times of inundation
• Reduces the risk of flooding for surrounding properties
• Provides opportunities for extended pedestrian and bicycle links
• Enhances ecological links
4.4.5 Public parks and land for community facilities network Table 4.4.5.1.a – Desired Standards of Service – Public parks and land for community facilities Planning Standard Community Outcome
Provide a connected and accessible network of parks, open space, and community facilities that meet the needs of the City’s residents and visitors.
• Provides opportunities for access and increased usage of open space, recreational and community facilities
• Provides for an appropriate balance of land uses and ensures high levels of amenity in the urban form
• Provides a basis for a healthy and active community
Ensure strong linkages and, where possible, co-location of existing and future parks, open space and community facilities.
• Ensures utilisation of existing and future assets while maintaining maximum access
Provide embellishments to public parks, commensurate with the range of activities envisaged.
• Provides open space embellishments that meet the needs of the community by providing a range of facilities for social activities and/or fitness/recreational pursuits
• Ensures activities are met and contained within designated areas - reducing potential off site impacts to other more sensitive areas in the Local government
Ensure that existing and future parks, open space and community facilities with significant environmental, waterway or cultural heritage value are managed appropriately.
• Protects and enhances items of cultural interest in the Local government for the benefit of current and future communities in the Local government
• Provides a basis for tourism opportunities • Protection of the natural landscape
ensures maintenance of quality of air, water and land resources reducing negative impacts requiring amelioration
• Recreational and sporting parks promote the health and well-being of the Local government’s residents
Design Standard Community Outcome
Public parks and community land areas are provided in accordance with the preferred quantity, distribution (City Wide, district, local, sporting, community), quality and level of
• Provides a standard of service reflecting the communities’ needs as identified by the local government’s adopted strategies
• Provides access to recreation and sporting

CairnsPlan 2016 version 1.2 Part 4 │ Page 50
development specified in the ‘Cairns Public Open Space Policy’ and Plans for Trunk Infrastructure – Public Parks and Land for Community Facilities. Provide an accessible network of parks, open space, and community facilities that meets the needs of residents and visitors in accordance with the rate of provision identified in Table 4.4.5.2, the accessibility standards outlined in Table 4.4.5.3, and quality standards outlined in Table 4.4.5.5. Ensure land for public parks and community facilities has minimum land size as identified in Table 4.4.5.4.
parks with a diverse range of activity opportunities and landscape settings to encourage healthy lifestyles and maximise opportunities for activity
• Recreation and open space facilities are managed in the most efficient and cost effective way
• Recreation and open space facilities can be safely and conveniently accessed by all existing and potential users
Land provided for parks, recreation, and sport is not constrained by physical, environmental or other hazards.
• Ensure adequate provision of safe, accessible and usable facilities
Public park embellishments are provided in accordance with the ‘Cairns Public Open Space Policy’ and the Plans for Trunk Infrastructure – Public Parks and Land for Community Facilities. Embellish public parks to complement the type and purpose of the public park as identified in Table 4.4.5.6.
• Provides a range of park types that are suitability embellished to meeting their purpose within the park hierarchy
Table 4.4.5.2.a Rate of land provision for public parks and community facilities Infrastructure item Rate of provision (Ha/1000 people)
Local (Level 1) District (Level 2) City–wide (Level 3)
Recreation park (2.5 Ha/1000)
1 Ha/1000 1.3 Ha/1000 0.2 Ha/1000
Sport park (2 Ha/1000)
0 1.6 Ha/1000 0.4 Ha/1000
Land for community facilities (0.3 Ha/1000)
0 0.15 Ha/1000 0.15 Ha/1000
Table 4.4.5.3.a Accessibility standards for public parks and land for community facilities Infrastructure item Accessibility standard (km)
Local (Level 1) District (Level 2) City–wide (Level 3)
Recreation park 400-500m 2-5km 10-20km
Sport park NA 5-15km 15-30km
Land for community facilities
NA 5km 15-30km
Table 4.4.5.4.a Size of public parks and land for community facilities Infrastructure item Minimum size (Ha)
Local (Level 1) District (Level 2) City–wide (Level 3)

CairnsPlan 2016 version 1.2 Part 4 │ Page 51
Recreation park Standalone – 1 Ha pref, 0.5 Ha min Rec node7 – 0.2 Ha
Standalone – 2-5 Ha Rec Node – 2 Ha
Standalone – Not specific, depends on key features. Rec Node – 5 Ha
Sport park NA 10 Ha 20 Ha
Land for community facilities
NA Cultural Activity Space (CAS) 1500m2
Community Meeting & Activity Space (CMS) 2000m2
Community Service Facility (CSF) 1000m2
Formal Memorial Space (FMS) 1000m2
CAS 1 Ha CMS 1 Ha CSF 1 Ha FMS 10 Ha
Table 4.4.5.5.a Land quality standards for public parks and land for community facilities Park/ Community Facility Type
Road frontage minimum
Useable area for main purpose8
Slope and Topography (Maximum)
Flooding9 and other hazards
Other comments
Local Recreation Park
50% 0.2 Ha 1: 20 for main use area 1: 6 for remainder
Whole area free of regular flooding (i.e.: above ARI 5) with the Main Purpose Area or 10 % (whichever is the greater) of total area above ARI 50. Free of hazards
Should have good visibility from surrounding residences. Narrow linear shapes are not preferred.
District Recreation Park DP
50% 1-2 Ha 1: 20 for main use area Variable topography for remainder
Whole area free of regular flooding (i.e.: above ARI 5) with Main Purpose Area or 10 % (whichever is the greater) of total area above ARI 50. Free of hazards
Will also provide local recreation park function for immediate n’hood.
District Sport Park DSP
50% 7 Ha (allows for 3 fields and ancillary)
1: 50 for field and court areas 1: 10 elsewhere.
Main sporting use areas above ARI 50. Total area to be
Also expected to provide local or district recreation
7 Refers to a local park facility provided as part of a larger open space area such as a district sports field or open space corridor. 8 Useable area refers to the space within the park available for sport or recreation activity and facilities. This therefore excludes creeks, stands of vegetation, water bodies, wetlands, steeply sloping land and other “constrained” land. 9 Flooding is expressed as the Average Recurrence Interval. This means the average no of years to exceed a given rainfall total (or in this case level of inundation). However the probability of exceeding this level in any one year (AEP) is a different value. E.g. an ARI 5 means there is an 18% chance of this level being exceeded in any one year.

CairnsPlan 2016 version 1.2 Part 4 │ Page 52
Park/ Community Facility Type
Road frontage minimum
Useable area for main purpose8
Slope and Topography (Maximum)
Flooding9 and other hazards
Other comments
above ARI 5. Built Facilities above ARI 100. Free of hazards
nodes.
Community Facilities CF
50% 100% 1:20 max slope Whole of site to be above ARI 100. Free of Hazards.
Integrated into community precinct- shops and services. Parking provided
City Wide Recreation Park CWP
25-50% Design dependant
Use areas 1: 20
Free of hazards. Facilities above ARI 100 At least 50% of park to be above ARI 50
Usually master planned and located due to key feature.
City Wide Sports Park/ Precinct CSP
25%- external. Served by internal road network
15 Ha 1: 50 for all playing surfaces
Free of hazards. Fields/ courts above ARI 50. Built Facilities above ARI 100
Expected to provide local or district recreation nodes as well. Usually master planned.
All Parks and Land for Community Facilities
All land free of hazards and constraints to community use. Unacceptable land includes: • Land listed on Contaminated Land Register or Environmental Management
Register. • Land known or suspected as being contaminated. • Land under High Voltage Power lines or within 50m of the Line easement. • Land constrained by Easements. • Land constrained by proximity to noxious uses. Minimum Widths • Land should be greater than 15m wide unless part of a linkage or minor
entry point then 5m minimum applies. • Land for sporting use must be 200 or greater for any dimension. Safety and Design • All location choice and development of public parks and community facilities
should consider CPTED principles and any urban design guidelines for public spaces and facilities adopted by Council.
Buffers and adjacent land use • Parks should consider adjacent land uses and be adequately buffered from
incompatible uses. Solutions may include vegetation corridors, planted mounds and fencing.
Constructed Drains and Flooding

CairnsPlan 2016 version 1.2 Part 4 │ Page 53
Park/ Community Facility Type
Road frontage minimum
Useable area for main purpose8
Slope and Topography (Maximum)
Flooding9 and other hazards
Other comments
• Constructed drains and overland flow paths are not suitable for parkland. • Detention and Retention Basins are not suitable for parkland. • All Parkland should be above the ARI 5 inundation line.
Table 4.4.5.6.a Standard facilities/embellishments for public parks10 Embellishment type Recreation parks Sport parks
Local District City–wide District City–wide
Water connection/tap ü ü ü ü ü
Drinking Fountain ü ü ü
Lighting ü (street lights only)
ü ü ü ü
Fencing (bollard) ü ü ü ü ü
Playground equipment (incl. soft fall)
ü ü ü
Seating ü ü ü ü ü
Picnic Shelter ü ü ü
BBQ ü ü
Earthworks – Field preparation/ Kickabout
ü ü ü ü ü
Sports facilities (e.g. courts, goalposts)
ü ü
Informal Activity Facilities (e.g. off leash areas, space for informal kickabout)
ü ü ü
Informal Activity Facilities (e.g skate bowl, half courts)
ü ü
Spectator seating ü ü
Landscaping ü ü ü ü ü
Power ü ü ü ü
Irrigation (new parks) ü ü ü
Public Toilet ü ü
Path/bikeways ü ü ü ü ü
Car parking and access works
ü (on street
ü ü ü ü
10 Refer to the Cairns Public Open Space Policy, ‘Table 6 - Minimum Level of Developments (Embellishments)’ for further detail on minimum standards.

CairnsPlan 2016 version 1.2 Part 4 │ Page 54
Embellishment type Recreation parks Sport parks
Local District City–wide District City–wide
only)
Bins ü ü ü ü ü
4.5 Plans for trunk infrastructure (1) The plans for trunk infrastructure identify the trunk infrastructure networks intended to service
the existing and assumed future urban development at the desired standard of service up to 2042.
Table 4.5.1.a - Planning horizon for a trunk infrastructure network
Column 1 Trunk infrastructure network
Column 2 Planning horizon
Water supply 2042 (29 years from base year)
Wastewater 2042 (29 years from base year)
Transport (roads) 2042 (29 years from base year)
Transport (pedestrian and cycle movement) 2042 (29 years from base year)
Stormwater 2042 (29 years from base year)
Public parks and land for community facilities 2042 (29 years from base year)
4.5.1 Plans for trunk infrastructure maps (1) The existing and future trunk infrastructure networks are shown on the following maps in
Schedule 3 - Local government infrastructure plan mapping and tables: (a) Local Government Infrastructure Plan Maps WS-01 to WS-17 - Plans for trunk
infrastructure - water supply; (b) Local Government Infrastructure Plan Maps SEW-01 to SEW-14 - Plans for trunk
infrastructure – wastewater; (c) Local Government Infrastructure Plan Maps TR-R-01 to TR-R-30 - Plans for trunk
infrastructure - transport (roads); (d) Local Government Infrastructure Plan Maps TP-01 to TP-15 - Plans for trunk
infrastructure - transport (pedestrian and cycle movement); (e) Local Government Infrastructure Plan Maps SW-01 to SW-18 - Plans for trunk
infrastructure – stormwater; (f) Local Government Infrastructure Plan Maps EX PPLCF-01 to EX PPCLF-22 - Plans for
trunk infrastructure - existing public parks and land for community facilities; (g) Local Government Infrastructure Plan Maps FUT PPLCF-01 to FUT PPLCF-19 - Plans for
trunk infrastructure - future public parks and land for community facilities.
(2) The State infrastructure forming part of transport trunk infrastructure network has been identified using information provided by the relevant State infrastructure supplier.

CairnsPlan 2016 version 1.2 Part 4 │ Page 55
4.5.2 Schedules of works (1) The future trunk infrastructure is identified in Schedule 3 - Local government infrastructure plan
mapping and tables: (a) for the water supply network, Table SC3.3.1.a; (b) for the wastewater network, Table SC3.3.2.a; (c) for the stormwater network, Table SC3.3.3.a; (d) for the transport (roads) network, Table SC3.3.4.a; (e) for the transport (pedestrian and cycle) network, Table SC3.3.5.a; (f) for the public parks and land for community facilities network, Table SC3.3.6.a.
(2) Details of the existing and future trunk infrastructure networks are identified in the electronic Excel schedule of works model which can be viewed here: Excel Schedule of Works Model.
4.6 Extrinsic material (1) Section 3.4 in Schedule 3 identifies the documents that assist in the interpretation of the local
government infrastructure plan and are extrinsic material under the Statutory Instruments Act 1992.