Embed Size (px)
Citation preview

Part 1: Plasma-Liquid Transport Processes in Convective Systems
Part 2: Fertilization of Raddishes, Marigolds, and Tomatoes Using Plasma Activated Water
Alex Lindsay, Brandon Byrns, Carly Anderson, Brandon Curtis, Elmar Slikboer, Detlef Knappe, William Fonteno, David Graves,
Steven Shannon

Part 1: Purpose & Overview
• Purpose: Gain better qualitative understanding of plasma-generated species transport at interface and in bulk solution for systems in which convection is important – Most sophisticated models of atmospheric plasma-liquid systems investigate DBD discharges or
other plasma systems in which diffusion is dominant transport process (e.g. Tian, Wei, and Mark J. Kushner, Journal of Physics D: Applied Physics 47.16 (2014): 165201.)
• Talk overview – Momentum transport: gas phase convection induces convective currents in liquid – Heat transport – Dilute species transport without reactions – Dilute species transport with reactions

Model Convective Systems
• UC Berkeley: pulsed corona discharge (primary focus for current modeling)
• NCSU: 162 MHz wave-driven discharge (return to in Part 2 of talk)

Pulsed corona inputs • Not currently modeling plasma • Model ionic wind using a jet with diameter = needle diameter = .6 mm • Experimentally measure 6 kV pulses with ~.7 cm gap between needle and water
surface • Zhao et. al. (J. Electrostatics 63 (2005)) modeled gas flow profiles for corona
discharges – Interpolating from their data, obtain a maximum axial flow velocity of 7.75 m/s for 6 kV – Use this as maximum velocity in jet model
• With preliminary model, interested in qualitative understanding of dilute species mass transport – Inlet concentrations of all “plasma”-generated species based on DBD streamer-liquid model of
Kushner and Tian

Fluid flow and momentum transport: velocity magnitude
Gas-liquid interface
Needle tip = “Jet outlet”

Coupled heat and mass transfer due to convection
t = .1 s t = 10 s t = 1000 s
Temperature
H2O(g) concentration

HNO3 dissolution with and without convection (no reactions)
Gas-liquid interface Gas-liquid interface
Liquid convection and diffusion
Liquid diffusion only

Dissolution of hydrophilic vs. hydrophobic species (no reactions)
Gas-liquid interface Gas-liquid interface
HNO3 NO

Role of convection in total species uptake
• Though concentration profiles are clearly different, including liquid convection hardly changes hydrophilic nitrate uptake rate
• However, including liquid convection increases hydrophobic NO uptake by factor of 2 • Fundamental difference in behavior between –philic and –phobic species not intuitively obvious (to me)
0.00E+00
1.00E-04
2.00E-04
3.00E-04
4.00E-04
5.00E-04
6.00E-04
7.00E-04
8.00E-04
0 200 400 600 800 1000 1200
Conc
entr
atio
n N
O3-
(mm
ol/L
)
Time (seconds)
0.00E+00
5.00E-09
1.00E-08
1.50E-08
2.00E-08
2.50E-08
3.00E-08
3.50E-08
4.00E-08
0 200 400 600 800 1000 1200
Conc
entr
atio
n N
O (m
mol
/L)
Time (seconds)
Nitrate w/ convection
Nitrate w/o convection
NO w/ convection
NO w/o convection

What about interface deformation from corona impingement?
• During experiments, visually estimate size of interface depression
• Consistent with shape determined from force balance (R.B. Banks: J. Fluid Mech., 1963 vol. 15, pp. 13–34.)
• Insert into model:
Interface
0.00E+00
5.00E-11
1.00E-10
1.50E-10
2.00E-10
2.50E-10
3.00E-10
3.50E-10
4.00E-10
0 200 400 600 800 1000 1200
# of
mol
s
Time (s)
# of mols NO in aqueous phase
Without dimple With dimple
Effect of interface on species uptake: max of 3% error over simulation time Interface deformation not important for phenomena we care about

Reactions • We use a limited reaction set focusing on NOx species that contribute to formation of
ONOOH and OH in liquid phase • Reactive species considered:
– NO, NO2, N2O4, OH, H2O2, H2O, HNO2, NO2-, HNO3, NO3-, H+, OH-, ONOOH
• Observe penetration depth of OH to be 1-10 µm • For applications requiring high reactivity in the bulk liquid or at some underlying
substrate, we must look to less reactive pre-cursors which have time be transported from the plasma-liquid interface to the bulk solution

Bulk ONOOH • Lukes (PSST 23 (2014)) & others have
postulated that OH and NO2 radicals produced through dissociation of ONOOH may significantly contribute to bactericidal effects of plasma activated water (PAW)
• Key reaction for bulk ONOOH production: • H2O2 + H+ + NO2
- ONOOH • While discharge is on, liquid convection and
high concentrations of reactants in vicinity of streamer lead to inhomogeneous bulk production of ONOOH
• Post-discharge, production should homogenize
• Large gradients at interface raise following questions: Do we have non-ideal solution thermodynamics at surface where species concentrations (including ions) can be significantly higher? What effect could this have on Henry’s law coefficient and solvation rates? What about heats of solvation? Area of future research
r(m)
z(m) Bulk ONOOH production

Summary
• Convection leads to significant coupled heat and mass transfer at gas-liquid interface – Depending on impinging gas temperature, possible to observe significant changes in liquid
temperature affects bulk solution kinetics – Inhomogeneous distribution of water vapor above water surface likely to affect type and
quantity of plasma-generated species
• Convection plays key role in spatial distribution of aqueous species – Also significantly increases volume averaged uptake of hydrophobic species (effect not observed
for hydrophilic species)
• Inhomogeneous bulk production of ONOOH while discharge is on due to higher reactant concentrations near streamer and within convective loop – Should homogenize post-discharge

Future Work
• Incorporate plasma model for more accurate description of gas phase composition and heat transfer between phases
• Relative importance of surface vs. bulk reactive species production • More details of interface and aqueous phase:
– Double layers – Electrochemical reactions at electrode – Non-ideal solution thermodynamics? – Heating from solvation – Photons – ……..

Part 1: Plasma-Liquid Transport Processes in Convective Systems
Part 2: Fertilization of Raddishes, Marigolds, and Tomatoes Using Plasma Activated Water

Part 2 Purpose: Distributed Fertilizer Production
• As distributed sources of energy (solar, wind) and electricity continue to advance, there is a growing opportunity for distributed and locally controlled production of fertilizer
• For remote regions or regions with poor infrastructure, costs of delivering essential nitrogen fertilizer can be high
• Far-reaching goal is to develop renewably-powered source of fertilizer capable of assisting farmers with poor access to centralized fertilizer producers or who desire greater control over their fertilizer supply/use

Agro-chemicals • Important nitrogen species in plant life cycle:
– Ammonium: NH4+
– Nitrate: NO3-
– Nitrite: NO2-
• We readily create these species in an air plasma at atmosphere – Source design: Byrns, Brandon, et al. "A VHF driven
coaxial atmospheric air plasma: electrical and optical characterization." Journal of Physics D: Applied Physics 45.19 (2012): 195204.
NCSU 162 MHz coaxial plasma source in air
Source set-up for PAW generation

Part 2: Overview
• Observed nitrogen species in water as function of plasma/solution conditions – Effect of dissolved NaHCO3
– Plasma power – Gas flow rate
• Effects of Plasma Activated Water (PAW) on plant species

[NOx] and NaHCO3
• Adding baking soda before exposure dramatically increases nitrite concentration – Decreases nitrate concentration
• Adding immediately after exposure produces similar but lesser effects….

[NOx] and NaHCO3 • Tagging on to that last data point, what happens if we wait to add baking soda post-
exposure?
• Longer we wait to add NaHCO3, the smaller its effect on solution chemistry, e.g. we observe the small nitrite and large nitrate concentrations seen when no NaHCO3 is added to the solution

[NOx] and NaHCO3 Theory
• Two potentially important reactions to consider (taken from Greenwood’s Chemistry of the Elements) • Reaction 1 occurs readily at acidic pH • Reaction 2 is generic representation of industrial process for producing nitrite
• Greenwood: “NaNO2 is made by absorbing ‘nitrous fumes’ in aqueous alkali or carbonate solutions”

[NOx] and NaHCO3 Theory • Plasma generates NO and NO2 which reacts with bases such as carbonate in solution
(reaction 2) • Explains sharp spike in nitrite concentration when NaHCO3 added pre-exposure
– Moreover, because neutral pH is maintained throughout, disproportionation of nitrous acid inhibited, decreasing nitrate production (reaction 1)
• If base added post-exposure while NO and NO2 remain in solution, more nitrite will be produced – However, NO and NO2 eventually volatilize…explains why adding NaHCO3 days after exposure
does not increase nitrite (reaction 1) – Moreover, if delay is long, there is sufficient time for all HNO2 to disproportionate and form NO3
- (reaction 2)

[NOx] vs. Dissipated Power
• Treatment times scaled such that deposited energy constant for each experiment
• Interestingly, increasing power favors: – More nitrite – Less nitrate
• No current good hypothesis as to why

[NO3-] vs. Gas Flow
0
2000
4000
6000
8000
10000
12000
14000
230 280 330 380 430
Inte
nsity
(arb
. Uni
ts)
Wavelength (nm)
.057 m^3/min .091 m^3/min .12 m^3/min
• Left plot shows significant increase in dissolved nitrate as gas flow is increased • Change in uptake takes place while OES spectra remain the same • Since core plasma chemistry appears to remain unchanged, increase in uptake could be attributed to enhanced mass
transfer from plasma to liquid increased spreading of nitrate over the interface increases surface area for mass transfer

Back to Part 1 Model for a second…
• Admittedly different geometry from NCSU system, but qualitatively similar
• A little difficult to see, but higher flow does lead to greater HNO3(g) spreading over interface
• Leads to greater HNO3(aq) uptake as seen in top right graph
HNO3 profile at 17 minutes for inlet velocity = 16 m/s
HNO3 profile at 17 minutes for inlet velocity = 4 m/s
0.00E+00
5.00E-11
1.00E-10
1.50E-10
2.00E-10
0 5 10 15 20
HN
O3
upta
ke ra
te
(mol
/(L*
s))
Gas inlet velocity (m/s)
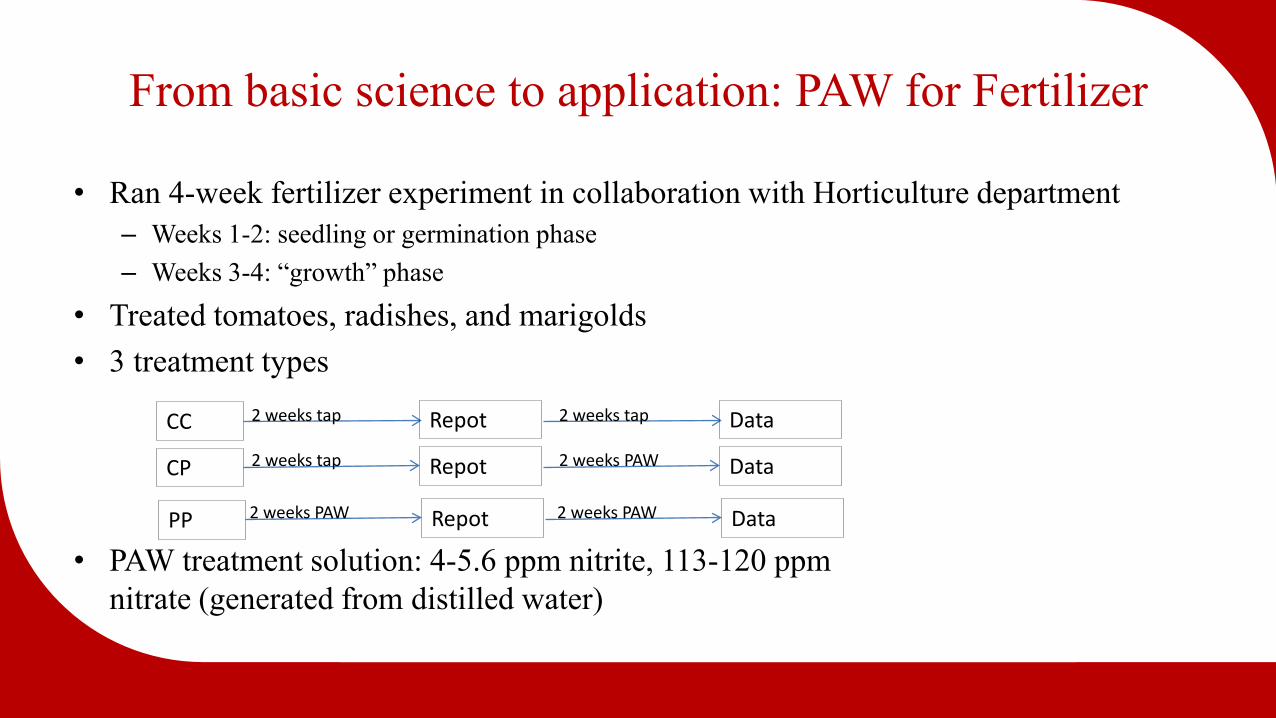
• Ran 4-week fertilizer experiment in collaboration with Horticulture department – Weeks 1-2: seedling or germination phase – Weeks 3-4: “growth” phase
• Treated tomatoes, radishes, and marigolds • 3 treatment types
• PAW treatment solution: 4-5.6 ppm nitrite, 113-120 ppm nitrate (generated from distilled water)
From basic science to application: PAW for Fertilizer
CC
CP
PP 2 weeks PAW
2 weeks tap
2 weeks tap Repot
Repot
Repot 2 weeks PAW
2 weeks PAW
2 weeks tap Data
Data
Data

Final Seedling phase data (1/2 way point of experiment)
• At ½ way point, plasma groups are taller than controls across all plant types, but not enough for standard statistical significance
Radish Marigold Tomato
.054 .243 .219
Welch’s two-tail t-test. Numbers shown are p-values. It is common to choose p < .05 to denote statistically significant differences between distributions

Growth phase data (2-4 weeks)

Final growth phase results
Shoot Mass PP vs. CP PP vs. CC CP vs. CC
Radish 1.000 0.001 0.005
Marigold 0.224 0.060 0.017
Tomato 0.414 0.035 0.044
Welch’s two-tail t-test. Numbers shown are p-values.
• Plants treated with PAW during weeks 3 & 4 are all significantly larger in shoot mass than control treated plants with the exception of CC vs. PP marigolds
• No statistically significant difference in root masses

Final photos
Marigolds Tomatoes Radishes
CC CP PP CC CP PP CC CP PP

Conclusions
• PAW treated plants showed slightly larger growth than control group in seedling phase, but not enough for significance
• PAW treated plants showed significantly larger growth than control groups during growth phase
• As expected, PAW capable of promoting plant growth • Can achieve some level of control of nitrite and nitrate concentrations using gas
phase knobs (power, flow rate) and solution composition (NaHCO3)

Future Work & Acknowledgments • Our focus: back to basic science Model VHF discharge
– Surface wave? – Gain greater understanding of gas phase chemistry: why more nitrite and less nitrate with increasing power?
• Incorporate and expand transport models from Part 1 (Berkeley system) to treat the NCSU system – Explore reactions with NaHCO3 and other non-plasma generated aqueous species
• Commercial development: Discovered last month that Scandinavian start-up also using PAW for fertilizer but with added step: – Mix naturally acidic PAW with manure in order to lower manure pH – Fixes volatile ammonia in manure to non-volatile ammonium – Now have NH4NO3: two moles of N instead of one! – They’re still trying to figure out best plasma system for generating nitrate pre-cursor NO: this is where basic plasma
physics and chemistry come into play • Acknowledgments:
– David Black – Wesley King – Asish Andhavarapu – Advanced Energy

THANKS!