Embed Size (px)
Citation preview
Parentage Based Tagging in the Snake River basin: From conception to implementation
Matthew Campbell, Craig Steele, Brian Leth, Alan ByrneIdaho Department of Fish and Game
LSRCP Annual Meeting2015
1
Conception:
2
Salmon Hatchery Management

Initiation of PBT in the Snake River basin
•Parentage Based Tagging was initiated in the Snake River basin following requests by IDFG managers to investigate alternative tagging methods to increase tagging rates and recoveries to estimate stock contributions of hatchery stocks returning over Lower Granite Dam back to Idaho and in‐State fisheries.
3
While between 500‐800 coded‐wire tags have been recovered annually (2005‐2007), ~ten times that many (~6,000) adults have been physically examined each year (Hansen 2007)
500‐800 6,000<

Initiation of PBT in the Snake River basin
•In addition, during this same period, several committees and science review groups specifically recommended that large‐scale evaluations of the technology be performed (PFMC 2008; PSC 2008; ISRP/ISAB 2009).
4
Parentage‐based genetic tagging ‐ PBT(Anderson and Garza 2005)
Parentage‐based tagging is based on the same techniques as those used in human parentage testing
5
Why PBT?
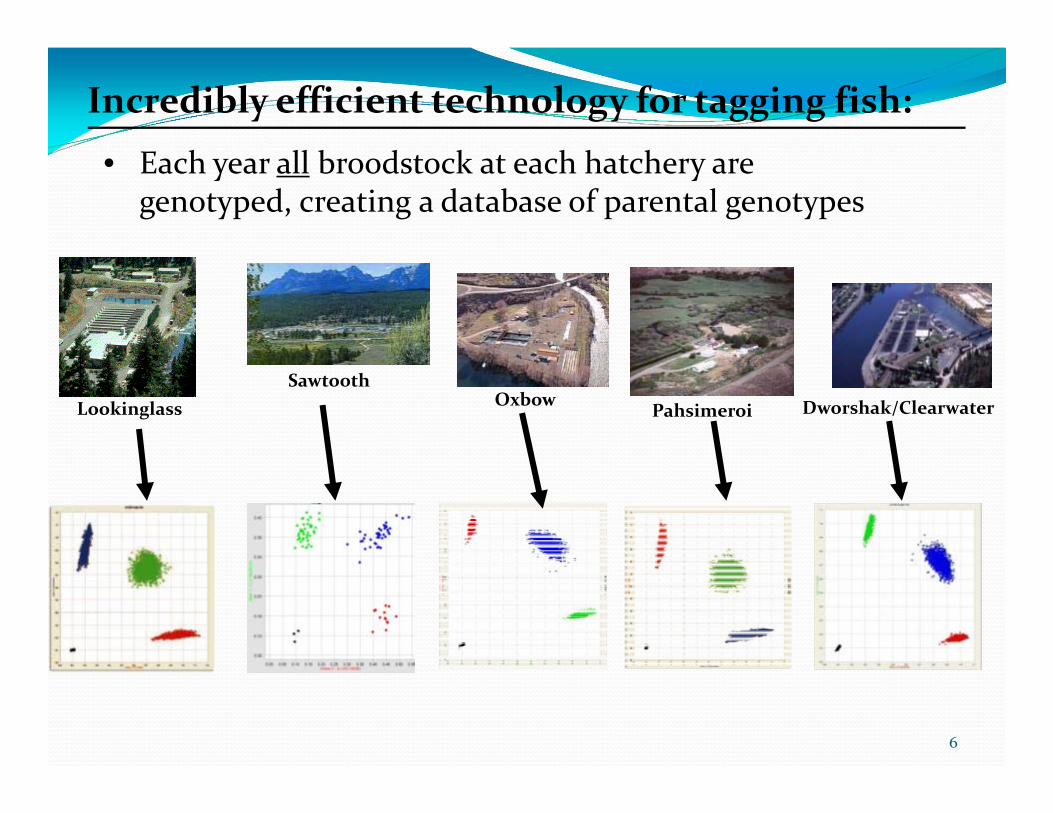
• Each year all broodstock at each hatchery are genotyped, creating a database of parental genotypes
Sawtooth
PahsimeroiOxbow Dworshak/ClearwaterLookinglass
Incredibly efficient technology for tagging fish:
6
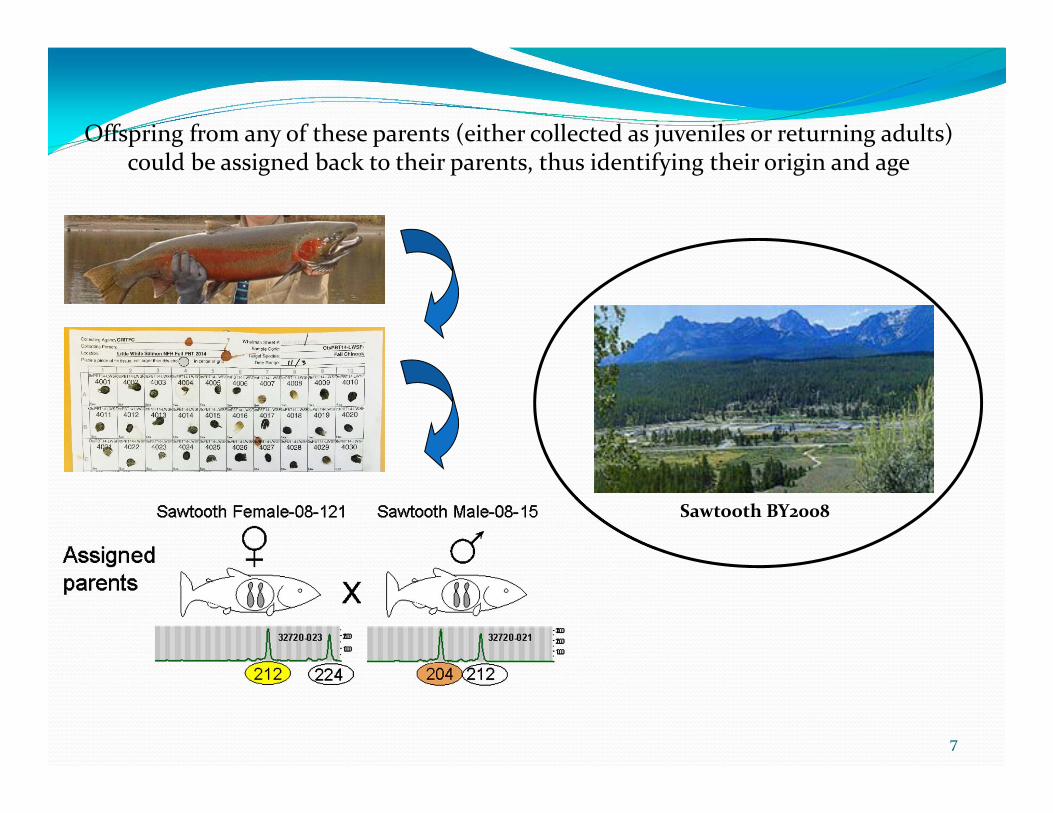
Offspring from any of these parents (either collected as juveniles or returning adults) could be assigned back to their parents, thus identifying their origin and age
Sawtooth BY2008
7
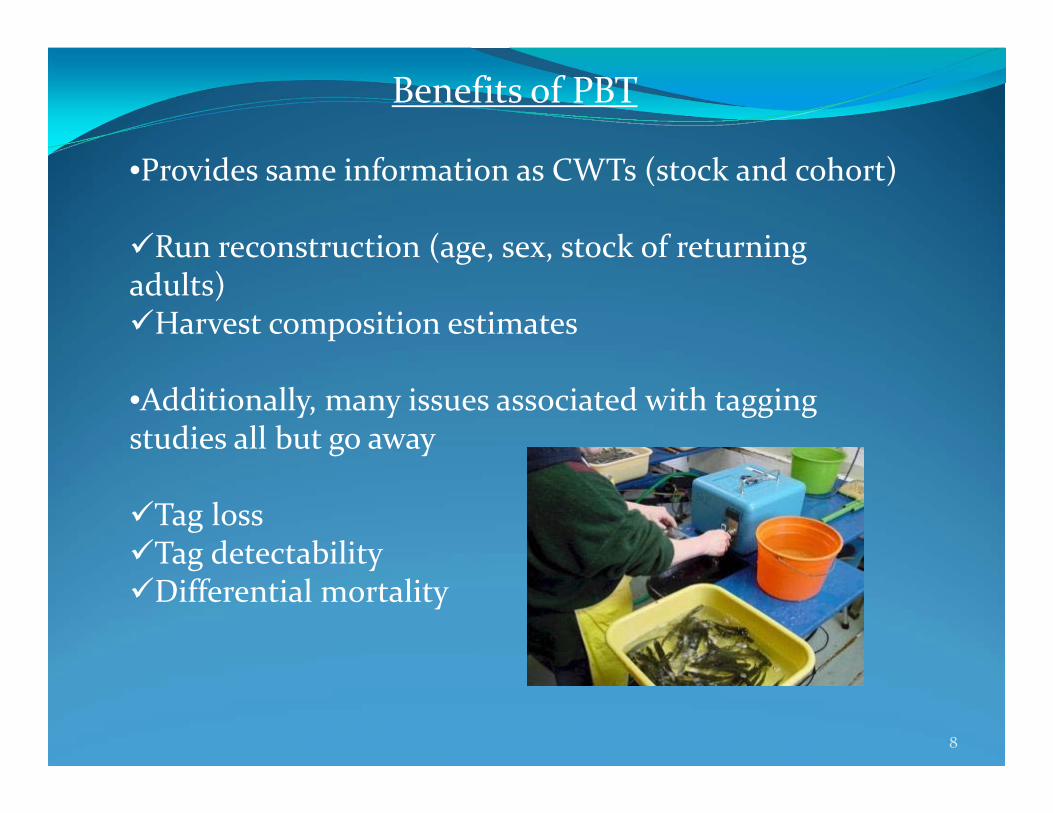
Benefits of PBT
•Provides same information as CWTs (stock and cohort)
Run reconstruction (age, sex, stock of returning adults)Harvest composition estimates
•Additionally, many issues associated with tagging studies all but go away
Tag lossTag detectabilityDifferential mortality
8
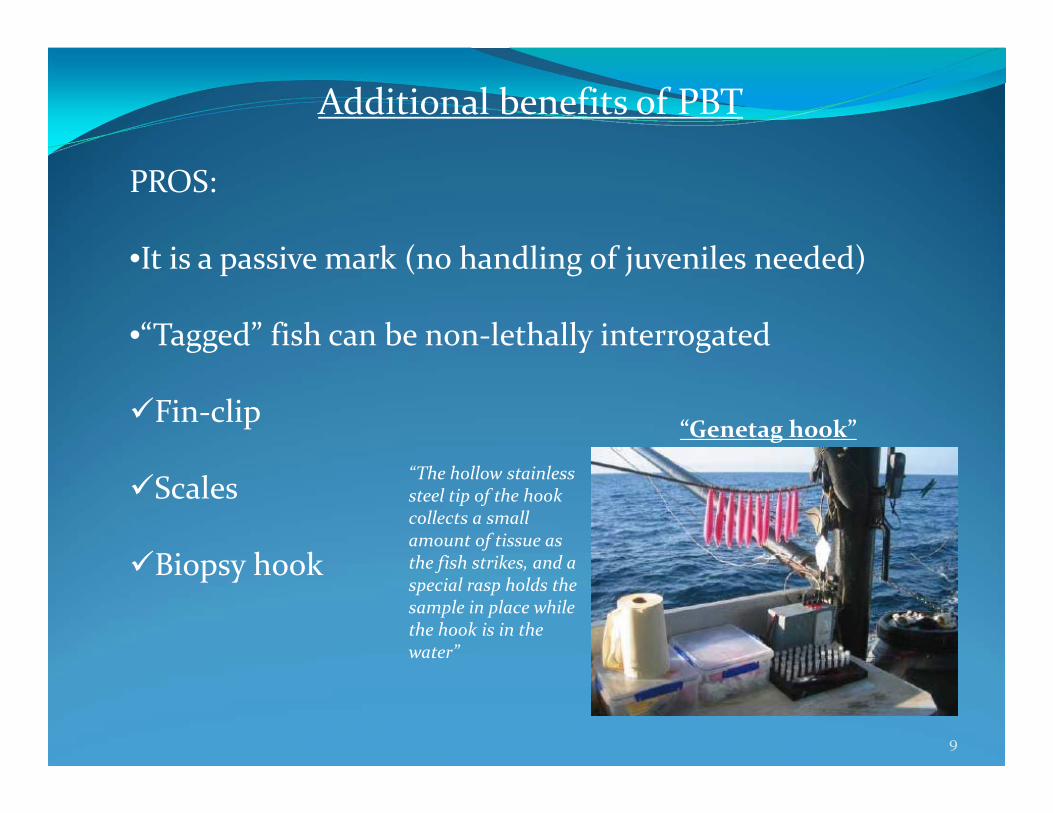
Additional benefits of PBT
PROS:
•It is a passive mark (no handling of juveniles needed)
•“Tagged” fish can be non‐lethally interrogated
Fin‐clip
Scales
Biopsy hook
“The hollow stainless steel tip of the hook collects a small amount of tissue as the fish strikes, and a special rasp holds the sample in place while the hook is in the water”
“Genetag hook”
9

Versatility of PBT
PROS:•Can potentially provide much more information than stock and cohort of origin
•Host of other life history, ecological and quantitative genetic questions
10
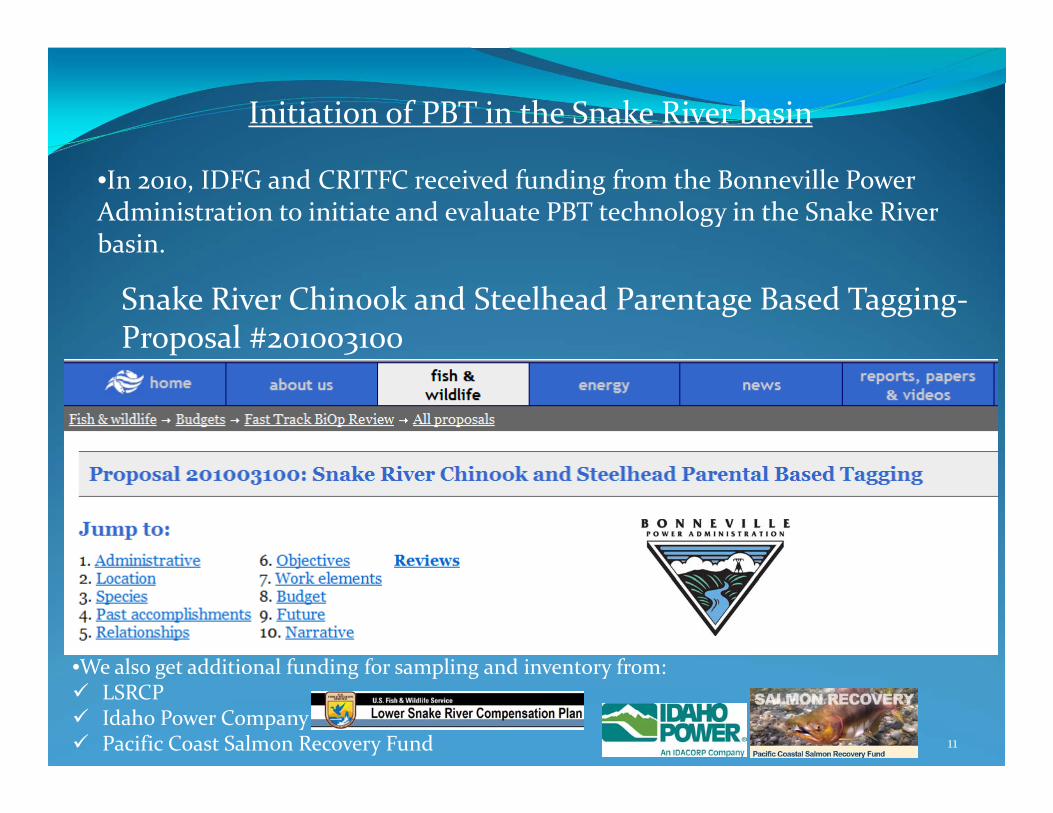
Initiation of PBT in the Snake River basin
•In 2010, IDFG and CRITFC received funding from the Bonneville Power Administration to initiate and evaluate PBT technology in the Snake River basin.
11
Snake River Chinook and Steelhead Parentage Based Tagging‐Proposal #201003100
•We also get additional funding for sampling and inventory from: LSRCP Idaho Power Company Pacific Coast Salmon Recovery Fund
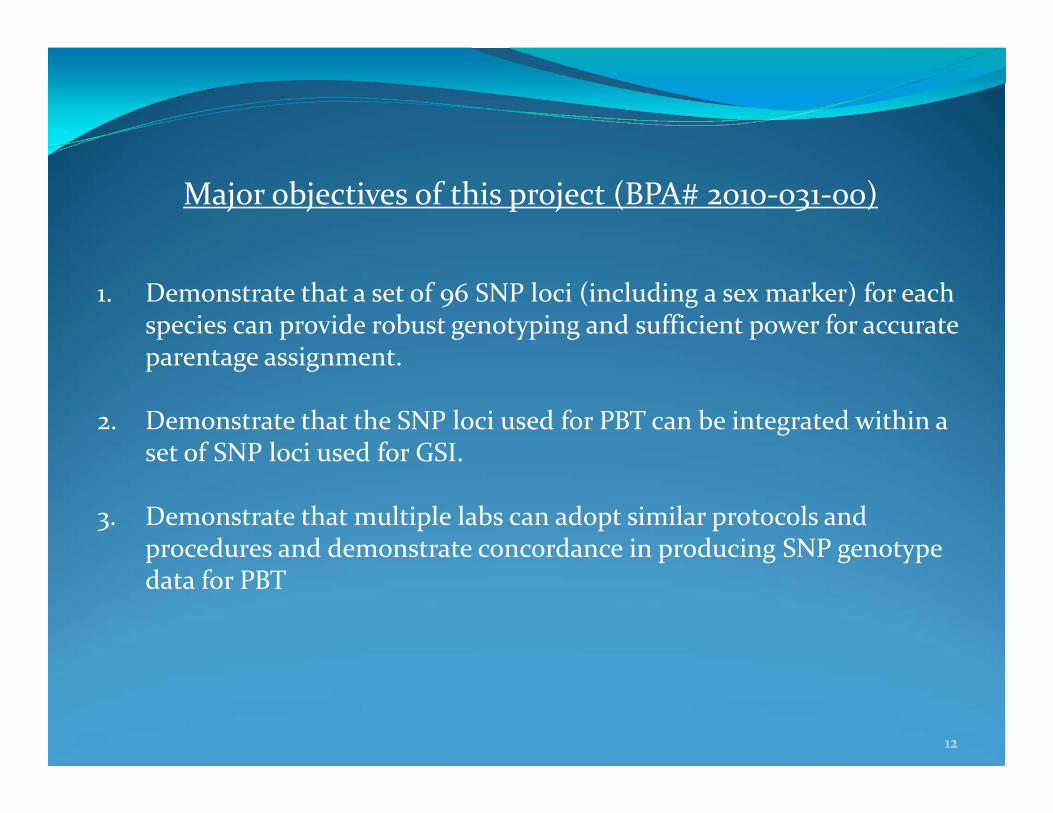
Major objectives of this project (BPA# 2010‐031‐00)
1. Demonstrate that a set of 96 SNP loci (including a sex marker) for each species can provide robust genotyping and sufficient power for accurate parentage assignment.
2. Demonstrate that the SNP loci used for PBT can be integrated within a set of SNP loci used for GSI.
3. Demonstrate that multiple labs can adopt similar protocols and procedures and demonstrate concordance in producing SNP genotype data for PBT
12

Major objectives of this project (BPA# 2010‐031‐00)
4. Demonstrate the feasibility of PBT sampling and inventorying all hatchery broodstock spawned in the Snake River basin.
5. Demonstrate parental baselines can be constructed each year and that high genotyping and tagging rates can be obtained for each species.
6. Demonstrate the application and versatility of this technology through the summary of multiple back end projects that use completed PBT baselines to assign parentage to samples of unknown origin.
13
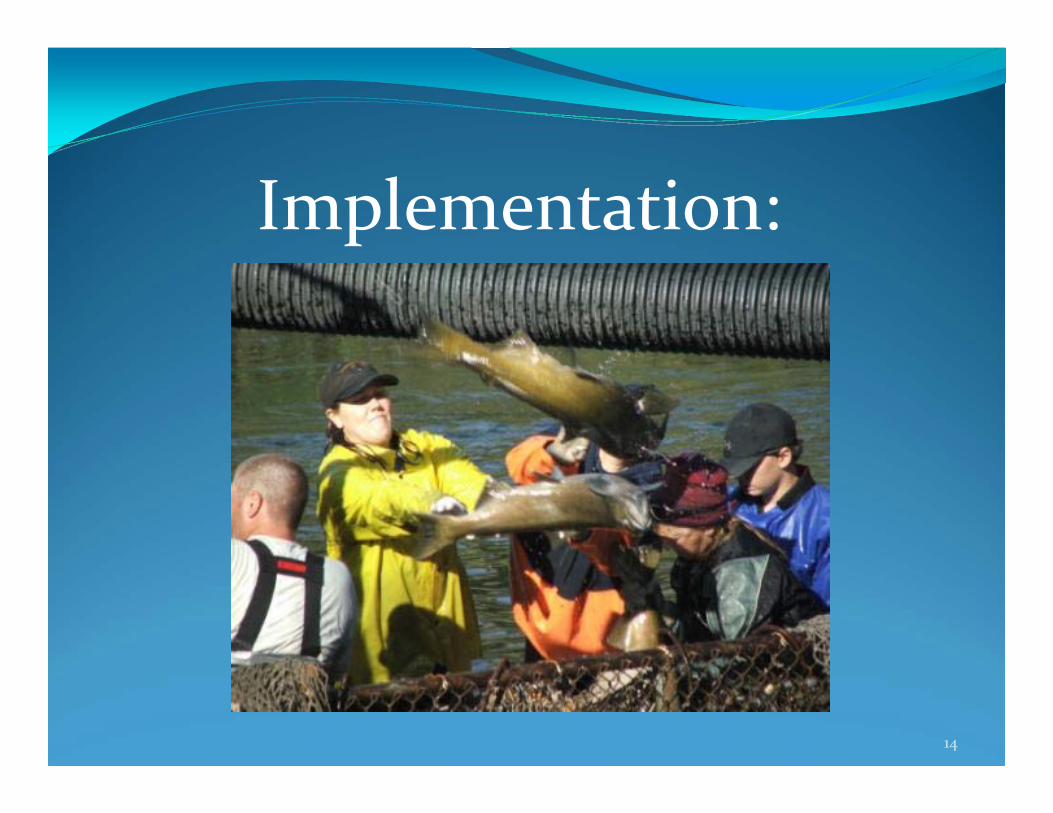
Implementation:
14
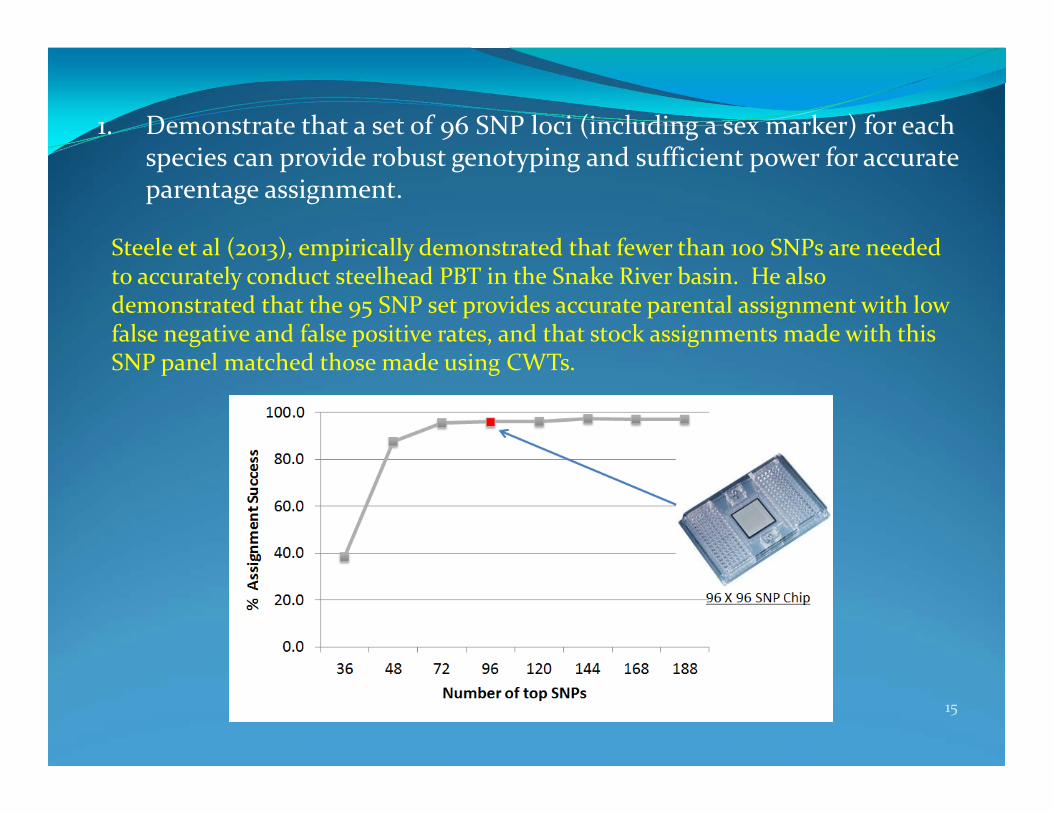
1. Demonstrate that a set of 96 SNP loci (including a sex marker) for each species can provide robust genotyping and sufficient power for accurate parentage assignment.
15
Steele et al (2013), empirically demonstrated that fewer than 100 SNPs are needed to accurately conduct steelhead PBT in the Snake River basin. He also demonstrated that the 95 SNP set provides accurate parental assignment with low false negative and false positive rates, and that stock assignments made with this SNP panel matched those made using CWTs.
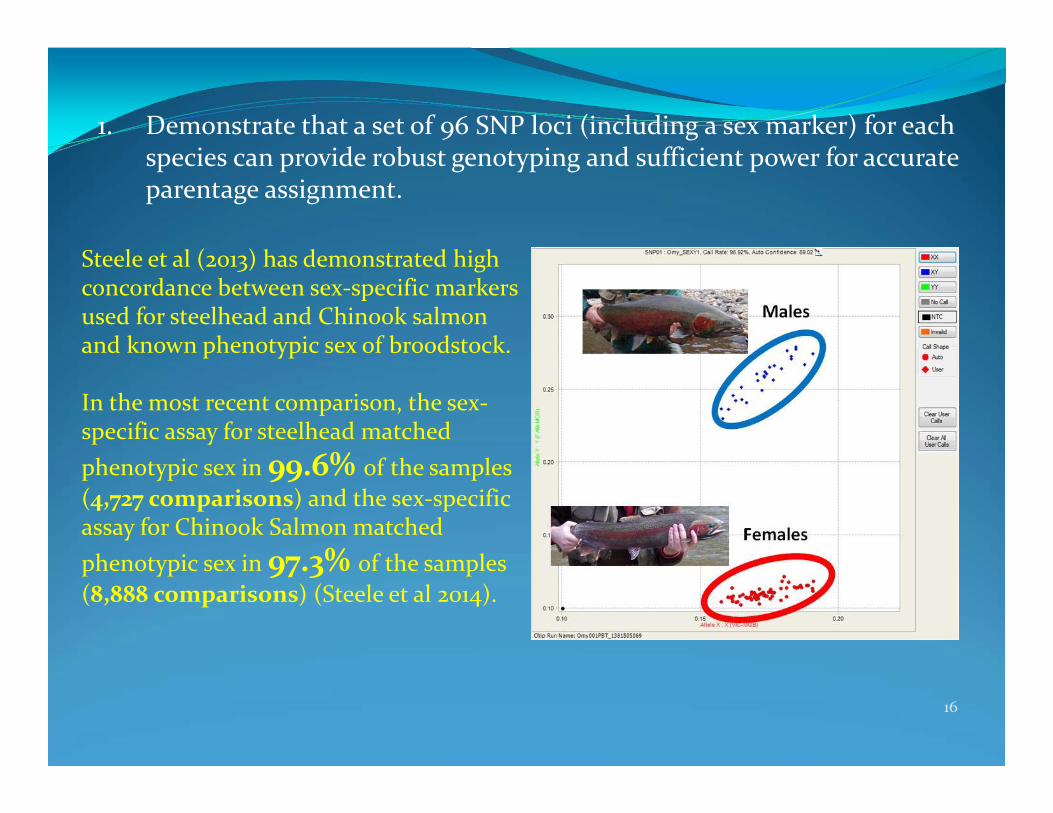
1. Demonstrate that a set of 96 SNP loci (including a sex marker) for each species can provide robust genotyping and sufficient power for accurate parentage assignment.
16
Steele et al (2013) has demonstrated high concordance between sex‐specific markers used for steelhead and Chinook salmon and known phenotypic sex of broodstock.
In the most recent comparison, the sex‐specific assay for steelhead matched phenotypic sex in 99.6% of the samples (4,727 comparisons) and the sex‐specific assay for Chinook Salmon matched phenotypic sex in 97.3% of the samples (8,888 comparisons) (Steele et al 2014).
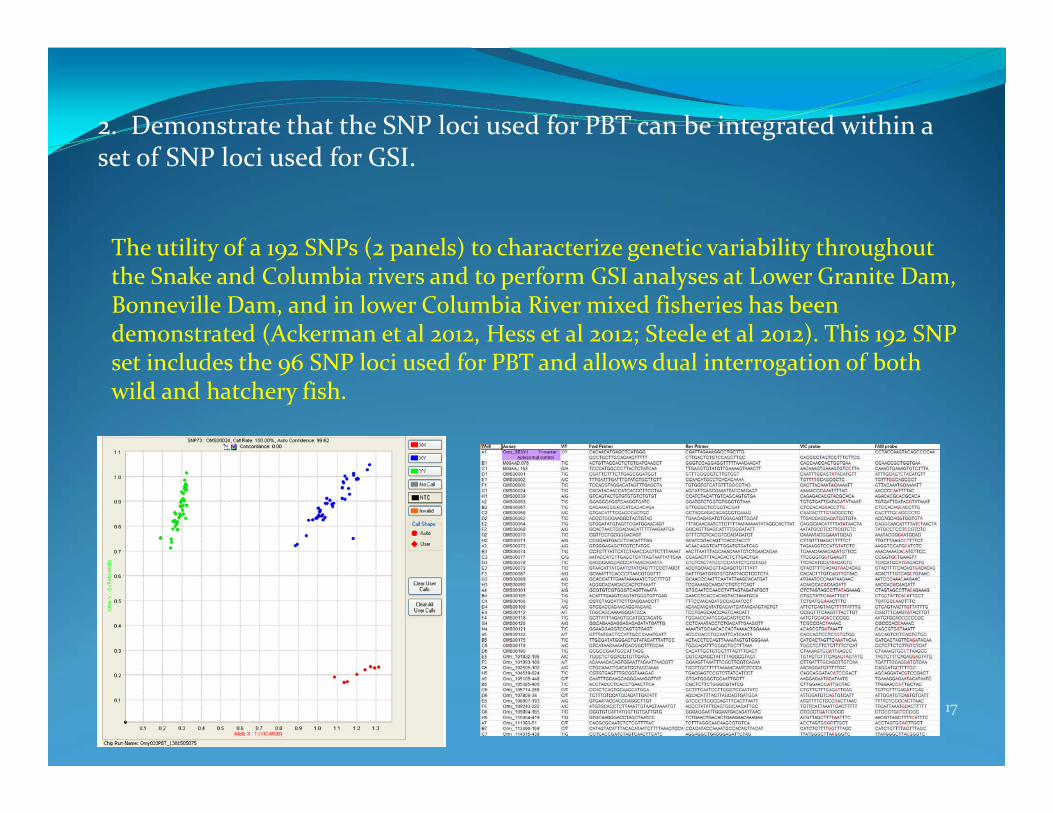
2. Demonstrate that the SNP loci used for PBT can be integrated within a set of SNP loci used for GSI.
17
The utility of a 192 SNPs (2 panels) to characterize genetic variability throughout the Snake and Columbia rivers and to perform GSI analyses at Lower Granite Dam, Bonneville Dam, and in lower Columbia River mixed fisheries has been demonstrated (Ackerman et al 2012, Hess et al 2012; Steele et al 2012). This 192 SNP set includes the 96 SNP loci used for PBT and allows dual interrogation of both wild and hatchery fish.
2. Demonstrate that the SNP loci used for PBT can be integrated within a set of SNP loci used for GSI.
18
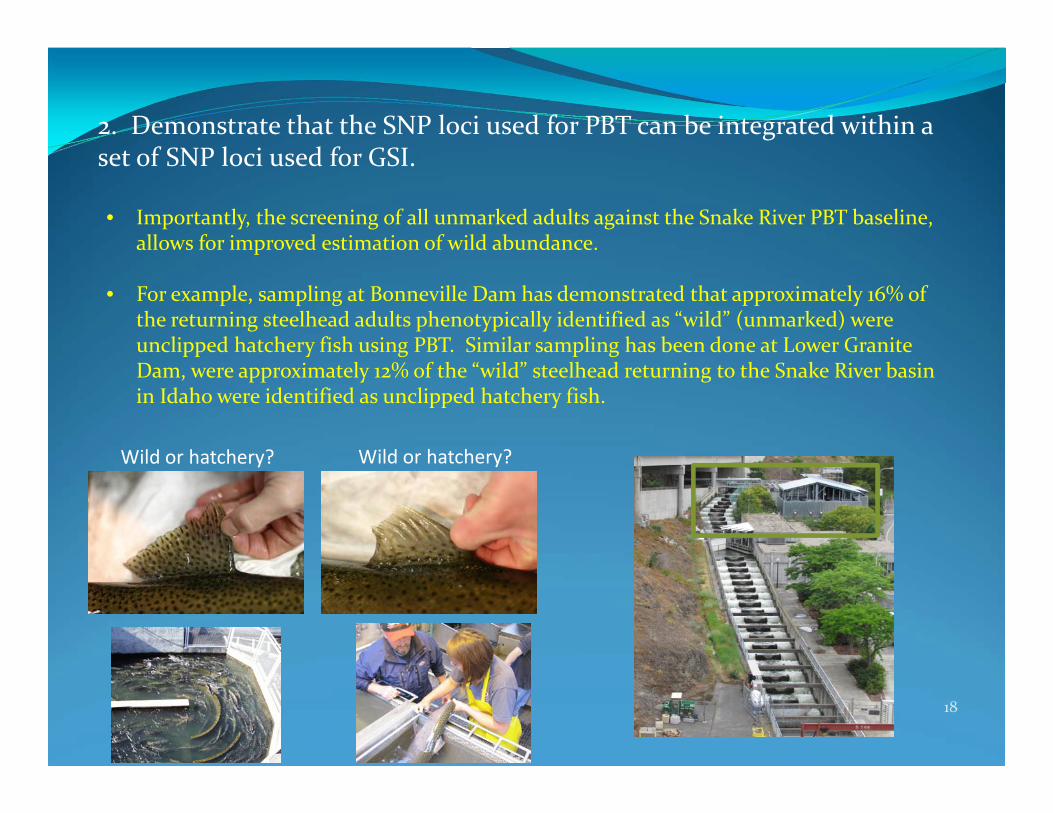
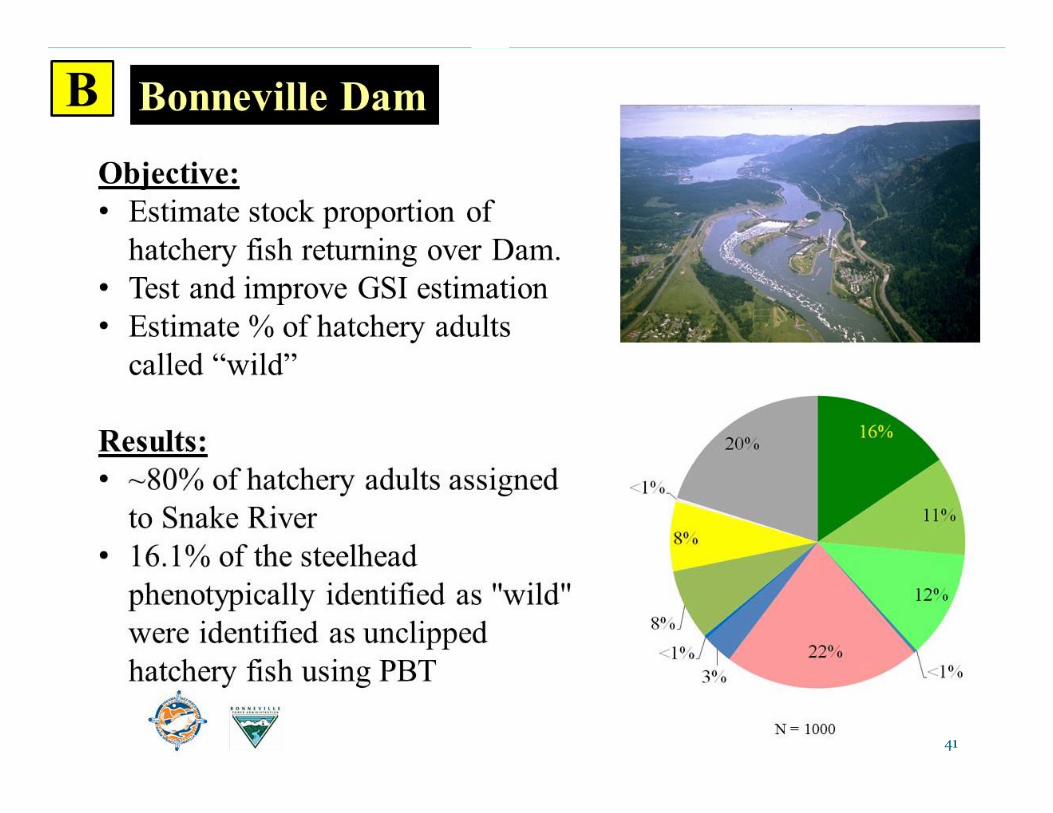
• Importantly, the screening of all unmarked adults against the Snake River PBT baseline, allows for improved estimation of wild abundance.
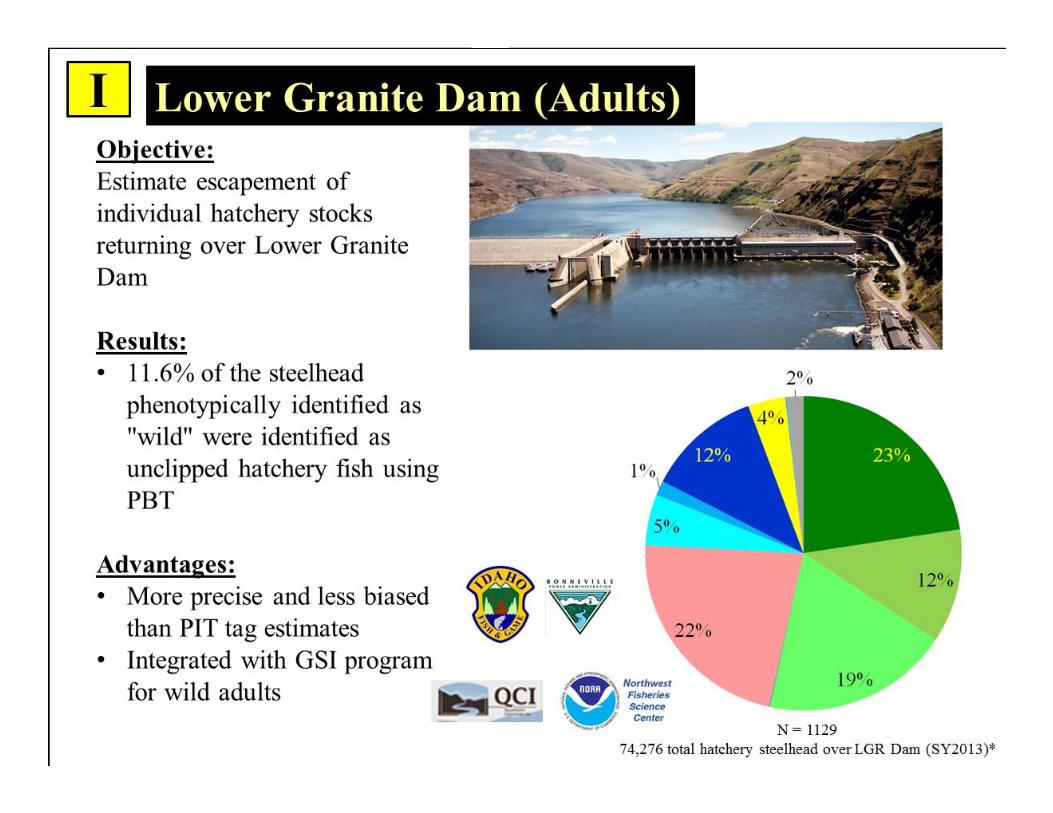
• For example, sampling at Bonneville Dam has demonstrated that approximately 16% of the returning steelhead adults phenotypically identified as “wild” (unmarked) were unclipped hatchery fish using PBT. Similar sampling has been done at Lower Granite Dam, were approximately 12% of the “wild” steelhead returning to the Snake River basin in Idaho were identified as unclipped hatchery fish.
Wild or hatchery? Wild or hatchery?

3. Demonstrate that multiple labs can adopt similar protocols and procedures and demonstrate concordance in producing SNP genotype data for PBT
19
This project has demonstrated that multiple labs can adopt similar protocols and procedures for inventorying and genotyping samples, conducting QA/QC procedures, storing standardized meta‐ and genetic data in secure in‐house databases, and combine PBT data into single, secure databases that make PBT baselines available to agencies throughout the Columbia River Basin.
• To produce Snake River PBT and GSI baselines for Chinook salmon and steelhead, CRITFC and IDFG labs each genotype 50% of the broodstockannually.
• Each lab follows similar laboratory methods/protocols for genotyping samples and performing QA/QC procedures. These protocols are published on Monitoring Methods.org (https://www.monitoringmethods.org/)
3. Demonstrate that multiple labs can adopt similar protocols and procedures and demonstrate concordance in producing SNP genotype data for PBT
20
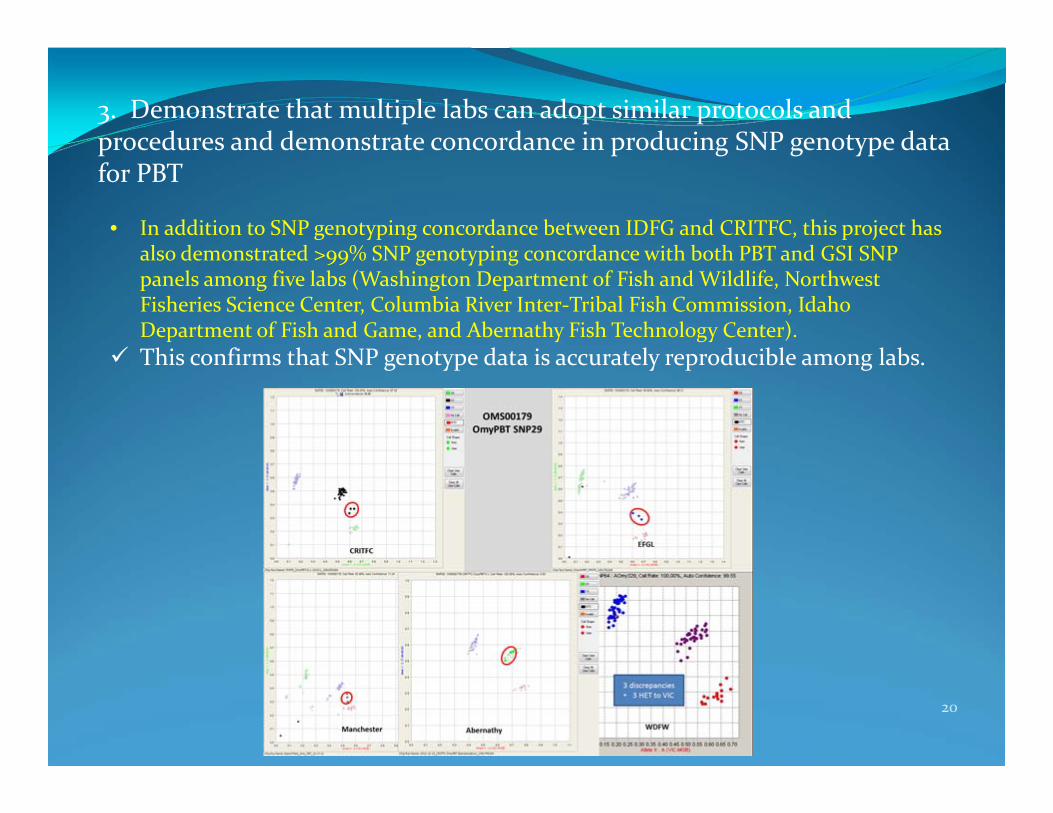
• In addition to SNP genotyping concordance between IDFG and CRITFC, this project has also demonstrated >99% SNP genotyping concordance with both PBT and GSI SNP panels among five labs (Washington Department of Fish and Wildlife, Northwest Fisheries Science Center, Columbia River Inter‐Tribal Fish Commission, Idaho Department of Fish and Game, and Abernathy Fish Technology Center).
This confirms that SNP genotype data is accurately reproducible among labs.
3. Demonstrate that multiple labs can adopt similar protocols and procedures and demonstrate concordance in producing SNP genotype data for PBT
21
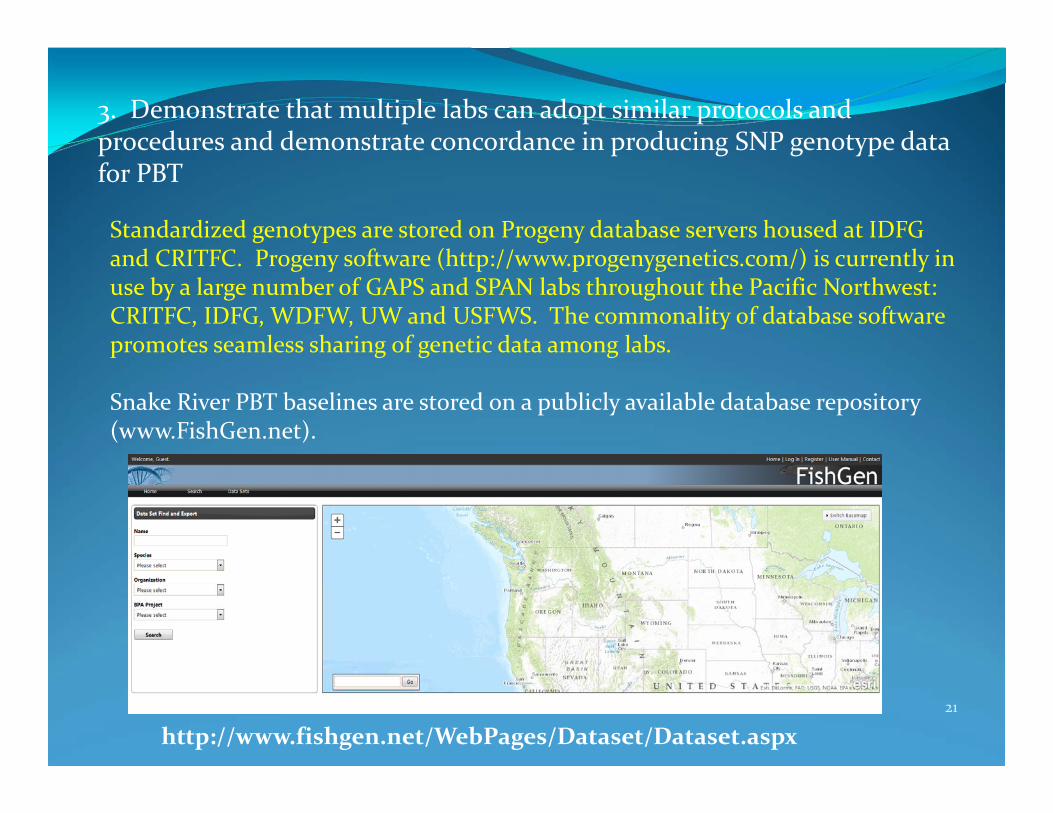
Standardized genotypes are stored on Progeny database servers housed at IDFG and CRITFC. Progeny software (http://www.progenygenetics.com/) is currently in use by a large number of GAPS and SPAN labs throughout the Pacific Northwest: CRITFC, IDFG, WDFW, UW and USFWS. The commonality of database software promotes seamless sharing of genetic data among labs.
Snake River PBT baselines are stored on a publicly available database repository (www.FishGen.net).
http://www.fishgen.net/WebPages/Dataset/Dataset.aspx
22
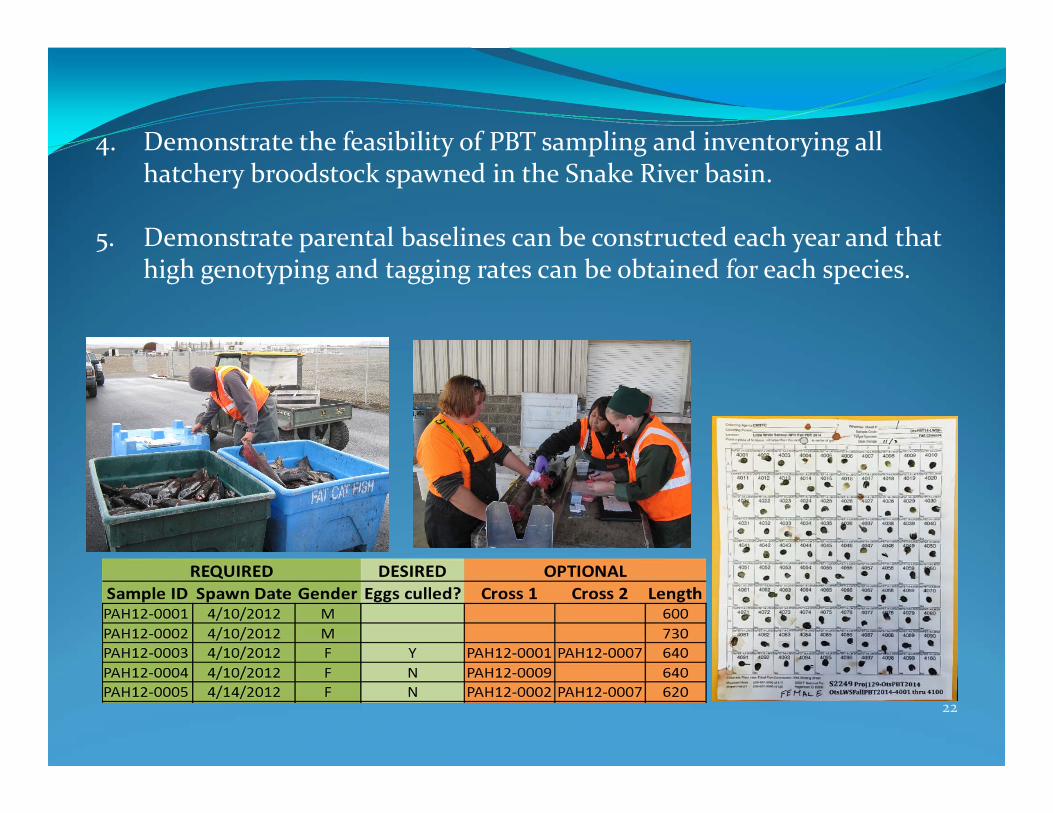
4. Demonstrate the feasibility of PBT sampling and inventorying all hatchery broodstock spawned in the Snake River basin.
5. Demonstrate parental baselines can be constructed each year and that high genotyping and tagging rates can be obtained for each species.
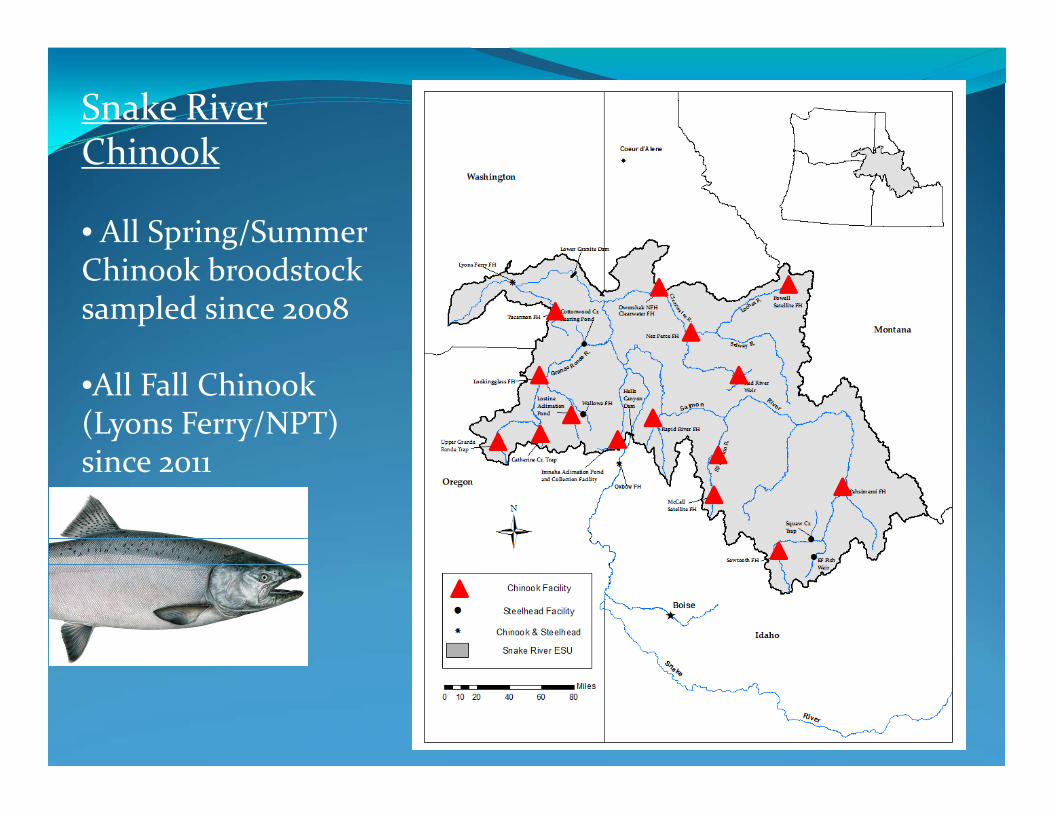
Snake River Chinook
• All Spring/Summer Chinook broodstock sampled since 2008
•All Fall Chinook (Lyons Ferry/NPT) since 2011

Spawn Year
2008 2009 2010 2011
Broodstock sampled 10,836 8,849 8,290 8,187
Genotyped 10,630 8,493 8,235 ±8,100
“Tagging” Rate of Offspring 96.2% 92.1% 98.7% ±98.9%
Smolts Produced * ~18.96 mil ~15.49 mil ~14.51 mil ~14.33 mil
Smolts “Tagged” ~18.25 mil ~14.26 mil ~14.32 mil ~14.18 mil* Assuming 3,500 smolts produced per broodstock pair, ± Numbers not final
This project genetically tags ~34% of spring/summer hatchery Chinook salmon released in the Columbia River basin each year
Spring/Summer Chinook salmon:How many are we tagging?
24
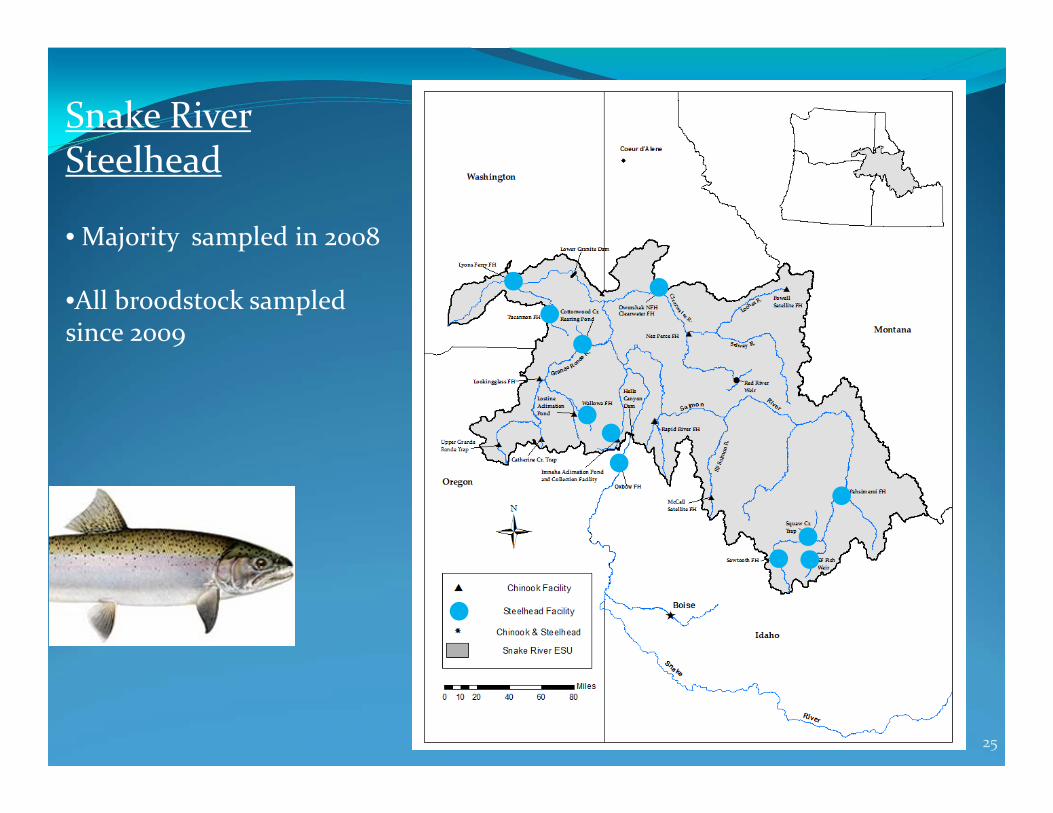
Snake River Steelhead
• Majority sampled in 2008
•All broodstock sampled since 2009
25
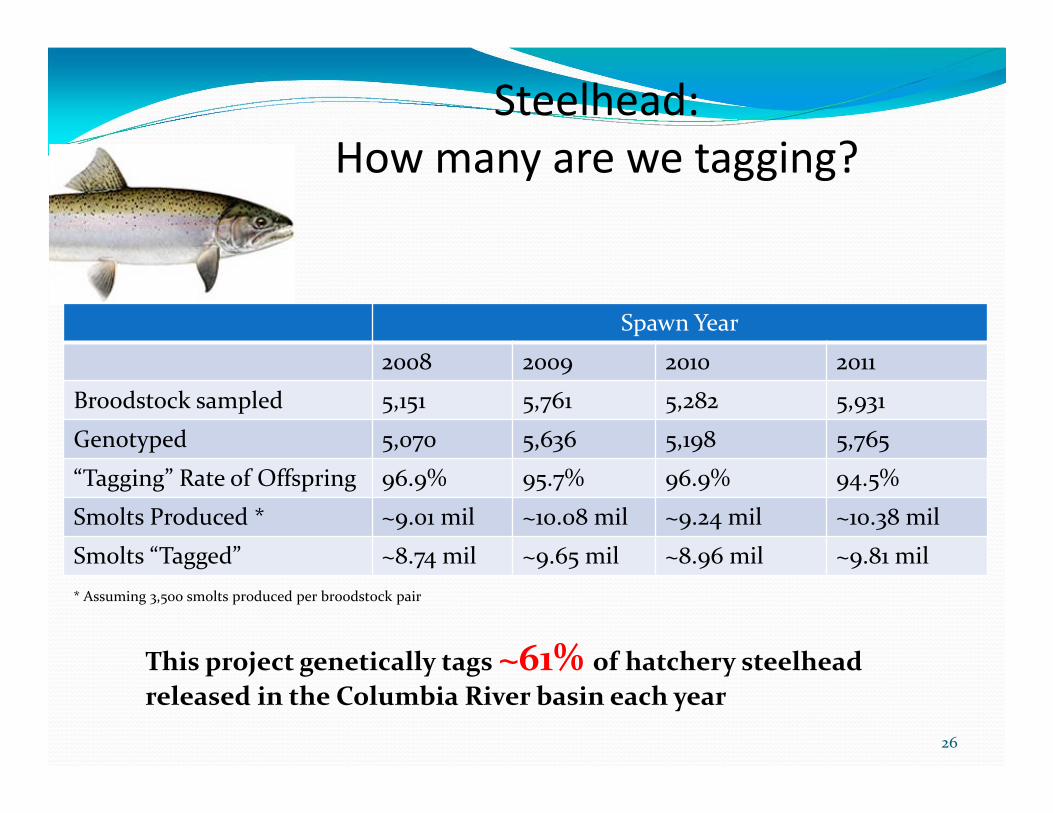
Spawn Year
2008 2009 2010 2011
Broodstock sampled 5,151 5,761 5,282 5,931
Genotyped 5,070 5,636 5,198 5,765
“Tagging” Rate of Offspring 96.9% 95.7% 96.9% 94.5%
Smolts Produced * ~9.01 mil ~10.08 mil ~9.24 mil ~10.38 mil
Smolts “Tagged” ~8.74 mil ~9.65 mil ~8.96 mil ~9.81 mil* Assuming 3,500 smolts produced per broodstock pair
Steelhead:How many are we tagging?
This project genetically tags ~61% of hatchery steelhead released in the Columbia River basin each year
26
27
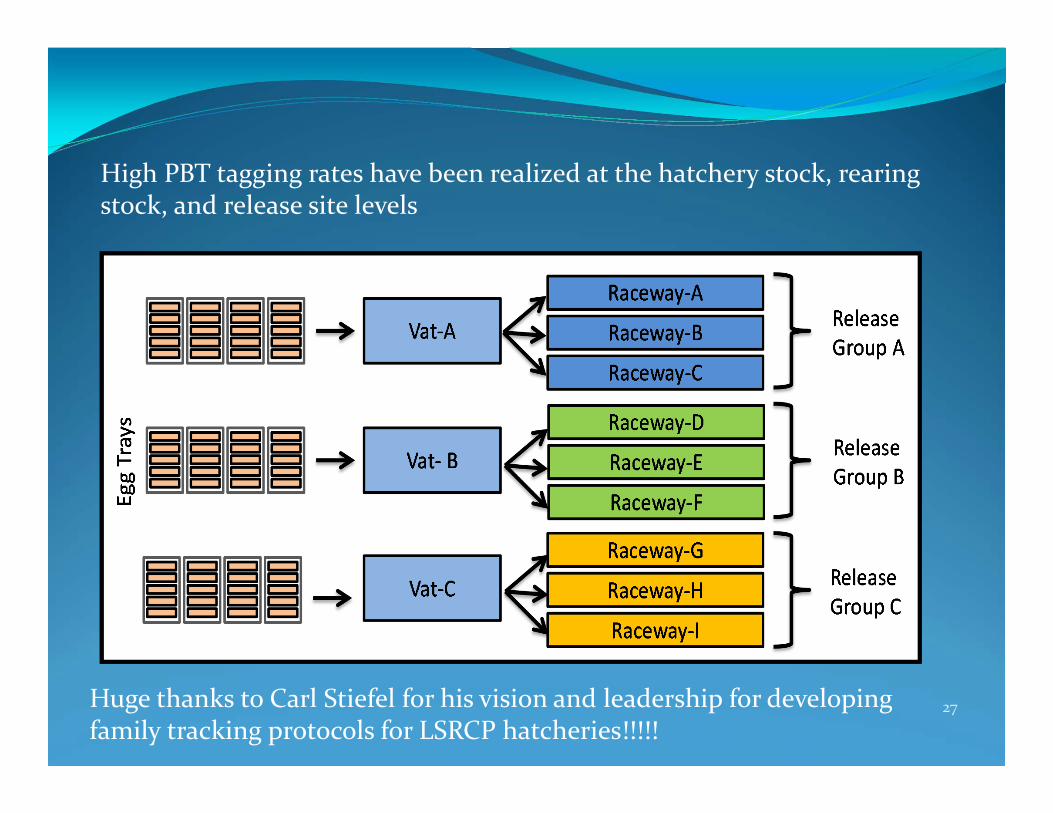
High PBT tagging rates have been realized at the hatchery stock, rearing stock, and release site levels
Huge thanks to Carl Stiefel for his vision and leadership for developing family tracking protocols for LSRCP hatcheries!!!!!
28
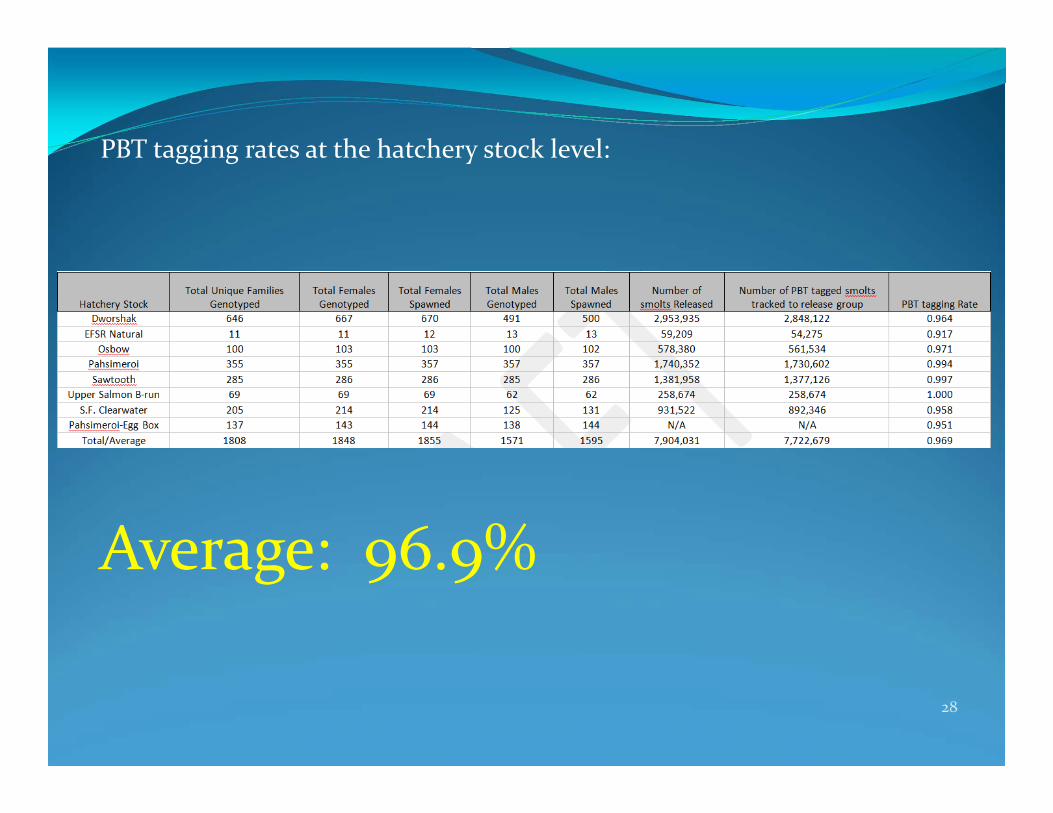
PBT tagging rates at the hatchery stock level:
Average: 96.9%

29
PBT tagging rates at the rearing stock level:
Average: 96.9%
30
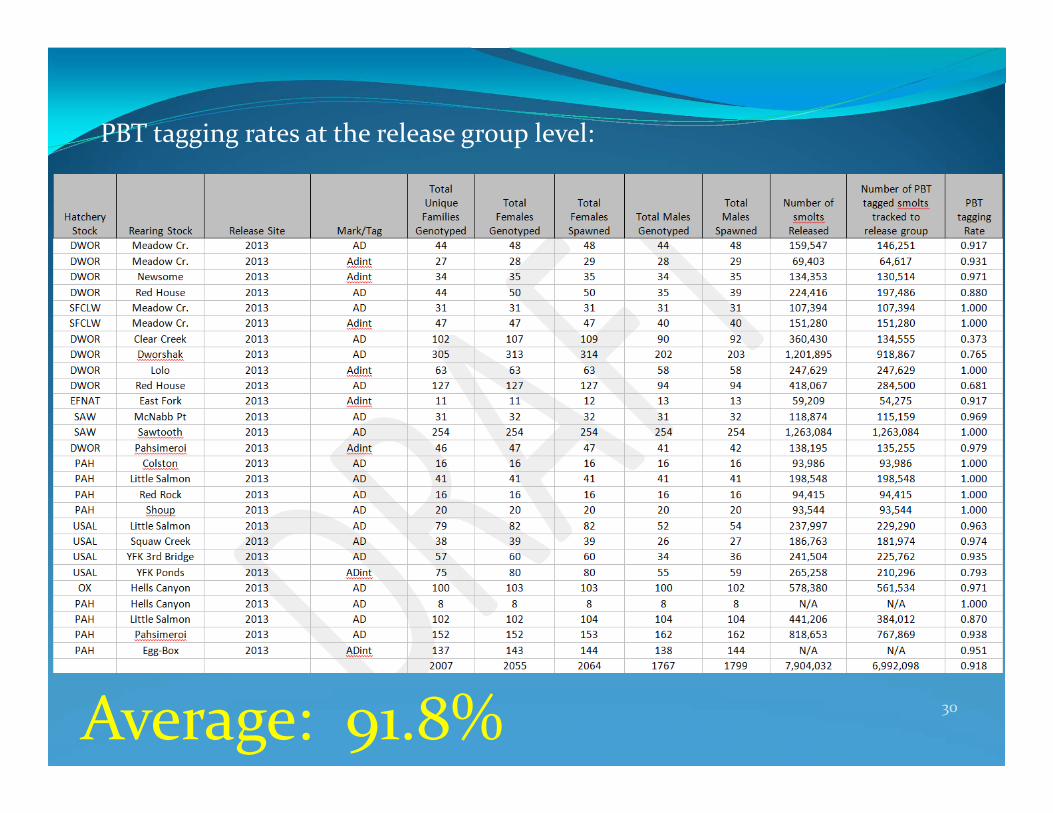
PBT tagging rates at the release group level:
Average: 91.8%

6. Demonstrate the application and versatility of this technology through the summary of multiple back end projects that use completed PBT baselines to assign parentage to samples of unknown origin.
3131
Chinook salmon
32
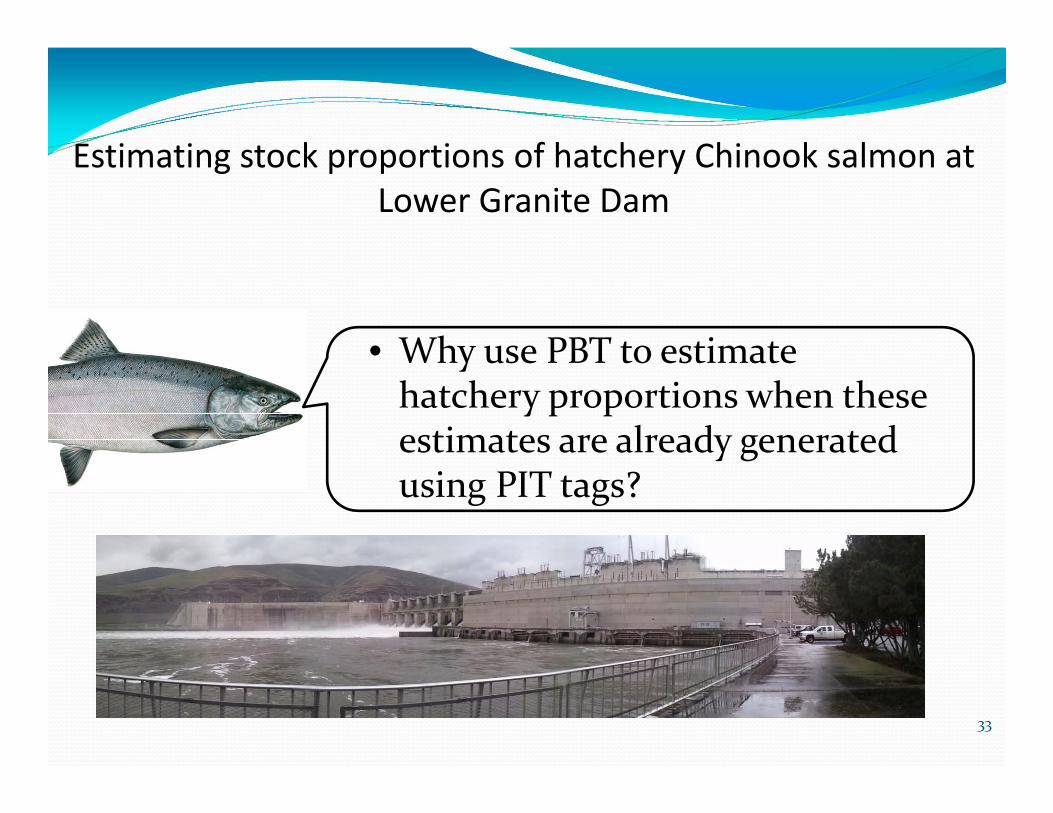
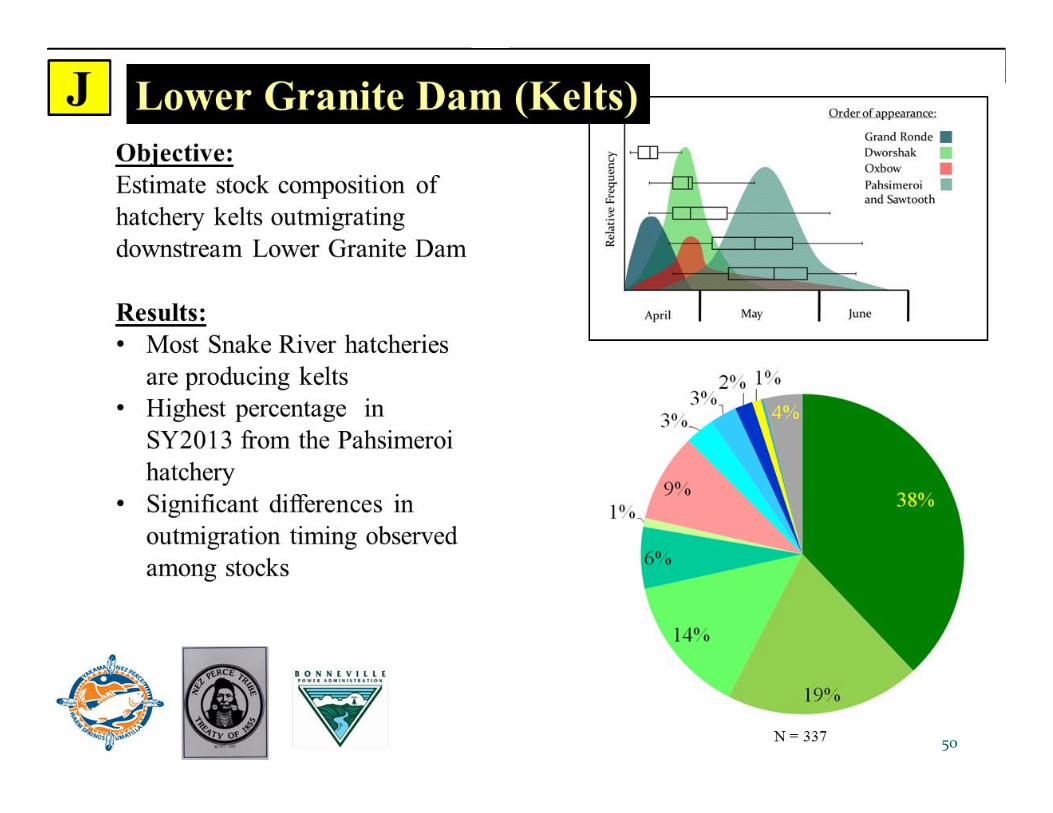
Estimating stock proportions of hatchery Chinook salmon at Lower Granite Dam
• Why use PBT to estimate hatchery proportions when these estimates are already generated using PIT tags?
33

Estimating stock proportions with PBT
• PIT tags may underestimate numbers at Lower Granite Dam when compared to window counts PIT tag shedding Mortality Tag failure
• Can be adjusted, if underestimate is uniform across stocks
34
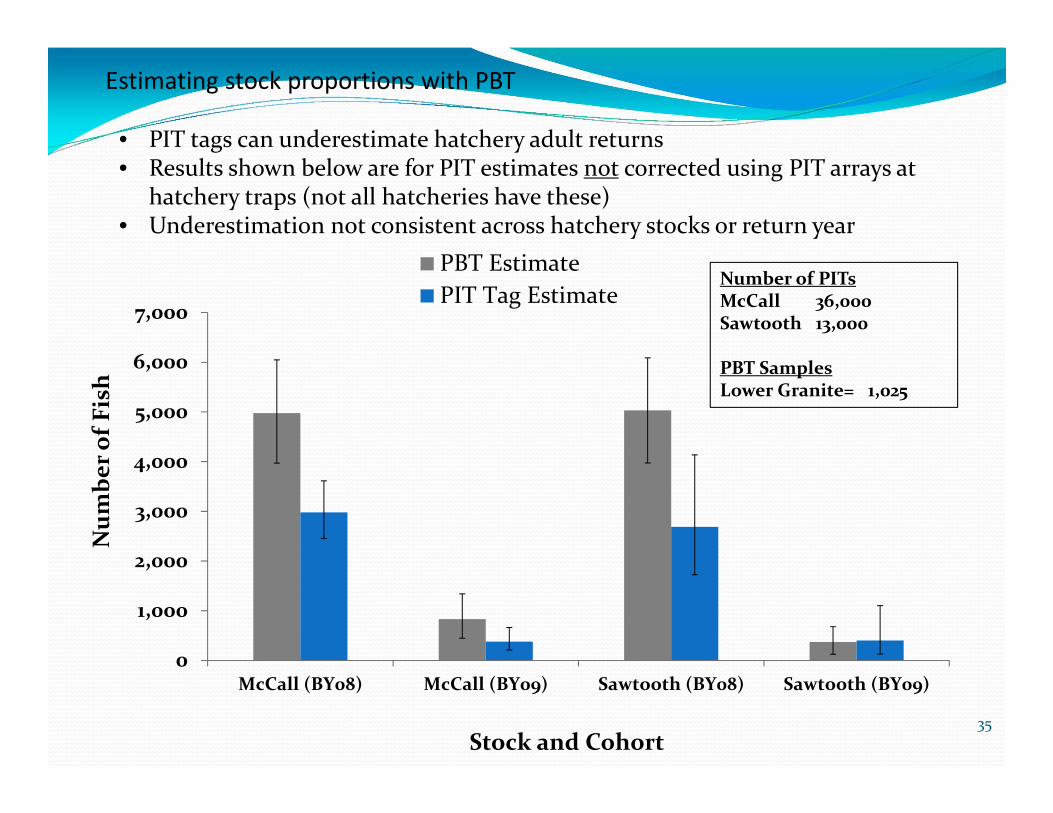
0
1,000
2,000
3,000
4,000
5,000
6,000
7,000
McCall (BY08) McCall (BY09) Sawtooth (BY08) Sawtooth (BY09)
Num
ber o
f Fish
Stock and Cohort
PBT EstimatePIT Tag Estimate
Number of PITsMcCall 36,000Sawtooth 13,000
PBT SamplesLower Granite= 1,025
• PIT tags can underestimate hatchery adult returns • Results shown below are for PIT estimates not corrected using PIT arrays at
hatchery traps (not all hatcheries have these)• Underestimation not consistent across hatchery stocks or return year
Estimating stock proportions with PBT
35
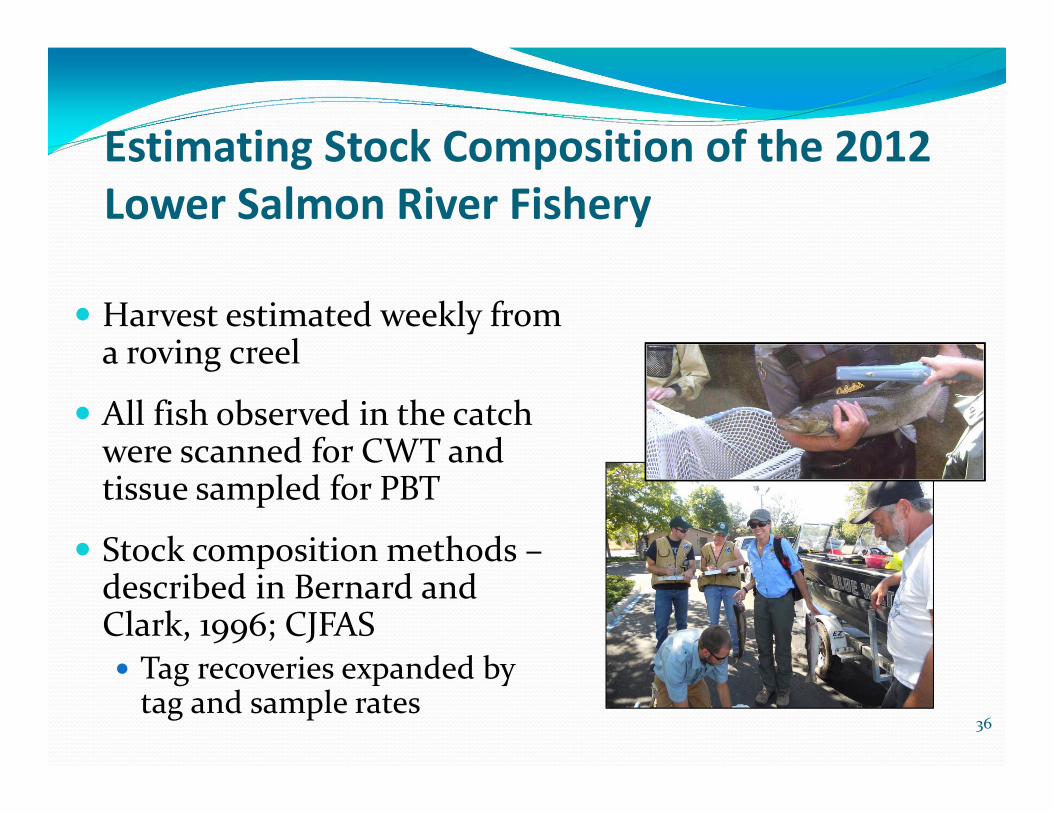
Estimating Stock Composition of the 2012 Lower Salmon River Fishery
Harvest estimated weekly from a roving creel
All fish observed in the catch were scanned for CWT and tissue sampled for PBT
Stock composition methods –described in Bernard and Clark, 1996; CJFAS Tag recoveries expanded by tag and sample rates
36
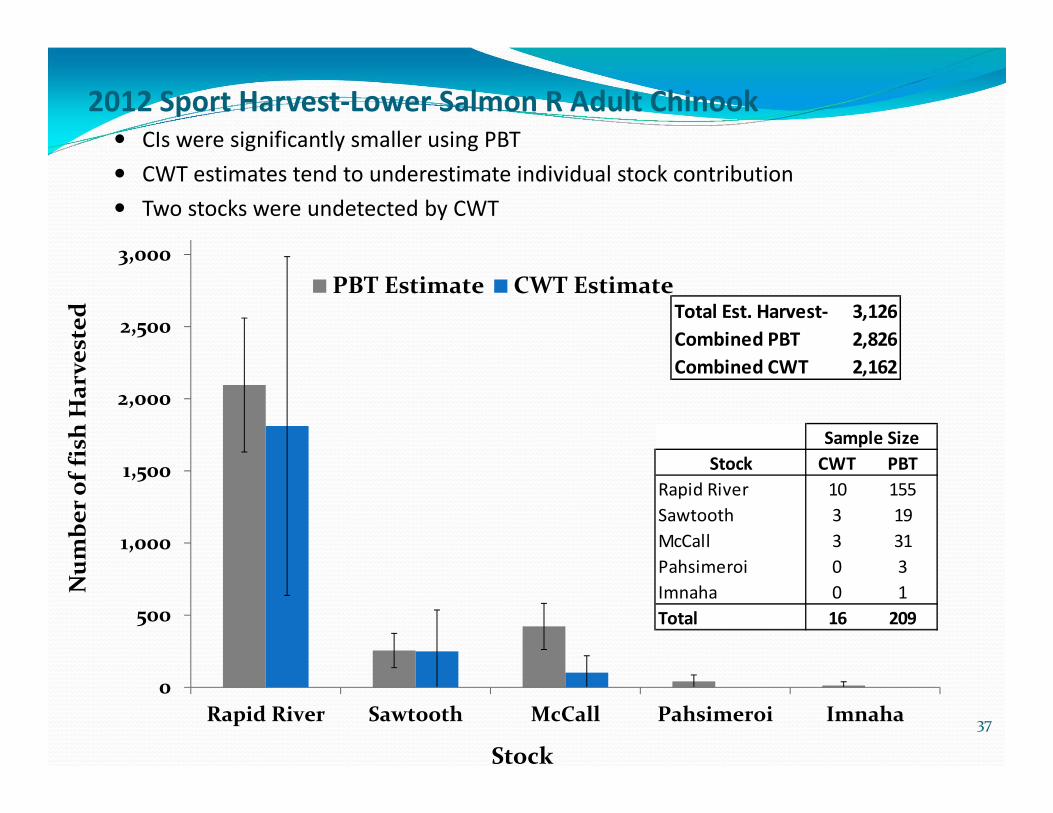
0
500
1,000
1,500
2,000
2,500
3,000
Rapid River Sawtooth McCall Pahsimeroi Imnaha
Num
ber o
f fish Har
vested
Stock
PBT Estimate CWT EstimateTotal Est. Harvest‐ 3,126Combined PBT 2,826Combined CWT 2,162
Stock CWT PBTRapid River 10 155Sawtooth 3 19McCall 3 31Pahsimeroi 0 3Imnaha 0 1Total 16 209
Sample Size
2012 Sport Harvest‐Lower Salmon R Adult Chinook CIs were significantly smaller using PBT CWT estimates tend to underestimate individual stock contribution Two stocks were undetected by CWT
37

Steelhead
38
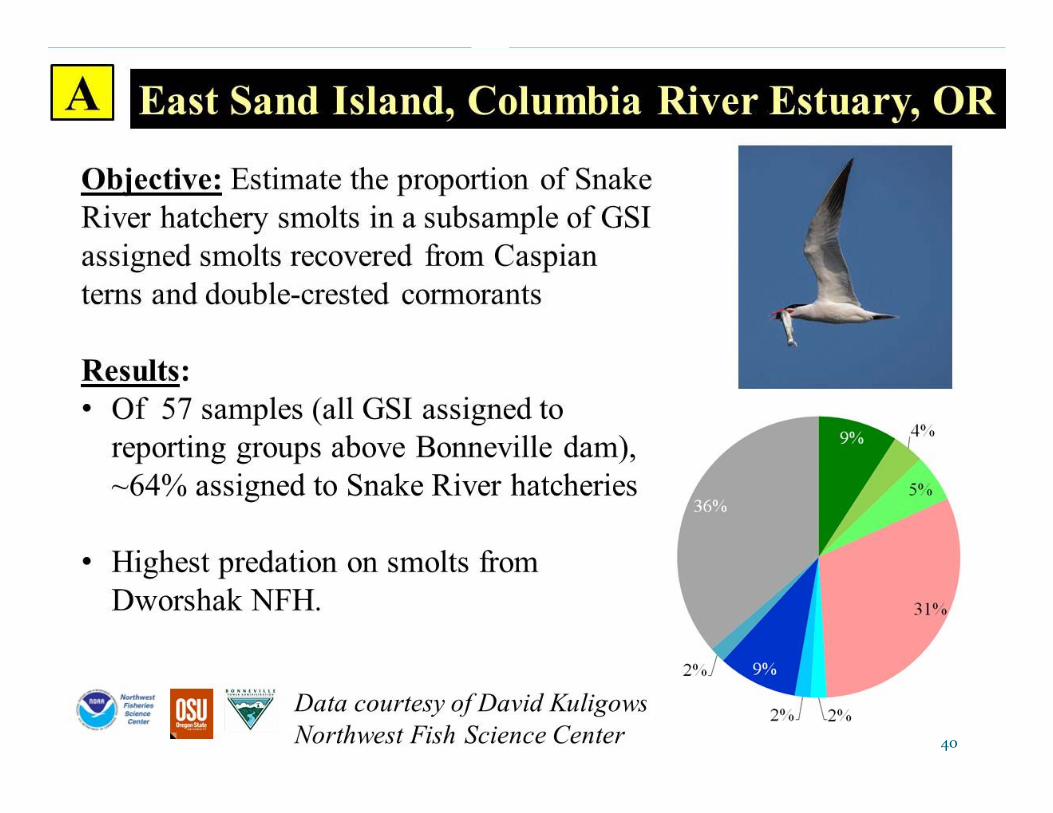
39
40
41

42
Alan’s Results….
43

44

45

46

48

49
50
Future:
51
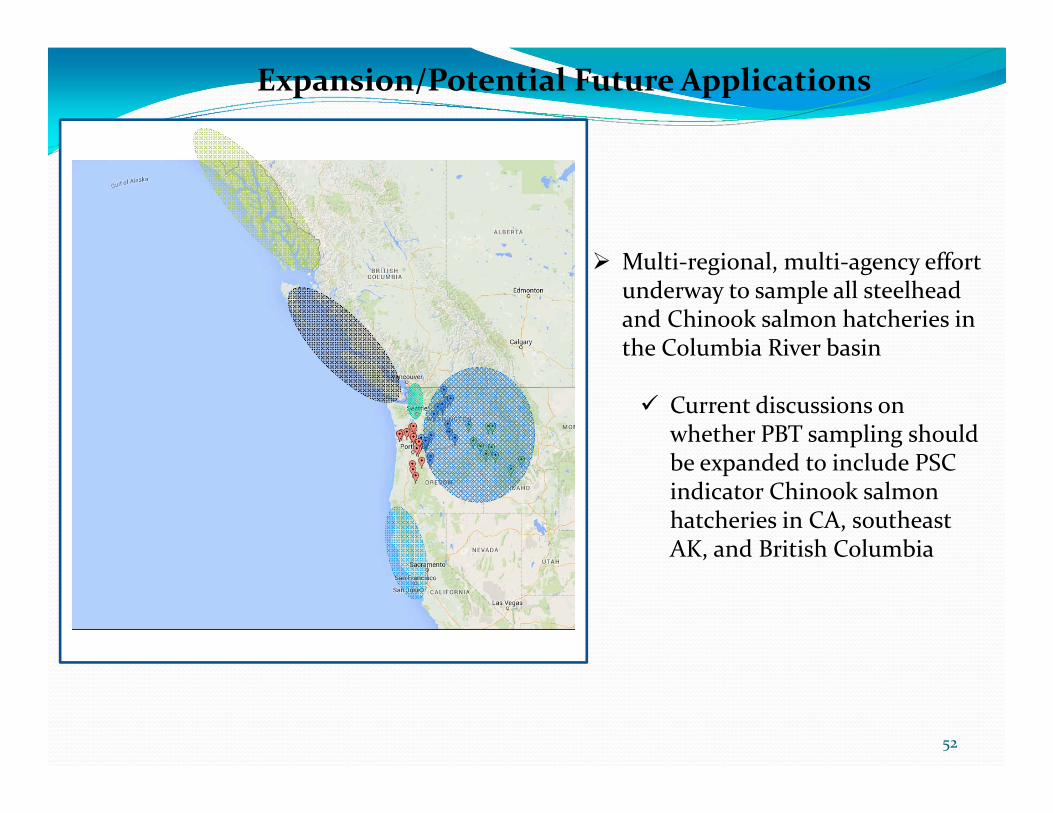
Multi‐regional, multi‐agency effort underway to sample all steelhead and Chinook salmon hatcheries in the Columbia River basin
Current discussions on whether PBT sampling should be expanded to include PSC indicator Chinook salmon hatcheries in CA, southeast AK, and British Columbia
Expansion/Potential Future Applications
52
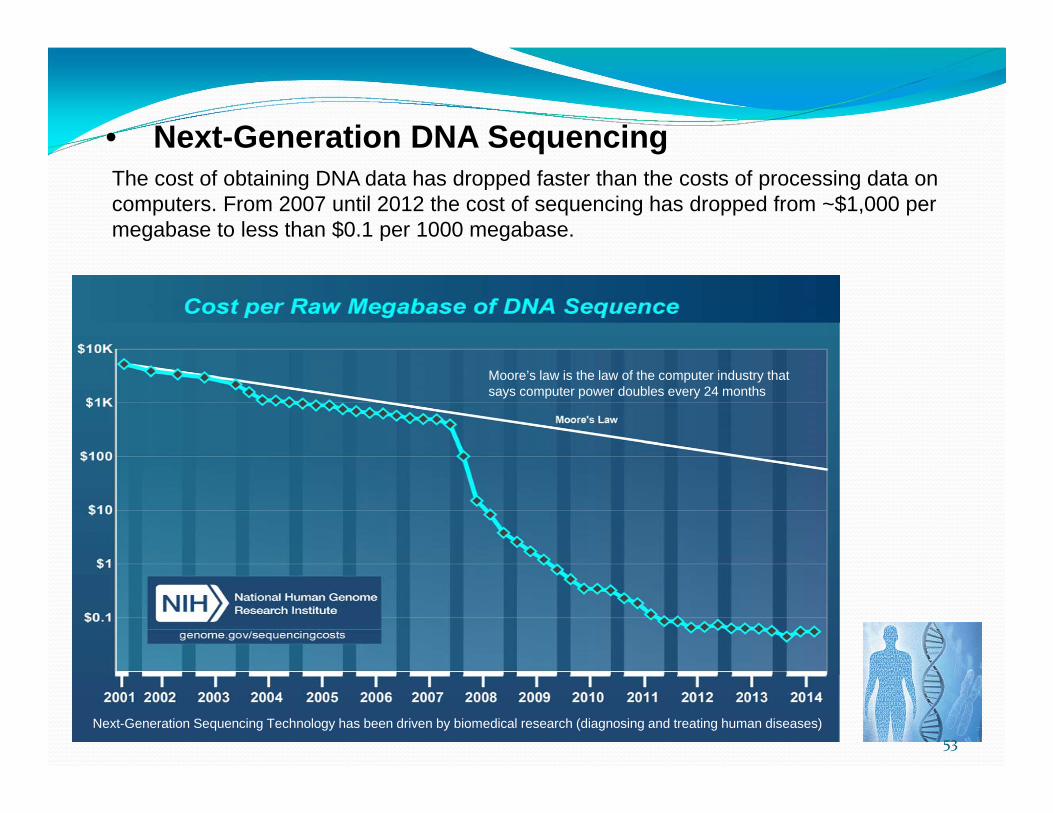
The cost of obtaining DNA data has dropped faster than the costs of processing data on computers. From 2007 until 2012 the cost of sequencing has dropped from ~$1,000 per megabase to less than $0.1 per 1000 megabase.
Moore’s law is the law of the computer industry that says computer power doubles every 24 months
• Next-Generation DNA Sequencing
Next-Generation Sequencing Technology has been driven by biomedical research (diagnosing and treating human diseases)53
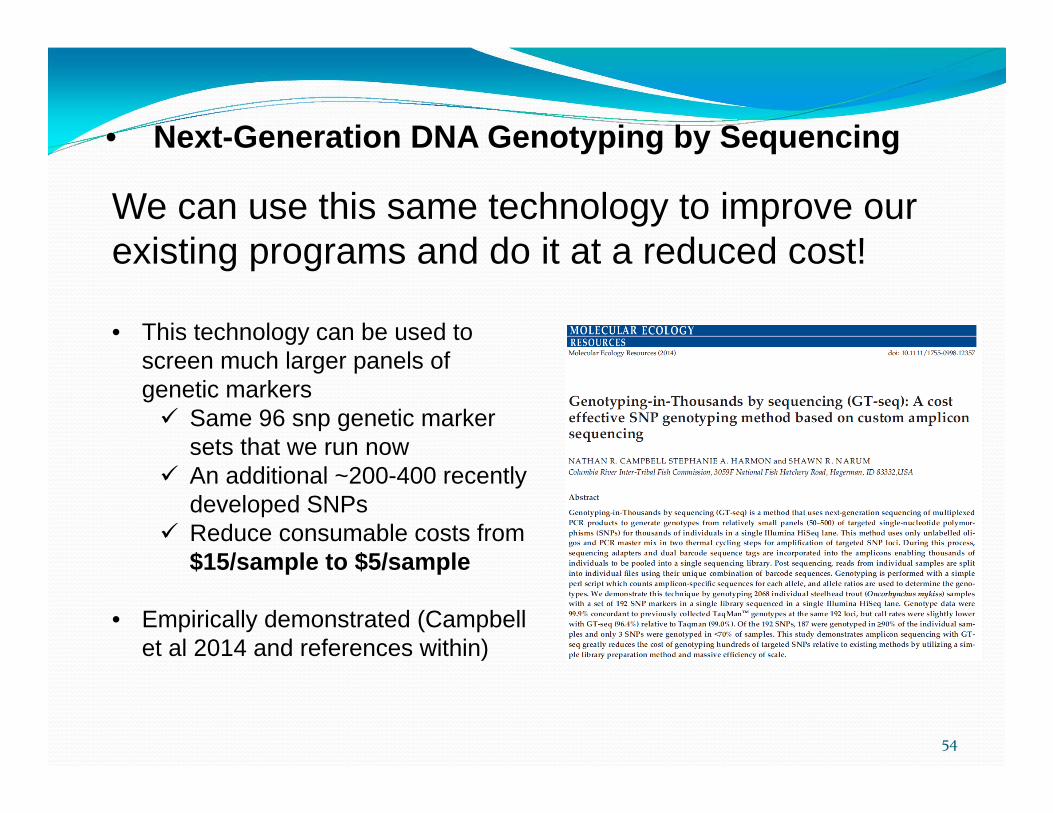
We can use this same technology to improve our existing programs and do it at a reduced cost!
• Next-Generation DNA Genotyping by Sequencing
• This technology can be used to screen much larger panels of genetic markers Same 96 snp genetic marker
sets that we run now An additional ~200-400 recently
developed SNPs Reduce consumable costs from
$15/sample to $5/sample
• Empirically demonstrated (Campbell et al 2014 and references within)
54
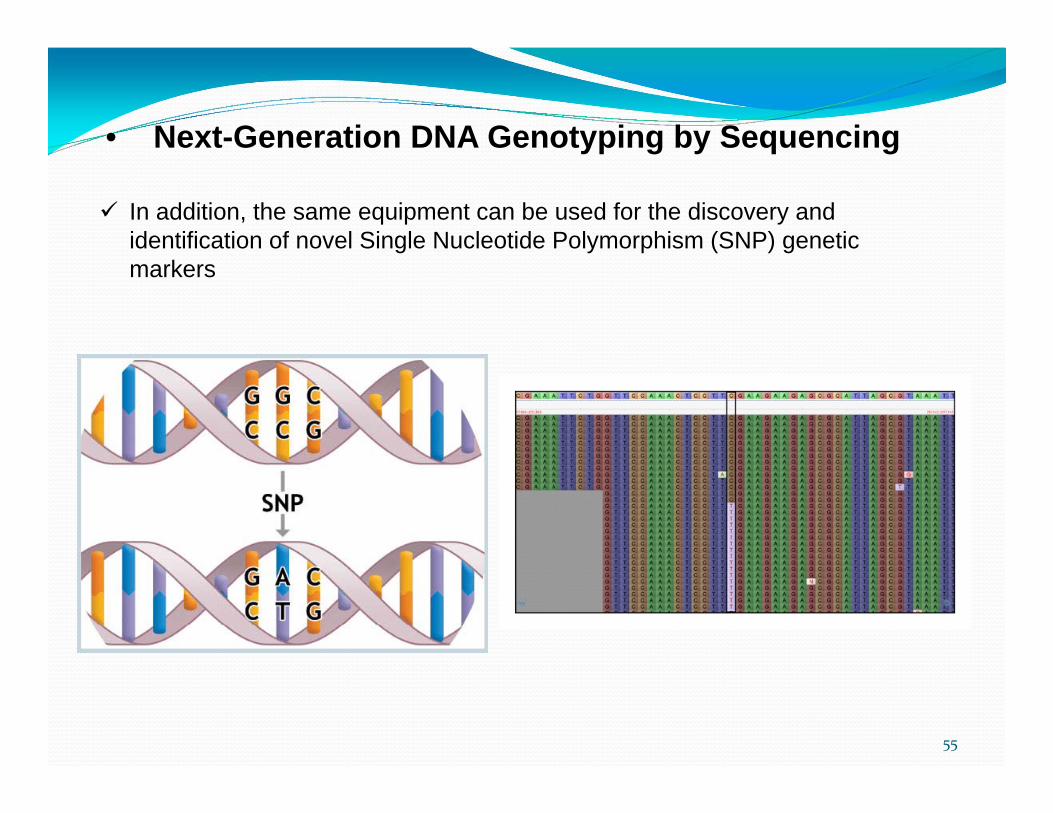
• Next-Generation DNA Genotyping by Sequencing
In addition, the same equipment can be used for the discovery and identification of novel Single Nucleotide Polymorphism (SNP) genetic markers
55
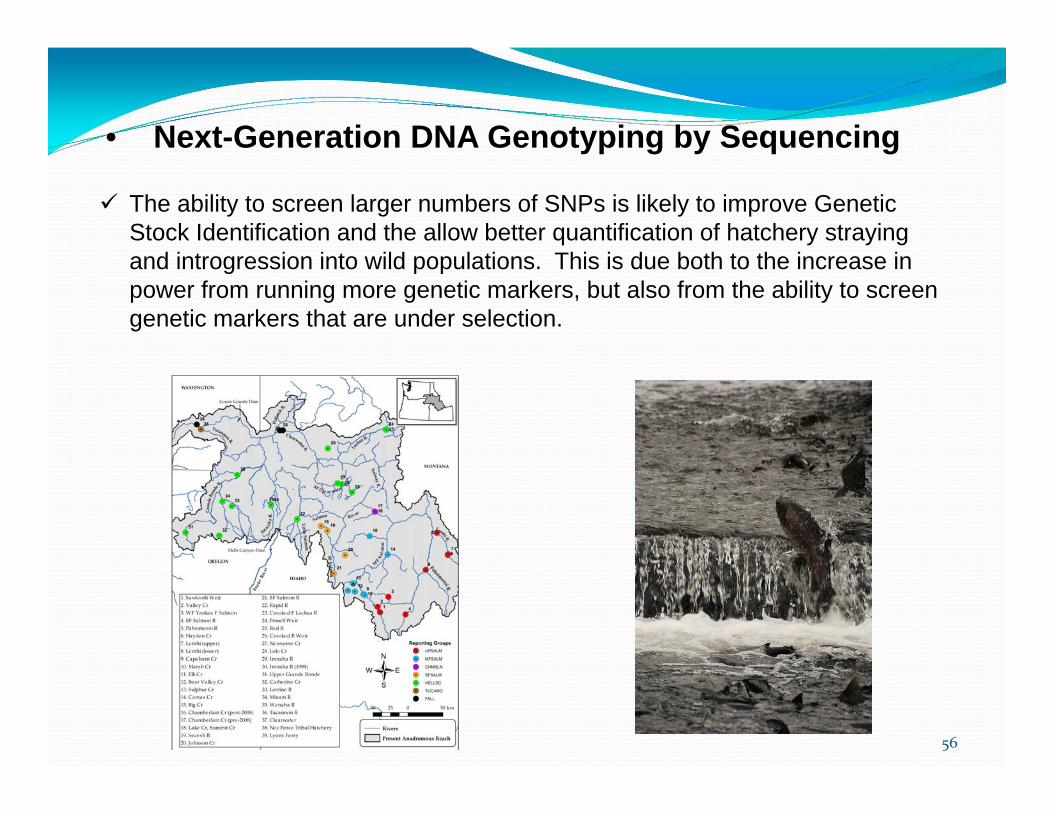
• Next-Generation DNA Genotyping by Sequencing
The ability to screen larger numbers of SNPs is likely to improve Genetic Stock Identification and the allow better quantification of hatchery straying and introgression into wild populations. This is due both to the increase in power from running more genetic markers, but also from the ability to screen genetic markers that are under selection.
56
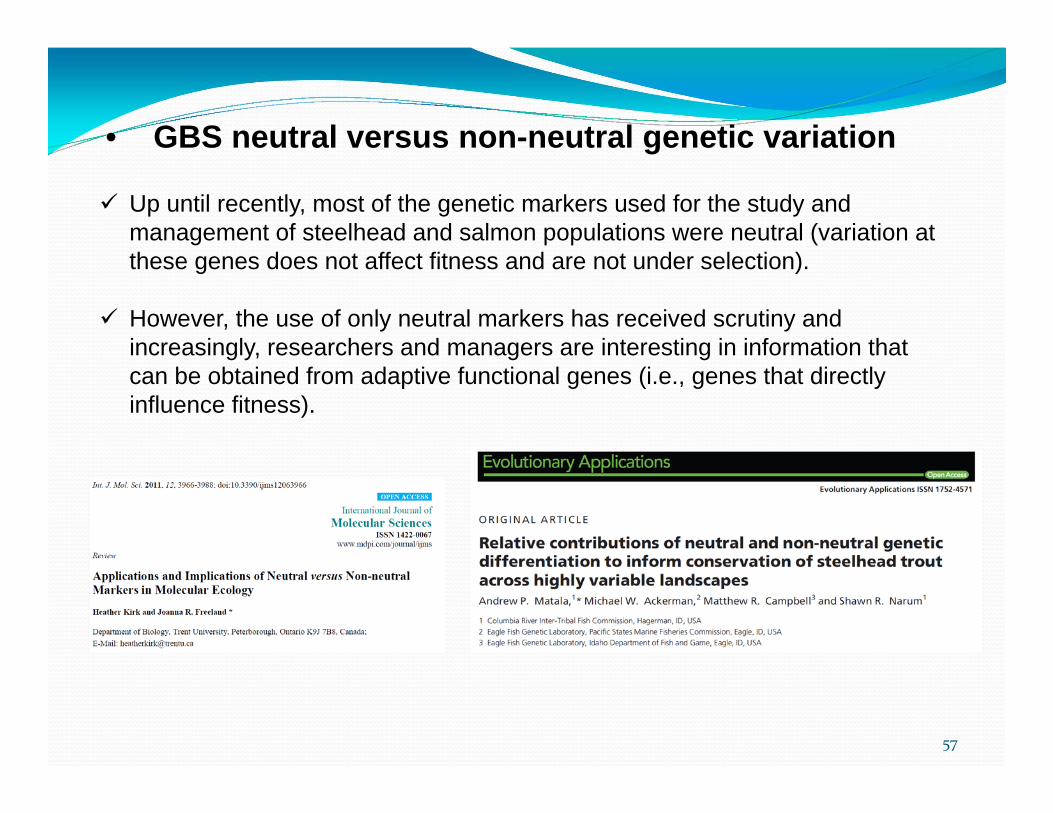
• GBS neutral versus non-neutral genetic variation
Up until recently, most of the genetic markers used for the study and management of steelhead and salmon populations were neutral (variation at these genes does not affect fitness and are not under selection).
However, the use of only neutral markers has received scrutiny and increasingly, researchers and managers are interesting in information that can be obtained from adaptive functional genes (i.e., genes that directly influence fitness).
57
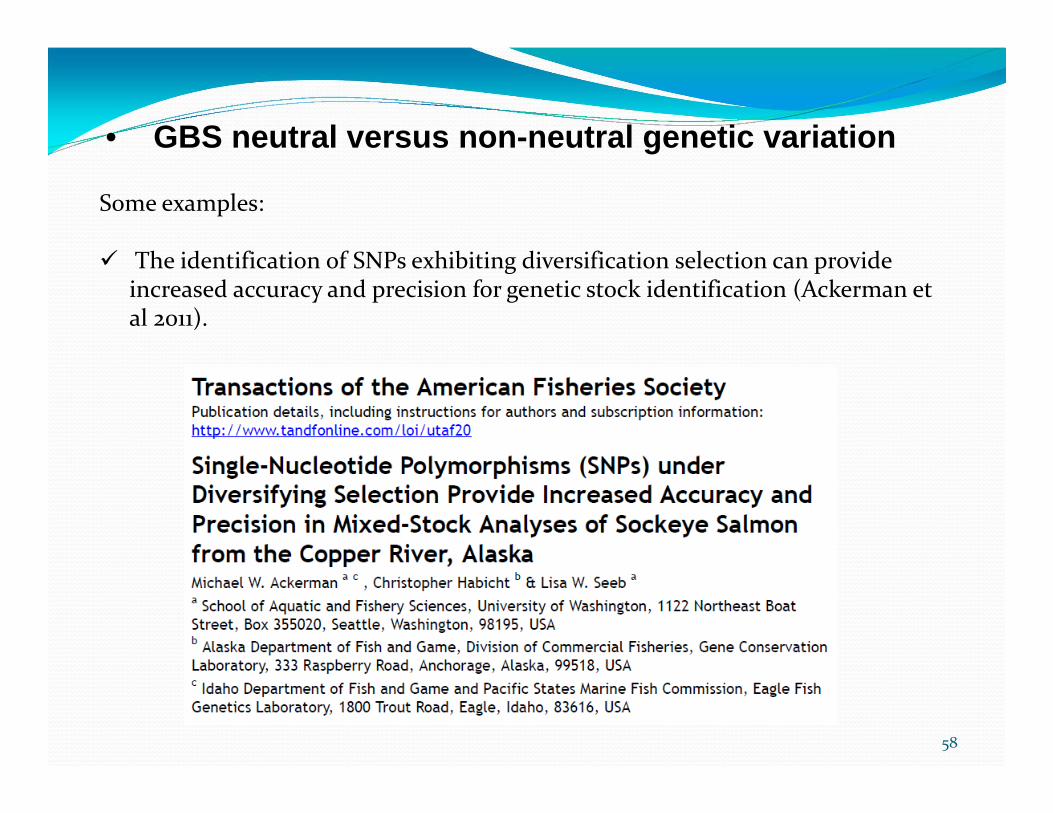
• GBS neutral versus non-neutral genetic variation
Some examples:
The identification of SNPs exhibiting diversification selection can provide increased accuracy and precision for genetic stock identification (Ackerman et al 2011).
58
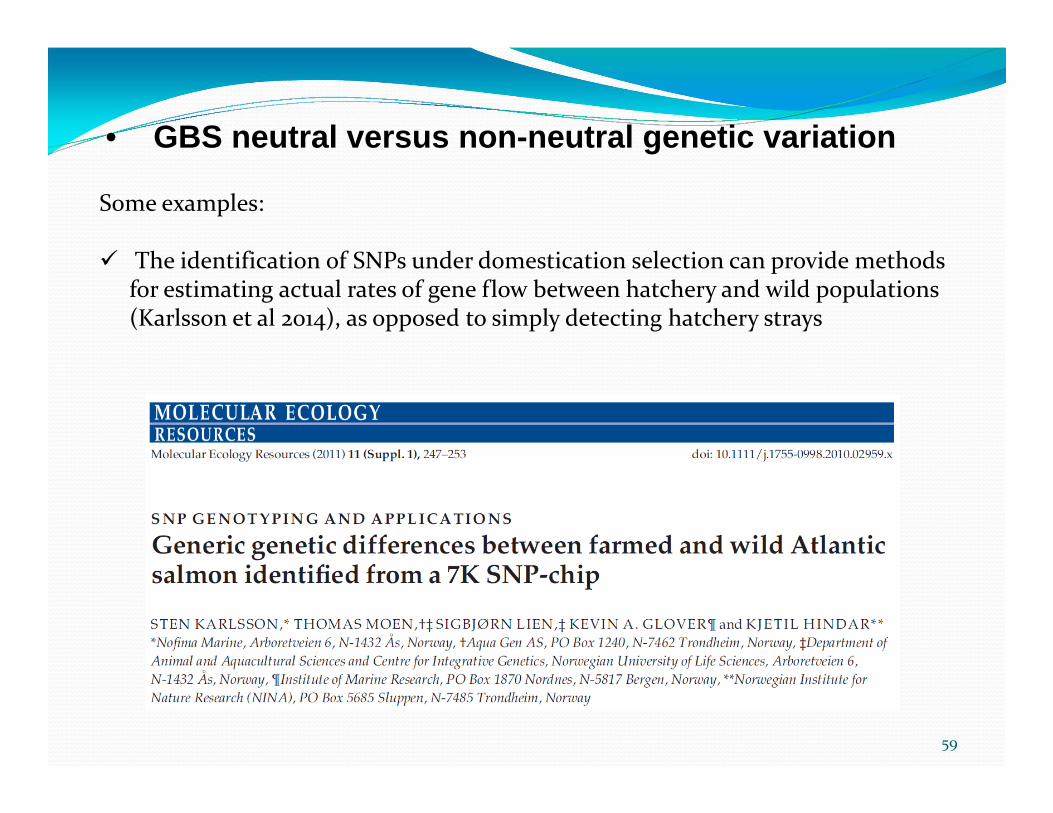
• GBS neutral versus non-neutral genetic variation
Some examples:
The identification of SNPs under domestication selection can provide methods for estimating actual rates of gene flow between hatchery and wild populations (Karlsson et al 2014), as opposed to simply detecting hatchery strays
59
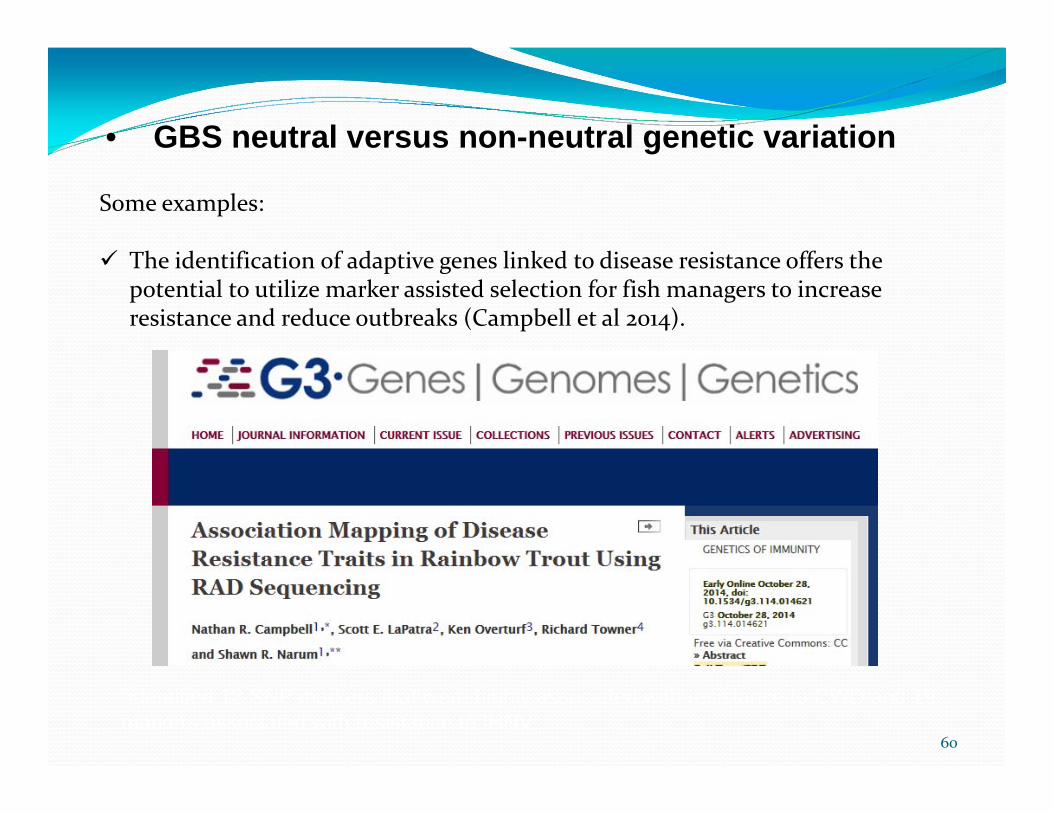
• GBS neutral versus non-neutral genetic variation
Some examples:
The identification of adaptive genes linked to disease resistance offers the potential to utilize marker assisted selection for fish managers to increase resistance and reduce outbreaks (Campbell et al 2014).
“identified 12 SNP markers that were highly associated with resistance to CWD and 19 markers associated with resistance to IHNV”
60
• IDFG recently received funding from PCSRF to purchase DNA sequencer (NextSeq 500) to perform GTseq for GSI and PBT projects and to identify new Single Nucleotide Polymorphism (SNP) genetic markers in salmon and steelhead.
•
61

Identify parents
Stock and age
Where it incubated
Where and under what conditions
it reared
Where and when it was
released
Ultimate goal:
Sawtooth Fish Hatchery
DietDiseaseRearing densityTemperature
This information could be available for all hatchery broodstock every year!
SEX
62
http://www.flickr.com/photos/natekay/4319654380/sizes/o/

Questions???
63