Embed Size (px)
Citation preview


For Review O
nly
1
Validation of Parentage-Based Tagging for hatchery 1
steelhead in the Snake River basin 2
3
Craig A. Steele 1,5
, Eric Anderson 2,6
, Michael W. Ackerman1, Maureen A. Hess
3, Nate 4
Campbell3, Shawn R. Narum
3, Matthew Campbell
4. 5
1 Pacific States Marine Fisheries Commission, Eagle Fish Genetics Laboratory, 1800 Trout Rd., 6
Eagle, ID 83616. 7
2 Fisheries Ecology Division, Southwest Fisheries Science Center, National Marine Fisheries 8
Service, 110 Shaffer Rd., Santa Cruz CA 95060. 9
3 Columbia River Inter-tribal Fisheries Commission, Hagerman Fish Culture Experiment Station, 10
3059-F National Fish Hatchery Rd., Hagerman, ID 83332. 11
4 Idaho Department of Fish and Game, Eagle Fish Genetics Laboratory, 1800 Trout Rd., Eagle, 12
ID 83616. 13
5 Corresponding author: email:[email protected] 14
6 Corresponding author for material in Supplement: email:[email protected] 15
Page 1 of 44
http://mc.manuscriptcentral.com/cjfas-pubs
Canadian Journal of Fisheries and Aquatic Sciences

For Review O
nly
2
Abstract 16
Parentage-based tagging (PBT) is a promising alternative to traditional coded-wire tag 17
(CWT) methodologies for monitoring and evaluating hatchery stocks. This approach involves the 18
genotyping of hatchery broodstock and uses parentage assignments to identify the origin and 19
brood year of their progeny. In this study we empirically confirm that fewer than 100 SNPs are 20
needed to accurately conduct PBT, we demonstrate that our selected panel of SNPs is 21
comparable in accuracy to a panel of microsatellites, and we verify that stock assignments made 22
with this panel match those made using CWTs. We also demonstrate that when sampling of 23
spawners is incomplete an estimated PBT-tagging rate for the offspring can also be predicted 24
with fewer than 100 SNPs. This study in the Snake River basin is one of the first large scale 25
implementations of PBT in salmonids and lays the foundation for adopting this technology more 26
broadly in the region, thereby allowing the unprecedented ability to mark millions of smolts and 27
an opportunity to address a variety of -based research and management questions. 28
Page 2 of 44
http://mc.manuscriptcentral.com/cjfas-pubs
Canadian Journal of Fisheries and Aquatic Sciences

For Review O
nly
3
Introduction 29
One of the main goals of fisheries managers is to track the movement and harvest of their 30
resource. This task can be challenging for species that inhabit expansive ranges or difficult-to-31
sample environments. It is even more difficult when the resource comprises mixed stocks that 32
are difficult to differentiate. The predominant approach to tracking has been to mark a portion of 33
a stock and then upon recapture use information from the tag to determine origin and age. There 34
are a variety of physical tags available to accomplish this goal, but the most widely utilized is the 35
coded-wire tag (CWT) which has been used by researchers and managers to monitor harvest and 36
escapement of salmonids in the Columbia River basin for over 40 years (Johnson 2004). 37
Despite the predominance of CWTs this technology has become limited in its ability to 38
provide sufficient data to managers. Originally, salmonids with CWTs also received an adipose 39
fin clip in many hatcheries. This externally-visible mark allowed CWT fish to be easily 40
identified and sampled in a fishery. Since the early 1990s, changes in marking policies resulted 41
in adipose clipping of most hatchery fish originating from the Columbia River basin; however, 42
few of these fish are also tagged with CWTs. This approach facilitated mark-selected fisheries, in 43
which only adipose-clipped hatchery fish can be harvested, but it inherently encumbered the 44
ability to recover CWTs. The resulting small sample size of recovered CWTs greatly reduces 45
confidence in estimates of stock contributions because the precision of these estimates are 46
directly related to the number of CWTs recovered (PSC 2005). 47
While the ability to collect sufficient data from CWTs has deteriorated, the demand for 48
data by managers has grown and comprehensive reviews of tagging methodologies have 49
suggested exploring alternative tagging technologies (PSC 2005; ISRP/ISAB 2009). One 50
Page 3 of 44
http://mc.manuscriptcentral.com/cjfas-pubs
Canadian Journal of Fisheries and Aquatic Sciences

For Review O
nly
4
emerging technology that may provide the same information as CWTs, but without the limitation 51
of small samples sizes, is parentage-based tagging (PBT; Anderson and Garza 2005). PBT 52
involves the annual genotyping of hatchery broodstock, creating a database of parental genotypes 53
from each hatchery. Progeny from any of these stocks can be non-lethally sampled at any life 54
stage and assigned back to their parents using parentage analysis, thus identifying their hatchery 55
of origin and brood year (i.e. age). One advantage PBT has over CWTs is an increase in the 56
number of tagged fish. When all parental broodstock are genotyped then every offspring is 57
genetically “tagged” and is similar to a 100% CWT rate, which is higher than the current basin-58
wide CWT tagging rates of 7–21% over the past ten years (RMIS; unpublished data). A 59
parentage-based approach also allows origin to be determined even when low levels of genetic 60
differentiation among stocks prohibits the use of other genetic identification techniques such as 61
genetic stock identification (Shaklee et al. 1999). While theoretically appealing (Anderson and 62
Garza 2005; 2006), PBT still needs to be empirically validated and large-scale evaluations of the 63
technology have been recommended (PSC 2005; PFMC 2008; ISAB/ISRP 2009). 64
PBT could be implemented with any variable molecular marker and microsatellites are 65
the marker of choice for many parental studies because of their variability (Webster and Reichart 66
2005). However, there is widespread interest in the use of single nucleotide polymorphisms 67
(SNPs), especially for large-scale parentage studies. SNPs are gaining favor because of the speed 68
at which they can be screened, their low frequency of genotyping errors, and the ease with which 69
they can be standardized among laboratories (Morin et al. 2004). The utility of SNPs for 70
parentage analysis has been explored (Krawczak 1999; Gill 2001; Glaubitz et al. 2003) and 71
modeling indicates PBT can be conducted with as few as 60–100 SNPs (Anderson and Garza 72
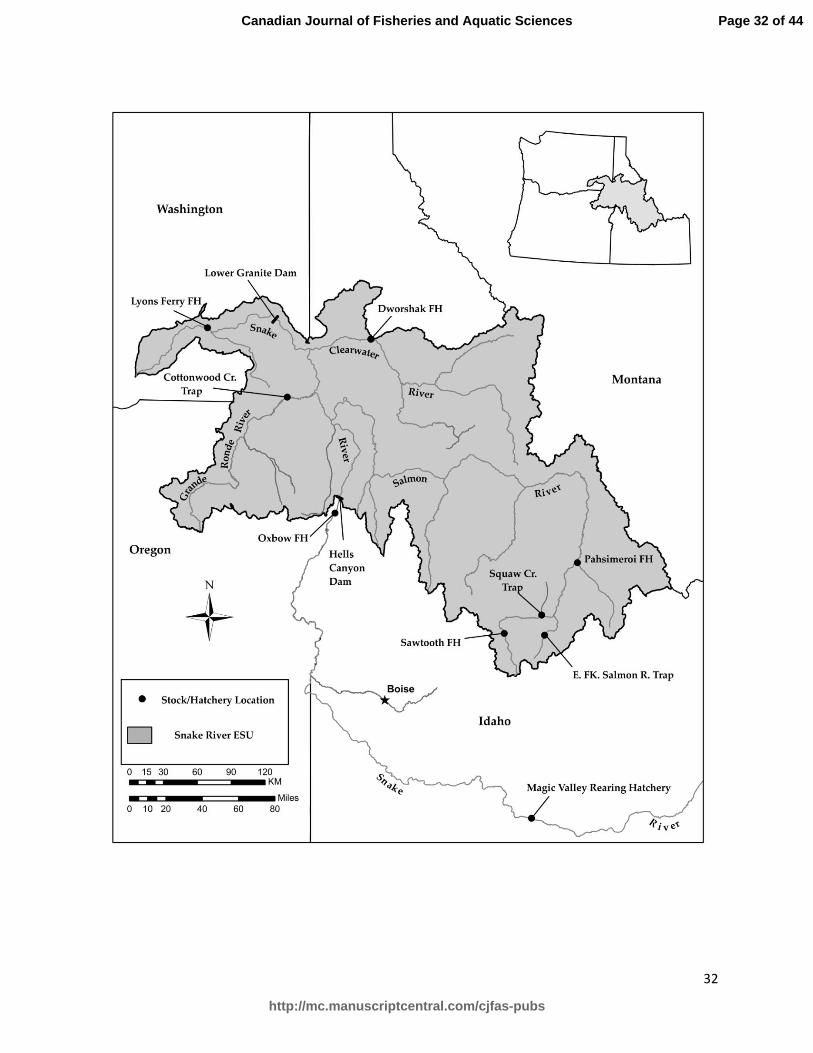
2006). Comparable accuracy of parentage assignments between SNPs and microsatellites has 73
Page 4 of 44
http://mc.manuscriptcentral.com/cjfas-pubs
Canadian Journal of Fisheries and Aquatic Sciences

For Review O
nly
5
been demonstrated using 80 SNPs within a single parental population (Hauser et al. 2011) but 74
empirically evaluating differently sized SNP panels is necessary, especially when PBT is to be 75
implemented across multiple populations, each with hundreds of contributing parents. 76
As with CWTs, PBT employs a stock-specific tagging rate—the fraction of fish whose 77
parents have been genotyped. In the controlled setting of a hatchery, the PBT tagging rate can be 78
well estimated by tracking the fraction of spawned males and females that are sampled and 79
genotyped. Outside the hatchery environment, the fraction of sampled parents is usually not 80
accurately known, making the estimation of a PBT tagging rate for wild stocks more difficult. 81
Despite preliminary efforts (Nielsen et al. 2001) and an implementation suitable for only small 82
populations (Koch et al. 2008), little progress has been made in the past decade on estimating 83
tagging rates from genetic data and most software packages require that it be known or assumed 84
(see Supplement 1). In sparsely-sampled parental populations, such as wild stocks, it will be 85
necessary to determine the tagging rate not just in terms of the probability that both of a fish’s 86
parents are sampled and genotyped, but also in terms of the probability that just one of its parents 87
was sampled and genotyped. 88
In this study we test a number of differently sized SNP panels to empirically determine a 89
sufficient number of SNPs needed to accurately conduct PBT across multiple hatchery steelhead 90
broodstocks within the Snake River basin (Figure 1). We compare assignment accuracy of our 91
selected panel of 95 SNPs to a panel of 17 microsatellites, and demonstrate that assignments 92
made with PBT match those using CWTs. Finally, we introduce a statistical framework to 93
estimate the PBT-tagging rate of offspring from an incomplete parental sample so as to employ a 94
PBT approach in wild populations. This work lays the foundation for the implementation of PBT 95
in the region and the opportunity to conduct future parentage-based projects. 96
Page 5 of 44
http://mc.manuscriptcentral.com/cjfas-pubs
Canadian Journal of Fisheries and Aquatic Sciences

For Review O
nly
6
Methods 97
Sampling of hatchery broodstock and known-origin juveniles 98
Beginning in 2008, fin tissue was sampled from nearly all adult steelhead broodstock 99
returning to Snake River hatcheries in Idaho, Oregon, and Washington (Steele et al. 2011). 100
Progeny from all hatchery steelhead spawned in Idaho are raised at rearing hatcheries in southern 101
Idaho. We tracked offspring from Idaho hatchery stocks to the Magic Valley rearing hatchery in 102
southern Idaho (Figure 1), where they were reared for a year prior to smoltification and released 103
for downstream migration. Offspring from the Cottonwood Creek stock were tracked to Lyons 104
Ferry hatchery in Washington State. Offspring from known crosses from the hatcheries were 105
sampled when they reached a size at which fin clips could be taken non-lethally (~100 mm TL). 106
Fin tissue was stored in 100% non-denatured ethanol prior to DNA extraction. 107
Laboratory procedures and marker selection 108
Genomic DNA extractions were carried out using a Nexttec™
DNA isolation kit 109
according to the manufacturer’s instructions (www.nexttec.biz). Adults and offspring samples 110
were genotyped with a panel of 188 SNPs (Table S1). The 188 steelhead SNP markers were 111
selected from available loci because previous genotyping indicated the assays were robust, 112
exhibited variation in hatchery steelhead populations in the Snake River basin, and conformed to 113
Hardy-Weinberg and linkage equilibrium expectations (Hess et al. 2011). 114
Prior to DNA amplification of SNP loci using primer-probe sets (fluorescent tags), an 115
initial polymerase chain reaction (PCR) “pre-amp” was implemented using whole genomic DNA 116
to jumpstart SNP amplification via increased copy number of the targeted DNA regions. The 117
PCR conditions for the pre-amp step were as follows: an initial mixing step of 95° C for 15 min, 118
Page 6 of 44
http://mc.manuscriptcentral.com/cjfas-pubs
Canadian Journal of Fisheries and Aquatic Sciences

For Review O
nly
7
followed by 14 cycles of 95° C for 15 seconds and 60° C for four minutes, ending with a final 4° 119
C holding step. Genotyping was performed using Fluidigm® 96.96 Dynamic Array
™ IFCs 120
(chips). For each genotyping run, 96 samples (including an extraction negative control, a PCR 121
negative control, and a PCR positive control) and 96 TaqMan® SNP assays were loaded onto the 122
96.96 chips. Sample cocktail and SNP assay cocktail recipes are available by request. Each 96.96 123
chip was pressurized to load the DNA and SNP assays into the array using a Fluidigm® IFC 124
Controller HX. Amplification of SNPs on the 96.96 chips were performed using either an 125
Eppendorf Mastercycle® thermal cycler (protocol: thermal mixing step of 50° C for 2 min, 70° C 126
for 30 min, and 25° C for 10 min, a hotstart of 50° C for 2 min and 95° C for 10 min, followed 127
by 50 cycles of 95° C for 15 sec and 60° C for 60 sec, and a final cool down step of 25° C for 10 128
min) or a Fluidigm® FC1
™ Fast-cycler (protocol: thermal mixing step of 70° C for 30 min and 129
25° C for 10 min, a hot-start of 95° C for 60 sec, followed by 50 cycles of 95° C for 5 sec and 130
58° C for 25 sec, and a final cool down step of 25° C for 10 sec). Chips were imaged on a 131
Fluidigm® EP1
™ system and analyzed and scored using the Fluidigm
® SNP Genotyping Analysis 132
software version 3.1.1. Genotypes were imported and organized in a Progeny database (Progeny 133
Software, South Bend, IN, USA). 134
Samples were also genotyped with a panel of 17 microsatellites (Table S2), 12 of which 135
are from a standardized series developed to address genetic questions for steelhead throughout 136
the Columbia River basin (Stephenson et al. 2008). Of the 17 loci, 15 (Ots100, Omy1001, Ogo4, 137
Omy07, Oke4, Oki23, Omy1011, Ots3, Ssa407, Ssa408, Ogo1a, Omy27, Oneu14, Oneu8, and 138
Ots4) were amplified in three multiplex PCRs (three runs on an ABI 3100 fragment 139
analyzer). The remaining two loci (Omy325 and Ssa289), were amplified in single PCR 140
reactions and were each run alone on an ABI 3100. Summaries of genetic diversity and 141
Page 7 of 44
http://mc.manuscriptcentral.com/cjfas-pubs
Canadian Journal of Fisheries and Aquatic Sciences

For Review O
nly
8
deviations from HWE for the sample groups were calculated using the Genalex 6.4 add-on for 142
Microsoft® Excel (Peakall and Smouse 2006). For significance testing a P-value threshold of 143
0.05 was used and then adjusted for multiple comparisons using the modified false discovery rate 144
(B-Y FDR) procedure as suggested by Narum (2006). 145
Assessment of SNP power 146
To select a SNP panel with a sufficient number of loci for future management and to 147
empirically test the predictions of Anderson and Garza (2006) that 60–100 SNPs provide 148
adequate power for PBT applications, we assessed the ability of SNP panels with variable 149
numbers of loci to correctly assign offspring of known parentage. We first ranked all 188 SNPs 150
based on their minor allele frequencies (MAF) by pooling all the parental populations, 151
computing MAFs for the pooled population and then ranking the SNPs by their MAF. We then 152
iteratively conducted parentage assignments using SNP panels with sequentially larger numbers 153
of the top-ranked SNPs (i.e. SNPs with the highest MAF). For our evaluation of differently-sized 154
SNP panels we chose the top ranked tiers of SNPs rather than randomly selecting loci because 155
this process more accurately reflects the process of SNP selection for parentage studies. When 156
presented with a large number of potential loci, one would not randomly select loci to construct a 157
panel but rather would select the most informative loci. 158
Parentage assignment using SNP genotypes was performed using the program SNPPIT 159
(Anderson 2010). While additional information such as gender of parental samples, cross-160
records, and spawn day could be included in SNPPIT to reduce the number parent-offspring trios 161
considered, we purposefully exclude this information from analysis in order to examine the 162
resolving ability of the SNP genotypes without this additional information. We allowed up to 163
10% missing genotype data for a sample within each 95 SNP panel before excluding the sample 164
Page 8 of 44
http://mc.manuscriptcentral.com/cjfas-pubs
Canadian Journal of Fisheries and Aquatic Sciences

For Review O
nly
9
from consideration in parentage. We used an estimated SNP genotyping error rate of 1%, or a per 165
allele rate of 0.5%. SNPPIT assesses the confidence of parentage assignments using a false 166
discovery rate (FDR) and we only accepted assignments with a very stringent FDR threshold of 167
less than 1%. 168
We quantified the false negative and the unsampled-parent false positive rate to evaluate 169
the assignment ability of the differently sized SNP panels. The false negative is the proportion of 170
offspring that do not assign to a parental pair despite its parental genotypes being present in the 171
dataset. The unsampled-parent false positive rate represents the proportion of offspring whose 172
parents were not sampled, but assign incorrectly to a non-parental pair. We evaluated it by 173
including samples of offspring originating from an unsampled broodstock at Lyons Ferry 174
Hatchery, WA (Figure 1). Because the Lyons Ferry offspring do not have parents in this dataset, 175
the assigned proportion of these offspring was used to calculate an unsampled-parent false 176
positive rate for the differently sized SNP panels. The test using Lyons Ferry fish, described 177
above, is intended to demonstrate that offspring from unsampled broodstock are not erroneously 178
assigned to fish in the parent data base. However, if the Lyons Ferry population has different 179
allele frequencies than the populations sampled for the parent data base then offspring from 180
Lyons Ferry are inherently less likely to misassign to any parents in the database than are fish 181
from the sampled populations and false positive rates derived from that this test might not 182
accurately reflect actual error rates. Thus, to further examine the potential for false positives in 183
our methodology, we attempted to assign the entire collection of 2008 broodstock genotypes (N 184
= 5,107 individuals) to the collection of adult genotypes from the 2009 broodstock (N = 5,672) 185
using a panel of 95 SNPs (see below) in SNPPIT. Because it is physically impossible for the 2009 186
Page 9 of 44
http://mc.manuscriptcentral.com/cjfas-pubs
Canadian Journal of Fisheries and Aquatic Sciences

For Review O
nly
10
broodstock to be parents of the previous year’s broodstock, any parental assignment in this 187
exercise would be known to be incorrect. 188
Assignment accuracy compared to microsatellites 189
Based on performance results of the differently sized SNP panels (below) we selected a 190
panel of 95 SNPs for use in subsequent analyses. In several cases, a SNP of lower rank based on 191
minor allele frequency was chosen instead of SNPs of higher rank (Table S1) because of their 192
higher quality and consistently scorable genotype plots. To compare the assignment accuracy of 193
the 95-SNP panel to that of microsatellites, we genotyped the known-origin offspring and their 194
parents with the panel of 17 microsatellites. Parentage assignments using microsatellite 195
genotypes were made with a maximum likelihood approach using CERVUS 3.0.3 (Kalinowski et 196
al. 2007; Marshall et al. 1998) and assuming unknown gender of the parental samples to allow 197
for unrestricted matings. We determined accuracy for parental assignments of the offspring by 198
comparing the assignments to stock and parental cross records recorded at the hatchery. An 199
average error rate of 0.44% (a per allele rate of 0.0022 was used in SNPPIT) was calculated for the 200
95 SNPs by re-genotyping a subset of samples at the 95 loci. 201
Comparison of known-origin CWT adults in the Snake River harvest program 202
In addition to collecting genotypes for the pilot study described above, we sampled and 203
genotyped the majority of steelhead broodstock spawned during 2008 in the Snake River basin 204
(Steele et al. 2011). A portion of offspring from these broodstocks was marked with CWT 205
(~13%). During the winter of 2010/2011 creel clerks from the Lower Snake River Compensation 206
Plan’s (LSRCP) harvest monitoring program recovered snouts from CWT-detected adults 207
captured in the Snake River fishery. Because hatchery steelhead typically smolt after one year in 208
Page 10 of 44
http://mc.manuscriptcentral.com/cjfas-pubs
Canadian Journal of Fisheries and Aquatic Sciences

For Review O
nly
11
freshwater, any offspring from the 2008 brood year that returned as one-ocean adults during this 209
season are expected to be genetically tagged while all older adult offspring would be precluded 210
from PBT assignment. Snouts were sent to the Idaho Fish and Game CWT Lab in Nampa, Idaho 211
for processing. During CWT removal and decoding, muscle tissue was sampled from a sub-212
sample of 186 snouts for DNA extraction and genotyping with the 95 SNP panel using the same 213
procedures described previously. Parentage assignment and hatchery of origin were determined 214
using PBT conducted in SNPPIT. Hatchery origin based on CWTs was then compared to stock 215
assignment inferred from the PBT approach. 216
Estimating unsampled parents in wild populations 217
To assess the potential of using multilocus SNP genotypes for PBT applications in wild 218
populations, we propose a statistical framework for estimating the PBT tagging rate of offspring 219
under incomplete sampling scenarios when only a subset of parental pairs is sampled or when 220
only a proportion of a single parental gender is sampled (see Supplement 1). We used this 221
framework to estimate the tagging rate in simulated data. Specifically, we simulated a population 222
of 500 males and 500 females that mated monogamously to produce 1000 offspring. The 223
expected number of offspring produced by each pair of parents was equal, and the actual number 224
was multinomially distributed. Using this single simulated population the PBT-tagging rate for 225
offspring was estimated. The software program SNPPIT was developed for large-scale PBT 226
projects using SNP markers (Anderson 2010) and uses a false discovery rate correction to 227
account for scenarios in which the tagging rate is not known (as will be the case in most mixed-228
stock samples). However, SNPPIT’s current formulation allows neither an accurate estimate of the 229
false negative rate, nor identification of single parents of offspring (it focuses entirely on parent 230
pairs). SNPPIT focuses exclusively on assignment to parent pairs, but for PBT to be useful in wild 231
Page 11 of 44
http://mc.manuscriptcentral.com/cjfas-pubs
Canadian Journal of Fisheries and Aquatic Sciences
For Review O
nly
12
populations it will require that the PBT-tagging rate be estimated in terms of 1) the fraction of 232
offspring with both parents in the database, gpair, 2) the fraction of offspring whose father is in 233
the data base, but not their mother, gS, 3) the fraction of offspring whose mother is in the data 234
base but not their father, gD, and 4) the fraction of offspring with neither parent in the data base, 235
gnone = 1 - gpair - gS - gD. In each simulation, among the parental generation 100 complete mated 236
pairs were randomly sampled (true gpair = 100/500 = 0.2). An additional 50 males were sampled 237
without their mates (true gS = 50/500 = 0.1) and 25 females were sampled without their mates 238
(true gD = 25/500 = 0.05). All 1000 offspring were sampled. Our method was used to estimate 239
gpair, gS, and gD using L SNP loci, each with a minor allele frequency of 0.25. At each value of L 240
between 15 and 100, 10 separate data sets were simulated and analyzed. 241
242
Results 243
Assessment of SNP power 244
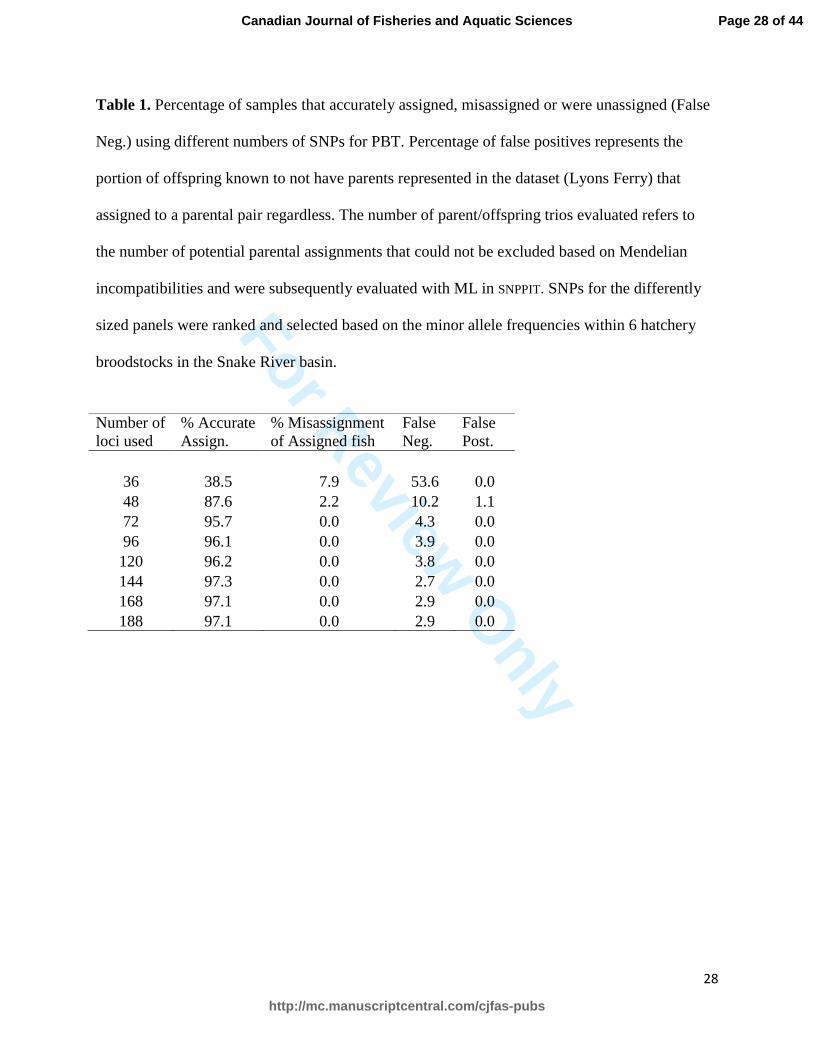
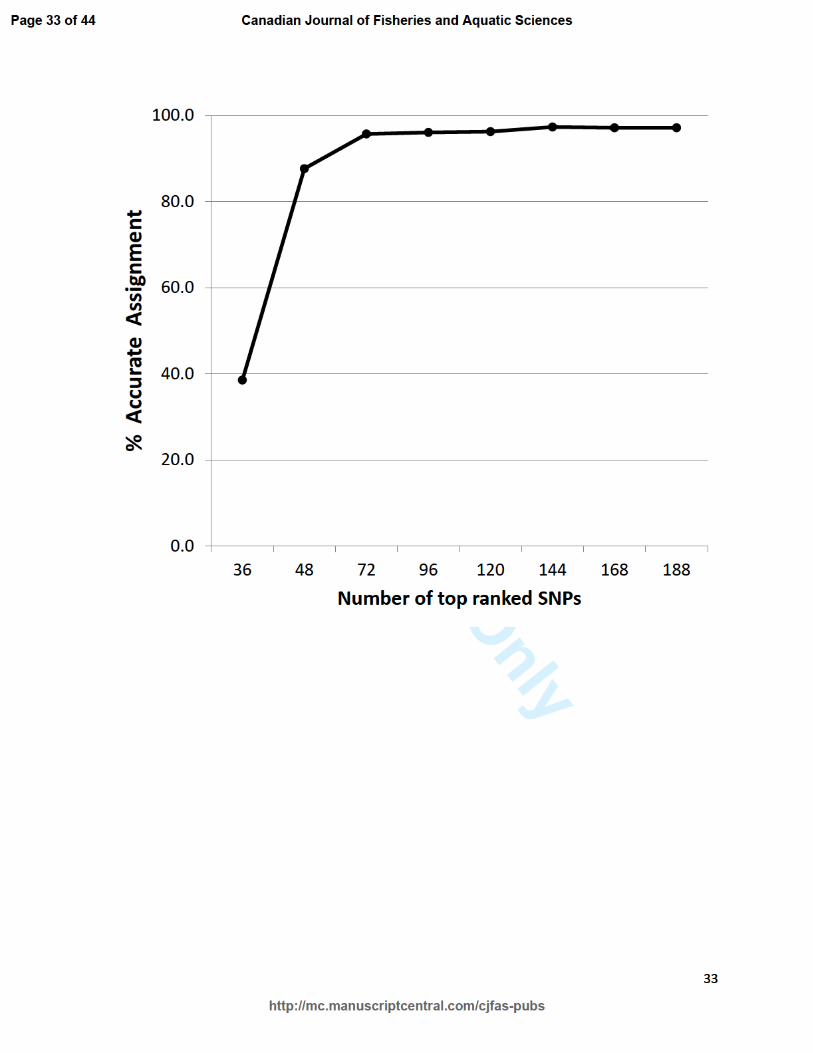
Assignment rates of known-origin offspring to correct stock were above 95% for all sizes 245
of SNP panels except the smallest panels of 36 and 48 SNPs (Figure 2; Table 1). Correct 246
assignment rates remained high as the number of SNPs decreased until a threshold of too few 247
SNPs was reached after which the correct assignment rate dropped sharply. No offspring were 248
misassigned to an incorrect stock except when the two smallest panels were used. The false 249
negative rate (offspring sampled that should have assigned to a parental pair, but did not) 250
increased gradually as fewer SNPs were used in the parentage assignments, but increased sharply 251
only with the two smallest SNP panels (Table 1). There were no false positives from the Lyons 252
Ferry offspring except with the 48-SNP panel when one Lyons Ferry offspring was assigned to a 253
Page 12 of 44
http://mc.manuscriptcentral.com/cjfas-pubs
Canadian Journal of Fisheries and Aquatic Sciences

For Review O
nly
13
parental pair. Additionally, no false positives were observed when we attempted to assign the 254
2008 broodstock to the 2009 broodstock using the 95-SNP panel despite a total of >17x109 255
possible trios being evaluated. 256
Assignment accuracy of SNPs compared to microsatellites 257
Assignment accuracy to correct stock and parentage was similar between microsatellites 258
and SNPs (Table 2). For microsatellites, a high proportion of genotyped offspring (98.6%) 259
received assignment to a hatchery stock and in every case the stock assignment was correct. 260
None of the Lyons Ferry offspring received parentage assignment using the 17 microsatellites. 261
Assignment rates to the parental pairs identified in cross records ranged from a low of 70.7% for 262
Dworshak-origin offspring to a high of 98.9% for Grande Ronde-origin offspring. For SNPs, 263
97.3% of the genotyped offspring received an assignment to a hatchery stock and in every case 264
the assignment was also to the correct stock. None of the Lyons Ferry offspring assigned to a 265
stock with the 95 SNP panel. Assignment rates to the parental pair identified in the cross records 266
ranged from a low of 71.0% for Dworshak-origin offspring to a high of 98.9% for Grande 267
Ronde-origin offspring. The average mismatch rate of SNP alleles between parents and assigned 268
offspring was 0.15 mismatches/assignment. 269
Assignment accuracy of PBT compared to CWTs 270
A total of 61 hatchery fish (1-ocean age) sub-sampled from the Idaho steelhead fishery in 271
the winter of 2010/2011 had CWTs indicating their origin was from a Snake River basin 272
hatchery broodstock sampled for PBT in 2008. Of those 61 samples, 59 were successfully 273
genotyped and 52 (88.1%) were assigned with PBT to a hatchery stock (Table 3). Recovery 274
information for CWTs in this fishery indicated that ~14% of harvested fish had CWTs (Curet et 275
Page 13 of 44
http://mc.manuscriptcentral.com/cjfas-pubs
Canadian Journal of Fisheries and Aquatic Sciences

For Review O
nly
14
al. unpublished report). All assignments made to stock with PBT matched the stock identified 276
with CWT. Based on CWT information, the seven samples that did not assign using PBT were 277
comprised of five fish originating from the Oxbow Hatchery and two from the Dworshak 278
Hatchery. 279
Direct estimation of tagging rate with genetic data 280
In all, we analyzed 860 simulated data sets. It is clear that given the conditions of our 281
simulations, gpair can be estimated with high accuracy using 40 or more SNPs (Figure 3a). In 282
similar fashion, gS and gD can be accurately estimated with 60 or more SNPs (Figure 3b and 3c). 283
In fact, with just 40 or 60 SNPs, the observed distribution of estimates falls largely within the 284
95% confidence intervals that would be expected of the estimates when parentage is 285
unambiguously known. 286
Discussion 287
Implementing PBT is likely to provide managers a more efficient, versatile, and powerful 288
tool for tagging hatchery fish than CWTs. Tagging with PBT carries a number of advantages 289
over using CWTs. Most prominently, because every juvenile is tagged when its two parents are 290
genotyped, the cost of PBT is low enough to tag nearly every hatchery offspring compared to a 291
typical rate of 5-10% with physical CWTs. Higher tagging rates allow larger numbers of PBT-292
tagged fish to be recovered than fish with CWTs which can improve error associated with stock 293
assessments. Additionally, pedigrees generated through genotyping multiple generations of 294
broodstock provide opportunities for addressing management issues associated with relative 295
reproductive success of hatchery fish, trait heritability of broodstocks, and reforms in hatchery 296
management. Few programs have initiated PBT as a large-scale tagging strategy. Our study 297
Page 14 of 44
http://mc.manuscriptcentral.com/cjfas-pubs
Canadian Journal of Fisheries and Aquatic Sciences

For Review O
nly
15
provides one of the first empirical validations of PBT using SNPs, resulting in the unprecedented 298
ability to mark millions steelhead smolts and provide opportunities for parentage-based research. 299
Assessment of SNP power 300
Because of the advantages SNPs have over other molecular markers (Morin et al. 2004) 301
they are becoming the marker of choice for large-scale collaborative parentage projects. The 302
number of SNPs needed to sufficiently conduct PBT was theoretically estimated to be 60–100 303
(Anderson and Garza 2006). This guideline was met with skepticism by some agencies (PSC 304
2005), perhaps because the bialleleic nature of SNPs inherently reduces the resolving power of a 305
single SNP compared to that of a multi-allelic microsatellite. We empirically confirmed 306
Anderson and Garza’s (2006) theoretical prediction and demonstrate that accurate parentage 307
(>95%) can be achieved with as few as 72 SNPs (Figure 2). Even though 72 SNPs provided 308
accurate parentage assignments a panel of 95 SNPs for subsequent analyses was selected because 309
the current technology of the 96.96 Fluidigm® allows up to 96 SNPs on a single run and also 310
should provide an abundance of power in the most limiting scenarios. The minimum number of 311
SNPs needed for accurate parentage assignment will depend on the minor allele frequency 312
(MAF) of the markers such that fewer loci with higher MAFs can provide comparable power as 313
more loci with lower MAFs (Anderson Garza 2006). There is also a diminishing return between 314
the resolving power of a SNP locus and increases in MAF such that more power is gained as 315
MAF increases from 0.2 to 0.3 than from 0.4 to 0.5 (Anderson and Garza 2006). Our final panel 316
of 95 SNPs has relatively high MAFs ranging from 0.155 to 0.486 (Table S1). This suggests that 317
if these markers are used for PBT with additional hatchery stocks in the Columbia River Basin 318
the number of SNPs needed to accurately conduct PBT can remain the same even if MAF is 319
reduced at some loci within other populations. 320
Page 15 of 44
http://mc.manuscriptcentral.com/cjfas-pubs
Canadian Journal of Fisheries and Aquatic Sciences

For Review O
nly
16
Comparison with microsatellites 321
When study systems transition from microsatellites to SNPs it is often desirable or 322
necessary to confirm similar results between the two kinds of markers and to demonstrate the 323
resolving power of SNPs (Hauser et al. 2011). Assignment results between microsatellites and 324
SNPs were comparable but not identical and inconsistencies appear to be due to differences in 325
the genotyping completeness of samples by the marker sets. While every attempt was made to 326
sample all broodstock contributing to the study, we suspect there were unsampled parents. Non-327
assignment of offspring is attributed to either an unsampled parent or incomplete genotypes from 328
a sampled parent. For microsatellites and SNPs, respectively, 544 and 540 of the 558 offspring 329
received a PBT assignment resulting in a false negative rate of 2.5% and 3.2% for each dataset. 330
The false negative values are low but are also inflated because ungenotyped parents preclude 331
some assignments. Unsampled or ungenotyped parents within the SNP dataset likely accounts 332
for the two unassigned Sawtooth Hatchery offspring and for six of the nine unassigned E. Fk. 333
Salmon offspring (Table 2). The remaining three unassigned E. Fk. Salmon offspring had an 334
FDR above 1% (but below 5%). Unassigned offspring from the Cottonwood Creek stock and 335
Pahsimeroi Hatchery were traced to parents that had been sampled but failed to be genotyped. 336
When complete SNP genotypes for parents and offspring were available then a correct 337
assignment was always made, indicating that the assignment ability of PBT with SNPs is 338
ultimately restricted by completeness of sampling and genotyping the parental broodstock, and 339
not by limitations in the molecular markers or algorithms in the assignment software. 340
For both marker sets a proportion of parentage assignments did not match the cross 341
records recorded at the hatchery. However, all parentage assignments using SNPs matched those 342
made with microsatellites even when the parentage assignment did not match the cross records. 343
Page 16 of 44
http://mc.manuscriptcentral.com/cjfas-pubs
Canadian Journal of Fisheries and Aquatic Sciences

For Review O
nly
17
This suggests that some hatchery-recorded cross information was incorrect and the error was 344
identified using parentage assignments with the independent datasets. Despite potential for such 345
errors, a record of individual parents used in spawning can be valuable information to include in 346
parentage assignments by reducing the number of possible parental combinations and thereby 347
reducing computation time. In general, including additional data, such as cross information or 348
sex of parental samples, can improve parental assignments if a small number of loci is used or if 349
the loci have low power of resolution. However, if these data are not recorded accurately it can 350
have an adverse effect by inadvertently precluding true parents from being considered as 351
possible mates, thereby decreasing the number of correct assignments. Initial analyses of our 352
data confirmed this result and showed a slightly higher proportion of unassigned offspring (data 353
not shown) when cross information of the spawners, along with errors, was included. Even if 354
cross information is not used to help with parentage assignments, the basic information about 355
broodstock samples (‘spawn year’ and ‘hatchery stock’) can help to greatly reduce the number of 356
possible parental matings in a large multi-year PBT dataset. Another strategy to reduce the 357
number of potential crosses is “day-binning” (Anderson and Garza 2005) which is much less 358
error prone than recording specific cross information. Collecting cross information from 359
broodstock remains important because it allows both members of a parental pair to be identified 360
when a genotype is missing from one parent. In such cases single-parentage assignment can 361
identify the parent for which data has been collected and cross can identify the other parent with 362
which it was mated. 363
Comparison with CWTs 364
All PBT assignments matched the stock identified with CWT but not all CWT fish 365
received a PBT assignment (Table 3). Non-assignment of two CWT samples from Dworshak 366
Page 17 of 44
http://mc.manuscriptcentral.com/cjfas-pubs
Canadian Journal of Fisheries and Aquatic Sciences

For Review O
nly
18
Hatchery is likely due to unsampled parental broodstock. A portion of the parental crosses were 367
not sampled for PBT in brood year 2008, yielding an estimated PBT-tagging rate of 85.1% for 368
the stock overall. If we assume equal production of offspring across families we would expect to 369
assign 85.1% of Dworshak-origin offspring to their two parents. We had a slightly lower, but not 370
significantly different (binomial test, P = 0.79), assignment rate of 77.8% for Dworshak-origin 371
offspring and conclude that the non-assigned fish were offspring from the unsampled Dworshak 372
parents. The non-assignment of five CWT samples from Oxbow Hatchery resulted in an 373
assignment rate (66.7%) lower than the expected PBT tagging rate (93.3%) for this stock. 374
Currently, SNPPIT is only able to assign offspring if both parents’ genotypes have been collected. 375
To determine if at least one parent was included in the dataset, the unassigned Oxbow Hatchery-376
origin offspring were analyzed separately in CERVUS using exclusion based procedures. Single 377
parent assignments resulted in assigning 14 of the 15 samples and an assignment rate of 93.3%, 378
identical to the expected PBT tagging rate. Of the five previously unassigned Oxbow Hatchery 379
offspring, four received a single-parent assignment with no allelic mismatches and one 380
individual was assigned equally to two different parents with no allelic mismatches. A check of 381
the Oxbow Hatchery cross records indicated that all four of the parents were crossed with one 382
parent that did not genotype. In addition, one of the two possible parents identified for the final 383
individual was also crossed with a parent that failed to be genotyped. This indicates that the 384
initial assignment rate for Oxbow Hatchery-origin samples was largely driven by the failure to 385
genotype one individual from a parental pair and not by unsampled broodstock or analytical 386
limitations of the software. It also emphasizes the need to develop methods that account for the 387
pattern of mating and variability in individual reproductive success when estimating uncertainty 388
in the PBT-tagging rate. 389
Page 18 of 44
http://mc.manuscriptcentral.com/cjfas-pubs
Canadian Journal of Fisheries and Aquatic Sciences

For Review O
nly
19
Estimating the PBT-tagging rate with genetic data 390
PBT was originally proposed as an alternative tagging methodology that provides 391
advantages over CWTs (Anderson and Garza 2005). Our results from PBT assignments 392
demonstrate the same stock assignments as known-origin CWT fish but the results also highlight 393
current software limitations. Genotypes from just a single parent will not result in a parent-394
offspring assignment in SNPPIT. Although CERVUS is capable of making single-parentage 395
assignments, the computational time required for such an analysis on a large multi-year PBT 396
dataset can be impractical. Given some improvements in software, however, it may become 397
possible to conduct PBT on wild-spawning stocks if an ample, albeit unknown, fraction of the 398
parents are sampled. For example, if a wild population can be non-lethally sampled at a weir or 399
by sampling carcasses after spawning, and a representative sample of outmigrating smolts was 400
genotyped and used to estimate the fraction of sampled parents, then that fraction, along with the 401
known number of sampled fish or carcasses, would yield an estimate of the abundance of 402
spawners. This would also yield a PBT-tagging rate for the wild stock, which might make it 403
possible to use PBT to estimate the number of wild fish harvested in a fishery. 404
One way to deal with unassigned offspring due to missing parental genotypes is to 405
estimate the PBT-tagging rate and then use it to extrapolate assignments to the total number of 406
unassigned fish in a sample. A PBT tagging rate can be estimated by multiplying the proportions 407
of successfully genotyped male and female broodstock. Using this simple approach for 408
calculating the proportion of tagged individuals is only possible if the proportion of successfully 409
genotyped adults is known. This is often the case within hatchery settings, but PBT can also be 410
applied to wild populations in which the proportion of sampled adults is not known with great 411
certainty. Our simulations reveal that with sufficient numbers of SNPs (i.e. >40) there is 412
Page 19 of 44
http://mc.manuscriptcentral.com/cjfas-pubs
Canadian Journal of Fisheries and Aquatic Sciences

For Review O
nly
20
substantial power to estimate the fraction of offspring with both parents or with just a single 413
parent in a parental database. This suggests that, with carefully designed sampling protocols and 414
advances in statistical tools, PBT may be successfully applied to the management of wild salmon 415
populations (though doing so may require intensive sampling of adults and possibly of some 416
outmigrating juveniles). 417
The simulations also demonstrate that a mixture formulation, like that proposed in 418
Supplement 1, to infer parentage with PBT would likely carry a number of advantages over the 419
allocation method implemented in the current version of SNPPIT. For example, with only 40 420
markers and a false negative rate of 10%, the method of Anderson and Garza (2006) would 421
assign roughly 10% of offspring to the wrong pair of parents. However, despite that level of 422
inaccuracy in individual assignment, the tagging rate can still be estimated accurately. A similar 423
phenomenon is seen in mixed stock analysis of fisheries whereby individual fish cannot all be 424
assigned to their population without error, but the fraction of fish in the sample from any one 425
population can still be estimated accurately (Koljonen et al. 2005). This suggests that it is 426
worthwhile to develop software that can handle large scale parentage analysis for PBT in the 427
context of a mixture model that allows the estimation of tagging rates. Ideally, such an analysis 428
would be combined with genetic stock identification using baseline samples from different wild 429
populations, so that parentage assignments, population assignments, tagging rates, and mixture 430
proportions can be simultaneously estimated using all the genotyped individuals, regardless if 431
their parents appear in the parent database. A number of challenges will need to be addressed, in 432
particular the problems posed by non-parental relatives and by the scale of PBT datasets, and 433
will require novel solutions. 434
Implementation of PBT 435
Page 20 of 44
http://mc.manuscriptcentral.com/cjfas-pubs
Canadian Journal of Fisheries and Aquatic Sciences

For Review O
nly
21
This project validates the utility of SNPs in large-scale PBT studies and demonstrates the 436
ability of PBT to accurately identify origin of individual anadromous hatchery fish. We 437
demonstrated the feasibility of annually sampling, inventorying, and genotyping thousands of 438
broodstock to create large-scale parental baselines. We empirically demonstrated that fewer than 439
100 SNPs can be used to accurately assign parentage and that accuracy using SNPs is 440
comparable to a panel of microsatellites. In addition, we demonstrated that using these markers 441
in PBT provides the same stock assignments as CWTs, and showed that this panel of SNPs has a 442
very low rate of misassignment. In situations where a proportion of the parental population is not 443
sampled, such as in wild populations, we show that a PBT tagging rate can be estimated. This 444
work lays the foundation for the creation of parental baselines for hatchery steelhead stocks in 445
the Snake River basin and the utilization of these baselines in answering a variety of parentage-446
based research questions. We estimate the implementation of a PBT program in the Snake River 447
basin has resulted in the genetic tagging of ~95% of steelhead and Chinook in the Snake River 448
Basin, which corresponds to ~67% of outmigrating hatchery steelhead smolts and ~55% of 449
returning hatchery adults in the entire Columbia River basin. As a result, fish management 450
agencies are continuing annual sampling and genotyping of broodstock throughout the Snake 451
River basin with plans to expand throughout the rest of the Columbia River, thereby creating 452
parental databases which will allow for tagging and parentage analysis of hatchery steelhead 453
originating from the region. 454
The implications of this study have clear utility for managing and monitoring hatchery 455
stocks within the region. Screening of additional hatchery stocks with this SNP panel is 456
underway within the Columbia basin to determine its applicability in a larger and comprehensive 457
Columbia River basin-wide PBT program. The results also have implications beyond the study 458
Page 21 of 44
http://mc.manuscriptcentral.com/cjfas-pubs
Canadian Journal of Fisheries and Aquatic Sciences

For Review O
nly
22
system and indicate that any large-scale captive rearing program can use a moderately sized 459
panel of SNPs to evaluate the contribution of hatchery efforts to harvest or supplementation 460
programs or to trace an aquaculture product through production, even when multiple closely 461
related broodstocks have contributed. The statistical framework described in Supplement 1, 462
which lays the foundation for applying a PBT-style approach in wild populations, also has far-463
reaching applications and the potential for implementation in wild populations of fish or non-fish 464
species. PBT clearly has the potential to provide many opportunities for addressing management 465
and research questions. 466
Acknowledgements 467
Primary funding for this research came from the Bonneville Power Administration (Project 468
#2010-031-00). Additional financial support was provided by the Pacific Coast Salmon 469
Recovery Fund and the Idaho Power Company (Project #01608SC). We thank the many hard-470
working staff and technicians for extracting, genotyping, and organizing the thousands of 471
samples that made this research possible: C. Camacho, D. Kovis (who also created Figure 1), J. 472
McCane, L. Redfield, and T. Vanderwey from the Pacific States Marine Fisheries Commission at 473
the Eagle Fish Genetics Laboratory as well as S. Harmon, T. Jacobsen, A. Matala, L. Maxwell, 474
M. Moore, V. Morman, and J. Stephenson from the Columbia River Inter-tribal Fisheries 475
Commission at the Hagerman Fish Genetics Laboratory. Thanks also to L. Clifford at IDFG for 476
formatting the manuscript and to B. Wright at Idaho Dept. of Fish and Game for providing CWT 477
data. Special thanks to all IDFG, ODFW, WDFW, USFWS, NPT staff and volunteers who 478
helped collect genetic samples from hatchery broodstock. 479
Page 22 of 44
http://mc.manuscriptcentral.com/cjfas-pubs
Canadian Journal of Fisheries and Aquatic Sciences
For Review O
nly
23
References 480
Abadía-Cardosa A., Clemento, A.J., and Garza, J.C. 2011. Mol. Ecol. Res., 11(Suppl. 1):31–481
49. doi: 10.1111/j.1755-0998.2010.02971.x. 482
Aguilar, A., and Garza, J.C. 2008. Isolation of 15 single nucleotide polymorphisms from 483
coastal steelhead, Oncorhynchus mykiss (Salmonidae). Mol. Ecol. Res., 8(3): 659–662. 484
doi: 10.1111/j.1471-8286.2007.02038.x. 485
Anderson, E.C., and Garza, J.C. 2005. A description of full parentage genotyping. Report 486
submitted to the Pacific Salmon Commission, Vancouver, British Columbia. 11p. 487
http://swfsc.noaa.gov/publications/FED/00675.pdf. 488
Anderson, E.C., and Garza, J.C. 2006. The power of single-nucleotide polymorphisms for 489
large-scale parentage inference. Genetics, 172(4):2567–2582. doi: 490
10.1534/genetics.105.048074. 491
Anderson, E.C. 2010. Computational algorithms and user-friendly software for parentage-492
based tagging of Pacific salmonids. Final report submitted to the Pacific Salmon 493
Commission's Chinook Technical Committee (US Section). 46 p. 494
http://swfsc.noaa.gov/textblock.aspx?Division=FED&ParentMenuId=54&id=16021. 495
Brunelli, J.P., Thorgaard, G.H., Leary, R.F., Dunnigan, J.L. 2008. Single-Nucleotide 496
Polymorphisms Associated with Allozyme Differences between Inland and Coastal Rainbow 497
trout. Trans. Am. Fish. Soc. 137:1292–1298. doi: 10.1577/T07-190.1. 498
Castaño-Sanchez, C., Smith, T. P.L., Wiedmann, R.T., Vallejo, R.L., Salem, M., Yao, J., 499
Rexroad, C.E. 2009. Single nucleotide polymorphism discovery in rainbow trout by deep 500
Page 23 of 44
http://mc.manuscriptcentral.com/cjfas-pubs
Canadian Journal of Fisheries and Aquatic Sciences

For Review O
nly
24
sequencing of a reduced representation library. BMC Genomics 10: 559–567. 501
doi:10.1186/1471-2164-10-559 502
Campbell, N. and Narum, S. 2009a. Characterization of 22 novel single nucleotide 503
polymorphism markers in steelhead and rainbow trout. Mol. Ecol. Res. 9(1):318–322. 504
doi: 10.1111/j.1755-0998.2008.02376.x. 505
Campbell, N. and Narum, S. 2009b. Identification and characterization of heat shock 506
response related single nucleotide polymorphisms in O. mykiss and O. tshawytscha. In: 507
Molecular Ecology Resources Primer Development Consortium et al. Mol. Ecol. Res. 9: 508
1460–1559 509
Curet, T., Esselman, B., White, M., Biggs, M., Hansen, J., and Beller, B. Idaho Department of 510
Fish and Game Fishery Management Annual Report – Salmon Region 2011. Unpublished 511
Report. 512
Gill, P. 2001. An assessment of the utility of single nucleotide polymorphisms (SNPs) for 513
forensic purposes. Int. J. Leg. Med. 114(4–5): 204–210. doi: 10.1007/s004149900117. 514
Glaubitz, J.C., Rhodes, O.E. and Dewoody, J.A. 2003. Prospects for inferring pairwise 515
relationships with single nucleotide polymorphisms. Mol. Ecol. 12(4): 1039–1047. doi: 516
10.1046/j.1365-294X.2003.01790.x 517
Hauser L., Baird, M., Hilborn, R., Seeb, L.W., Seeb, J.E. 2011. An empirical comparison of 518
SNPs and microsatellites for parentage and kinship assignment in a wild sockeye salmon 519
(Oncorhynchus nerka) population. Mol. Ecol. Res. 11 (Suppl 1): 150–161. 520
Hess, J., Campbell, N., Matala, A., Narum, S. 2011. Annual Report: Genetic Assessment of 521
Page 24 of 44
http://mc.manuscriptcentral.com/cjfas-pubs
Canadian Journal of Fisheries and Aquatic Sciences

For Review O
nly
25
Columbia River Stocks. U.S. Dept. of Energy Bonneville Power Administration Report 522
#2008-907-00. 523
Independent Scientific Review Panel and Independent Scientific Advisory Board 524
(ISRP/ISAB). 2009. Tagging Report – A comprehensive review of Columbia River Basin fish 525
tagging technologies and programs. ISRP/ISAB 2009-1. Northwest Power and Conservation 526
Council, Portland Oregon. 527
Johnson, K.J. 2004. Regional Overview of Coded Wire Tagging of Anadromous Salmon and 528
Steelhead in Northwest America. Regional Mark Processing Center, Pacific States Marine. 529
Kalinowski, S.T., Taper, M.L., and Marshall, T.C. 2007. Revising how the computer program 530
Cervus accommodates genotyping error increases success in paternity assignment. Mol. Ecol. 531
16(7):1099–1106. doi: 10.1111/j.1365-294X.2007.03089.x. 532
Koch, M., Hadfield, J.D., Sefc, K.M., Sturmbauer, C. 2008. Pedigree reconstruction in wild 533
cichlid fish populations. Mol. Ecol. 17:4500-4511. doi: 10.1111/j.1365-294X.2008.03925.x 534
Koljonen, M.J., Pella, J., Masuda, M. 2005. Classical individual assignments versus mixture 535
modeling to estimate stock proportions in Atlantic salmon (Salmon salar) catches from DNA 536
microsatellite data. Can. J. Fish. Aquat. Sci. 62(9) 2143–2158. doi: 10.1139/F05-128. 537
Krawczak, M. 1999. Informativity assessment for biallelic single nucleotide polymorphisms. 538
Electrophoresis, 20(8): 1676–1681. doi: 10.1002/(SICI)1522-539
2683(19990101)20:8<1676::AID-ELPS1676>3.0.CO;2-D. 540
Marshall, T.C., Slate, J., Kruuk, L.E.B., and Pemberton, J.M. 1998. Statistical confidence for 541
likelihood-based paternity inference in natural populations. Mol. Ecol. 7(5):639–655. doi: 542
Page 25 of 44
http://mc.manuscriptcentral.com/cjfas-pubs
Canadian Journal of Fisheries and Aquatic Sciences
For Review O
nly
26
10.1046/j.1365-294x.1998.00374.x. 543
Morin, P.A, Luikart, G., Wayne, R.K., et al. 2004. SNPs in ecology, evolution and 544
conservation. Trends Ecol. Evol. 19(4):208–216. doi: 10.1016/j.tree.2004.01.009. 545
Narum, S.R. 2006. Beyond Bonferroni: Less conservative analyses for conservation genetics. 546
Conserv. Genet. 7(5):783–787. doi: 10.1007/s10592-005-9056-y. 547
Nielsen, R., Mattila, D.K., Clapham, P.J., Palsboll, P.J. 2001. Statistical approaches to 548
paternity analysis in natural populations and applications to the North Atlantic humpback 549
whale. Genetics, 157(4):1673–82. 550
Pacific Fishery Management Council (PFMC). 2008. Research and data needs. 551
http://www.pcouncil.org/wp-content/uploads/Res_Data_Needs_2008_Final_OCT08.pdf. 552
Pacific Salmon Commission (PSC). 2005. Report of the Expert Panel on the Future of the 553
Coded Wire Tag Program for Pacific Salmon. 2005. Pacific Salmon Comm. Tech. Rep. No. 554
18. http://www.rmpc.org/files/psctr18_CWT_Expert_Panel_Report.pdf 555
Peakall, R., and Smouse, P.E. 2006. GENALEX 6: genetic analysis in Excel. Population 556
genetic software for teaching and research. Mol. Ecol. Notes, 6(1):288–295. doi: 557
10.1111/j.1471-8286.2005.01155. 558
RMIS (Regional Mark Information System Database [online database]). Continuously since 559
1977. Portland (OR): Regional Mark Processing Center, Pacific States Marine Fisheries 560
Commission. http://www.rmpc.org. 561
Shaklee, J.B., Beacham, T.D., Seeb, L., and White, B.A. 1999. Managing fisheries using 562
genetic data: case studies from four species of Pacific salmon. Fish. Res. 43(1999):45–78. 563
Page 26 of 44
http://mc.manuscriptcentral.com/cjfas-pubs
Canadian Journal of Fisheries and Aquatic Sciences

For Review O
nly
27
doi: 10.1016/S0165-7836(99)00066-1. 564
Sprowles, A.E., Stephens, M.R., Clipperton, N.W., and May, B.P. 2006. Fishing for SNPs: A 565
Targeted Locus Approach for Single Nucleotide Plymorphism Discovery in Rainbow Trout. 566
Trans. Am. Fish. Soc. 135(6): 1698–1721. doi:10.1577/T05-291.1. 567
Steele, C.A., Campbell, M.R., Ackerman, M., McCane, J., Hess, M., Campbell, N., and 568
Narum, S. 2011. Parentage Based Tagging of Snake River hatchery steelhead and Chinook 569
salmon. U.S. Dept. of Energy Bonneville Power Administration Report #2010-031-00. 570
Stephenson, J.J., Campbell, M.R, Hess, J.E., Kozfkay, C.C., Matala, A.P., McPhee, M.V., 571
Moran, P., Narum, S.R., Paquin, M.M., Schlei, O., Small, M.P., Van Doornik, D.M., and 572
Wenburg, J.K. 2008. A centralized model for creating shared, standardized, microsatellite 573
data that simplifies inter-laboratory collaboration. Conserv. Genet. 10(4):1145–1149. doi: 574
10.1007/s10592-008-9729-4. 575
Webster, M.S. and Reichart, L. 2005. Use of microsatellites for parentage and kinship 576
analyses in animals. Methods Enzymol 395: 222–238. 577
Page 27 of 44
http://mc.manuscriptcentral.com/cjfas-pubs
Canadian Journal of Fisheries and Aquatic Sciences
For Review O
nly
28
Table 1. Percentage of samples that accurately assigned, misassigned or were unassigned (False
Neg.) using different numbers of SNPs for PBT. Percentage of false positives represents the
portion of offspring known to not have parents represented in the dataset (Lyons Ferry) that
assigned to a parental pair regardless. The number of parent/offspring trios evaluated refers to
the number of potential parental assignments that could not be excluded based on Mendelian
incompatibilities and were subsequently evaluated with ML in SNPPIT. SNPs for the differently
sized panels were ranked and selected based on the minor allele frequencies within 6 hatchery
broodstocks in the Snake River basin.
Number of
loci used
% Accurate
Assign.
% Misassignment
of Assigned fish
False
Neg.
False
Post.
36 38.5 7.9 53.6 0.0
48 87.6 2.2 10.2 1.1
72 95.7 0.0 4.3 0.0
96 96.1 0.0 3.9 0.0
120 96.2 0.0 3.8 0.0
144 97.3 0.0 2.7 0.0
168 97.1 0.0 2.9 0.0
188 97.1 0.0 2.9 0.0
Page 28 of 44
http://mc.manuscriptcentral.com/cjfas-pubs
Canadian Journal of Fisheries and Aquatic Sciences

F
ly
29
Table 2. Comparisons of parentage and stock assignment accuracy between 17 microsatellites and 95 SNPs using offspring of known
origin from six upper Snake River hatchery stocks. Broodstock from Lyons Ferry were not sampled in order to estimate a proportion
of false positive assignments of their offspring using a 95-SNP panel.
* Cross information not available for all broodstock; 27 offspring assigned to parents with missing cross information, thereby lowering
the number of possible matches to spawn records.
**
Cross information not available.
Sample Size
Samples Genotyped
(Adults / Juveniles)
Juveniles
Assigned
No. assigned to
correct stock
No. (%) matching
spawn records
Hatchery Stock Parents
(♂ / ♀)
Offspring Micros SNPs Micros SNPs Micros SNPs Micros SNPs
Squaw Crk. 15 / 20 92 35 / 91 35 / 92 91 92 91 92 79 (86.8) 79 (85.9)
Sawtooth 118 /116 93 232 / 93 231 / 93 91 91 91 91 86 (94.5) 86 (94.5)
Dworshak * 184 / 209 93 393 / 92 393 / 93 92 93 92 93 65 (70.7) 66 (71.0)
E. Fk. Salmon R 83 / 36 94 118 / 93 118 / 94 87 85 87 85 83 (95.4) 80 (94.1)
Pahsimeroi **
121 / 134 93 255 / 92 252 / 93 92 88 92 88 --- ---
Cottonwood Crk. 85 / 84 93 169 / 91 167 / 93 91 91 91 91 90 (98.9) 91 (100.0)
Lyons Ferry --- 93 --- / 93 --- / 93 0 0 --- --- --- ---
Total 606 / 599 651 1202 / 645 1196 / 651 544 540 544 540 403 405
Page 29 of 44
http://mc.manuscriptcentral.com/cjfas-pubs
Canadian Journal of Fisheries and Aquatic Sciences

For Review Only
30
Table 3. Results of PBT-based stock assignments for known-origin 1-ocean fish with CWTs that were genetically tagged through the
genotyping of the 2008 Snake River basin parental broodstock.
CWT-based origin Samples
Genotyped
(failed to amplify) Assigned Assignment rate PBT tagging rate
Dworshak 9 9 (0) 7 77.8% 85.1%
Pahsimeroi 30 30 (0) 30 100% 95.8%
Oxbow 16 15 (1) 10 66.7% 93.3%
Sawtooth 4 3 (1) 3 100% 98.2%
Pahsimeroi (Squaw Crk.) 1 1 (0) 1 100% 100%
Lyons Ferry (Cottonwood Crk) 1 1 (0) 1 100% 100%
Total 61 59 (2) 52 88.1% 96.8%
Page 30 of 44
http://mc.manuscriptcentral.com/cjfas-pubs
Canadian Journal of Fisheries and Aquatic Sciences

For Review O
nly
31
Fig. 1. Map of Snake River basin indicating origin of hatchery stocks. Only hatcheries, rearing
facilities, and trapping facilities referenced in this study are represented.
Fig. 2. Relationship between accuracy of PBT assignment to stock of origin and number of SNPs
used in the assignment. SNPs for the differently sized panels were ranked and selected based on
the minor allele frequencies within 6 hatchery broodstocks in the Snake River basin.
Fig. 3. Distribution of estimates of the tagging rate via (a) parent pairs, (b) single fathers, and
(c) single mothers, using different numbers of SNPs. 10 data sets were simulated for each
number of SNPs from 15 to 100 and each data set is represented by a single dot on each figure.
The true tagging rates (gpair, gS, and gD, respectively) are indicated on each plot by the black,
horizontal, dashed lines. The gray, dashed, horizontal lines represent the 2.5% and 97.5%
quantiles of a binomial random variable of 1000 trials with the success probability given by
gpair, gS, or gD . These are the 95% confidence intervals that would be expected if parentage
could be assigned without any error to the sampled offspring in the simulations.
Page 31 of 44
http://mc.manuscriptcentral.com/cjfas-pubs
Canadian Journal of Fisheries and Aquatic Sciences
32
Page 32 of 44
http://mc.manuscriptcentral.com/cjfas-pubs
Canadian Journal of Fisheries and Aquatic Sciences

34
Page 34 of 44
http://mc.manuscriptcentral.com/cjfas-pubs
Canadian Journal of Fisheries and Aquatic Sciences
For Review Only
35
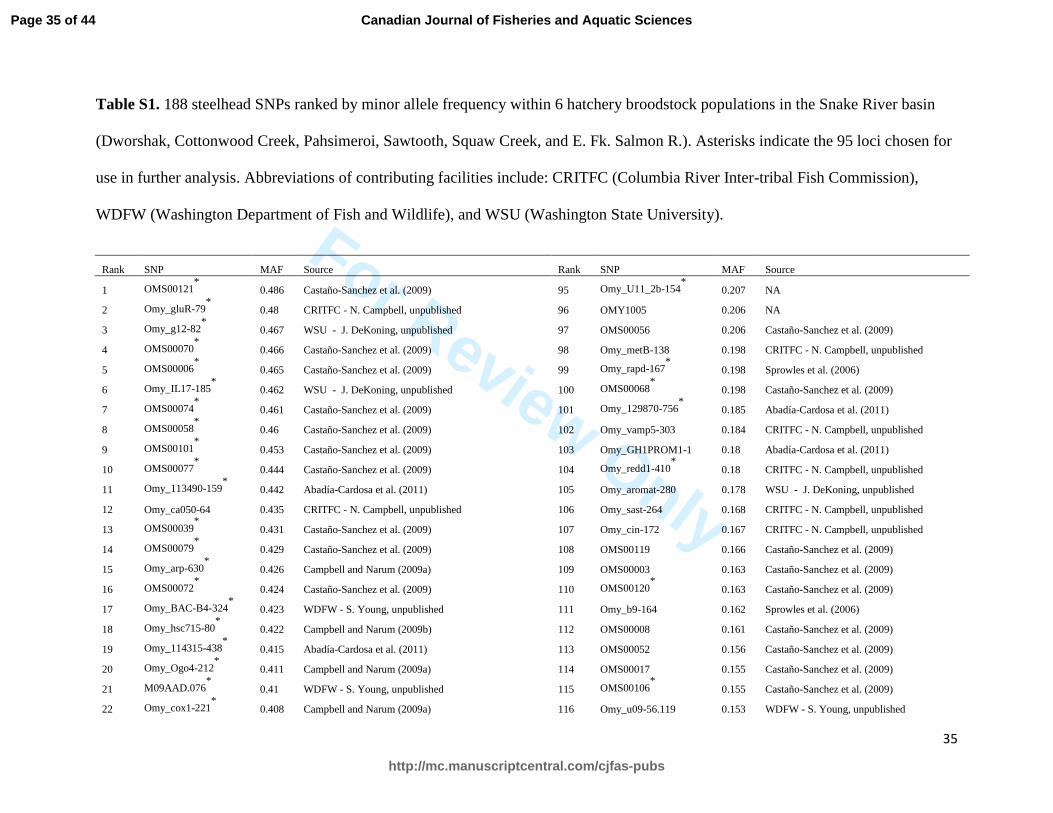
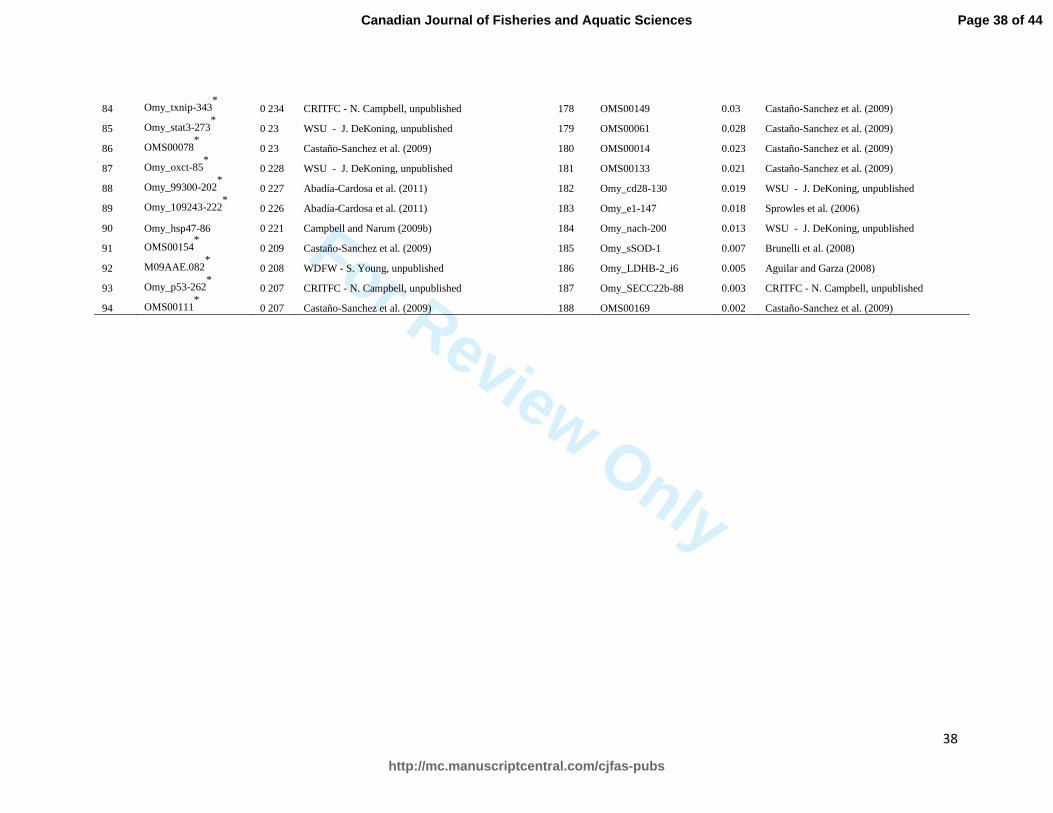
Table S1. 188 steelhead SNPs ranked by minor allele frequency within 6 hatchery broodstock populations in the Snake River basin
(Dworshak, Cottonwood Creek, Pahsimeroi, Sawtooth, Squaw Creek, and E. Fk. Salmon R.). Asterisks indicate the 95 loci chosen for
use in further analysis. Abbreviations of contributing facilities include: CRITFC (Columbia River Inter-tribal Fish Commission),
WDFW (Washington Department of Fish and Wildlife), and WSU (Washington State University).
Rank SNP MAF Source Rank SNP MAF Source
1 OMS00121* 0.486 Castaño-Sanchez et al. (2009) 95 Omy_U11_2b-154
* 0.207 NA
2 Omy_gluR-79* 0.48 CRITFC - N. Campbell, unpublished 96 OMY1005 0.206 NA
3 Omy_g12-82* 0.467 WSU - J. DeKoning, unpublished 97 OMS00056 0.206 Castaño-Sanchez et al. (2009)
4 OMS00070* 0.466 Castaño-Sanchez et al. (2009) 98 Omy_metB-138 0.198 CRITFC - N. Campbell, unpublished
5 OMS00006* 0.465 Castaño-Sanchez et al. (2009) 99 Omy_rapd-167
* 0.198 Sprowles et al. (2006)
6 Omy_IL17-185* 0.462 WSU - J. DeKoning, unpublished 100 OMS00068
* 0.198 Castaño-Sanchez et al. (2009)
7 OMS00074* 0.461 Castaño-Sanchez et al. (2009) 101 Omy_129870-756
* 0.185 Abadía-Cardosa et al. (2011)
8 OMS00058* 0.46 Castaño-Sanchez et al. (2009) 102 Omy_vamp5-303 0.184 CRITFC - N. Campbell, unpublished
9 OMS00101* 0.453 Castaño-Sanchez et al. (2009) 103 Omy_GH1PROM1-1 0.18 Abadía-Cardosa et al. (2011)
10 OMS00077* 0.444 Castaño-Sanchez et al. (2009) 104 Omy_redd1-410
* 0.18 CRITFC - N. Campbell, unpublished
11 Omy_113490-159* 0.442 Abadía-Cardosa et al. (2011) 105 Omy_aromat-280 0.178 WSU - J. DeKoning, unpublished
12 Omy_ca050-64 0.435 CRITFC - N. Campbell, unpublished 106 Omy_sast-264 0.168 CRITFC - N. Campbell, unpublished
13 OMS00039* 0.431 Castaño-Sanchez et al. (2009) 107 Omy_cin-172 0.167 CRITFC - N. Campbell, unpublished
14 OMS00079* 0.429 Castaño-Sanchez et al. (2009) 108 OMS00119 0.166 Castaño-Sanchez et al. (2009)
15 Omy_arp-630* 0.426 Campbell and Narum (2009a) 109 OMS00003 0.163 Castaño-Sanchez et al. (2009)
16 OMS00072* 0.424 Castaño-Sanchez et al. (2009) 110 OMS00120
* 0.163 Castaño-Sanchez et al. (2009)
17 Omy_BAC-B4-324* 0.423 WDFW - S. Young, unpublished 111 Omy_b9-164 0.162 Sprowles et al. (2006)
18 Omy_hsc715-80* 0.422 Campbell and Narum (2009b) 112 OMS00008 0.161 Castaño-Sanchez et al. (2009)
19 Omy_114315-438* 0.415 Abadía-Cardosa et al. (2011) 113 OMS00052 0.156 Castaño-Sanchez et al. (2009)
20 Omy_Ogo4-212* 0.411 Campbell and Narum (2009a) 114 OMS00017 0.155 Castaño-Sanchez et al. (2009)
21 M09AAD.076* 0.41 WDFW - S. Young, unpublished 115 OMS00106
* 0.155 Castaño-Sanchez et al. (2009)
22 Omy_cox1-221* 0.408 Campbell and Narum (2009a) 116 Omy_u09-56.119 0.153 WDFW - S. Young, unpublished
Page 35 of 44
http://mc.manuscriptcentral.com/cjfas-pubs
Canadian Journal of Fisheries and Aquatic Sciences

For Review Only
36
23 Omy_128923-433* 0.408 Abadía-Cardosa et al. (2011) 117 Omy_sys1-188 0.148 CRITFC - N. Campbell, unpublished
24 OMS00053* 0.408 Castaño-Sanchez et al. (2009) 118 OMS00129 0.145 Castaño-Sanchez et al. (2009)
25 OMS00105* 0.407 Castaño-Sanchez et al. (2009) 119 Omy_107285-69 0.145 Abadía-Cardosa et al. (2011)
26 Omy_Il-1b_.028* 0.403 WDFW - S. Young and UW - M. McGlauflin, unpubl. 120 Omy_myoD-178 0.145 Campbell and Narum (2009a)
27 Omy_101832-195* 0 398 Abadía-Cardosa et al. (2011) 121 Omy_carban1-264 0.138 CRITFC - N. Campbell, unpublished
28 OMS00132* 0 396 Castaño-Sanchez et al. (2009) 122 Omy_zg57-91 0.138 CRITFC - N. Campbell, unpublished
29 Omy_crb-106* 0 395 Sprowles et al. (2006) 123 OMS00048 0.136 Castaño-Sanchez et al. (2009)
30 Omy_114976-223 0 394 Abadía-Cardosa et al. (2011) 124 OMS00096 0.128 Castaño-Sanchez et al. (2009)
31 M09AAJ.163* 0 39 WDFW - S. Young, unpublished 125 Omy_128996-481 0.124 Abadía-Cardosa et al. (2011)
32 OMS00071* 0 383 Castaño-Sanchez et al. (2009) 126 OMS00151 0.124 Castaño-Sanchez et al. (2009)
33 Omy_110064-419* 0 38 Abadía-Cardosa et al. (2011) 127 Omy_lpl-220 0.123 CRITFC - N. Campbell, unpublished
34 OMS00024* 0 377 Castaño-Sanchez et al. (2009) 128 Omy_LDHB-2_e5 0.12 Aguilar and Garza (2008)
35 Omy_u09-53.469* 0 376 WDFW - S. Young, unpublished 129 Omy_ppie-232 0.119 CRITFC - N. Campbell, unpublished
36 OMS00090* 0 375 Castaño-Sanchez et al. (2009) 130 OMS00173 0.117 Castaño-Sanchez et al. (2009)
37 OMS00175* 0 371 Castaño-Sanchez et al. (2009) 131 OMS00092 0.115 Castaño-Sanchez et al. (2009)
38 Omy_nkef-241* 0 368 Campbell and Narum (2009a) 132 Omy_97954-618 0.114 Abadía-Cardosa et al. (2011)
39 OMS00002* 0 367 Castaño-Sanchez et al. (2009) 133 Omy_107031-704 0.114 Abadía-Cardosa et al. (2011)
40 Omy_111383-51* 0 364 Abadía-Cardosa et al. (2011) 134 Omy_G3PD_2-371 0.112 CRITFC - N. Campbell, unpublished
41 Omy_130524-160* 0 362 Abadía-Cardosa et al. (2011) 135 Omy_LDHB-1_i2 0.109 Aguilar and Garza (2008)
42 OMS00180* 0 361 Castaño-Sanchez et al. (2009) 136 Omy_u07-79-166 0.108 WDFW - S. Young, unpublished
43 Omy_vatf-406* 0 36 CRITFC - N. Campbell, unpublished 137 OMS00030 0.108 Castaño-Sanchez et al. (2009)
44 Omy_104519-624* 0 358 Abadía-Cardosa et al. (2011) 138 Omy_gh-475 0.108 CRITFC - N. Campbell, unpublished
45 OMS00057* 0 356 Castaño-Sanchez et al. (2009) 139 Omy_gdh-271 0.103 Campbell and Narum (2009a)
46 Omy_102505-102* 0 353 Abadía-Cardosa et al. (2011) 140 Omy_cox2-335 0.103 WSU - J. DeKoning, unpublished
47 Omy_NaKATPa3-50* 0 352 Campbell and Narum (2009a) 141 Omy_cd59b-112 0.101 WSU - J. DeKoning, unpublished
48 Omy_97660-230* 0 351 Abadía-Cardosa et al. (2011) 142 OMS00018 0.098 Castaño-Sanchez et al. (2009)
49 Omy_108007-193* 0 349 Abadía-Cardosa et al. (2011) 143 Omy_OmyP9-180 0.097 Sprowles et al. (2006)
50 Omy_105105-448* 0 343 Abadía-Cardosa et al. (2011) 144 Omy_IL1b-163 0.096 WSU - J. DeKoning, unpublished
51 OMS00118* 0 342 Castaño-Sanchez et al. (2009) 145 Omy_103705-558 0.095 Abadía-Cardosa et al. (2011)
52 Omy_srp09-37* 0 341 CRITFC - N. Campbell, unpublished 146 Omy_110201-359 0.09 Abadía-Cardosa et al. (2011)
53 Omy_aldB-165* 0 337 Campbell and Narum (2009a) 147 OMS00013 0.088 Castaño-Sanchez et al. (2009)
Page 36 of 44
http://mc.manuscriptcentral.com/cjfas-pubs
Canadian Journal of Fisheries and Aquatic Sciences

For Review Only
37
54 OMS00064* 0 335 Castaño-Sanchez et al. (2009) 148 Omy_g1-103 0.088 Sprowles et al. (2006)
55 Omy_109894-185* 0 331 Abadía-Cardosa et al. (2011) 149 Omy_105075-162 0.088 Abadía-Cardosa et al. (2011)
56 Omy_105385-406* 0 325 Abadía-Cardosa et al. (2011) 150 Omy_GHSR-121 0.086 CRITFC - N. Campbell, unpublished
57 Omy_116733-349* 0 323 Abadía-Cardosa et al. (2011) 151 Omy_tlr3-377 0.085 WSU - J. DeKoning, unpublished
58 OMS00001 0 317 Castaño-Sanchez et al. (2009) 152 Omy_hsp70aPro-329 0.078 Campbell and Narum (2009b)
59 Omy_bcAKala-380rd* 0 317 CRITFC - N. Campbell, unpublished 153 OMS00138 0.074 Castaño-Sanchez et al. (2009)
60 Omy_u09-54-311* 0 317 WDFW - S. Young, unpublished 154 Omy_inos-97 0.071 WSU - J. DeKoning, unpublished
61 Omy_anp-17* 0 313 CRITFC - N. Campbell, unpublished 155 Omy_123044-128 0.066 Abadía-Cardosa et al. (2011)
62 Omy_114587-480* 0 311 Abadía-Cardosa et al. (2011) 156 OMS00176 0.066 Castaño-Sanchez et al. (2009)
63 Omy_colla1-525* 0 308 WSU - J. DeKoning, unpublished 157 Omy_gadd45-332 0.066 CRITFC - N. Campbell, unpublished
64 Omy_ntl-27* 0 306 CRITFC - N. Campbell, unpublished 158 Omy_121713-115 0.061 Abadía-Cardosa et al. (2011)
65 Omy_Ots249-227* 0 3 Campbell and Narum (2009a) 159 Omy_hsf1b-241 0.06 Campbell and Narum (2009b)
66 Omy_cd59-206* 0 295 WSU - J. DeKoning, unpublished 160 Omy_mapK3-103 0.058 CRITFC - N. Campbell, unpublished
67 Omy_101993-189* 0 283 Abadía-Cardosa et al. (2011) 161 OMS00015 0.058 Castaño-Sanchez et al. (2009)
68 Omy_b1-266* 0 275 Sprowles et al. (2006) 162 Omy_BAMBI2.312 0.056
WDFW - S. Young and UW - M. McGlauflin,
unpubl.
69 Omy_metA-161* 0 268 CRITFC - N. Campbell, unpublished 163 Omy_impa1-55 0.051 CRITFC - N. Campbell, unpublished
70 Omy_IL6-320* 0 267 WSU - J. DeKoning, unpublished 164 Omy_97865-196 0.05 Abadía-Cardosa et al. (2011)
71 OMY1011SNP* 0 266 WDFW - C. Pascal and M. Hansen, unpublished 165 Omy_97077-73 0.048 Abadía-Cardosa et al. (2011)
72 OMS00179* 0 265 Castaño-Sanchez et al. (2009) 166 Omy_UT16_2-173 0.047 NA
73 Omy_hsf2-146* 0 26 Campbell and Narum (2009b) 167 Omy_pad-196 0.047 CRITFC - N. Campbell, unpublished
74 OMS00062* 0 259 Castaño-Sanchez et al. (2009) 168 Omy_nxt2-273 0.046 CRITFC - N. Campbell, unpublished
75 Omy_aspAT-123 0 258 Campbell and Narum (2009a) 169 Omy_u09-52.284 0.046 WDFW - S. Young, unpublished
76 Omy_Il1b-198* 0 256 CRITFC - N. Campbell, unpublished 170 Omy_BAC-F5.284 0.043 WDFW - S. Young, unpublished
77 OMS00112* 0 255 Castaño-Sanchez et al. (2009) 171 Omy_mcsf-268 0.04 WSU - J. DeKoning, unpublished
78 OMS00109 0 253 Castaño-Sanchez et al. (2009) 172 Omy_tlr5-205 0.04 WSU - J. DeKoning, unpublished
79 Omy_105714-265* 0 249 Abadía-Cardosa et al. (2011) 173 Omy_star-206 0.04 WSU - J. DeKoning, unpublished
80 Omy_107806-34* 0 245 Abadía-Cardosa et al. (2011) 174 Omy_CRBF1-1 0.037 Aguilar and Garza (2008)
81 Omy_rbm4b-203* 0 243 CRITFC - N. Campbell, unpublished 175 Omy_ndk-152 0.036 CRITFC - N. Campbell, unpublished
82 Omy_ada10-71* 0 235 CRITFC - N. Campbell, unpublished 176 Omy_nips-299 0.032 CRITFC - N. Campbell, unpublished
83 OMS00089* 0 235 Castaño-Sanchez et al. (2009) 177 Omy_hus1-52 0.031 CRITFC - N. Campbell, unpublished
Page 37 of 44
http://mc.manuscriptcentral.com/cjfas-pubs
Canadian Journal of Fisheries and Aquatic Sciences
For Review Only
38
84 Omy_txnip-343* 0 234 CRITFC - N. Campbell, unpublished 178 OMS00149 0.03 Castaño-Sanchez et al. (2009)
85 Omy_stat3-273* 0 23 WSU - J. DeKoning, unpublished 179 OMS00061 0.028 Castaño-Sanchez et al. (2009)
86 OMS00078* 0 23 Castaño-Sanchez et al. (2009) 180 OMS00014 0.023 Castaño-Sanchez et al. (2009)
87 Omy_oxct-85* 0 228 WSU - J. DeKoning, unpublished 181 OMS00133 0.021 Castaño-Sanchez et al. (2009)
88 Omy_99300-202* 0 227 Abadía-Cardosa et al. (2011) 182 Omy_cd28-130 0.019 WSU - J. DeKoning, unpublished
89 Omy_109243-222* 0 226 Abadía-Cardosa et al. (2011) 183 Omy_e1-147 0.018 Sprowles et al. (2006)
90 Omy_hsp47-86 0 221 Campbell and Narum (2009b) 184 Omy_nach-200 0.013 WSU - J. DeKoning, unpublished
91 OMS00154* 0 209 Castaño-Sanchez et al. (2009) 185 Omy_sSOD-1 0.007 Brunelli et al. (2008)
92 M09AAE.082* 0 208 WDFW - S. Young, unpublished 186 Omy_LDHB-2_i6 0.005 Aguilar and Garza (2008)
93 Omy_p53-262* 0 207 CRITFC - N. Campbell, unpublished 187 Omy_SECC22b-88 0.003 CRITFC - N. Campbell, unpublished
94 OMS00111* 0 207 Castaño-Sanchez et al. (2009) 188 OMS00169 0.002 Castaño-Sanchez et al. (2009)
Page 38 of 44
http://mc.manuscriptcentral.com/cjfas-pubs
Canadian Journal of Fisheries and Aquatic Sciences

For Review O
nly
39
Table S2. Summary statistics (expected, unbiased expected, and observed heterozygosity) of 17
microsatellite loci across 6 hatchery broodstock populations in the Snake River basin (Dworshak,
Cottonwood Crk, Pahsimeroi, Sawtooth, Squaw Crk., and E. Fk. Salmon R.).
Locus He (SE) UHe (SE) Ho (SE) A Fis
Ogo4 0.802 (0.007) 0.806 (0.007) 0.813 (0.012) 12 -0.013
Omy1001 0.889 (0.005) 0.894 (0.006) 0.887 (0.008) 23 0.003
Omy7 0.793 (0.012) 0.797 (0.012) 0.789 (0.025) 13 0.006
Oki23 0.788 (0.008) 0.792 (0.008) 0.788 (0.019) 19 0.001
Omy1011 0.871 (0.005) 0.875 (0.005) 0.874 (0.013) 18 -0.004
Ots3m 0.642 (0.032) 0.645 (0.032) 0.649 (0.035) 10 -0.011
Ssa407 0.848 (0.005) 0.852 (0.006) 0.836 (0.011) 22 0.014
Ssa408 0.878 (0.005) 0.883 (0.006) 0.895 (0.01) 18 -0.019
Ogo1a 0.593 (0.016) 0.596 (0.016) 0.619 (0.021) 8 -0.044
Omy27 0.547 (0.012) 0.55 (0.012) 0.535 (0.025) 6 0.021
Oneu14 0.6 (0.014) 0.603 (0.014) 0.574 (0.019) 10 0.043
Oneu8 0.855 (0.006) 0.859 (0.006) 0.851 (0.01) 18 0.005
Ots4 0.671 (0.028) 0.675 (0.028) 0.682 (0.025) 8 -0.016
Omy325 0.89 (0.004) 0.895 (0.004) 0.895 (0.01) 33 -0.005
Oke4 0.76 (0.023) 0.764 (0.023) 0.763 (0.023) 12 -0.004
Ots100 0.829 (0.008) 0.834 (0.008) 0.839 (0.015) 20 -0.011
Ssa289 0.434 (0.028) 0.437 (0.028) 0.441 (0.03) 8 -0.014
Page 39 of 44
http://mc.manuscriptcentral.com/cjfas-pubs
Canadian Journal of Fisheries and Aquatic Sciences
For Review O
nly
Supplement to:
Steele, Anderson, Ackerman, Hess,
Campbell, Narum, and Campbell.
Validation of SNP-based Parentage-Based Tagging for hatchery
steelhead in the Snake River Basin
Eric C. Anderson∗
August 1, 2012
In most categorical approaches (Marshall et al., 1998; Kalinowski et al., 2007) and fractionalallocation approaches (Devlin et al., 1988; Roeder et al., 1989; Cercueil et al., 2002) to parent-age, as well as approaches that infer more complete pedigrees (Wang and Santure, 2009) it iseither assumed that all possible parents have been sampled, or that the sampling fraction of trueparents of the offspring can be independently estimated (or merely assumed known!). It was notuntil Nielsen et al. (2001) that a model was proposed for using the data to estimate the fractionof sampled parent pairs. This was a Bayesian model for estimating the fraction of unsampled malesin a paternity experiment in humpback whales. Since that time, surprisingly little work has beendone on estimating the fraction of sampled parents.
The multigeneration pedigree reconstruction approach implemented in FRANz (Riester et al.,2009) admits a method for estimating the fraction of sampled parents as a function of the number ofoffspring having one identified parent versus two identified parents, but this is an entirely heuristicapproach that does little to leverage the information that Nielsen et al. (2001) pointed out isavailable in the likelihood (if formulated correctly) for estimating the fraction of sampled parents.The program SNPPIT (Anderson, 2010) is a categorical approach that utilizes a False DiscoveryRate correction formulated by Benjamini and Hochberg (2000) to attempt allocation in thecontext of an unknown sampling fraction. This works reasonably well, but it is also heuristic anddoesn’t use all the information available for estimating the fraction of sampled parents. Morerecently, Almudevar and LaCombe (2012) propose a class of scale invariant priors for pedigreeinference, pointing out that they may be reweighted to account for sampling sparseness. The detailsof this have not yet been specified, however.
Detailed here is a simple likelihood model that essentially extends the perspective of Nielsen et al.(2001) to allow estimation not only of the fraction of sampled fathers but rather the probabilitythat an offspring’s single parents (of either sex) or parent pairs occur in the sample of parents. This
∗Fisheries Ecology Division, Southwest Fisheries Science Center, 110 Shaffer Road, Santa Cruz, CA 95060
1
Page 40 of 44
http://mc.manuscriptcentral.com/cjfas-pubs
Canadian Journal of Fisheries and Aquatic Sciences

For Review O
nly
is not necessarily the same as the sampling fraction of parents but is best viewed as the marginalprobability that an offspring’s parent (or parent pair) is included in the sample of parents. Inthe paper to which this is a supplement, we use the term “PBT-tagging rate” to describe thisprobability that an offspring’s parent pair occurs in the data base. The estimation problem isapproached from a frequentist, rather than Bayesian, perspective because our goal here is a simple,quick implementation for analyzing a series of simulated data sets. Extending the implementationto much larger data sets—like those encountered in parentage-based tagging (PBT) of salmonids—will require more effort, which is currently ongoing.
We assume genotypic data at L SNP loci have been collected for I putative fathers, J putativemothers, and K possible offspring. We also assume that ages or life stages of the individuals areknown so that they can be unambiguously placed into putative parental and putative offspringcategories. The ith putative father’s genotype is denoted Si (with i = 1, . . . , I) where we are usingS as in “Sire;” the jth putative mother’s genotype is denoted Dj , j = 1; . . . , J , (D for “Dam”); thekth putative offspring’s genotype is denoted Ok, k = 1, . . . ,K (O for “Offspring”).
Given these genetic data we seek to estimate the vector of proportions:
g = (gpair, gS , gD, gnone),
where:
• gpair is the probability that a randomly selected offspring was born to a pair of parents whosegenotypes are included in our sample of parents,
• gS is the probability that a random offspring’s father’s genotype is in our sample of parents,but not its mother’s genotype,
• gD is the probability that a random offspring’s mother’s genotype is in our sample of parents,but not its father’s genotype,
• gnone is the probability that neither the mother’s nor father’s genotypes are in our sample ofparents.
Each of the probabilities above is associated with a single possible outcome. These four outcomes aredisjoint and, making the simplifying assumption that individuals are either parental or unrelated,these are the only possible outcomes, so we have gpair + gS + gD + gnone = 1. Note that use ofthe vector g allows for the possibility that mothers and fathers and their mates are not sampledindependently. For example, in some species it might be the case that if a female is sampled, thenits mate is almost always sampled as well, while a separate pool of male parents might also beavailable for sampling, but their female mates are almost never co-sampled with them. In otherwords, the components of g are not constrained such that gSgD = gpair nor that gS = gD as wouldbe assumed if all parents were sampled individually and independently of their sex or their mates.
For the sake of simplicity in applying this model to the simulations in the paper, we will also assumethat “fertilities” are equal amongst all parent pairs or singleton mothers/fathers. In other words,we will not attempt to model here overdispersion of reproductive success by pairs of parents or
2
Page 41 of 44
http://mc.manuscriptcentral.com/cjfas-pubs
Canadian Journal of Fisheries and Aquatic Sciences

For Review O
nly
single parents. Such overdispersion could be added to the model, but it would make the estimationmore computationally demanding.
The likelihood for g is the probability of our data given g. We use the following notation: P (Si) andP (Dj) denote the probabililty of putative father i’s genotype and putative mother j’s genotype,respectively. These, of course, depend on the allele frequencies in the population and typicallyon the assumptions of Hardy-Weinberg equilibrium and no linkage disequilibrium between loci.For brevity, those factors are suppressed in the notation. The probability P (Ok|Si, Dj) gives theprobability of k’s genotype given that its parents carried the genotypes Si and Sj . We use theformulation and genotyping error model in Anderson and Garza (2006). P (Ok|Si) denotes theprobability of k’s genotype given that its father carried the genotype Si and its mother’s genotypeis drawn randomly from the population. P (Ok|Dj) is defined analogously. These two probabilities,which can be found as the 9-state marginals of the 27 trio probabilities defined in Anderson andGarza (2006), also depend on the allele frequencies which are implicit in the notation.
Given this notation we can write down the likelihood for g as follows:
L(g) = P (data|g) =I∏
i=1
P (Si)J∏
j=1
P (Dj)×
K∏k=1
(gpair
IJ
I∑i=1
J∑j=1
P (Ok|Si, Dj) +gS
I
I∑i=1
P (Ok|Si)+ (1)
gD
J
J∑j=1
P (Ok|Dj) + gnoneP (Ok))
.
The terms∏I
i=1 P (Si)∏J
j=1 P (Dj) are merely the probability of all the putative parental genotypes(in this formulation it is assumed that they are all unrelated). The term gpair
IJ P (Ok|Si, Dj) is justthe probability that offspring k’s true parent pair is in the sample (gpair) times the probabilitythat father i and mother j are k’s parents ( 1
IJ ) times the probability of k’s genotype given thati and j are its parents. An offspring cannot simultaneously belong to any two different pairs ofparents so we can sum these probabilities over all i and j (hence the
∑Ii=1
∑Jj=1 that appears
in the equation). Likewise, gSI
∑Ii=1 P (Ok|Si) is the probability that offspring k’s father is in the
sample, but not its mother, and its father is i, and its genotype is Ok. Analogous arguments holdfor gD
J
∑Jj=1 P (Ok|Dj). Finally, if none of k’s parents are in the sample (probability gnone) then
the probability of its genotype is written P (Ok)—the probability of its genotype given the allelefrequencies in the population. If the genetic markers are unlinked, and are subject to neither missingdata nor genotyping errors amongst the parents, then the probabilities of offspring genotypes areconditionally independent given the parents, which would give us the product over k in (1). Ofcourse, there may be missing data and genotyping errors amongst the parents, so the formulationin (1) is an approximation which offers a considerable advantage in computational efficiency.
We note that the method described here is very similar to the model proposed in Koch et al. (2008),the primary differences being that 1) we make the approximation of conditional independence ofoffspring even in presence of missing data and/or genotyping error amongst the parents, and 2) wemodel the sampling fractions as opposed to the total size of the population. The latter differencewill prove useful in taking a Bayesian approach to the problem as MCMC updates for g can beeasily made using a Gibbs sampler, exploiting the conjugacy that a Dirichlet prior for g will provide.
3
Page 42 of 44
http://mc.manuscriptcentral.com/cjfas-pubs
Canadian Journal of Fisheries and Aquatic Sciences

For Review O
nly
It is relatively straightforward to maximize (1) with respect to g to find the maximum likelihoodestimate, g. Since the components of g are constrained to sum to 1, it involves optimization inthree dimensions. We employed Powell’s method (Press et al., 1992), which finds the maximumquickly and reliably for all the data sets we simulated.
References
Almudevar, A. and J. LaCombe, 2012 On the choice of prior density for the Bayesian analysisof pedigree structure. Theoretical Population Biology 81: 131–143.
Anderson, E. C., 2010 Computational algorithms and user-friendly software for parentage-basedtagging of Pacific salmonids. A final report to the Pacific Salmon Commission’s Chinook TechnicalCommittee (US Section). 12 March 2010. http://tinyurl.com/snppit. Technical report.
Anderson, E. C. and J. C. Garza, 2006 The power of single nucleotide polymorphisms forlarge-scale parentage inference. Genetics 172: 2567–2582.
Benjamini, Y. and Y. Hochberg, 2000 On the adaptive control of the false discovery rate inmultiple testing with independent statistics. Journal of Educational and Behavioral Statistics 25:60–83.
Cercueil, A., E. Bellemain, and S. Manel, 2002 PARENTE: computer program for parentageanalysis. J Hered 93: 458–9.
Devlin, B., K. Roeder, and N. C. Ellstrand, 1988 Fractional paternity assignment—theoretical development and comparison to other methods. Theor Appl Genet 76: 369–380.
Kalinowski, S. T., M. L. Taper, and T. C. Marshall, 2007 Revising how the computerprogram CERVUS accommodates genotyping error increases success in paternity assignment.Mol Ecol 16: 1099–1106.
Koch, M., J. D. Hadfield, K. M. Sefc, and C. Sturmbauer, 2008 Pedigree reconstructionin wild cichlid fish populations. Mol Ecol 17: 4500–11.
Marshall, T. C., J. Slate, L. E. B. Kruuk, and J. M. Pemberton, 1998 Statistical con-fidence for likelihood-based paternity inference in natural populations. Molecular Ecology 7:639–655.
Nielsen, R., D. K. Mattila, P. J. Clapham, and P. J. Palsboll, 2001 Statistical approachesto paternity analysis in natural populations and applications to the North Atlantic humpbackwhale. Genetics 157: 1673–82.
Press, W. H., S. A. Teukolsky, W. T. Vetterling, and B. P. Flannery, 1992 NumericalRecipes in C. The Art of Scientific Computing. Cambridge, UK: Cambridge University Press.
Riester, M., P. Stadler, and K. Klemm, 2009 FRANz: Reconstruction of wild multi-generation pedigrees. Bioinformatics 25: 2134–2139.
Roeder, K., B. Devlin, and B. G. Lindsay, 1989 Application of maximum likelihood methodsto population genetic data for the estimation of individual fertilities. Biometrics 45: 363–380.
4
Page 43 of 44
http://mc.manuscriptcentral.com/cjfas-pubs
Canadian Journal of Fisheries and Aquatic Sciences

For Review O
nly
Wang, J. and A. W. Santure, 2009 Parentage and sibship inference from multilocus genotypedata under polygamy. Genetics 181: 1579–94.
5
Page 44 of 44
http://mc.manuscriptcentral.com/cjfas-pubs
Canadian Journal of Fisheries and Aquatic Sciences