Embed Size (px)
Citation preview

Parent Attitude
and
Satisfaction
Survey Report
Anoka-Hennepin School District
Prepared by Research, Evaluation, and
Testing
March 2018

PARENT ATTITUDE AND SATISFACTION SURVEY REPORT March 1, 2018
Table of Contents
Introduction ……………………………………………………………………………………………………… 2
Key findings ……………………………………………………………………………………………………... 3
Percent of parent participants by gender, ethnicity, and school activities ………………………………………. 4
Percent of parents who were satisfied, disaggregated by level, ethnicity, and school activities …………...…… 6
Percent of parents who were satisfied, disaggregated by grade levels ………...………………………………... 9
Percent of parents who were satisfied, disaggregated by school …………………………...………………….. 10
Examining the response rate for each survey item …………………………………………………………….. 13
Trend data: Percent of parents who indicated that they “agree” with each statement from the web survey..…. 19

PARENT ATTITUDE AND SATISFACTION SURVEY REPORT March 1, 2018
Administered May, 2017 2
Introduction
For the 2016-2017 school year, a total of 2,952 parents completed the Parent Attitude and Satisfaction Survey
(PASS). This number may include duplicated parents who completed the surveys for students at more than one
school. All parents within the Anoka-Hennepin School District were sent a letter with information about how to
access the PASS survey online. Parents were also informed that they could choose to complete the survey on
paper if requested. Of all the parents in the school district, 1,365 parents voluntarily completed the online
survey. There were 350 parents of one or more high school students, 334 parents of one or more middle school
students, and 681 parents of one or more elementary school students. Given the voluntary nature of the survey,
the results cannot be generalized to the population as a whole because responses generated do not necessarily
represent the views and opinions of the full population.
In addition to the web survey, an outside research agency conducted phone interviews of randomly selected
parents who had a child in one of the district high schools. If the parent had more than one child in high school,
they were asked to respond with their oldest child in mind. As a result, 1,587 parents from high schools
completed the same parent satisfaction survey on the phone. The results from the phone survey are reported
separately from the web responses because they can be statistically generalized to parents of students for the
high schools as the sample was randomly selected to represent this population.
The PASS was used to measure parents’ overall level of satisfaction with their child’s school. In this survey,
parents rated twelve independent statements on a four point Likert scale: (1) disagree, (2) somewhat disagree,
(3) somewhat agree, and (4) agree. These statements included:
1. In this school, teachers and staff care about my student.
2. My student’s school is safe.
3. Teachers provide help for my student when needed.
4. Teachers in this school support me in helping my student learn at home.
5. I feel welcome at my student’s school.
6. I feel respected at my student’s school.
7. I feel my family is accepted at my student’s school.
8. Teachers in this school challenge my student to do his or her best in school work.
9. Teachers communicate regularly with me about my student’s progress (email, classroom website, phone
calls, progress reports, etc.).
10. All staff (teachers, administrators, support staff) show my student respect in this school.
11. This school has a good leadership team and is well led.
12. Overall, my student’s school provides a quality education.
In addition to the twelve survey items, parents were asked to provide demographic information, including their
child’s race or ethnicity, whether their child participated in athletics or other after school activities, and whether
the student received or participated in any special programming.
The survey also included an open-ended response item for parents to comment on any aspect of their child’s
school. This report does not include results from the parents’ comments from the open-ended response section.
The first part of this report summarizes the overall percent of parents who were satisfied with their child’s
school by indicating that they “agree” or “somewhat agree” with each statement. However, because we
ultimately strive for high levels of parental satisfaction, the second part of this report considers a trend across
years and only includes the percent of parents indicating they “agree” with each statement and does not include
“somewhat agree” in the comparison.

PARENT ATTITUDE AND SATISFACTION SURVEY REPORT March 1, 2018
Administered May, 2017 3
Key Findings
Overall, 92.4% of parents who completed the survey on the web were satisfied with their child’s school.
This percentage was based on the average of all responses to the twelve items and is similar last year’s rate
of 92.1%.
Parents of elementary and middle school students were more likely to be satisfied than parents of high
school students.
o The overall percent of parents with an elementary school student who were satisfied with their child’s
school (93.5%) was slightly lower than the overall percent of parents with a middle school student who
were satisfied (94.2%) as reported via the web survey.
o The percent of parents with a high school student responding via web who were satisfied with their
child’s school was 88.6%, up from 87.4% last year.
87.5% of parents with a student who attended a high school/alternative program responded as satisfied (via
phone). The phone survey is a statistically representative sample and is, therefore, generalizable to all
parents of the students at the district’s high schools and alternative programs.
The parents of students in grades K-12 who were least satisfied with their child’s school when disaggregated
by grade were the parents of 12th grade students, with 85.5% reporting satisfaction. This is an increase of
about 4% from the 2016 rate of 81.7% satisfaction in grade 12.
For parents of middle and high school students, those whose child participated in athletics or other activities
were more likely to be satisfied than parents whose child did not participate in athletics or other activities.
The difference was larger at the high school level than the middle school level.
There were very few significant differences within the items across ethnicities. At the elementary and
middle school levels, parents of students of color agreed at a significantly lower rate that they feel their
family is respected at their student’s school than parents of white students. Parents of middle school
students of color also reported they felt respected at their student’s school at significantly lower rates. There
were no significant differences for parents of white students or students of color at the high school level.
The percent of parents who agreed with the statement “All staff, including teachers, administrators, and
support staff show my student respect in school” increased slightly at all three levels in 2017.
The percent of parents who agreed with the statement “My student’s school is safe” decreased at all levels
in 2017 for the second year in a row.
The statement “I feel my family is accepted at my student’s school” has had the greatest percent of parent
agreement at every level for the all three years the item was part of the survey.

PARENT ATTITUDE AND SATISFACTION SURVEY REPORT March 1, 2018
Administered May, 2017 4
Percent of parent participants by ethnicity, and school programming
The parent respondents who completed the survey on the web indicated that their child’s ethnicity was: 0.1%
American Indian, 5.5% Asian, 3.0% Hispanic, 2.2% Black, 82.0% White, and 4.5% Multi-racial.
Parent respondents who completed the survey on the phone reported that their child’s ethnicity was: 2.5%
American Indian, 7.8% Asian, 6.2% Hispanic, 14.8% Black, and 68.7% White. All parents surveyed over the
phone provided a response to this item. This is a representative sample of the districtwide high school student
ethnic breakdown.
Percent of parent's report of students' ethnicity (web responses)
American Indian 0.1%
Asian 5.5%
Hispanic 3.0%
Black 2.2%
White 82.0%
Multi-racial 4.5%
Other 1.2%
No Response 1.5%
Percent of parent's report of students' ethnicity (phone responses)
American Indian 2.5%
Asian 7.8%
Hispanic 6.2%
Black 14.8%
White 68.7%
Figure 1. Percent of parent participants who completed the web survey by ethnicity.
Figure 2. Percent of parent participants who completed the phone survey by ethnicity. Note: Only parents with a high school student in 2017 were included in the
phone survey.

PARENT ATTITUDE AND SATISFACTION SURVEY REPORT March 1, 2018
Administered May, 2017 5
Parents indicated whether their child received services or participated in school activities. Parents were asked
to select all of the programs in which their child participates, so more than one program could have been
selected by each respondent.
From the phone surveys of high school parents, approximately 18% participated in special education (SpEd)
and 7% received English language acquisition services. Thirty-five percent of parents indicated that their child
participated in honors courses and 6% participated in PSEO opportunities. In addition, 20% of the parents
reported that their child participated in the AVID program, while 12% reported their child participated in one of
the district’s magnet programs.
4%
13%
3%
20%
6%
35%
1%1%
10%4%
61%
5%2%
13%
2%8% 11% 8%
3%
0%
10%
20%
30%
40%
50%
60%
70%
80%
90%
100%
Advanced or
Honors
Courses**
AVID
Program**
EL services Magnet
Programs
(CEMS, Bio
Med, IB
diploma)***
Online
Learning/
STEP Ahead/
TelePresence
Coursework***
PSEO*** SpEd STEP*** Supplemental
Program/
Title I*
Talent
Development*
Other
Percent of parents identifying students who participated in school programming
(web responses)
Elementary Middle High
20%
7%
35%
12%5% 6%
18%
4%
0%10%20%30%40%50%60%70%80%90%
100%
AVID EL services Honors Courses,
AP/IB Courses,
CIS, etc.
Magnet
Programs
(CEMS, Bio
Med,
IB diploma)
Online Learning/
STEP Ahead/
TelePresence
Coursework
PSEO SpEd STEP
Percent of parents identifying students who participated in school programming
(phone responses)
Figure 3. Percent of parents identifying students who participated in school programming from the web surveys.
Note: Parents can select more than one program. *Items only included on surveys of parents of elementary school students. ** Items only included on surveys of
parents of middle school or high school students. ***Items only included on surveys of parents of high school students.
Figure 4. Percent of parents identifying students who participated in school programming from the phone surveys.
Note: Only parents with a high school student were included in the phone survey. Parents were able to choose more than one activity or program activity.

PARENT ATTITUDE AND SATISFACTION SURVEY REPORT March 1, 2018
Administered May, 2017 6
Percent of parents who were satisfied with their child’s school, disaggregated by level,
ethnicity, and school programs
Based on the web responses, parents of elementary and middle school students were more likely to be satisfied
than parents of high school students.
The percent of parents of students of color who were satisfied was lower than parents of white students at all
levels. High school parents of students of color and white students were the most similar in reporting of their
overall level of satisfaction.
94% 93%87%
92%94% 94%
87%92%94% 94%
89%92%
0%
10%
20%
30%
40%
50%
60%
70%
80%
90%
100%
Elementary School Middle School High School Overall
Percent of parents who were satisfied with their child's school by level (web responses)
2015
2016
2017
90% 90% 88%94% 95%
89%
0%
10%
20%
30%
40%
50%
60%
70%
80%
90%
100%
Elementary School Middle School High School
Percent of parents who were satisfied: Non-white and white comparison (web responses)
Students of Color
White Students
Figure 5. Percent of parents who were satisfied with their child’s school by elementary, middle, and high school based on web responses.
Note: These percents include the calculation of parents who indicated that they “agree” and “somewhat agree” with the statements.
Figure 6. Percent of parents who were satisfied with their child’s school by level and by ethnicity based on web responses.
Note: All the parents of students of color were combined into one group for this analysis because of the small sample sizes of parents of students from different ethnic or racial backgrounds. These percents include the calculation of parents who indicated that they “agree” and “somewhat agree” with the statements.

PARENT ATTITUDE AND SATISFACTION SURVEY REPORT March 1, 2018
Administered May, 2017 7
Elementary School
Based on web responses, the percent of elementary parents with children in special programming who were
satisfied ranged from 81% to 93%, with the parents of students in the Talent Development program and ‘Other’
programs indicating the highest level of satisfaction with their child’s school. Parents of students receiving
special education services were the only group who reported increased level of satisfaction this year compared
to last year. Please note the sample size of a group when interpreting the results.
Middle School
According to the web respondents, middle school parents of students participating in advanced courses were
among the most highly satisfied. Dropping this year, parents whose students participated in the AVID and
‘Other’ programs had the lowest level of satisfaction (81% and 87%, respectively). Please note the sample size
of a group when interpreting the results.
97%90% 90%
96%90%
99%
88% 88%96% 94%
88% 91%
81%
93% 93%
0%
10%
20%
30%
40%
50%
60%
70%
80%
90%
100%
EL Services
(N = 26)
SpEd
(N = 89)
Supplemental
Program/Title I
(N = 19)
Talent Development
(N = 137)
Other
(N = 40)
Percent of parents who were satisfied:
Elementary school programming comparison (web responses)
2015
2016
2017
93% 93%
100%
90%95%95%
90%
100%
93%99%
96%
81%
100%94%
87%
0%
10%
20%
30%
40%
50%
60%
70%
80%
90%
100%
Advanced Courses
(N = 117)
AVID
(N = 4)
EL Services
(N = 2)
SpEd
(N = 34)
Other
(N = 13)
Percent of parents who were satisfied:
Middle school programming comparison (web responses)
2015
2016
2017
Figure 7. Percent of parents who were satisfied with their child’s school by level and by special programming from web responses.
Note: These percents include the calculation of parents who indicated that they “agree” and “somewhat agree” with the statements.
Figure 8. Percent of parents who were satisfied with their child’s school by level and by special programming from web responses.
Note: These percents include the calculation of parents who indicated that they “agree” and “somewhat agree” with the statements.

PARENT ATTITUDE AND SATISFACTION SURVEY REPORT March 1, 2018
Administered May, 2017 8
High School
Parents of students participating in honors courses and magnet programs reported the highest level of
satisfaction (90% and 86%, respectively). Increases in satisfaction over last year were observed for parents of
students participating in AVID, STEP and honors courses. Satisfaction reported by parents of students
receiving special education services experienced a decrease of 10% this year. Please note the sample size of a
group when interpreting the results.
When comparing the percent of satisfied high school parents whose child participated in athletics and other after
school activities and the percent of high school parents whose child did not participate in any activities, those
whose child participated were more likely to be satisfied, with a greater difference at the high school level.
91%96%
90% 89%95%
85%88% 91%
81%
70%
100%
89% 90%
79% 80%
91%
70%
82%79%
67%
90%86%
45%
78% 81% 82%
69%
0%
10%
20%
30%
40%
50%
60%
70%
80%
90%
100%
AVID
(N = 16)
EL Services
(N = 6)
Honors Courses/
AP/CIS
(N = 213)
Magnet
Programs
(N = 44)
Online Learning/
STEP Ahead/
Telepresence
coursework
(N = 8)
PSEO
(N = 27)
SpEd
(N = 39)
STEP
(N = 27)
Other
(N = 9)
Percent of parents who were satisfied:
High school programming comparison (web responses)
2015 2016 2017
95%90%93%
84%
0%
10%
20%
30%
40%
50%
60%
70%
80%
90%
100%
Middle School High School
Percent of parents who were satisfied:
Non-participants and participants in after school activities comparison (web responses)
Participates in activities
Does not participate in
activities
Figure 9. Percent of parents who were satisfied with their child’s school by level and by special programming from web responses.
Note: These percents include the calculation of parents who indicated that they “agree” and “somewhat agree” with the statements.
Figure 10. Percent of parents who were satisfied with their child’s school by participation in athletics or other after school activities from web responses.
Note: Parents with a child in elementary school were not asked if their child participated in athletics or other after school activities. These percents
include the calculation of parents who indicated that they “agree” and “somewhat agree” with the statements.
PARENT ATTITUDE AND SATISFACTION SURVEY REPORT March 1, 2018
Administered May, 2017 9
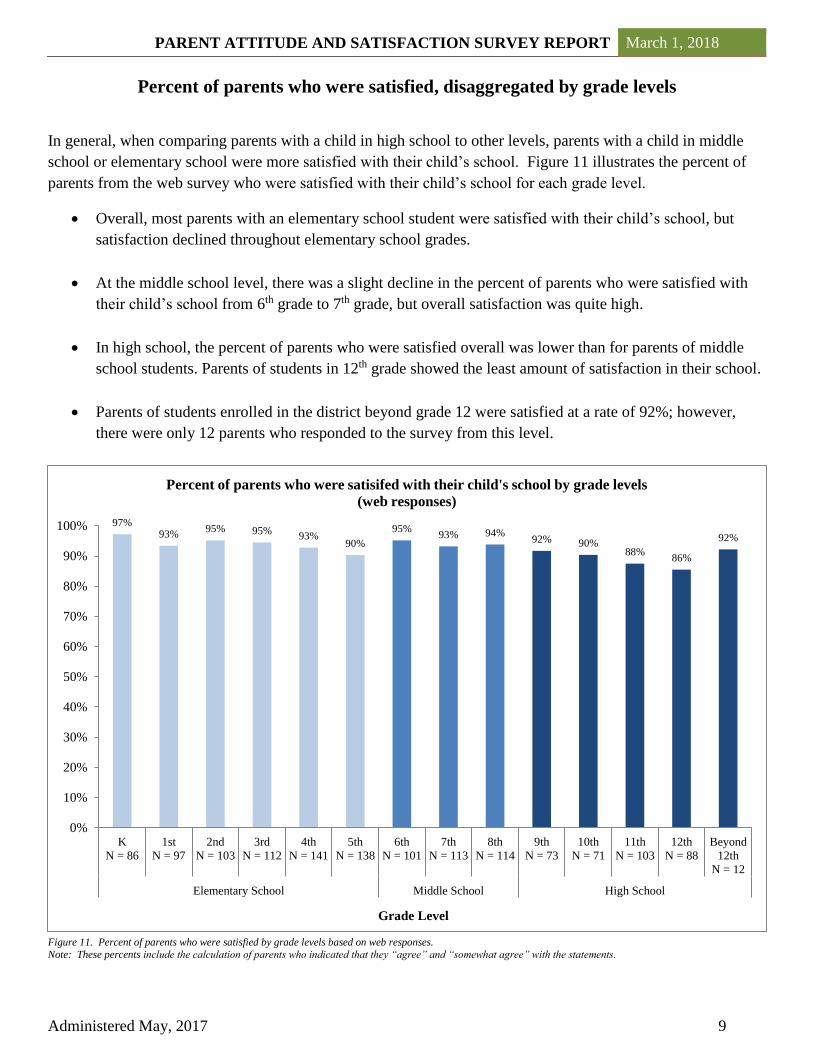
Percent of parents who were satisfied, disaggregated by grade levels
In general, when comparing parents with a child in high school to other levels, parents with a child in middle
school or elementary school were more satisfied with their child’s school. Figure 11 illustrates the percent of
parents from the web survey who were satisfied with their child’s school for each grade level.
Overall, most parents with an elementary school student were satisfied with their child’s school, but
satisfaction declined throughout elementary school grades.
At the middle school level, there was a slight decline in the percent of parents who were satisfied with
their child’s school from 6th grade to 7th grade, but overall satisfaction was quite high.
In high school, the percent of parents who were satisfied overall was lower than for parents of middle
school students. Parents of students in 12th grade showed the least amount of satisfaction in their school.
Parents of students enrolled in the district beyond grade 12 were satisfied at a rate of 92%; however,
there were only 12 parents who responded to the survey from this level.
97%93%
95% 95%93%
90%
95%93% 94%
92% 90%88%
86%
92%
0%
10%
20%
30%
40%
50%
60%
70%
80%
90%
100%
K
N = 86
1st
N = 97
2nd
N = 103
3rd
N = 112
4th
N = 141
5th
N = 138
6th
N = 101
7th
N = 113
8th
N = 114
9th
N = 73
10th
N = 71
11th
N = 103
12th
N = 88
Beyond
12th
N = 12
Elementary School Middle School High School
Grade Level
Percent of parents who were satisifed with their child's school by grade levels
(web responses)
Figure 11. Percent of parents who were satisfied by grade levels based on web responses.
Note: These percents include the calculation of parents who indicated that they “agree” and “somewhat agree” with the statements.

PARENT ATTITUDE AND SATISFACTION SURVEY REPORT March 1, 2018
Administered May, 2017 10
Percent of parents who were satisfied, disaggregated by school
This section disaggregates the percent of parents who were satisfied with their child’s school by each level
(elementary, middle, and high school).
Figure 12 illustrates the percent of parents who were satisfied with their child’s school disaggregated by
individual elementary schools. The black line in this graph represents the elementary average from the web
responses. The bars represent the schools’ overall satisfaction as an average of all of the item responses. Counts
for each school are listed in the table on page 16.
96% 97% 98%
93%
98%
90%
98%95%
80%
87%
92% 95% 92% 93%
90%83%
97%
80%
99%
93%96%
94%
99%
81%
0%
10%
20%
30%
40%
50%
60%
70%
80%
90%
100%
Ad
ams
An
dov
er
CB
PA
Cro
oked
Lak
e
Day
ton
Eis
enh
ow
er
Ev
erg
reen
…
Fra
nkli
n
Ham
ilto
n
Ho
over
Jeff
erso
n
Joh
nsv
ille
Lin
coln
Mad
iso
n
McK
inle
y
Mis
siss
ipp
i
Mo
nro
e
Mo
rris
By
e
Ox
bow
Cre
ek
Ram
sey
Rum
Riv
er
San
d C
reek
Un
iver
sity
Av
e
Wil
son
School
Percent of parents who were satisfied with their child's school:
Elementary school web responses
Figure 12. Percent of parents who were satisfied with their child’s school by elementary school based on web responses.
Note: These percents include the calculation of parents who indicated that they “agree” and “somewhat agree” with the statements.
Average = 93.5%

PARENT ATTITUDE AND SATISFACTION SURVEY REPORT March 1, 2018
Administered May, 2017 11
The percent of parents with a middle school student who were satisfied varied across individual schools with
Anoka, Jackson, and Oak View slightly above the district average. The black line represents the district middle
school average. Counts of respondents for each school are listed in the table on page 17.
For high school, overall satisfaction was fairly consistent across the five main high schools, with Blaine and
Coon Rapids above the high school average. The black line represents the district high school average. Please
note the low number of responses from Other Schools/Programs when interpreting the data. Counts of
respondents for each of the five traditional high schools are listed in the table on page 17.
97%93%
97%88%
95% 93%
0%
10%
20%
30%
40%
50%
60%
70%
80%
90%
100%
An
oka
Coo
n R
apid
s
Jack
son
No
rthd
ale
Oak
Vie
w
Roo
sev
elt
School
Percent of parents who were satisfied with their child's school:
Middle school web responses
87% 88% 91%86%
90%94%
0%
10%
20%
30%
40%
50%
60%
70%
80%
90%
100%
Andover Anoka Blaine Champlin Park Coon Rapids Other
Schools/Programs
(N=11)School
Percent of parents who were satisfied with their child's school:
High school web responses
Average = 94.2%
Figure 14. Percent of parents who were satisfied with their child’s school by high school based on web responses.
Note: These percents include the calculation of parents who indicated that they “agree” and “somewhat agree” with the statements.
Average = 88.6%
Figure 13. Percent of parents who were satisfied with their child’s school by middle school based on phone responses.
Note: These percents include the calculation of parents who indicated that they “agree” and “somewhat agree” with the statements.

PARENT ATTITUDE AND SATISFACTION SURVEY REPORT March 1, 2018
Administered May, 2017 12
Figure 15 illustrates the percent of parents who were satisfied with their child’s school disaggregated by
individual high school and alternative program from the phone responses. The black line in this graph
represents the average from phone responses. The bars represent the school’s overall satisfaction as an average
of all of the item responses. Counts of respondents for each school are listed in the table on page 18.
In general, a slightly lower percent of parents who took the phone survey (88%) reported satisfaction with their
child’s school than those who submitted web responses at the high school level (89%).
92%
80%
89% 89% 90% 89%84% 86% 82%
96%
0%10%20%30%40%50%60%70%80%90%
100%
A-H
Reg
ion
al
A-H
Tec
hnic
al
An
dov
er
An
oka
Bla
ine
Bri
dg
es
Cham
pli
n
Par
k
Coo
n R
apid
s
Pat
hw
ays
ST
EP
School
Percent of parents who were satisfied with their child's school:
High school phone responses Average = 87.5%
Figure 15. Percent of parents who were satisfied with their child’s school by high school based on phone responses.
Note: These percents include the calculation of parents who indicated that they “agree” and “somewhat agree” with the statements.

PARENT ATTITUDE AND SATISFACTION SURVEY REPORT March 1, 2018
Administered May, 2017 13
Examining the response rate for each survey item
The following table illustrates how parents from each school level responded to individual items on the 2017
parent satisfaction survey. This examination identifies items that were significantly greater than the column’s
overall average (green cells), items that were statistically equal to the column’s overall average, and items that
were significantly less than that grade level’s overall average (red cells). In general, one of the items, “I feel my
family is accepted at my student’s school,” was rated significantly greater than the overall average across the
elementary and high school levels on the web survey. However, “Teachers communicate regularly with me
about my student’s progress,” was rated significantly less than the overall average across all school levels.
Survey statements by level
Survey Statement
Elementary
Schools
Middle
Schools
High
Schools
Web Web Web Phone
Staff care about my student 97% 97% 91% 89%
School is safe 95% 98% 87% 84%
Teachers help my student 94% 93% 90% 91%
Teachers support me 93% 92% 84% 79%
Welcome at school 95% 96% 91% 90%
Respected at school 95% 95% 91% 88%
Family is accepted at school 96% 97% 94% 89%
Teachers challenge my student 92% 92% 87% 89%
Teachers communicate with me 85% 89% 77% 82%
All staff show my student respect 95% 93% 89% 86%
School has a good leadership 92% 94% 90% 89%
School provides quality education 94% 95% 93% 93%
Overall Average 93.5% 94.2% 88.6% 87.5%
Table 1. Survey statements by level.
Note: These percents include the calculation of parents who indicated that they “agree” and “somewhat agree” with the statements.
Cell value is statistically equal
to column’s overall average
Cell value is significantly greater
than column’s overall average
Cell value is significantly less
than column’s overall average

PARENT ATTITUDE AND SATISFACTION SURVEY REPORT March 1, 2018
Administered May, 2017 14
Organized by level, the following figures illustrate the percent of parents who indicated that they “agree” or
“somewhat agree” with each statement.
As a group, 94% of parents with an elementary school student who responded to the web survey were satisfied
with their child’s school overall. Of all the statements parents were asked to respond to, the lowest proportion
of parents (85%) agreed with the statement, “Teachers communicate progress with me.”
Of parents with a child in middle school, 94% indicated that they were satisfied with their child’s school
overall. About 90% of parents with a middle school child indicated that they “agree” or “somewhat agree” that
teachers communicated regularly with them about their child’s progress. This item ranked lower than the other
items on the survey. Approximately 98% of parents with a middle school child indicated they “agree” or
“somewhat agree” that the school is safe, up 2% from last year, making it the most highly rated item.
97%
96%
95%
95%
95%
95%
94%
94%
93%
92%
92%
85%
0% 10% 20% 30% 40% 50% 60% 70% 80% 90% 100%
Teachers and staff care about my student
I feel my family is accepted at my student's school
I feel welcome at my student's school
I feel respected at my student's school
School is safe
All staff show my student respect
School provides quality education
Teachers help my student when needed
Teachers support me
School has good leadership
Teachers challenge my student
Teachers communicate progress with me
Parent Web Responses: Elementary Schools
98%
97%
97%
96%
95%
95%
94%
93%
93%
92%
92%
90%
0% 10% 20% 30% 40% 50% 60% 70% 80% 90% 100%
School is safe
Teachers and staff care about my student
I feel my family is accepted at my student's school
I feel welcome at my student's school
School provides quality education
I feel respected at my student's school
School has good leadership
All staff show my student respect
Teachers help my student when needed
Teachers support me
Teachers challenge my student
Teachers communicate progress with me
Parent Web Responses: Middle Schools
Figure 16. Percent of parents with an elementary school student who responded via web who “agree” or “somewhat agree” with each statement.
Figure 17. Percent of parents with a middle school student who “agree” or “somewhat agree” with each statement from the web surveys.

PARENT ATTITUDE AND SATISFACTION SURVEY REPORT March 1, 2018
Administered May, 2017 15
Approximately 89% of parents with a child in high school reported that they were satisfied with their child’s
school overall. The percent of parents with a high school child who indicated that they “agree” or “somewhat
agree” with the statement “Teachers communicate regularly with me about my student’s progress” was the
lowest at 77%.
Comparing the same statements, as a group, 88% of parents who responded on the phone survey were satisfied
with their child’s school overall, with the satisfaction for each statement ranging from 79% to 93%.
Approximately 79% of parents indicated that, “Teachers in this school support me in helping my student learn
at home,” ranking lower than the next lowest statement by 3%.
93%
91%
91%
91%
91%
90%
89%
87%
87%
87%
84%
77%
0% 10% 20% 30% 40% 50% 60% 70% 80% 90% 100%
School provides quality education
I feel respected at my student's school
I feel welcome at my student's school
Teachers and staff care about my student
Teachers help my student when needed
School has good leadership
All staff show my student respect
Teachers challenge my student
I feel my family is accepted at my student's school
School is safe
Teachers support me
Teachers communicate progress with me
Parent Web Responses: High Schools
93%
91%
90%
89%
89%
89%
89%
88%
86%
84%
82%
79%
0% 10% 20% 30% 40% 50% 60% 70% 80% 90% 100%
School provides quality education
Teachers help my student when needed
I feel welcome at my student's school
School has good leadership
I feel my family is accepted at my student's school
Teachers and staff care about my student
Teachers challenge my student
I feel respected at my student's school
All staff show my student respect
School is safe
Teachers communicate progress with me
Teachers support me
Parent Phone Responses: High Schools
Figure 18. Percent of parents with a high school student who “agree” or “somewhat agree” with each statement from the web surveys.
Figure 19. Percent of parents with an elementary school student who responded via phone who “agree” or “somewhat agree” with each statement.

PARENT ATTITUDE AND SATISFACTION SURVEY REPORT March 1, 2018
Administered May, 2017 16
Web survey responses by elementary schools (Adams – Lincoln)
Statement Adams Andover CBPA Crooked
Lake Dayton Eisenhower
Evergreen
Park Franklin Hamilton Hoover Jefferson Johnsville Lincoln
Number of respondents 7 68 30 28 31 25 5 8 10 14 26 55 12
Staff care about my student 100% 100% 100% 96% 100% 92% 100% 100% 90% 93% 100% 100% 92%
School is safe 100% 99% 100% 93% 97% 84% 100% 100% 90% 86% 100% 95% 92%
Teachers help my student 100% 97% 100% 96% 100% 92% 100% 100% 90% 86% 77% 98% 92%
Teachers support me 86% 99% 93% 93% 100% 84% 100% 88% 80% 86% 92% 96% 83%
I feel welcome 100% 96% 100% 96% 100% 96% 100% 100% 80% 86% 92% 93% 100%
I feel respected 100% 97% 100% 96% 100% 96% 100% 100% 70% 93% 92% 98% 100%
My family is accepted 100% 100% 100% 96% 97% 100% 100% 100% 70% 93% 96% 98% 100%
Teachers challenge my student 86% 93% 97% 93% 94% 92% 100% 75% 90% 93% 88% 95% 92%
Teachers communicate progress 86% 88% 87% 85% 87% 76% 100% 75% 70% 71% 76% 87% 83%
All staff show my student respect 100% 99% 100% 93% 100% 92% 100% 100% 70% 93% 100% 94% 92%
School has good leadership 100% 97% 97% 79% 100% 84% 80% 100% 70% 86% 96% 92% 92%
School provides quality education 100% 99% 100% 96% 97% 92% 100% 100% 90% 79% 96% 96% 92%
Overall Average (web) 95.7% 96.7% 98.0% 92.8% 97.7% 90.4% 100.0% 95.0% 80.0% 87.1% 92.3% 95.2% 92.5%
Table 2. Survey statements by elementary schools (Adams to Lincoln). Note: These percents include the calculation of parents who indicated that they “agree” and “somewhat agree” based on web responses.
Web survey responses by elementary schools (Madison – Wilson and All Elementary)
Statement Madison McKinley Mississippi Monroe Morris Bye Oxbow
Creek Ramsey
Rum
River
Sand
Creek
University
Ave Wilson All Elem Schools
Number of respondents 26 47 16 36 14 48 62 50 30 12 20 681
Staff care about my student 92% 96% 81% 97% 86% 100% 97% 98% 100% 100% 90% 97%
School is safe 96% 91% 88% 97% 86% 100% 94% 98% 100% 100% 75% 95%
Teachers help my student 96% 89% 81% 97% 93% 98% 95% 94% 93% 100% 80% 94%
Teachers support me 92% 91% 81% 97% 86% 100% 90% 94% 90% 100% 75% 93%
I feel welcome 96% 96% 94% 97% 64% 100% 95% 96% 97% 100% 85% 95%
I feel respected 96% 91% 88% 97% 64% 100% 94% 96% 97% 100% 85% 95%
My family is accepted 96% 89% 94% 97% 86% 100% 97% 96% 93% 100% 95% 96%
Teachers challenge my student 92% 89% 75% 94% 83% 98% 88% 96% 90% 100% 79% 92%
Teachers communicate progress 73% 81% 75% 94% 64% 96% 85% 96% 80% 92% 70% 85%
All staff show my student respect 96% 89% 81% 100% 93% 98% 94% 96% 90% 100% 80% 95%
School has good leadership 92% 89% 81% 92% 71% 100% 92% 94% 97% 100% 85% 92%
School provides quality education 96% 87% 75% 97% 86% 100% 94% 94% 97% 100% 75% 94%
Overall Average (web) 93.1% 90.0% 82.5% 96.7% 80.4% 99.2% 92.9% 95.8% 93.7% 99.2% 81.4% 93.5%
Table 3. Survey statements by elementary schools (Madison to Wilson) and the overall elementary school percentages. Note: These percents include the calculation of parents who indicated that they “agree”
and “somewhat agree” with the statements based on web responses.
Cell value is statistically equal
to column’s overall average
Cell value is significantly less
than column’s overall average
Cell value is significantly greater
than column’s overall average

PARENT ATTITUDE AND SATISFACTION SURVEY REPORT March 1, 2018
Administered May, 2017 17
The percent of parents with a middle school child who indicated that they “agree” or “somewhat agree” with
each statement did not vary greatly within the school for each of the middle schools.
Table 4. Web survey statements by middle schools. Note: These percents include the calculation of parents who indicated that they “agree” and “somewhat agree”.
The percent of parents with a high school child who indicated that they “agree” or “somewhat agree” with the
statements was fairly consistent across statements, demonstrated by the few significant results.
Table 5. Web survey statements by high school. Note: These percents include the calculation of parents who indicated that they “agree” and “somewhat agree”.
Web survey responses by middle schools
Statement Anoka Coon
Rapids Jackson Northdale Oak View Roosevelt
All middle
schools
Number of respondents 60 38 70 39 59 64 334
Staff care about my student 98% 97% 99% 92% 98% 94% 97%
School is safe 100% 100% 100% 90% 98% 97% 98%
Teachers help my student 98% 89% 94% 90% 92% 89% 93%
Teachers support me 97% 84% 93% 85% 95% 94% 92%
I feel welcome 98% 97% 99% 90% 100% 91% 96%
I feel respected 97% 92% 99% 87% 97% 92% 95%
My family is accepted 98% 97% 99% 90% 98% 95% 97%
Teachers challenge my student 93% 92% 91% 85% 88% 97% 92%
Teachers communicate progress 90% 79% 97% 85% 86% 92% 89%
All staff show my student respect 95% 95% 97% 90% 90% 89% 93%
School has good leadership 95% 97% 99% 85% 98% 89% 94%
School provides quality education 100% 95% 99% 85% 97% 92% 95%
Overall Average (web) 96.6% 93.1% 97.0% 87.5% 94.7% 92.6% 94.2%
Web survey responses by high schools
Statements Andover Anoka Blaine Champlin
Park Coon Rapids
All high
schools
Number of respondents 76 59 89 68 47 350
Staff care about my student 87% 90% 93% 93% 91% 91%
School is safe 95% 90% 89% 75% 81% 87%
Teachers help my student 86% 92% 91% 93% 91% 90%
Teachers support me 81% 83% 85% 85% 83% 84%
I feel welcome 89% 85% 95% 91% 91% 91%
I feel respected 87% 86% 95% 91% 96% 91%
My family is accepted 89% 93% 97% 94% 96% 94%
Teachers challenge my student 86% 86% 93% 81% 89% 87%
Teachers communicate progress 81% 85% 72% 66% 81% 77%
All staff show my student respect 80% 84% 93% 88% 98% 89%
School has good leadership 87% 90% 93% 90% 89% 90%
School provides quality education 93% 91% 96% 88% 94% 93%
Overall Average (web) 86.9% 87.8% 91.0% 86.1% 90.0% 88.6%
Cell value is significantly less
than column’s overall average
Cell value is statistically equal to
column’s overall average
Cell value is significantly greater
than column’s overall average
Cell value is significantly greater
than column’s overall average
Cell value is statistically equal
to column’s overall average
Cell value is significantly less
than column’s overall average

PARENT ATTITUDE AND SATISFACTION SURVEY REPORT March 1, 2018
Administered May, 2017 18
Cell value is significantly greater
than column’s overall average
Cell value is statistically equal
to column’s overall average
Cell value is significantly less
than column’s overall average
Phone Interview Final Question
When parents surveyed over the phone were asked the open-ended question, “How would you describe the
Anoka-Hennepin School District to friends and family members?”, approximately 18% of parents surveyed over
the phone responded they would describe the district as excellent. Other common responses were average, good
academics, good teachers, and well-run. A few parents indicated other responses including good special
education program, poor special education program, like diversity, poor teachers, poor quality and meets
students’ needs.
Phone survey responses by surveyed high school/program
Statements A-H
Regional
A-H
Technical Andover Anoka Blaine Bridges
Champlin
Park
Coon
Rapids Pathways STEP
All
HS Phone
Number of respondents 111 91 239 248 254 64 252 243 69 16 1587
Staff care about my student 93% 82% 95% 90% 93% 86% 83% 88% 83% 94% 89%
School is safe 98% 68% 84% 91% 91% 86% 75% 84% 65% 94% 84%
Teachers help my student 91% 89% 94% 94% 92% 91% 87% 92% 90% 100% 91%
Teachers support me 76% 73% 83% 87% 80% 73% 77% 74% 88% 88% 79%
I feel welcome 98% 82% 87% 90% 92% 92% 90% 87% 90% 100% 90%
I feel respected 98% 82% 86% 88% 91% 94% 88% 86% 86% 94% 88%
My family is accepted 95% 77% 90% 90% 93% 95% 89% 85% 84% 100% 89%
Teachers challenge my
student 89% 78% 90% 92% 89% 86% 88% 91% 84% 100% 89%
Teachers communicate
progress 95% 68% 88% 75% 87% 94% 69% 90% 68% 100% 82%
All staff show my student
respect 83% 82% 91% 88% 89% 84% 84% 84% 81% 88% 86%
School has good leadership 90% 86% 90% 90% 90% 95% 90% 87% 81% 100% 89%
School provides quality
education 93% 90% 91% 94% 96% 95% 95% 90% 86% 100% 93%
Overall Average (phone) 91.5% 79.9% 88.9% 89.1% 90.1% 89.3% 84.4% 86.5% 82.1% 96.4% 87.5%
Table 6. Survey statements by elementary school surveyed via phone.
Note: These percents include the calculation of parents who indicated that they “agree” and “somewhat agree” with the statements based on phone responses.
Response Number of
Respondents
Percent of
Parents Response
Number of
Respondents
Percent of
Parents
Excellent 277 17.5% Good communication 102 6.4%
Average 248 15.6% Poor communication 77 4.9%
Good academics 225 14.2% Bullying 53 3.3%
Good teachers 184 11.6% Large class sizes 50 3.2%
Well-run 182 11.5% Scattered 28 1.8%
Big/large district 133 8.4% Other responses 22 1.4%
Table 7. Parent follow-up responses to teachers’ communication based on phone responses.
PARENT ATTITUDE AND SATISFACTION SURVEY REPORT March 1, 2018
Administered May, 2017 19
Trend Data:
Percent of parents who indicated they “agree” with each statement from the web survey
(Does not include “somewhat agree”)
The following figures illustrate the percent of parents over the past five years who indicated that they “agree”
with each statement. Overall, ratings increased for 3 of the 12 items at the elementary level, 7 at the middle
school level, and 4 at the high school level.
The percent of parents who “agree” with the statement, “In this school, teachers and staff care about my
student” has remained fairly constant this year compared to last year, decreasing slightly at the elementary and
high school levels.
The percent of parents who “agree” with the statement, “My student’s school is safe” decreased across all levels
in 2017.
0%
10%
20%
30%
40%
50%
60%
70%
80%
90%
100%
2013 2014 2015 2016 2017
Percent of parents who reported that the school, teachers and staff care about their
student
Elementary
Middle
High
0%
10%
20%
30%
40%
50%
60%
70%
80%
90%
100%
2013 2014 2015 2016 2017
Percent of parents who reported that their student's school is safe
Elementary
Middle
High
Figure 20. Percent of parents who indicated that they “agree” that the school, teachers and staff care about their student. Does not include
“somewhat agree”.
Figure 21. Percent of parents who indicated that they “agree” that their student’s school is safe. Does not include “somewhat agree”.

PARENT ATTITUDE AND SATISFACTION SURVEY REPORT March 1, 2018
Administered May, 2017 20
The percent of parents who “agree” with the statement “Teachers provide help for my student when needed”
continued to increase in 2017 at the middle school and high school levels.
In 2017, the percent of parents who “agree” with the statement “Teachers in this school support me in helping
my student learn at home” decreased at the elementary and middle school levels, but continues to increase at
the high school level.
0%
10%
20%
30%
40%
50%
60%
70%
80%
90%
100%
2013 2014 2015 2016 2017
Percent of parents who reported that teachers provided help for their student when
needed
Elementary
Middle
High
0%
10%20%
30%
40%50%
60%
70%80%
90%
100%
2013 2014 2015 2016 2017
Percent of parents who reported that teachers supported them in helping their student
learn at home
Elementary
Middle
High
Figure 22. Percent of parents who “agree” that teachers provided help for their student when needed. Does not include “somewhat agree”.
Figure 23. Percent of parents who “agree” that teachers supported them in helping their student learn at home. Does not include “somewhat
agree”.

PARENT ATTITUDE AND SATISFACTION SURVEY REPORT March 1, 2018
Administered May, 2017 21
The percent of parents who “agree” with the statement “I feel welcome at my student’s school” increased from
2016 at the elementary and middle school levels. High school ratings decreased after several years of increases.
The statement “I feel respected at my student’s school” was a new item in 2015, so only three years of data are
available. The percent of parents agreeing with this statement has remained relatively stable over the three years
of administration.
0%
10%
20%
30%
40%
50%
60%
70%
80%
90%
100%
2013 2014 2015 2016 2017
Percent of parents who reported that they felt welcomed at their student's school
Elementary
Middle
High
0%
10%
20%
30%
40%
50%
60%
70%
80%
90%
100%
2015 2016 2017
Percent of parents who reported that they felt respected at their student's school
Elementary
Middle
High
Figure 24. Percent of parents who “agree” that they felt welcomed at their student’s school. Does not include “somewhat agree”.
Figure 25. Percent of parents who “agree” that they felt welcomed at their student’s school. Does not include “somewhat agree”.

PARENT ATTITUDE AND SATISFACTION SURVEY REPORT March 1, 2018
Administered May, 2017 22
The statement “I feel my family is accepted at my student’s school” was also a new item in 2015. This
statement had a greater percent of parents who “agreed” than any other item at every level.
The percent of parents who “agree” with the statement “Teachers in this school challenge my student to do his
or her best in school work” continued to increase for parents of middle school students. Parents at the
elementary and high school levels reported decreased levels of agreement.
0%
10%
20%
30%
40%
50%
60%
70%
80%
90%
100%
2015 2016 2017
Percent of parents who reported that they felt their family is accepted at their student's
school
Elementary
Middle
High
0%
10%
20%30%
40%
50%
60%
70%
80%
90%
100%
2013 2014 2015 2016 2017
Percent of parents who reported that teachers in their student's school challenge their
child to do his or her best in school
Elementary
Middle
High
Figure 27. Percent of parents who “agree” that they thought teachers in their student’s school challenge their student to do his or her best in school work. Does not
include “somewhat agree”.
Figure 26. Percent of parents who “agree” that they felt welcomed at their student’s school. Does not include “somewhat agree”.

PARENT ATTITUDE AND SATISFACTION SURVEY REPORT March 1, 2018
Administered May, 2017 23
The percent of parents who “agree” with the statement “Teachers communicate regularly with me about my
student’s progress” has generally increased over the past five years with slight decreases this year at the middle
school and high school levels. The percent of parents with elementary students who “agree” continues to
increase.
In 2017, the percent of parents who “agree” with the statement “All staff, including teachers, administrators,
and support staff show my student respect in school” increased slightly for parents at all levels. This statement
has remained relatively stable over the past three years.
0%
10%
20%
30%
40%
50%
60%
70%
80%
90%
100%
2013 2014 2015 2016 2017
Percent of parents who reported that teachers communicate regularly with them about
their student's progress
Elementary
Middle
High
0%
10%
20%
30%
40%
50%
60%
70%
80%
90%
100%
2013 2014 2015 2016 2017
Percent of parents who reported that all staff, including teachers, administrators, and
support staff show their student respect in school
Elementary
Middle
High
Figure 28. Percent of parents who “agree” that teachers communicate regularly with them about their student’s progress. Does not include
“somewhat agree”.
Figure 29. Percent of parents who “agree” that all staff, including teachers, administrators, and support staff show their student respect in school. Does not include
“somewhat agree”.

PARENT ATTITUDE AND SATISFACTION SURVEY REPORT March 1, 2018
Administered May, 2017 24
The percent of parents who “agree” with the statement “This school has a good leadership team and is well
led” has generally increased over the last five years with a slight dip this year at the elementary level.
The percent of parents who “agree” with the statement “Overall, my student’s school provides a quality
education” increased for parents of middle school students and remained steady for parents of elementary and
high school students in 2017.
0%
10%
20%
30%
40%
50%
60%
70%
80%
90%
100%
2013 2014 2015 2016 2017
Percent of parents who reported that the school has a good leadership team and is well led
Elementary
Middle
High
0%
10%
20%
30%
40%
50%
60%
70%
80%
90%
100%
2013 2014 2015 2016 2017
Percent of parents who reported that their student's school provides a quality education
Elementary
Middle
High
Figure 30. Percent of parents who “agree” that the school has a good leadership team and is well led. Does not include “somewhat agree”.
Figure 31. Percent of parents who “agree” that their student’s school provides a quality education. Does not include “somewhat agree”.

PARENT ATTITUDE AND SATISFACTION SURVEY REPORT March 1, 2018
Administered May, 2017 25
This report was generated by the Research, Evaluation, and Testing department of the Anoka-Hennepin School
District. For further information, please visit the RET website, www.ahschools.us/ret, or call (763) 506-1000
and request the RET department.