Embed Size (px)
Citation preview

Eur Respir J, 1993, 6, 698-704 Printed In UK - all rights reserved
Copyright @ERS Journals Ltd 1993 European Respiratory Journal
ISSN 0903 - 1936
Parenchymal emphysema measured by CT lung density correlates with lung function in patients with bullous disease
G.A. Gould*, A.T. Redpath**, M. Ryan+, P.M. Warren*, J.J.K. Best.., E.J.W. Cameron*, W. MacNee*
Parenchyma/ emphysema measured by CT lung density co"elates with lung function in patients with bullous disease. G.A. Gould, A.T. Redpath, M. Ryan, P.M. Warren, J.J.K. Best, E.J. W. Cameron, W. MacNee. @ERS Journals Ltd 1993. ABSTRACT: In subjects with chronic obstructive pulmonary disease (COPD) computed tomographic (CT) lung density correlates with direct pathological measurements of the size of the distal airspaces, as well as with measurements of airflow limitation and impairment of the diffusing capacity. Thus, CT lung density can be used to quantify emphysema in life. We wanted to assess the use of CT scanning to detect and measure the extent of bullous lung, and to quantify the severity of emphysema in the non-bullous areas of the lungs.
In patients with bullous emphysema (21 males and 2 females; aged 31-69 yrs; forced expiratory volume in one sewnd (FEV1) 14-84% predicted; volume corrected diffusing capacity of the lungs for carbon monoxide (DLCO/VA) 17-114% predicted). CT lung density was measured in electromagnetic imaging (EMI) units.
The extent of bullous emphysema correlated poorly with all respiratory function measurements. In contrast, the severity of emphysema in the non-bullous parts of the lungs, expressed as either the mean EMI number, or the EMI number of the lowest 5th percentile of the CT lung density histogram, correlated well with measurements of airflow limitation and diffusing capacity.
Our findings, thus, suggest that in patients with bullae the major determinant of respiratory function is the severity of the emphysema in non-bullous lung, and that the extent of the bullae bas less functional importance. We therefore suggest that CT scanning is useful in the assessment of patients with bullous disease, since it not only accurately defmes the extent and site of the bullae, but also assesses the severity of emphysema in the non-bullous regions of the lungs, a factor which may influence respiratory function and the outcome of surgical intervention. Eur Respir J., 1993, 6, 698-704.
* Unit of Respiratory Medicine, Dept of Medicine (RJE), ... Depts of Thoracic Surgery, u Medical Physics, and • Medical Radiology, City Hospital, Edinburgh, Scotland, UK.
Correspondence: W. MacNee Unit of Respiratory Medicine City Hospital Edinburgh EHIO 5SB Scotland, UK
Keywords: Airways bullae computed tomographic scanning emphysema obstruction
Received: February 5 1992 Accepted after revision January 23 1993
This srudy was supported by the Nonnan Salvesan Emphysema Research Trust.
Medical treatment of emphysema is unsatisfactory. A small number of patients with this disease will have localized bullae which are amenable to surgery [ 1, 2]. Bullae may occur in subjects with otherwise healthy lungs. However, most bullae develop in smokers with centrilobular emphysema. Consideration for surgery is most often given to those patients presenting with dyspnoea [1-3]. A successful outcome of surgical intervention can be expected with large bullae (more than a third of the hemithorax), when the surgical procedure is kept to a minimum, and when the remaining non-bullous lung is healthy [3-5]. However, some studies claim useful functional improvement even in the presence of severe diffuse emphysema and airflow limitation [3, 4].
ratory function, or by the relief of symptoms [3, 4, 6-9].
Careful preoperative assessment is essential to ensure the selection of those patients who are most likely to benefit from surgery, since there is a significant operative mortality, and a number of patients derive little benefit from surgery, either by objective improvement in respi-
High resolution computed tomography (Cf) images can easily locate bullae, even when they are not visible on plain chest radiographs [10, 11], and can also give information about the presence and severity of macroscopic disease in the remaining lung tissue [12, 13].
We have previously demonstrated, in a group of patients undergoing lung resection, that lung density derived from analysis of CT density histograms (in electromagnetic imaging (EMI) units), correlates well with quantitative pathological measurements of the severity of emphysema. derived from morphometric measurements of distal airspace size [14]. In a group of 80 cigarette smokers, er lung density correlated both with the severity of airflow limitation and impairment of the diffusing capacity of the lung for carbon monoxide (DLCo) [15]. In this study, we have applied CT scanning, as a measure of emphysema. to 23 subjects with bullous emphysema, to
er SCANNJNG IN BULLOUS EMPHYSEMA 699
determine the relative contributions of bullous disease and emphysema in non-bullous lung to the functional impairment in such patients.
Patients and methods
We studied 23 patients (21 males and 2 females; aged 31-69 yrs; all smokers) who had obvious bullae on their chest radiographs. All of the patients were clinically stable, and had been free of infection for at least 6 weeks prior to the study. Each patient gave informed consent, and the study was approved by the local Ethics Committee.
Assessment of respiratory function was carried out 1-21 days before the er scan. Four of the patients subsequently had surgery for their bullous disease, and they were studied immediately before and approximately 6 months after the operation. The selection for surgery was made independent of the results of er scanning. Respiratory symptoms and smoking history were recorded using the British Medical Research Council (MRC) questionnaire. Forced expiratory volume in one second (FEV) and vital capacity (VC) were measured using a 7 l dry spirometer (Vitalograph Ltd, UK), and lung volumes were measured both by body plethysmography (Pulmorex, Fenyves and Gut, Base!, Switzerland) and by the helium dilution technique (PK Morgan, UK). Single breath diffusing capacity was measured by the method of OoiLVIE et al. [16] (Automatic Transfer Test, Model A System, PK Morgan, UK), with the breathholding time calculated by the modified JoNES and MEADE technique [17]. In men, normal predicted values were taken from CRAPO and eo-workers [ 18] for FEV
1 and VC, CRAPO and
eo-workers [19] for total lung capacity (TLC) and residual volume (RV), Cotes [20] for DLCo, and CoTES and HALL [21] for the volume corrected diffusing capacity for carbon monoxide (DLCoN A). In women, normal predicted values were taken from HALL et al. [22] for FEY,, VC, TLC and RV, BILLIET et al. [23] for DLCo, and CoTES and HALL [21] for DLCoN A. Exercise tolerance was assessed by the 12 min walking distance [24].
All scans were performed during arrested deep inspiration, using an EMI CT5005 scanner, with a 20 s scan time and a slice thickness of 13 mm. The scanner was calibrated daily with a water phantom. The CT density measured by this scanner is linearly related to tissue density in the range 0.001 gm·cm·3 (air), and 1.0 gm·cm·3
(water) [25, 26], which covers the range of normal lung tissue. CT density is expressed in EMI units (where water=O, and air=-500, 1 Hounsfield Unit=2 EMI units). Normal lung tissue has a er density from -200 to -450 EMI units [27].
A whole chest scan was carried out, with cuts taken at 3 cm intervals. The lung fields were outlined by a density discriminatory programme. A cumulative frequency histogram of the pixel densities for all CT cuts was generated by a computer (figs la and 2a). Areas of bullous lung were identified by viewing scans in which low density pixels (EMI No. below -450) were highlighted by the computer. Bullae were identified as discrete confluent areas of low density, visible over two or
more adjacent CT cuts, usually with a convex outline and an absence of lung tissue within the bulla (fig lb and 2b). For each er cut, the area of lung occupied by the buUa was estimated by eye to the nearest quartile of the total area of the lung field. The total extent of the bullae was calculated as the number of quartiles occupied by bullae, divided by the total number of quartiles in the whole thorax.
7.0
6.0
5.0
4.0
3.0
~ a: 2.0
1.0
0 -500 -460 -420 -380 -340 ·300 -260 -220
EM! number
Fig. t. - a) Computed tomographic (CT) density histograms of a single subject, comparing er cuts from the whole lung, including bullae (interrupted line) and er cuts from non-bullous lung only (continuous line). The EMI No. of the lowest 5th percentile for each distribution is shaded. The subject was male, aged 35 yrs; forced expiratory volume in one second (FEY
1) 65% predicted; volume adjusted
diffusing capacity of the lung for carbon monoxide (Du:oN A) 58% predicted. --- - : all cuts, EM! 5th percentile =-487; --: edited cuts, EM! 5th percentile =-436. EM!: electromagnetic imaging. b) er scan from this subject demonstrating a left upper lobe bulla highlighted by the computer. Low density pixels (EM! No. lower than -450) have been highlighted in white. The remaining lung has a relatively normal appearance.
700 G.A. GOULD ET AL.
9.0
8.0
7.0
-g N 6.0 'a e 0 c:: 5.0 ~ c: <I> :::1 4.0 I Q; X 0: 3.0
2.0
1.0
0
.-· I
r1 : ~. ,.., '·· ~· 1.' t,
I
' '1 ·.,
L:
-500 ·460 -420 -380 -340 ·300 ·260 ·220
EMI number
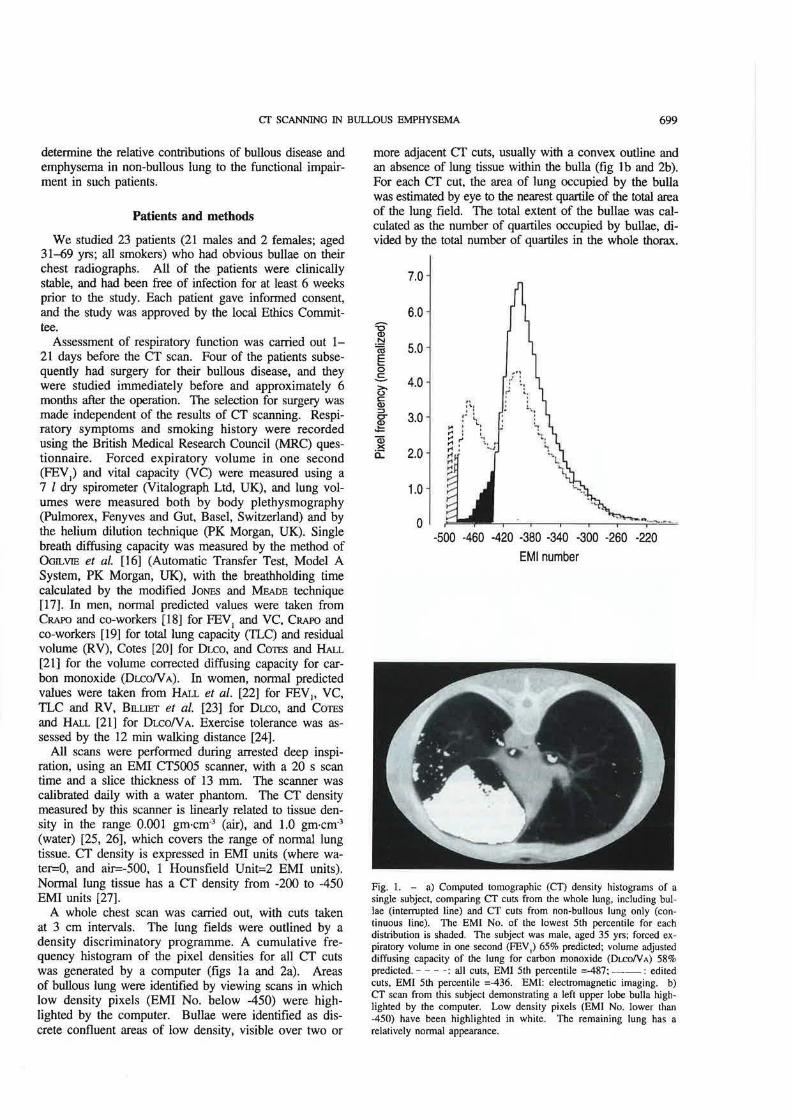
Fig. 2. - a) Computed tomographic (Cl) density histograms from male subject, (aged 66 yrs; FEV
1 23% predicted; Du:.oN A 29% pre
dicted) comparing er cuts from the whole lung, including bullae (interrupted line) and er cuts from non-bullous lung only (continuous line). The BMI No. of the lowest 5th percentile for each distribution is shaded. - - - · : all cuts, BMI 5th percentile =-495; --: edited cuts, EMI 5th percentile =-481. b) Highlighted er scan from this subject. A massive bulla occupies the right lung field and the left lung shows widespread parenchyma! emphysema. For abbreviations see legend to figure l.
The top one or two er cuts, which include a smaller area of the lung apices, were allocated two quartiles each. A frequency histogram of pixel densities for the er cuts which did not contain any part of a bullae (i.e. non-bullous lung parenchyma) was then generated (figs la, 2a and 3). The mean EMI number of this distribution, and
the EMI number marking the lowest 5% of the distribution, were then recorded. The latter value should relate better to the density of lung parenchyma, since the mean EMI value of the density histogram is affected by the presence within the lung field of high density pixels representing blood vessels, large airway walls, and small areas of atelectasis. This was confirmed in our two previous studies [14, 15].
Measurements of respiratory function were correlated with the following er variables: I) Mean EMI number of non-bullous lung; 2) lowest 5th percentile EMI number of non-bullous lung; and 3) percentage area of the lungs occupied by bullae.
Fig. 3. - Computed tomographic (er) cuts of non-bullous lung used only for determination of lung density for correlation with respiratory function. StN: sterna! notch.
We have previously shown significant correlations between lung er density and measurements of airflow limitation, hyperinflation and diffusing capacity, in a group of smokers with chronic obstructive pulmonary disease (COPD) but without obvious bullae [15]. These subjects had a very wide range of age (63 males and 17 females; 23-82 yrs) and respiratory function (FEV1 8- 116% predicted; Dr.r.oN A 15- 139% predicted). That study suggested that lung physical density (which relates to the severity of emphysema) is a major determinant of lung function [15]. We therefore compared the results obtained in those subjects with COPD [15] to the results obtained in the group of subjects in the present study with bullous disease, to determine whether the same relationships apply.
Statistical analysis
Correlations between respiratory function and er measurements were made using least squares linear regression analysis.
Results
Physical characteristics, respiratory function and CT measurements for the 23 subjects are shown in table I . The subjects showed a wide range of values for all measurements, although most had some degree of airflow

er SCANNING IN BUlLOUS EMPHYSEMA 701
limitation, hyperinflation, and impairment of the DLco. All 23 subjects were current or ex-smokers.
The extent of bullous disease varied widely, ranging from 5-63% of the area of the er scan. The extent of the bullous disease correlated weakly with all measurements of respiratory function. Thus, the extent of bullous emphysema was a very poor predictor of functional impainnent, compared with other factors (table 2).
Table 1. - Physical characteristics, respiratory function and lung CT density measurements in 23 subjects with bullous emphysema, including postoperative data in four subjects
n Range Mean
Age yrs 27 31-66 56 Height cm 27 156-192 176 FEV1 l 27 0.45-3.55 1.5 FEV
1 % pred 27 14-84 40
FVCI 27 1.4-6.3 3.3 FVC % pred 27 32-124 71 FEV/FVC % 27 22-68 42 FEY/FVC % pred 27 26-90 53 RV I 23 1.7-8.4 5.1 RV % pred 23 106-365 237 TLC/ 23 6.1-10.7 8.5 TLC % pred 23 95-154 127 RV!fLC % 23 26-83 59 RVffLC % pred 23 108-241 181 DLCO ml·min·1·nunHg·1 26 3.4-26.0 13.2 DLCO % pred 26 15-80 46 DLCO!V A ml·min·1·nunHg·1 26 0.75-4.86 2.61 DLCON A % pred 26 17-114 59 12 MD m 24 270-1380 779 % Bullous lung 27 5-63 27 er 5th percentile 27 -428 to -491 -463 er mean 27 -351 to -435 -410
er: computed tomography; FEY1: forced expiratory volume in
one second; % pred: percentage predicted of normal value; FVC: forced vital capacity; RV: residual volume; TLC: total lung capacity; DLCO: diffusing capacity of the lung for carbon monoxide; DLCON A: volume corrected diffusing capacity; 12 MD: 12 min walking distance; % bullous lung: percentage of area of lung occupied by bullae as estimated by er scan; er 5th percentile; EMI No. at lowest 5th percentile of the density distribution for non-bullous lung; er mean: mean EMI No. of the density for non-bullous lung; EMI: electromagnetic imaging.
Table 2. - Correlation coefficients (r values) between respiratory function measurements and measurements of CT lung density
FEV1
% pred FEV/FVC % pred FVC % pred RV % pred 1LC % pred RY!fLC % pred DLCO % pred Du:oN A % pred 12 MD % area bullous
er 5th percentile non-bullous lung
-0.76*** -0.74*** -0.55** 0.30 0.09 0.32
-0.71*** -0.49** -0.60** 0.25
%area bullous lung
-0.23 -0.28 -0.01 0.22 0.33 0.01
-0.39 -0.38 -0.20
***: p<0.001; **: p<O.Ol. For abbreviations see legend to table l.
120 • .z • 100 • < • "0 .. ~· Q)
t5 . ~~· . ~ 80 Q. • • 'tit •• ~ 0
0
0 ·~·~ ~ 60 (.) CJ.s. . o a: . ~ --
=:~~t > 40 w IJ..
20
OL-~---.----.----,----,--~ -400 -420 ·440 -460 -480 -500
EMI No. of lowest 5th percentile in CT scan Fig. 4. - Relationship between airflow limitation (expressed as FEY/ FVC ratio as percentage of predicted nonnal) and lung computed tomographic (Cl') density (expressed as EMI 5th percentile value of non-bullous lung), comparing the group of 23 subjects with bullous disease (open squares) and the previously studied group of 80 subjects with chronic obstructive pulmonary disease (COPD) (solid circles). Correlation coefficients for the separate and combined groups are in table 4. The changes recorded after surgery in four subjects are shown by the arrows, with postoperative values shown as hatched squares. FEY 1/FVC: forced expiratory volume in one second/forced vital capacity; EMI: electromagnetic imaging.
6.0
• • • 5.0 •• • • • 0
'7 • C» • r!le :I: E 4.0 •• • .,~a t;: - •eG o . c:::
~:-: '-~ -~ 3.0 e <
~ 2.0 .. ·-~ . ·-~~ 0 • ~p~ 1.0 0 •
-400 -420 -440 -460 -480 ·500
EMI No. of lowest 5th percentile in CT scan
Fig. 5. - Relationship between volume corrected diffusing capacity of the lung for carbon monoxide (DLCON A) and lung computed tomographic (CD density (expressed as EMI lowest 5th percentile value), comparing the group of 23 subjects with bullous disease (open squares) and the previously studied group of 80 subjects with COPD (solid circles). Correlation coefficients for the separate and combined groups are in table 4. The changes recorded after surgery in four subjects are shown by the arrows, with postoperative values shown as batched squares. For further abbreviations see legend to table 4.

702 G.A. GOULD ET AL.
Table 3. - Correlation coefficients (r values) and regression coefficients (slope and intercept) between measurements of respiratory function and mean EMI No. for the CT density distribution of nonbullous lung (CT mean)
Age yrs Height cm FEV
1 l
FEV1
% pred FVCI FVC % pred FEV/FVC % FEV/FVC % pred RV I RV % pred TLCI TLC % pred RVnLC% RVnLC % pred DLCO ml·min·'·mmHg-1
DLCO o/o pred DLCoNA rnl·min·'·mmHg·• DLCON A % pred 12 MD
Bullous group (n=27) er mean
r slope intercept
0.58* 0.29
-0.77*** -0.77*** 0.68*** 0.59***
-0.77*** -0.76*** 0.45* 0.43* 0.13 0.15 0.64*** 0.46*
-0.65*** -0.58*** -0.46* -0.37 -0.48**
0.29 -0.12 -0.04 -0.82 -0.04 -0.59 -0.58 -0.69 0.04 1.52
-0.01 0.13 0.48 0.87
-0.07 -0.56 -0.01 -0.43 -6.83
-61 223
16 377
20 315 279 337 -10
-390 12 73
-138 -177
32 276
4 236
3589
Non-bullous group er mean
r
0.21 0.07
-0.54*** -0.65*** 0.26* 0.40***
-0.69*** -0.71 *** 0.46*** 0.44*** 0.35* 0.45*** 0.44*** 0.35*
-0.51 -0.58*** -0.68*** -0.67*** -0.32*
slope
0.10 0.03
-0.03 -0.93 -0.01 -0.40 -0.66 -0.86 0.03 1.41 0.03 0 .45 0.26 0.58
-0.07 -0.76 -0.01 -0.88 -4.02
(n=80)
intercept
18 159
13 434
9 243 317 417
-9 -371
-3 57
-50 -76 33
371 7
425 2501
Bullous group = this study group. Non-bullous group = previous study group of 80 subjects with COPD [15). ***: p<O.OOI; **: p<O.Ol; *: p<0.05. COPD: chronic obstructive pulmonary disease. For further abbreviations see legend to table 1.
Table 4. - Correlation coefficients (r values) and regression coefficients (slope and intercept) be· tween measurements of respiratory function and the lowest 5th percentile EMI No. for the CT density distribution of non-bullous lung (CT 5%)
Bullous group (n=27) Non-bullous group (n=80) er 5% er 5%
r slope interceet r slope interceEt
Age yrs 0.63*** 0.34 -103 0.27 0.15 -9 Height cm 0.25 -0.11 227 0.10 0 .04 150 FEY, I -0.76*** -0.04 20 -0.54*** -0.03 16 FEY 1 o/o pred -0.76*** -0.89 453 -0.64*** -1.04 527 FVC/ 0.64*** -0.04 23 0.24* -0.07 10 FVC o/o pred 0.55** -0.60 350 0.37* -0.42 271 FEV/FVC % -0.77*** -0.63 335 -0.71*** -0.77 397 FEV/FVC o/o pred -0.74*** -0.74 397 -0.73*** -1.00 519 RV l 0.35 0.03 -9 0.55*** 0.04 -16 RV % pred 0.30 1.10 -276 0.50*** 1.81 -617 TLC I 0.17 -0.01 15 0.44* 0.04 -9 TLC % pred 0.09 0.08 90 0.47*** 0.53 -114 RVnLC o/o 0.59** 0.46 -153 0.50*** 0.33 -94 RVnLC % pred 0.32* 0.64 -114 0.43*** 0.78 -194 DLCO rnl·mi.n·'·mmHg·' -0.77*** -0.09 46 -0.62*** -0.09 48 DLCO % pred -0.71 *** -0.77 403 -0.71 *** -1.04 533 DLCoN A rnl·min·'·mrnHg·• -0.60*** -0.01 6 -0.77*** -0.02 9 DLCON A % pred -0.49** -0.65 359 -0.76*** -1.13 581 12 MD -0.60** -9.04 4971 -0.32* -4.49 2900
***: p<O.OOl; **: p<0.01; *: p<0.05. For abbreviations and explanation of groups see legend to table l.
The severity of emphysema in the non-bullous part of the lung, as expressed by the mean EMI number and the lowest 5th percentile EMI number, correlated strongly with a number of measurements of respiratory function, most notably measurements of airflow limitation and impairment of DLCO (FEV1, FEV/FVC absolute or as % predicted versus CT 5th percentile, r=-0.74, -0.77, p<Q.OOl, fig. 4); (DLCO versus er 5th percentile, r=-0.77, p<O.OOl). (DL.CoN A versus CT 5th percentile, r=-0.60,
p<O.OOI, fig. 5). Correlation coefficients showing the relationships between respiratory function and er measurements are shown in tables 2-4. CT lung density measurements in non-bullous lung were correlated with lung function for the group of patients with bullae alone, and then compared to those values from our previous data in 80 patients with COPD (15] (tables 3 and 4). The data from the two groups were then combined and plotted graphically to permit visual assessment of the overlap and

er SCANNING IN BULLOUS EMPHYSEMA 703
similarity between the two populations. This analysis confirmed that both measurements reflecting airflow limitation and impairment of diffusing capacity correlated strongly with lung er density in non-bullous lung, in both groups, with virtual superimposition of the two populations (figs 4 and 5). Correlations between er lung density and measurements reflecting lung volume or hyperinflation showed a greater disparity between the two populations (tables 2-4).
Discussion
PRIDE et al. [4] suggested that in most subjects with bullous disease, tests of overall lung function largely reflect the state of the non-bullous lung. The major conclusion of our study confirms this hypothesis. We observed a poor correlation between the extent of bullous lung and any of the measurements of lung function (table 2). However, we did demonstrate a strong correlation between both the severity of airflow limitation or the impairment of the Dr..co and the severity of emphysema, as assessed by er lung density in tl}e non-bullous parts of the lung (tables 3 and 4, figs I, 4 and 5). These data, therefore, suggest that the major determinant of the functional impairment in these subjects is the severity of the parenchyma! disease in non-bullous lung, and not the extent of the bullae. This is further supported by the very limited data in four subjects who underwent surgical treatment for their bullae, where these relationships persisted after surgery, and did not fall outside the distribution observed in the preoperative subjects (figs 4 and 5). Interestingly, there was only a trivial change in lung CT density following surgery, perhaps suggesting that the anticipated reduction in lung density caused by reexpansion of the lung presumed to be compressed by the bullae was offset by an increase in perfusion.
Weaker correlations were observed between functional measurements related to hyperinflation (RV, RV!TLC, 1LC) and er lung density. This is not surprising, since the presence of bullae would be more likely to have a significant effect upon these measurements.
The similarity between the eT/functional relationships observed both in this group of patients with bullae, and in our previous group with COPD but without obvious bullous disease [15], suggest that they are a similar population, with the bullae representing an exaggeration of the emphysematous process. We emphasize that the results of this study apply to patients who, largely, had varying degrees of parenchyma! emphysema in addition to bullous disease. Subjects with a marked disparity between measurements of airflow limitation, diffusing capacity, and the severity of parenchyma! emphysema, are likely to have a significant functional effect from the bullae, and may therefore derive dramatic benefit from ablation of their bullae, although we were unable to conftrm this in the small number of patients studied pre- and postoperatively.
Most subjects referred for surgical treatment of bullous emphysema are dyspnoeic, and have bullae co-existing with diffuse parenchyma! emphysema, resulting in airflow
limitation. The aim of surgery in these individuals is to ablate the bullous lung tissue, presumably to allow the non-bullous lung to function more efficiently. Unfortunately, the functional changes expected with parenchyma! emphysema (hyperinflation, airflow limitation, impairment of the CO transfer factor) may be confounded by the functional changes caused by extensive bullous disease. Thus, an accurate assessment of the functional impact of the bullae is difficult, unless accurate regional lung function measurements are combined with precise anatomical information on the size and location of the bullae. We have recently studied the value of gated ventilation/ perfusion scanning, and have found a good correlation between er density-based estimates of the severity of emphysema in a group of subjects with normal lungs, patients with COPD and those with bullae, and measurements of regional ventilation/perfusion [28].
Numerous studies have demonstrated that subjective improvement after surgery for bullous disease is associated with a reduction in plethysmographic lung volumes (RV, TLC, RVffLC), often associated with some improvement in the elastic recoil of the lungs and in airflow limitation [3, 4, 13, 29, 30]. Although retrospective data on the functional effects of bullous surgery is available, it still does not permit accurate prediction of the effect of the bullae in an individual patient. In addition, the response of an individual to surgery is unpredictable. Although maximal improvements in pulmonary function after surgery are most often seen in subjects with large bullae and otherwise healthy lungs, very useful symptomatic improvement, and sometimes improvement in pulmonary function, can occur in patients with severe parenchyma! emphysema.
There are conflicting data regarding a change in ventilation!perfusion relationships after surgery. Some series demonstrate an improvement in arterial blood gas tensions [4, 5], whilst others have demonstrated no improvement [15, 30]. Most series indicate little or no improvement in DI..Co after surgery [4, 8, 13].
In conclusion, this study indicates that er scanning of the lungs may be useful in the preoperative assessment of patients with emphysematous bullae. er scanning not only provides precise anatomical information concerning the extent and location of the bullae, but in addition, measurement of er lung density allows quantification of the severity of emphysema in the non-bullous lung, which may be a more important determinant of lung function. I...Qng-term studies of measurement of er lung density are needed, to identify those subjects who will derive maximum benefit from surgery for bullous emphysema.
AcknowledgemenJs: The authors thank E. Neal for typing the manuscript
References
1. Knudson RJ, Gaensler EA. - Surgery for emphysema. Ann Tlwrac Surg 1965; 1: 332-362. 2. Hugh-Jones P, Whimster W. - The etiology and management of disabling emphysema. Am Rev Respir Dis 1978; 117: 343-378.

704 G.A. GOULD ET AL.
3. Fitzgerald MX, Keelan PJ, Cugell DW, Gaensler EA. -Long-tenn results of surgery for bullous emphysema. J 17wrac Cardiovasc Surg 1974; 68: 556-587. 4. Pride NB, Barker CE, Hugh-Jones P. - The ventilation of bullae and the effect of their removal on thoracic gas volumes and tests of overall pulmonary function. Am Rev Respir Dis 1973; 107: 83-98. 5. Potgeiter PD. Benatar SR, Hewitson RP, Ferguson AD. - Surgical treatment of bullous lung disease. 17wrax 1981; 36: 885-890. 6. Hugh-Jones P, Ritchie BC, Dollery Cf. - Surgical treatment of emphysema. Br Med J 1966; i: 1133-1138. 7. Benfield JR, Cree EM, Pellett JR, et al. - Current approach to the surgical management of emphysema. Arch Surg 1966; 93: 59-70. 8. Wesley JR Macleod WM, Mullard KS. - Evaluation of surgery of bullous emphysema. J Thorac Cardiovasc Surg 1972; 63: 945-955. 9. Gunstensen J, McConnack RJK. - The surgical management of bullous emphysema. J Thorac Cardiovasc Surg 1973; 65: 920-925. 10. Fiore D. Biondetti PR, Sartori F, Calabro F. - The role of computed tomography i.n the evaluation of bullous lung disease. J Comput Assist Tomogr 1982; 6(1): 105- 108. 11. Carr D, Pride NB. - Computed tomography in preoperative assessment of bullous emphysema. Clin Radiol 1984; 35: 43-45. 12. Morgan MDL, Strickland B. - Computed tomography in the assessment of bullous lung disease. Br J Dis Chest 1984; 78: 10-25. 13. Morgan MDL, Denison DM, Strickland B. - Value of computed tomography for selecting patients with bullous lung disease for surgery. Thorax 1986; 41: 855-862. 14. Gould GA, MacNee W, McLean A, et al. - Cf measurements of lung density in life can quantitate distal airspace enlargement: an essential defining feature of human emphysema. Am Rev Respir Dis 1988; 137: 380-392. 15. Gould GA, Redpath AT, Ryan M, et al. - Lung CT density correlates with measurements of airflow limitation and the diffusing capacity. Eur Respir J 1991; 4: 141-146. 16. Ogilvie CM, Forster RE, Blakemore WS, Morton JW. -A standardized breathholding technique for the clinical measurement of the diffusing capacity of the lung for carbon monoxide. J Clin Invest 1957; 36: 1- 17. 17. Jones RS, Meade F. - A theoretical and experimental
analysis of anomalies in the estimation of pulmonary diffusing capacity by the single breath method. Q J Exp Physiol 1961; 46: 131-143. 18. Crapo RO, Morris AH, Gardner RM. - Reference spirometric va.lues using techniques and equipment that meet ATS recommendations. Am Rev Respir Dis 1981; 123: 659-664. 19. Crapo RO, Morris AH, Clayton PD, Nixon CR. - Lung volumes in healthy nonsmoking adults. Bull Eur Physiopathol Respir 1982; 18: 419-425. 20. Cotes JE. - Lung function at different stages of life, including reference values. In: Lung function. 3rd edn. Oxford, Blackwell Scientific Publications, 1975; pp. 340-395. 21. Cotes JE, Hall AM. - The transfer factor for the lung, normal values in adults. In: Nonnal values for respiratory function in man. Arcangeli p. ed. Torino, Parminerva Medica 1970; pp. 327- 343. 22. Hall AM, Heywood C, Cotes JE. - Lung function in healthy British women. Thorax 1979; 34: 359-365. 23. Billiet L, Baiser W, Naedts JP. - Effet de la taille du sexe et de l'age sur la capacite de diffusion pulmonaire de !'adult normal. J Physiol (Paris) 1963; 55: 199-200. 24. McGavin CR, Artvirnli M, Haoe H, McHardy GJR. -Dyspnoea, disability and distance walked, comparison of estimates of exercise perfonnance in respiratory disease. Br Med J 1978; 2: 241-243. 25. Gado M, Eichling J, Currie M. - The body scanner in neurological disease. In: du Boulay GH, Moseley H, eds. Computerised axial tomography in clinical practice. Berlin, Springer Verlag, pp. 1977: pp. 312- 321. 26. Parker RP, Hobday PR, Cassell KJ. - The direct use of CT numbers in radiotherapy dosage calculations for inhomogeneous media. Phys Med Bioi 1979; 24: 802-809. 27. Rosenblum U, Mauceri RA, Wellenstein DE, et al. -Density patterns in the normal lung as determined by computed tomography. Radiology 1980; 137: 409-416. 28. Bell D, Gould GA, Redpath AT, et al. - Comparison of CT and V /Q scanning in bullous emphysema. Am Rev Respir Dis 1988; 137: 400. 29. Pearson MG, Ogilvie C. - Surgical treatment of emphysematous bullae: late outcome. Thorax 1983; 38: 134-137. 30. Boushy SF, Billing DM, Kohen R. - Changes in pulmonary function after bullectomy. Am J Med 1969; 47: 915- 923.


![Interstitial lung disease (ILD), or diffuse parenchymal lung disease … · 2018-10-28 · Interstitial lung disease (ILD), or diffuse parenchymal lung disease (DPLD),[[1] is a group](https://img.dokumen.tips/doc/110x75/5e7d31d2ec5074254471c7d0/interstitial-lung-disease-ild-or-diffuse-parenchymal-lung-disease-2018-10-28.jpg)