Embed Size (px)
Citation preview

f.'l"r.'I ~
US Army Corps of Engineers®
Papillion Creek and Tributaries Lakes, Nebraska
General Reevaluation Report
Appendix A-1. Dam Site 10 Hydrology
June 2021 Omaha District
Northwestern Division Hydrologic Engineering Branch
Engineering Division

THIS PAGE INTENTIONALLY LEFT BLANK

Executive Summary This Hydrology Appendix for the Papillion general reevaluation report (GRR) study documents the National Economic Development (NED) plan for Dam Site 10 (DS10). Documented as well are other designs leading to the NED used to screen for and justify federal interest. The report also incorporates input from the Tentatively Selected Plan (TSP) and the Agency Decision Milestone (ADM) meetings. Design criteria were generally consistent with the four existing Papillion Creek dams but updated to current USACE standards including Engineering Regulation 1110-8-2(FR), Inflow Design Floods for Dams and Reservoirs (USACE, 1991). The nonfederal sponsor was the Papio-Missouri River Natural Resources District (NRD).
This report refers to the designs listed below:
• Original Design – USACE 1975 original design (USACE, 1975). This was a dam with a permanent pool.
• TSP Design – design presented at the TSP milestone meeting and included both a wet dam and dry dam design. Dam design was built on the Original Design and incorporated some updates to USACE guidance. This included starting at a higher antecedent pool than the Original Design and adopting and updated PMP from another USACE dam in the Papillion Creek watershed. A site-specific PMP was added later in the study.
• ADM Design – design presented at the ADM meeting and used to determine federal interest. Included just the dry dam design. The dam design was updated to include both antecedent pool elevations required in ER 1110-8-2(FR), unit hydrograph and loss parameters from the FYRA model (FYRA, 2018), and the spillway design flood was updated with optimized PMP HMR 51&52 precipitation. Future land use conditions were used in the design. Spillway cut and embankment fill quantities had not been finalized.
• After ADM Design – design leading up to the National Economic Development (NED) plan design. Best balance of cut and fill. Future land use conditions were used in design.
• NED Design – National Economic Development (NED) plan design. This design added a slight modification to the outlet works of the After ADM Design in response to Project Development Team (PDT) review. The conduit outlet invert was raised from 1151.0 ft to 1154.0 ft NAVD88 to elevate the outlet into more stable geology (glacial till). However, the results presented were not significantly sensitive to this change. See Section 18 and Appendix A-1A of this document for a discussion of these results.
DS10 is designed only as a dry dam without a permanent multipurpose pool in the ADM and After ADM Designs. The dry dam design was developed with guidance from the Omaha District River and Reservoir Engineering section and based on research of other dry dams in the Omaha District and general reservoir sedimentation science. The design consists of a lower level box culvert outlet set near the bottom of the pool with a removable trash rack and concrete pad to accommodate clean-out with a skid loader or similar machinery. This outlet design passes sediment more efficiently to better maintain flood storage, allows for easier cleanout of the outlet works, and reduces downstream erosion. The box culvert was sized to begin storing water with events larger than the 50-percent annual exceedance probability (AEP, ~2 year event) flow.

The After ADM (Balanced) Design is the focus of this report. This design lead to the NED Plan design presented in Section 18. The NED design presented is still tentative and includes only a simplified hydrologic loading curve and not a risk-based design, which will be completed in a later phase of the study. Refer to the Risk to Life Safety Appendix (Appendix L) for the simplified hydrologic loading curve.
In the ADM Design (the design used to determine federal interest), real estate pools were not yet informed by the cut-and-fill balance analysis. What was felt to be a conservatively high flowage easement pool was assumed for real estate cost calculations for the dry dam at that point in the study. The actual real estate pool needed for the dry dam with a cut-and-fill balance considered was higher (1205.6 ft-NAVD88) than that used in the ADM Design (1202.74 ft-NAVD88). This was due to a decrease in spillway width in the design to reduce cut.
The probable maximum precipitation (PMP) was determined through optimization in HEC-HMS version 4.4beta using HMR52 Storm. Optimization considered maximization of peak flow, inflow volume, and pool elevation.
Unit hydrographs were determined from the existing FYRA 2018 models which were calibrated to three recent events with radar precipitation data. These unit hydrographs were then peaked at the dam by 125, 150 and 175 percent. The 125 percent peaking was used for the Standard Project Flood (SPF) reservoir design flood modeling and the 150 and 175 percent peaking was used for the PMF modeling used in spillway optimization. Frequency events were modeled without unit hydrograph peaking.
Both the Most Reasonable (MR PMF) and Reasonable High PMF (RH PMF) were routed through the dam to determine spillway and dam embankment design. Dam embankment height was determined as the highest of two alternatives: the RH PMF maximum pool elevation or the MR PMF pool elevation plus three feet. In the case of this site, the MR PMF plus three feet resulted in the highest elevation and was used to set the dam height. The MR and RH PMFs differ in their soil loss rates, unit hydrograph peaking, and Probable Maximum Precipitation (PMP) to better incorporate uncertainty.
Eleven different spillway crest elevation and width combinations were used to help optimize the spillway and dam embankment height cut-and-fill to reduce the costs at the site for quantities.
Figure E1 shows the NED plan design. Table E1 and E2 list pertinent information for the NED design. Figure E2 shows the NED dam location and design pools.
ii

Site 10: NED Plan
Top of Dam: (1207.4 ft-NAVD88) --- ---~--
"'-:-;:'-~LIS.IWi20.GIIU:M.IE..fl!?..2.l.il;~0~4L.:.41.f!ft::.!-N::l.JA~Vl!D2.!8l..!:8u_ ____ ___:-::-::-::::;i::-=:- -'--__..I...__ Reasonable High PMF Pool
Vol. 4,821AF
Total Vol. (To MR PMF) 4821 AF Total Vol. (To RH PMF) 5172 AF
Spillway Crest (Perched): 1191.6 ft-NAVD88 ---#-7---~ Vol.1,992AF
Min Spillway Crest/Top of FC: 1185.0 ft-NAVD88 Vol.1,097 AF
RDF (SPF) routed over dry pool
Dry Dam-no permanent pool
Low Elev: 1151 ft-NAVD88 Inlet invert= 1154.0 ft
NAVD88
(1205 .6 ft-NAVD88)
t Reasonable PMF
13,700 cfs
Figure E1. NED Design
Table E1. Design Pertinent Information (Precipitation)
Precipitation (in) Reasonable High Probable Maximum Precipitation (RH PMP) - 1.05*MR PMP 72-hour total depth (in) 1-hour max depth (in) 5-min max depth (in) Most Reasonable Probable Maximum Precipitation (MR PMP) 72-hour total depth (in) 1-hour max depth (in) 5-min max depth (in) Reservoir Design Flood Precipitation - SPS (Dry Dam Design) 96-hour total depth (in) 1-hour maximum depth (in) 5-min max depth (in)
39.1 15.3 1.68
37.2 14.6
1.6
15.81 3.75 0.31
iii

Table E2. Design Pertinent Information (ADM & After ADM Designs)
Design Events
ADM Design (Dry Dam)
After ADM (Dry Dam)
NED Plan Design (Dry
Dam) Spillway Design Flood - RH PMF Peak inflow (cfs) 43,100 43,100 43,100 Peak outflow (cfs) 28,000 15,800 15,900 Inflow volume (AF) Spillway Design Flood - MR PMF
6727 6727 6727
Peak inflow (cfs) 36,900 36,900 36,900 Peak outflow (cfs) 24,500 13,500 13,700 Inflow volume (AF) Reservoir Design Flood
6092 6092 6092
Peak inflow (cfs) 7,490 7,490 7,490 Peak outflow (cfs) 1,480 1,480 1,480 Inflow volume (AF) 1,944 1,944 1,944
Elevations (ft-NAVD88)
ADM Design (Dry Dam)
After ADM (Dry Dam)
NED Plan Design (Dry
Dam) Top of Dam 1201.8 1207.4 1207.4 RH PMF Pool 1199.7 1205.6 1205.6 MR PMF Pool 1198.8 1204.4 1204.4 Spillway Crest 1187.6 1191.6 1191.6 Top of Flood Control Pool 1184.6 1184.6 1185 Top of Multipurpose Pool - - -Outlet Invert Elevation 1151.0 1151.0 1154.0 Min Pool Elevation 1151.0 1151.0 1151.0
Storage (AF)
ADM Design (Dry Dam)
After ADM (Dry Dam)
NED Plan Design (Dry
Dam) Top of Dam 4,111 5,726 5,726 RH PMF Pool 3,587 5,172 5,172 MR PMF Pool 3,376 4,821 4,821 Spillway Crest 1,415 1,992 1,992 Top of Flood Control Pool 1,055 1,055 1,097 Top of Multipurpose Pool - - -Outlet Invert Elevation 0 0 0.3
iv

NED Dry Dam
C] Dam Embankment {Optim ized)
D Spillway (Optimized)
c:::J 1171.1 ft , 10% AEP (I llustration Only)
1205.6 ft, RH PMF pool (Flowage Easement)
Scale for map on right.
0 0.125 0.25 0.5 0.75 -- ---- - Miles
N
A
Figure E2. Project Location and Pools
v
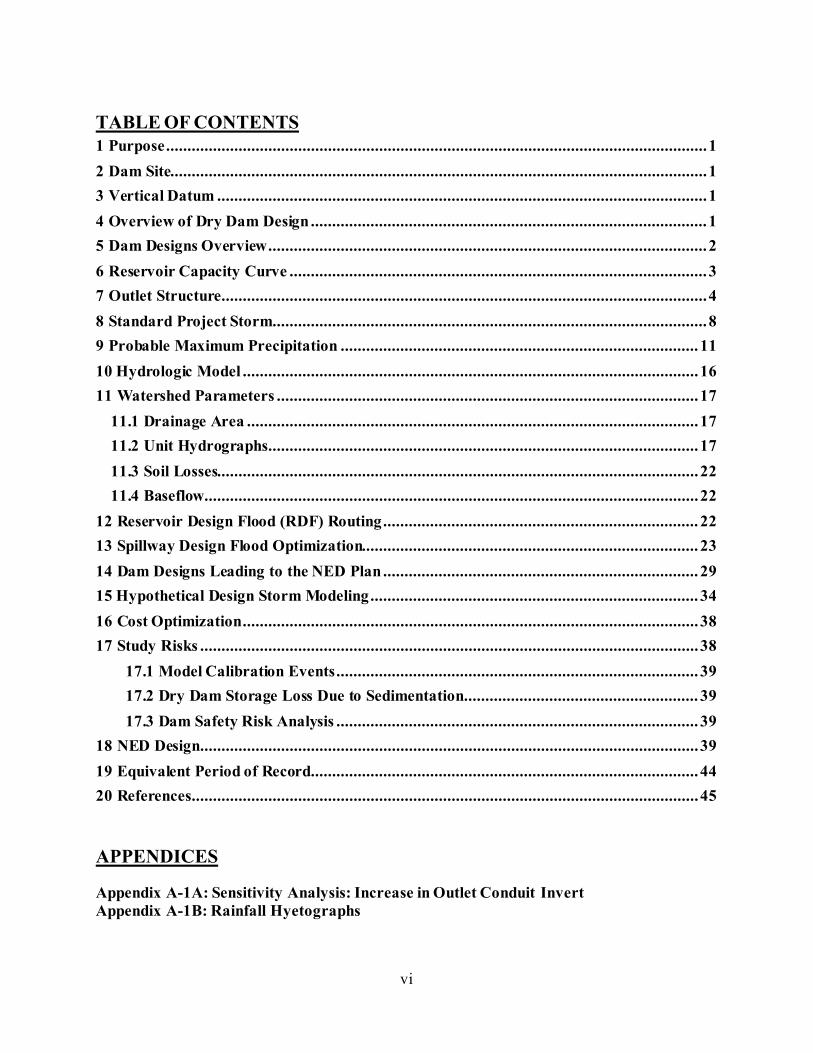
TABLE OF CONTENTS 1 Purpose...............................................................................................................................1 2 Dam Site..............................................................................................................................1 3 Vertical Datum ...................................................................................................................1 4 Overview of Dry Dam Design............................................................................................. 1 5 Dam Designs Overview....................................................................................................... 2 6 Reservoir Capacity Curve .................................................................................................. 3 7 Outlet Structure..................................................................................................................4 8 Standard Project Storm...................................................................................................... 8 9 Probable Maximum Precipitation .................................................................................... 11 10 Hydrologic Model ........................................................................................................... 16 11 Watershed Parameters ................................................................................................... 17
11.1 Drainage Area .......................................................................................................... 17 11.2 Unit Hydrographs..................................................................................................... 17 11.3 Soil Losses................................................................................................................. 22 11.4 Baseflow....................................................................................................................22
12 Reservoir Design Flood (RDF) Routing.......................................................................... 22 13 Spillway Design Flood Optimization............................................................................... 23 14 Dam Designs Leading to the NED Plan.......................................................................... 29 15 Hypothetical Design Storm Modeling............................................................................. 34 16 Cost Optimization........................................................................................................... 38 17 Study Risks .....................................................................................................................38
17.1 Model Calibration Events..................................................................................... 39 17.2 Dry Dam Storage Loss Due to Sedimentation....................................................... 39 17.3 Dam Safety Risk Analysis ..................................................................................... 39
18 NED Design.....................................................................................................................39 19 Equivalent Period of Record........................................................................................... 44 20 References.......................................................................................................................45
APPENDICES
Appendix A-1A: Sensitivity Analysis: Increase in Outlet Conduit Invert Appendix A-1B: Rainfall Hyetographs
vi

LIST OF FIGURES Figure 1. DS10 Location.......................................................................................................... 2
Figure 26. NED Spillway Design Flood -- PMF Routed Over Full Flood Control Pool (Outlet
Figure 27. NED Reservoir Design Flood -- SPF Routed Over Full Multipurpose Pool (Outlet
Figure 2. Updated DS10 Capacity Curve.................................................................................. 4 Figure 3. Kelly Road Dry Dam Outlet Structure, Aurora, Colorado........................................... 6 Figure 4. Dry Dam Lower Level Outlet Rating Curve............................................................... 7 Figure 5. Adopted reservoir design storm for DS10 .................................................................. 9 Figure 6. PMP Orientation Over Watershed............................................................................ 13 Figure 7. Subbasin LP-17 HMR 51&52.................................................................................. 14 Figure 8. Subbasin LP-18 HMR 51&52.................................................................................. 14 Figure 9. Subbasin LP-19 HMR 51&52.................................................................................. 15 Figure 10. Subbasin LP-20A HMR 51&52............................................................................. 15 Figure 11. HEC-HMS Model................................................................................................. 16 Figure 12. 1975 DM 30-minute Unit Hydrographs.................................................................. 20 Figure 13. 30-Minute Unit Hydrograph Comparisons.............................................................. 21 Figure 14. Adopted 30-Minute Unit Hydrographs................................................................... 21 Figure 15. Reservoir Design Flood Routing............................................................................ 23 Figure 16. PMF Comparison.................................................................................................. 27 Figure 17. Dry Dam Design (ADM Design) ........................................................................... 29 Figure 18. Dry Dam Design (After ADM Design)................................................................... 30 Figure 19. After ADM Design - Starting Pool Top of Flood Control........................................ 32 Figure 20. After ADM Design - Starting Pool 5-Day Drawdown............................................. 33 Figure 21. Existing Conditions Frequency Event Outflows and Pool Elevations....................... 36 Figure 22. Future Conditions Frequency Event Outflows and Pool Elevations ......................... 37 Figure 23. Decreased Level of Protection Scenario................................................................. 38 Figure 24. NED Design.......................................................................................................... 40 Figure 25. NED Outlet Rating Curve...................................................................................... 41
Blocked) ...............................................................................................................................43
Functional)............................................................................................................................44
LIST OF TABLES Table 1. Dry Dam Lower Level Outlet ..................................................................................... 8 Table 2. Reservoir Design Storm.............................................................................................. 9 Table 3. Standard Project Storm for HEC-HMS Model........................................................... 10 Table 4. HMR 51 Depth-Area-Duration Values...................................................................... 12 Table 5. PMP Optimization Trials.......................................................................................... 12 Table 6. Comparison of PMP Depths for Various Durations.................................................... 16 Table 7. Drainage Areas ........................................................................................................ 17 Table 8. Adopted Unit Hydrograph Peak Flows and Parameters.............................................. 19 Table 9. Soil Losses............................................................................................................... 22 Table 10. Dam Spillway Crest Elevations and Width Combinations........................................ 26 Table 11. Probable Maximum Flood Combinations ................................................................ 26 Table 12. Most Reasonable PMF Spillway Optimization Results............................................. 28 Table 13. Reasonable High PMF Spillway Optimization Results............................................. 28
vii

Table 14. Pertinent Information (Precipitation)....................................................................... 30 Table 15. Design Pertinent Information (ADM & After ADM Designs) .................................. 31 Table 16. NOAA Atlas 14 12-hour Depths ............................................................................. 34 Table 17. Existing Conditions Frequency Events.................................................................... 35 Table 18. Future Conditions Frequency Events....................................................................... 35 Table 19. NED Outlet Rating Curve....................................................................................... 42
viii

1 Purpose The purpose of this general reevaluation report (GRR) study was to model flood risk management alternatives in the Papillion Creek watershed. This Appendix documents additional refinement to the hydrologic design of Dam Site 10 (DS10) for the Agency Decision Milestone (ADM). Current USACE standards were used including Engineering Regulation 1110-8-2(FR), Inflow Design Floods for Dams and Reservoirs (USACE, 1991). DS10 was designed as a dry dam without a permanent multipurpose pool. The design presented is still tentative as it includes only a simplified hydrologic loading curve (see the Risk to Life Safety—Appendix L—for curve) and not a risk-based design, which will be completed in a later phase of the study.
The nonfederal project sponsor was the Papio-Missouri River Natural Resources District (NRD).
2 Dam Site DS10 is located on Thomas Creek north of the Omaha, Nebraska metro area. Thomas Creek is a tributary to the Little Papillion Creek. The dam and reservoir site are primarily in Douglas County, but about one-half of the drainage area is in Washington County. The contributing drainage area to the site is 4.3 square miles (USACE, 1975). The project location is shown in Figure 1 which includes the dam embankment, spillway, 10-percent Annual Exceedance Probability (AEP) pool, and the Reasonable High Probable Maximum Flood (RH PMF) pool elevation. The RH PMF pool is also the flowage easement pool.
3 Vertical Datum The datum used in this report was NAVD88 unless otherwise stated.
4 Overview of Dry Dam Design The dry dam design for DS10 was determined through investigation of existing dry dams in the Omaha District. The Omaha District River and Reservoir Engineering (RARE) section was also consulted. The dam project is designed to drain the pool and pass sediment efficiently between events and does not have a permanent pool. This assumption will be verified later in the study due to SMART planning constraints on time and schedule.
The intake invert of the outlet was placed near the bottom of the pool. It was sized to allow the passage of the 50-percent AEP event and facilitate mechanical removal of sediment within the conduit (eg. by means of a skid loader) for cleanout as needed. More details are presented in additional sections of this report.
.
1

NED Dry Dam
C] Dam Embankment {Optim ized)
D Spillway (Optimized)
c:::J 1171.1 ft , 10% AEP (I llustration Only)
1205.6 ft, RH PMF pool (Flowage Easement)
Scale for map on right.
0 0.125 0.25 0.5 0.75 -- ---- - Miles
N
A Figure 1. DS10 Location
5 Dam Designs Overview The following lists the dam designs considered in the Papillion Creek GRR study. These names are used throughout this report.
• Original Design – USACE 1975 original feasibility design (USACE, 1975). This was a dam with a permanent pool.
• TSP Design – design presented at the TSP milestone meeting and included both a wet dam and dry dam design. Dam design was built on the Original Design and incorporated some updates to USACE guidance. This included starting at a higher antecedent pool than the Original Design and adopting and updated PMP from another USACE dam in the Papillion Creek watershed. A site-specific PMP was added later in the study.
• ADM Design – design presented at the ADM meeting and used to determine federal interest. Included just the dry dam design. The dam design was updated to include both, instead of just one, antecedent pool elevations required in ER 1110-8-2(FR); unit hydrograph and loss parameters from the FYRA model (FYRA, 2018); and the spillway design flood was updated with optimized HMR 51&52 precipitation. Future land use conditions were used in the design. Spillway cut and embankment fill quantities had not been finalized.
2

• After ADM Design – design with cut and fill balance considered. Future land use conditions were used in design.
• NED Design – National Economic Development (NED) plan design. This design added a slight modification to the outlet works of the After ADM Design in response to Project Development Team (PDT) review. The conduit outlet invert was raised from 1151 ft to 1154 ft NAVD88 to elevate the outlet into more stable geology (glacial till). However, the results presented were not significantly sensitive to this change. See Section 19 and Appendix A-1A of this document for a discussion of these results.
In addition to these dam designs, the report references the 2018 FYRA hydrology which was used in the modeling of the ADM and After ADM designs. The NRD did not have a dam design for DS10 on Thomas Creek as they did for DS-19 near Gretna, Nebraska.
6 Reservoir Capacity Curve The reservoir pool capacity curve was determined from 2016 LiDAR data using the Surface Volume tool in ArcMap in Batch mode. One-foot increments were used. Figure 2 shows the updated capacity curve.
3

DS10 Thomas Creek 2016 LiDAR Capacity Curve
1140
1150
1160
1170
1180
1190
1200
1210
1220
7,000 8,000 9,000
DS10
0 1,000 2,000 3,000 4,000 5,000 6,000
Storage (AF)
Figure 2. Updated DS10 Capacity Curve (datum NAVD88)
7 Outlet Structure The outlet structure design for the DS10 dry dam was determined through the investigation of outlets for existing dry dams in the Omaha District, consultation with the Omaha District RARE section, and consideration of downstream capacity of the channel to the confluence of Papillion Creek with the Missouri River.
The design is an 8-ft (Span) x 7-ft (Rise) box culvert which begins storing water with events larger than the 50-percent AEP (~2 year event) flow. It also facilitates mechanical sediment removal (eg. by use of a skid loader) as needed. This outlet design passes sediment more efficiently to better maintain flood storage, allows for easier cleanout of the outlet works, and reduces downstream erosion. The curve shown was used through most of the study, so it is provided here in place of the NED design plan curve. The NED outlet rating curve is documented in Section 18. The NED curve is for the same size and shape of outlet, but the outlet is raised three feet.
The 50-percent AEP event was selected as the event to size the outlet works because hydraulic unsteady modeling showed the flow remained within channel to the confluence of Papillion Creek
4
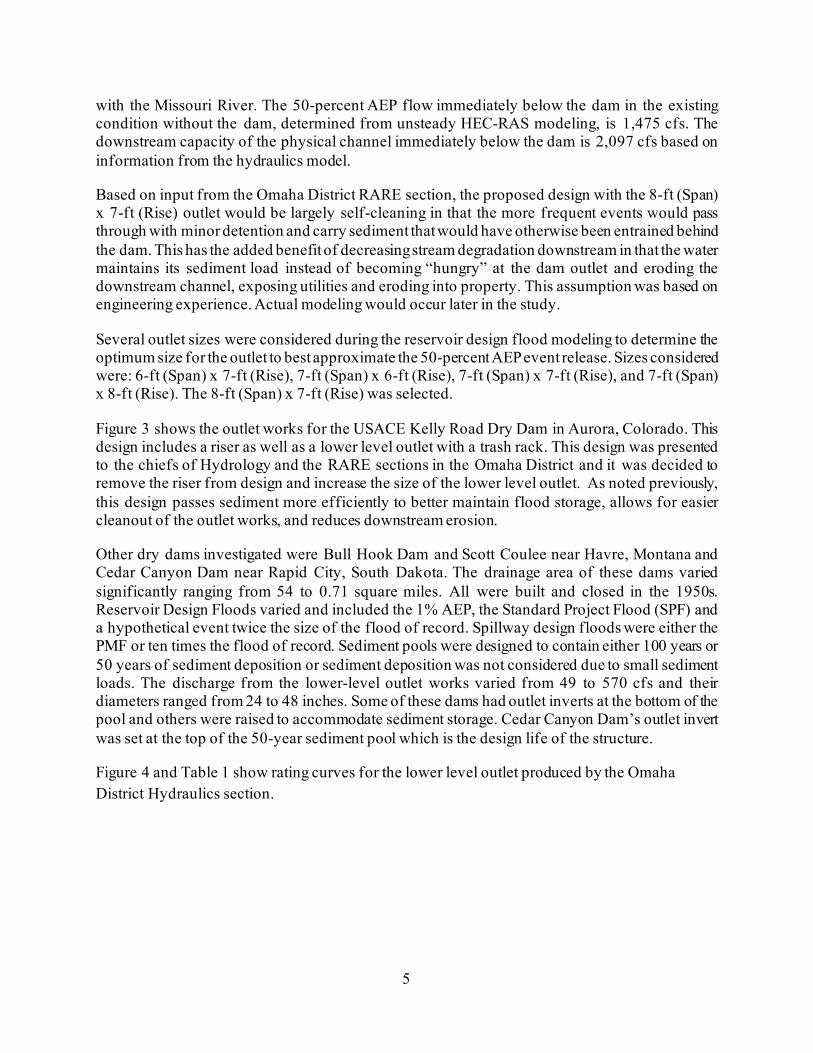
with the Missouri River. The 50-percent AEP flow immediately below the dam in the existing condition without the dam, determined from unsteady HEC-RAS modeling, is 1,475 cfs. The downstream capacity of the physical channel immediately below the dam is 2,097 cfs based on information from the hydraulics model.
Based on input from the Omaha District RARE section, the proposed design with the 8-ft (Span) x 7-ft (Rise) outlet would be largely self-cleaning in that the more frequent events would pass through with minor detention and carry sediment that would have otherwise been entrained behind the dam. This has the added benefit of decreasing stream degradation downstream in that the water maintains its sediment load instead of becoming “hungry” at the dam outlet and eroding the downstream channel, exposing utilities and eroding into property. This assumption was based on engineering experience. Actual modeling would occur later in the study.
Several outlet sizes were considered during the reservoir design flood modeling to determine the optimum size for the outlet to best approximate the 50-percent AEP event release. Sizes considered were: 6-ft (Span) x 7-ft (Rise), 7-ft (Span) x 6-ft (Rise), 7-ft (Span) x 7-ft (Rise), and 7-ft (Span) x 8-ft (Rise). The 8-ft (Span) x 7-ft (Rise) was selected.
Figure 3 shows the outlet works for the USACE Kelly Road Dry Dam in Aurora, Colorado. This design includes a riser as well as a lower level outlet with a trash rack. This design was presented to the chiefs of Hydrology and the RARE sections in the Omaha District and it was decided to remove the riser from design and increase the size of the lower level outlet. As noted previously, this design passes sediment more efficiently to better maintain flood storage, allows for easier cleanout of the outlet works, and reduces downstream erosion.
Other dry dams investigated were Bull Hook Dam and Scott Coulee near Havre, Montana and Cedar Canyon Dam near Rapid City, South Dakota. The drainage area of these dams varied significantly ranging from 54 to 0.71 square miles. All were built and closed in the 1950s. Reservoir Design Floods varied and included the 1% AEP, the Standard Project Flood (SPF) and a hypothetical event twice the size of the flood of record. Spillway design floods were either the PMF or ten times the flood of record. Sediment pools were designed to contain either 100 years or 50 years of sediment deposition or sediment deposition was not considered due to small sediment loads. The discharge from the lower-level outlet works varied from 49 to 570 cfs and their diameters ranged from 24 to 48 inches. Some of these dams had outlet inverts at the bottom of the pool and others were raised to accommodate sediment storage. Cedar Canyon Dam’s outlet invert was set at the top of the 50-year sediment pool which is the design life of the structure.
Figure 4 and Table 1 show rating curves for the lower level outlet produced by the Omaha District Hydraulics section.
5

Figure 3. Kelly Road Dry Dam Outlet Structure, Aurora, Colorado
6

DS10 Dry Dam Outlet Rating Curve 8 ft (S) x 7 ft (R)
1140
1150
1160
1170
1180
1190
1200
1210
1220
DS10
0 500 1000 1500 2000 2500
Discharge (cfs)
Figure 4. Dry Dam Lower Level Outlet Rating Curve
7

Table 1. Dry Dam Lower Level Outlet
Elev (ft-NAVD88)
Discharge (cfs)
Elev (ft-NAVD88) Discharge (cfs)
Elev (ft-NAVD88) Discharge (cfs)
1151 0.0 1165 874 1179 1335 1151.5 9.6 1165.5 894 1179.5 1348 1152 27.2 1166 914 1180 1362
1152.5 50.0 1166.5 934 1180.5 1375 1153 77.0 1167 953 1181 1388
1153.5 108 1167.5 972 1181.5 1401 1154 142 1168 991 1182 1414
1154.5 178 1168.5 1009 1182.5 1427 1155 218 1169 1027 1183 1439
1155.5 260 1169.5 1044 1183.5 1452 1156 305 1170 1062 1184 1465
1156.5 351 1170.5 1079 1184.5 1477 1157 400 1171 1095 1185 1489
1157.5 451 1171.5 1112 1185.5 1501 1158 504 1172 1128 1186 1513
1158.5 539 1172.5 1144 1186.5 1525 1159 572 1173 1160 1187 1537
1159.5 603 1173.5 1175 1187.5 1549 1160 632 1174 1191 1188 1561
1160.5 660 1174.5 1206 1188.5 1572 1161 687 1175 1221 1189 1584
1161.5 713 1175.5 1236 1189.5 1595 1162 738 1176 1250 1190 1607
1162.5 763 1176.5 1265 1190.5 1618 1163 786 1177 1279 1191 1629
1163.5 809 1177.5 1293 1200 1800 1164 831 1178 1307 1215 2000
1164.5 853 1178.5 1321
8 Standard Project Storm The reservoir design flood (RDF) for DS10 was used to initially set the minimum spillway elevation and was assumed to be the peak elevation of the standard project flood (SPF). The SPF was produced by the standard project storm (SPS) referenced from the 1970s design (USACE, 1975) of the dam. Risk-based considerations are documented separately.
The adopted SPF is shown in Figure 5, Table 2, and Table 3.
8

Figure 5. Adopted reservoir design storm for DS10
0
0.5
1
1.5
2
2.5
3
3.5
4
0 3 6 9 12 15 18 21 24 27 30 33 36 39 42 45 48 51 54 57 60 63 66 69 72 75 78 81 84 87 90 93 96
Prec
ipita
tion
in In
ches
Time in Hours
Site DS10 Standard Project Storm (SPS)
Table 2. Reservoir Design Storm
Time (Hours) SPS Depth
(in) 0-24 24-48 48-54 54-60 60-61 61-62 62-63 63-64 64-65 65-66 66-72 72-96
0.31 1.71 0.61 1.62 0.99 1.18 1.48 3.75 1.38 1.09 1.01 0.68
Total: 15.81
9

25
30
35
40
45
50
55
60
65
70
75
80
85
90
95
Table 3. Standard Project Storm for HEC-HMS Model (DS10)
Time (hrs)
Rainfall (in)
Time (hrs)
Rainfall (in)
Time (hrs)
Rainfall (in)
Time (hrs)
Rainfall (in)
0 0.013 24 0.071 48 0.102 72 0.028 1 0.013 0.071 49 0.102 73 0.028 2 0.013 26 0.071 0.102 74 0.028 3 0.013 27 0.071 51 0.102 0.028 4 0.013 28 0.071 52 0.102 76 0.028 5 0.013 29 0.071 53 0.102 77 0.028 6 0.013 0.071 54 0.27 78 0.028 7 0.013 31 0.071 0.27 79 0.028 8 0.013 32 0.071 56 0.27 0.028 9 0.013 33 0.071 57 0.27 81 0.028 10 0.013 34 0.071 58 0.27 82 0.028 11 0.013 0.071 59 0.27 83 0.028 12 0.013 36 0.071 0.99 84 0.028 13 0.013 37 0.071 61 1.18 0.028 14 0.013 38 0.071 62 1.48 86 0.028 15 0.013 39 0.071 63 3.75 87 0.028 16 0.013 0.071 64 1.38 88 0.028 17 0.013 41 0.071 1.09 89 0.028 18 0.013 42 0.071 66 0.168 0.028 19 0.013 43 0.071 67 0.168 91 0.028 20 0.013 44 0.071 68 0.168 92 0.028 21 0.013 0.071 69 0.168 93 0.028 22 0.013 46 0.071 0.168 94 0.028 23 0.013 47 0.071 71 0.168 0.028
10

9 Probable Maximum Precipitation DS10 is a Standard 1 Dam and is required by ER 1110-8-2(FR) (USACE, 1991) to have an inflow design flood (IDF) equal to the PMF. The PMF is determined by applying the probable maximum precipitation (PMP) to the drainage area upstream of the dam.
Hydrometeorological Report 51 and 52 (HMR 51&52) were used to determine the PMP for the watershed. The MMC Precip Tool version 1.2.0 (MMC, 2017) was used to determine PMP depths and the HEC-HMS version 4.4beta model (HEC, 2020) was used to optimize the PMP event over the watershed. The MMC Precip tool is a GIS extension within ArcMap that uses a georeferenced shapefile of the watershed along with HMR 51 gridded depth-area-duration values to produce a watershed average depth-area-duration table. The HMR 51 depths are shown in Table 4.
Although the MMC Precip Tool optimizes a PMP storm following standard procedures outlined in HMR 52, HEC-HMS 4.4beta has the functionality to optimize a desired statistic. The benefit to optimizing the PMP storm in HEC-HMS is that it accounts for channels, subbasins, and reservoir routing.
The optimization trials preformed in HEC-HMS altered the PMP storm area, orientation, and center coordinates to maximize either the peak inflow, storm volume, or reservoir pool elevation. Storm peak intensity period was altered through the Meteorological Model to test sensitivity to the hyetograph pattern. Optimization initial values for all these parameters were set so they were not near the values determined by the MMC Precip tool which were initially input into the Meteorological Model. Two to three hundred iterations resulted in convergence.
Table 5 shows the results of the three optimization trials to peak inflow, storm volume, and reservoir pool elevation. Optimization trials were run, their optimized parameters determined, and then these were entered into the HMR52 meteorological model and a simulation run to check results. Additional optimization trials were completed with different initial values when convergence results were questionable.
Optimization to peak flow, storm volume, and reservoir pool elevations produced similar results. Optimization based on the maximum peak inflow was adopted.
Figure 6 shows the PMP over the watershed upstream of DS10 using optimization results from the HEC-HMS HMR52 Tool in the MMC Precip Tool interface.
Figure 7 through Figure 10 show the optimized PMP adopted for this study over the four subbasins of the watershed. Subbasin characteristics will be provided later in the report.
Table 6 compares the PMP used in this analysis with the PMP used in the Original Design of the dam (USACE, 1975).
11

I I I I
Table 4. HMR 51 Depth-Area-Duration Values (MMC, 2017)
Basin Area (sq mi) PMP Precipitation Depths (in)
6 hour 12 hour 24 hour 48 hour 72 hour 10
200 1000 5000
10000 20000
26 19
13.9 8.4 6.4 4.5
30.6 32.2 35.7 22.5 24.3 27.5 16.9 18.6 21.8 10.8 12.8 16 8.6 10.4 13.6 6.7 8.3 11.3
37.5 29.1 23.5 17.4 15
12.7
Table 5. PMP Optimization Trials
Storm Parameter
Meteorological Model Initial
Value* Optimization Initial Value
Optimization Trial Statistical Results
(ADOPTED) Peak Flow
(cfs)
Max Storm Volume
(AF)
Max Pool Elevation
(ft-NAVD88)
Area (sq mi) Preferred Orientation (degrees) Actual Orientation (degrees) Peak Intensity Period 1 to 6 ratio x-coordinate y-coordinate
10 244 170
Hours 36-42 0.306 -8942
2043391
25 244 170
Hours 36-42 0.306 -8942
2043391
10 -
164.5 Hours 36-42
--9230
2043486
10 -
159.7 Hours 36-42
--8937.5
2043793
10 -
161.6 Hours 36-42
--9025.1
2043827 Reservoir Optimization Results Peak Inflow (cfs) 36,878 36,878 36,878 Peak Discharge (cfs) 0 0 0 Inflow Volume (AF) 6,092 6,092 6,092 Peak Storage (AF) 6,092 6,029 6,092 Peak Elevation (ft) 1208.5 1208.5 1208.5
*Estimate from the MMC Precip Tool. All results similar in value. Max pool elevation optimization was adopted.
12

nty R ad 38
U)
£ 00 0
z
~ C ::J a u
Road 38
Figure 6. PMP Orientation Over Watershed (MMC Precip Tool with Results from HMS
HMR 52 Storm Tool)
13

-T T
---+ f r
.. + ► +
► ►
+ .. .. +
+ +
--------0 6 ✓~ ✓o> ~~ '9o '96 ~~ ~o> s~ 60 66 -?
-T T T r
+
.. + + +
0 6
0 0.2 0.4 0.6 0.8 1 1.2 1.4 1.6
0 5
10 15 20 25 30 35 40
Incr
emen
tal 5
-min
Rai
nfal
l (in
)
Cum
ulat
ive
Rain
fall
(in)
Time in Hours
DS10 Thomas Creek: LP-17 Probable Maximum Precipitation HEC-HMS Version 4.4beta HMR52 Storm
Incremental Cumulative
DS10
Figure 7. Subbasin LP-17 HMR 51&52 (5-minute interval)
0 0.2 0.4 0.6 0.8 1 1.2 1.4 1.6
0 5
10 15 20 25 30 35 40
Incr
emen
tal 5
-min
Rai
nfal
l (in
)
Cum
ulat
ive
Rain
fall
(in)
Time in Hours
DS10 Thomas Creek: LP-18 Probable Maximum Precipitation HEC-HMS Version 4.4beta HMR52 Storm
Incremental Cumulative
DS10
Figure 8. Subbasin LP-18 HMR 51&52 (5-minute interval)
14

+
+
0 6
0 6
T -
T
-T T
f T
+ +
+
+
+ +
+ +
·· ·· ·· ·- · .... , II I I I I I I I I I I I I"" I" I I I I
0 0.2 0.4 0.6 0.8 1 1.2 1.4 1.6
0 5
10 15 20 25 30 35 40
Incr
emen
tal 5
-min
Rai
nfal
l (in
)
Cum
ulat
ive
Rain
fall
(in)
Time in Hours
DS10 Thomas Creek: LP-19 Probable Maximum Precipitation HEC-HMS Version 4.4beta HMR52 Storm
Incremental Cumulative
5-min max increment = 1.6 inches 72 hr PMP total = 37.2 inches DA = 1.43 square miles
Figure 9. Subbasin LP-19 HMR 51&52 (5-minute interval)
0 0.2 0.4 0.6 0.8 1 1.2 1.4 1.6
0 5
10 15 20 25 30 35 40
Incr
emen
tal 5
-min
Rai
nfal
l (in
)
Cum
ulat
ive
Rain
fall
(in)
Time in Hours
DS10 Thomas Creek: LP-20 Probable Maximum Precipitation HEC-HMS Version 4.4beta HMR52 Storm
Incremental Cumulative
5-min max increment = 1.6 inches 72 hr PMP total = 37.2 inches DA = 0.3 square miles
Figure 10. Subbasin LP-20A HMR 51&52 (5-minute interval)
15

I
Table 6. Comparison of PMP Depths for Various Durations
12-hour 24-hour 72-hour 1975 DM 22.45 24.86 24.86 HMR 51&52 29.9 32.9 37.2
10 Hydrologic Model Figure 11 shows the HEC-HMS version 4.4beta hydrologic model used to determine inflows into DS10. Subbasin delineations and subbasin and channel properties were adopted from the calibrated FYRA future conditions model except in the case of LP-20 which was split into LP-20A and LP-20B where LP-20A is above the dam site and LP-20B is below. The HEC-HMS version 4.4beta model was used in order to use the most up to date HMR52 Storm modeling for PMP optimization.
Figure 11. HEC-HMS Model
16
I
11 Watershed Parameters The following sections describe the watershed parameters input into the HEC-HMS model.
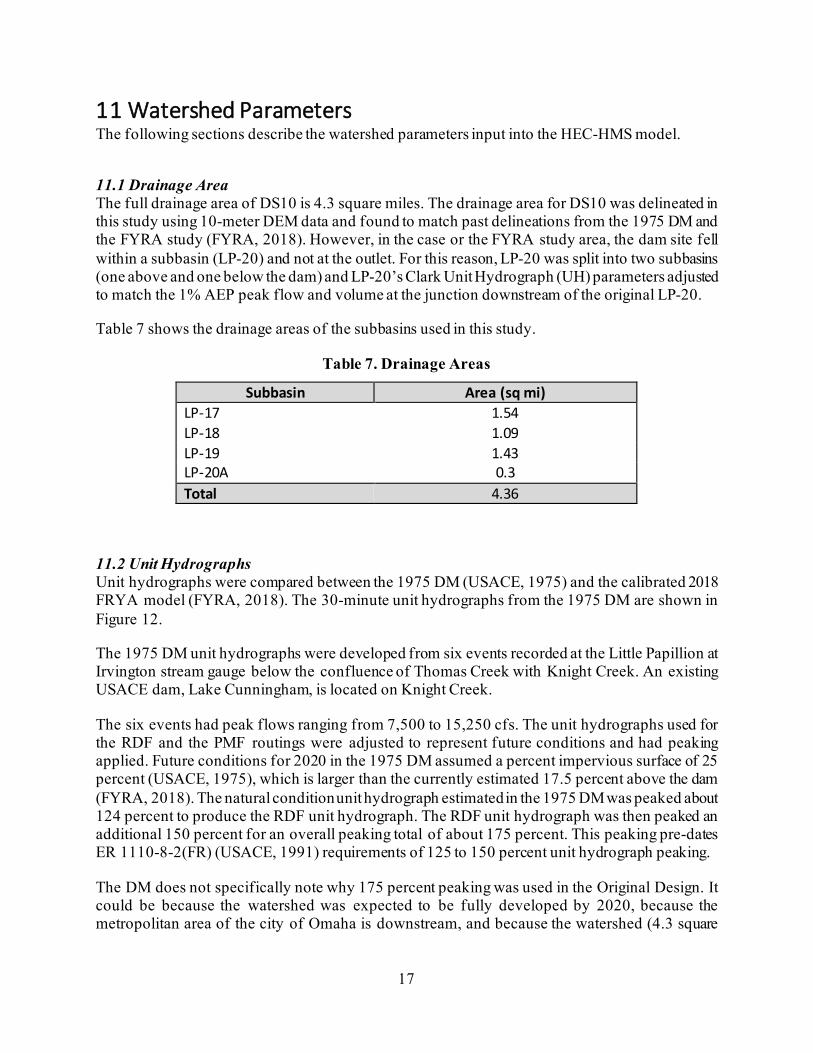
11.1 Drainage Area The full drainage area of DS10 is 4.3 square miles. The drainage area for DS10 was delineated in this study using 10-meter DEM data and found to match past delineations from the 1975 DM and the FYRA study (FYRA, 2018). However, in the case or the FYRA study area, the dam site fell within a subbasin (LP-20) and not at the outlet. For this reason, LP-20 was split into two subbasins (one above and one below the dam) and LP-20’s Clark Unit Hydrograph (UH) parameters adjusted to match the 1% AEP peak flow and volume at the junction downstream of the original LP-20.
Table 7 shows the drainage areas of the subbasins used in this study.
Table 7. Drainage Areas
Subbasin Area (sq mi) LP-17 1.54 LP-18 1.09 LP-19 1.43 LP-20A 0.3 Total 4.36
11.2 Unit Hydrographs Unit hydrographs were compared between the 1975 DM (USACE, 1975) and the calibrated 2018 FRYA model (FYRA, 2018). The 30-minute unit hydrographs from the 1975 DM are shown in Figure 12.
The 1975 DM unit hydrographs were developed from six events recorded at the Little Papillion at Irvington stream gauge below the confluence of Thomas Creek with Knight Creek. An existing USACE dam, Lake Cunningham, is located on Knight Creek.
The six events had peak flows ranging from 7,500 to 15,250 cfs. The unit hydrographs used for the RDF and the PMF routings were adjusted to represent future conditions and had peaking applied. Future conditions for 2020 in the 1975 DM assumed a percent impervious surface of 25 percent (USACE, 1975), which is larger than the currently estimated 17.5 percent above the dam (FYRA, 2018). The natural condition unithydrograph estimated in the 1975 DMwas peaked about 124 percent to produce the RDF unit hydrograph. The RDF unit hydrograph was then peaked an additional 150 percent for an overall peaking total of about 175 percent. This peaking pre-dates ER 1110-8-2(FR) (USACE, 1991) requirements of 125 to 150 percent unit hydrograph peaking.
The DM does not specifically note why 175 percent peaking was used in the Original Design. It could be because the watershed was expected to be fully developed by 2020, because the metropolitan area of the city of Omaha is downstream, and because the watershed (4.3 square
17

miles) is much smaller than the watershed at the Irvington gauge (32 square miles) where the unit hydrographs were initially developed. The original unit hydrograph was a 1-hour unit hydrograph at the Irvington gauge that was converted to a 30-minute duration in the Original Design due to the small size of the DS10 drainage area.
The 2018 FYRA unit hydrographs were determined from watershed calibration to three events ranging from 578 to 4,170 cfs at the Irvington stream gauge and verified with an additional event. Calibrations were to more current events using better data including gridded rainfall data. The FYRA report does not address why the older, larger events were not used in model calibration. Reasons may include better data for more current events and that the older events do not reflect the current development of the overall Papillion Creek watershed.
The FYRA 2018 model unit hydrographs did not originally include peaking. These were peaked in this study so that inflows were peaked 125, 150, and 175 percent at the dam.
The 30-min unit hydrographs for the FYRA 2018 study were determined in this analysis by running the model with 1 inch of rainfall over 30 minutes without watershed soil losses. This produced 30-minute unit hydrographs that could then be compared with the 30-minute unit hydrographs from the 1975 DM.
The 2018 FYRA unit hydrographs were adopted for this analysis. Figure 13 compares the 30-minute unit hydrographs at the dam from USACE and FYRA and Figure 14 shows the adopted unit hydrographs. Unit hydrographs without peaking were used for the frequency events (the 0.2 AEP to 50 percent AEP). The 125-percent unit hydrograph peaking was used for the RDF to set the minimum spillway crest of the dam. The 150 and 175 percent unit hydrograph peaking were used for the dam spillway design and flowage easement; this will be addressed in more detail in a later section of the report.
Table 8 shows the Clark unit hydrograph parameters for the adopted unit hydrographs and their peak flows.
18

I I I I
I I I I
I I I I
I I I I
Table 8. Adopted Unit Hydrograph Peak Flows and Parameters
No Unit Hydrograph Peaking LP-17 LP-18 LP-19 LP-20A At DS10
Peak Discharge (cfs) Tc (hr) R (hr) Unit Hydrograph Peaking (%)
771 0.86 0.71
0
453 814 186 0.97 0.69 0.3 0.92 0.62 0.67
0 0 0
1,846 --0
125% Unit Hydrograph Peaking LP-17 LP-18 LP-19 LP-20A At DS10
Peak Discharge (cfs) Tc (hr) R (hr) Unit Hydrograph Peaking (%)
1,011 0.611 0.505 1.31
603 1,052 306 0.69 0.491 0.213
0.654 0.441 0.263 1.33 1.29 1.65
2,310 --
1.25 150% Unit Hydrograph Peaking
LP-17 LP-18 LP-19 LP-20A At DS10 Peak Discharge (cfs) Tc (hr) R (hr) Unit Hydrograph Peaking (%)
1,237 0.459 0.379 1.60
755 1,259 341 0.518 0.368 0.16 0.491 0.331 0.198 1.67 1.55 1.83
2,771 --
1.50 175% Unit Hydrograph Peaking
LP-17 LP-18 LP-19 LP-20A At DS10 Peak Discharge (cfs) Tc (hr) R (hr) Unit Hydrograph Peaking (%)
1,488 0.335 0.276 1.93
927 1,490 371 0.377 0.268 0.117 0.358 0.241 0.144 2.05 1.83 1.99
3,231 --
1.75
19

0
c,j i..:
0 0 0 .. 0 _, z ILi
~ < 3 :c u V)
Q
~
-\
I \
I
'I I )/1
3 1800 C.F. S ,
I I fUL.L POOL INCREASED $0'to
(USED FOR P Mf ROUTING)
2<000 C. F. 5 .
1\_ I
INTO MU LTI PUR~OSE POOL
( USED FOR ROF ROUTING)
\~,: l, \\ ~ ......--NAT URAL
~ ...
~ "' ..._ 2 3 4 e
TIME IN, HOURS
PM'ILLION CIIHII AND TRIIVTAlll[S LAKEl1 NEIRASKA
SITE 10
ONE·HALF HOUR UNIT HYDROGRAPHS
U. I . ARMY ENGINlllt OIITIIICT, OMAHA
COlll'I OF INGINIIEltS OMAHA, · NIIRAIKA
MA'I' 107$
SPECll"IC DESIGN MEMO. NO. MPC· 33 PLATE II
7
Figure 12. 1975 DM 30-minute Unit Hydrographs
20

r r
, , I
I I
I I
I I
I I
I I
I I ,
, ... ·· .. .... •
, ,
..
~
r r
- - ------
0
500
1000
1500
2000
2500
3000
3500
4000
4500
0 0.5 1 1.5 2 2.5 3 3.5 4
DS10
Hours
DS-10 30-Minute Unit Hydrograph Comparisons DM - UH for PMF (Future 2020)
DM - UH for RDF (Future 2020)
DM - UH for Natural Conditions (1970s)
FYRA - UH 175% Peaking (Future 2040)
FYRA - UH 150% Peaking (Future 2040)
FYRA - UH 125% Peaking (Future 2040)
FYRA - No UH Peaking (Future 20 40)
Figure 13. 30-Minute Unit Hydrograph Comparisons
DS-10 30-Minute Unit Hydrograph Comparisons 3500
DS10
3000
2500
2000
1500
1000
500
0
FYRA - UH 175% Peaking (Future 2040)
FYRA - UH 150% Peaking (Future 2040)
FYRA - UH 125% Peaking (Future 2040)
FYRA - No UH Peaking (Future 20 40)
0 0.5 1 1.5 2 2.5 3 3.5 4
Hours
Figure 14. Adopted 30-Minute Unit Hydrographs
21

I I I
I I I
11.3 Soil Losses Soil initial and constant losses were those adopted from the 2018 FYRA model. Table 10 lists the soil losses for DS10. Percent imperviousness was also adopted from the FYRA model.
Table 9. Soil Losses
Calibrated Existing Model Loss Rates LP-17 LP-18 LP-19 LP-20A
Initial Loss (in) Constant Loss (in/hr) Existing Condition Imperviousness (%)
0.65 0.65 0.65 0.65 0.5 0.5 0.5 0.5 1 1 1 1
Future Model Loss Rates LP-17 LP-18 LP-19 LP-20A
Initial Loss (in) Constant Loss (in/hr) Future Condition Imperviousness (%)
0.65 0.65 0.65 0.65 0.5 0.5 0.5 0.5 10 10 26 31
11.4 Baseflow Baseflow was not modeled in the original FYRA model and is not modeled in this investigation for DS10.
12 Reservoir Design Flood (RDF) Routing The RDF was used to determine the initial minimum spillway elevation for DS10. The RDF was assumed to be the SPF determined by routing the standard project storm over the watershed upstream of the dam. The unit hydrographs that peaked the combined inflow hydrograph (at the dam) by 125 percent were used in this routing. Future conditions model loss rates described in the previous section of this report were also used. The model computation time steps were 5 minutes and the precipitation for the SPF was in 1-hour increments from the Design Memorandum (DM). The lower level service outlet was operational; this agrees with the Original Design of the existing Papillion Creek Dams based on the 1970s DM documentation (USACE, 1973).
Figure 15 shows the routing of the SPF into the empty dry dam using the 125-percent peaked unit hydrograph. Note that the SPF precipitation is shown in 5-minute increments.
22

.00 0.05 -._
---. 0.10 I:: v .E- 0.15 ....,
0.20 Q) ... 0..
0.25 -,-
0.30 0.35
1,180-
00 1,175-
00 Ci 1,170-~ 1,165 z = 1,160
1,155 1,150 ~
7,000 -
6,000
5,000-
ii 4,000 ,8. i 3,000-
U:: 2,000
1,000
0 1
Reservoir Design Flood - Standard Project IFlood
9~ I
-
,-- ,__ -_J
~
-
,.
-I J
I I I
~.,,,.
I 2 I 3 4 I 5 6 1 I s
1
Precipitation Max 5-min = 0.31 in Max 1-hr = 3.75 in 96-hr total = 15.81 in
I I I
Pooll Elevation
_,__
-
--Peak = 1184.6 ft-NAVD88 -
I I
-lnfllow Peak = 7,494 cfs Vo l = 1,944 AF
Outflow
Peak = 1,479 cfs
I I
9 10 I 11 12 13 14 Jan2000
r----:== .:----
SPIF Precipil11lio11 (5-m· I
Pool Elevation
SPF 111· lll W
SPF Outflow
0
Figure 15. Reservoir Design Flood Routing (precipitation increment 5-minunte depths)
13 Spillway Design Flood Optimization Spillway design flood routing included the Most Reasonable PMF (MR PMF) and the Reasonable High PMF (RH PMF) with future-condition land use. The MR PMF and the RH PMF differed in their PMP depths, soil losses and the peaking of their unit hydrographs. These differences are summarized below. A Reasonable Low PMF (RL PMF) will be determined in another phase of the project.
The adjustments to the RH PMF loss parameters and PMP depths were referenced from Garrison Dam Issue Evaluation Study (EIS) and the unit hydrograph peaking was comparable to that used in the 1975 DM Original Design.
• Most Reasonable PMF (Best Estimate) o Soil loss rates = calibration values (0.65 in initial deficit and 0.5 in/hr infiltration)
23

o Transform = calibrated values, unit hydrograph peaked 150% o PMP = PMP determined from HMR 51&52 optimization
• Reasonable High PMF (Reasonable Worst Case) o Soil loss rates = -25% calibration values (0.49 in initial deficit and 0.38 in/hr
infiltration) o Transform = calibrated values, unit hydrograph peaked 175% o PMP = base PMP with ordinates increased 5%
Both the MR and RH PMFs were routed through the dam to determine spillway and dam embankment design. Dam embankment height was determined as the highest of two options:
1. The RH PMF maximum pool elevation or 2. The MR PMF pool elevation plus three feet.
In the case of this site, the MR PMF plus three feet resulted in the highest elevation and was used to set the dam height.
Engineering Regulation 1110-8-2(FR), Inflow Design Floods for Dams and Reservoirs (USACE, 1991), requires two antecedent pool conditions prior to PMF routings for spillway and dam embankment design. The two antecedent pool conditions are:
1. PMF routed over the full flood control pool and 2. PMF routed over the 5-day drawdown pool.
The 5-day drawdown pool elevation was determined by routing the ½ PMF over the full multipurpose pool with outlets operational followed by the PMF five days later with outlets blocked. The five-day spacing was determined from the peak of the ½PMF and the peak of the PMF following.
In the case of the 5-day drawdown pool simulations, the ½ PMF was routed with the service outlets operational while the PMF following five days later was routed with the outlets blocked. The antecedent flood event is evacuated in less than five days so the starting pool of 5-day drawdown simulation was an empty pool in the case of DS10.
The adopted dam design used the antecedent pool starting at the top of flood control; this antecedent pool produced the highest PMF pool elevation.
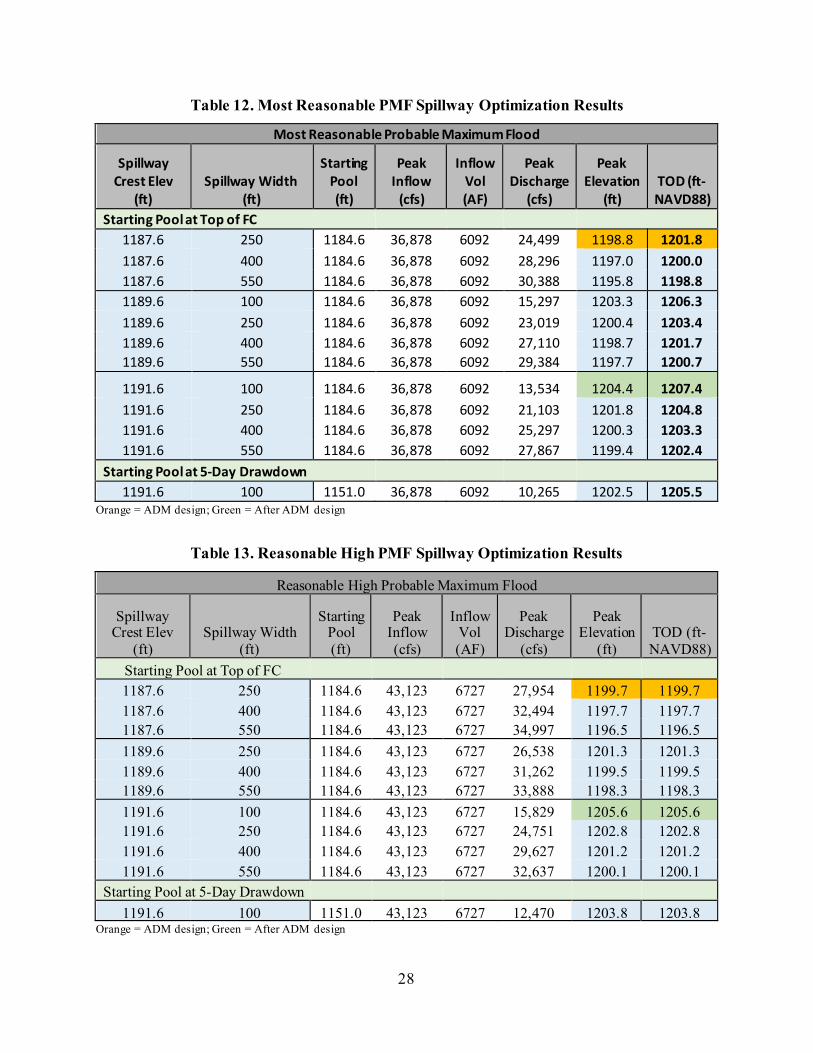
Eleven different spillway crest elevation and width combinations were used to help optimize the spillway and dam embankment height cut-and-fill to reduce costs at the site. Quantities were determined by the project geotechnical engineer. Only the PMF simulations with the antecedent pool starting at full flood control pool were used in this optimization. These produced the highest pools of the two antecedent conditions described previously. The 5-day drawdown scenario was then simulated for only the design with the best balance between spillway cut and embankment fill.
24

Table 10 shows the spillway crest and width combinations for the dam. Table 11 shows the antecedent pool and PMF combinations. Figure 16 compares the Most Reasonable and Reasonable High PMFs.
Table 12 and Table 13 show the results of the family of optimization simulations.
25

I I
I
Table 10. Dam Spillway Crest Elevations and Width Combinations
Simulation ID Spillway Crest Elev (ft-NAVD88) Spillway Width (ft) L250 1187.6 250 L400 1187.6 400 L550 1187.6 550 M100 1189.6 100 M250 1189.6 250 M400 1189.6 400 M550 1189.6 550 H100 1191.6 100 H250 1191.6 250 H400 1191.6 400 H550 1191.6 550
Table 11. Probable Maximum Flood Combinations
Simulation ID Description MR Most Reasonable PMF - 150% UH peaking RH Reasonable High PMF - 175% UH peaking fc Starting pool top of flood control 5d Starting pool top of 5-day drawdown pool
26

,000
40,000
35,000 -
30,000
25,000 -
~ 20,000
15,000 -
10,000
5,000 -
0 12:00
01Jan.2000
DS-10 Probable Maximum IFlood Comparison
I I Reasonable High PMF ~ Peak inf low = 43,100 cfs ~ Vol. = 6727 AF
.~ II I
Most Reasonable PM F I Peak inf low = 36,900 cfs 1-,'
Vol. = 6092 AF II I I I I I 11
I I L I I I
I I I I j I I I I 1 I I
I
00:00
I
I
I
_,. J 12:00
02Jan2000
I
' \ ~
I
00:00
II
Reasonab'le High Pl\1F - - - Most Reasonable mF
112:01 03Jan2000
45
Figure 16. PMF Comparison
27
I
Table 12. Most Reasonable PMF Spillway Optimization Results
Most Reasonable Probable Maximum Flood
Spillway Crest Elev
(ft) Spillway Width
(ft)
Starting Pool (ft)
Peak Inflow
(cfs)
Inflow Vol (AF)
Peak Discharge
(cfs)
Peak Elevation
(ft) TOD (ft-NAVD88)
Starting Pool at Top of FC 1187.6 250 1187.6 400 1187.6 550
1184.6 36,878 6092 24,499 1184.6 36,878 6092 28,296 1184.6 36,878 6092 30,388
1198.8 1197.0 1195.8
1201.8 1200.0 1198.8
1189.6 100 1189.6 250 1189.6 400 1189.6 550
1184.6 36,878 6092 15,297 1184.6 36,878 6092 23,019 1184.6 36,878 6092 27,110 1184.6 36,878 6092 29,384
1203.3 1200.4 1198.7 1197.7
1206.3 1203.4 1201.7 1200.7
1191.6 100 1191.6 250 1191.6 400 1191.6 550
1184.6 36,878 6092 13,534 1184.6 36,878 6092 21,103 1184.6 36,878 6092 25,297 1184.6 36,878 6092 27,867
1204.4 1201.8 1200.3 1199.4
1207.4 1204.8 1203.3 1202.4
Starting Pool at 5-Day Drawdown 1191.6 100 1151.0 36,878 6092 10,265 1202.5 1205.5
Orange = ADM design; Green = After ADM design
Table 13. Reasonable High PMF Spillway Optimization Results
Reasonable High Probable Maximum Flood
Spillway Crest Elev
(ft) Spillway Width
(ft)
Starting Pool (ft)
Peak Inflow (cfs)
Inflow Vol (AF)
Peak Discharge
(cfs)
Peak Elevation
(ft) TOD (ft-NAVD88)
Starting Pool at Top of FC 1187.6 250 1187.6 400 1187.6 550
1184.6 43,123 6727 27,954 1184.6 43,123 6727 32,494 1184.6 43,123 6727 34,997
1199.7 1197.7 1196.5
1199.7 1197.7 1196.5
1189.6 250 1189.6 400 1189.6 550
1184.6 43,123 6727 26,538 1184.6 43,123 6727 31,262 1184.6 43,123 6727 33,888
1201.3 1199.5 1198.3
1201.3 1199.5 1198.3
1191.6 100 1191.6 250 1191.6 400 1191.6 550
1184.6 43,123 6727 15,829 1184.6 43,123 6727 24,751 1184.6 43,123 6727 29,627 1184.6 43,123 6727 32,637
1205.6 1202.8 1201.2 1200.1
1205.6 1202.8 1201.2 1200.1
Starting Pool at 5-Day Drawdown 1191.6 100 1151.0 43,123 6727 12,470 1203.8 1203.8
Orange = ADM design; Green = After ADM design
28

Site 10: ADM Dry Dam Vol. 3,587 AF
Top of Dam: (1201.8 ft-NAVD88) - - - - - -~-~
""~l.ll.lll.lS:Wi21l.illlLLl:M~QJ?JJ1.ll:!.!/l8!.J.8~ ft.:!-N~A~Vl!D2.!8H;8[L ____ _:-=--::~L'::-:~--.-.-:'--.L._ Reasonable High PM F Pool (1199.7 ft-NAVD88)
Spillway Crest (Perched): 1187.6 ft-NAVD88 ----1--- ---Vol. 1,415 AF
Min Spillway Crest/Top of FC: 1184.6 ft-NAVD88
Total Vol. (To MR PMFj 3376 AF Total Vol. (To RH PMF) 3587 AF
RDF (SPF) routed over dry pool
Dry Dam -no permanent pool
Low Elev: 1151 ft-NAVD88
ost Reasonable PMF
= 24,500 cfs
14 Dam Designs Leading to the NED Plan This section documents the DS10 designs leading to the NED Plan. These are important because they illustrate the changes that were incorporated as the study progressed.
Figure 17 shows the ADM design. This design did not have a balance of cut and fill at the time of the ADM meeting. The highest PMF pool (1201.8 ft) of the designs considered at that time was used. However, it was determined after ADM that when cut and fill was assessed for various designs that a smaller spillway cut with higher pool and dam was more economical.
Figure 18 shows the After ADM design. This design was used because it had the best balance of spillway cut and embankment fill at the site. The biggest change in the design was the decrease in the spillway width from 250 to 100 ft.
Figure 19 and Figure 20 show the spillway design flood routings for the After ADM Design for the Reasonable High PMF. Required starting pool elevations were the top of flood control and the 5-day drawdown pool as required by ER 1110-8-2(FR). In the case of the 5-day drawdown pool simulations, the ½ PMF was routed with the service outlets operational; the PMF following five days later was routed with the outlets blocked. The antecedent flood event is evacuated in less than five days so the starting pool of 5-day drawdown simulation for the PMF was an empty pool.
The combination of the Most Reasonable PMF with the antecedent pool set to the top of flood control was used to inform the top of dam elevation. Three feet of freeboard with the Most Reasonable PMF was assumed to set the top of dam elevations. The Reasonable High PMF pool was used to determine the Real Estate flowage easement.
Refer to Section 18 for information on the selected design.
Figure 17. Dry Dam Design (ADM Design)
29

Site 10: After ADM Dry Dam
Top of Dam: (1207.4 ft-NAVD88)
ool 1204.4 ft-NAVD88 - ----1-'--~\-------l[__ Reasonable High PMF
Total Vol. (To MR PMF) 4821 AF Total Vol. (To RH PMF) 5172 AF
Vol. 4,821AF
Spillway Crest (Perched): 1191.6 ft-NAVD88 ---1-7----.._ Vol.1,992AF
Min Spillway Crest/Top of FC: 1185.0 ft-NAVD88 Vol. 1,097 AF
RDF (SPF) routed over dry pool
Dry Dam-no permanent pool
Low Elev: 1151 ft-NAVD88 Inlet invert= 1154.0 ft
NAVD88
Pool {1205.6 ft-NAVD88)
t Reasonable PMF 13,700 cfs
Figure 18. Dry Dam Design (After ADM Design)
Table 14. Pertinent Information (Precipitation)
Precipitation (in) Reasonable High Probable Maximum Precipitation (RH PMP) - 1.05*MR PMP 72-hour total depth (in) 1-hour max depth (in) 5-min max depth (in) Most Reasonable Probable Maximum Precipitation (MR PMP) 72-hour total depth (in) 1-hour max depth (in) 5-min max depth (in) Reservoir Design Flood Precipitation - SPS (Dry Dam Design) 96-hour total depth (in) 1-hour maximum depth (in) 5-min max depth (in)
39.1 15.3 1.68
37.2 14.6
1.6
15.81 3.75 0.31
30

Table 15. Design Pertinent Information (ADM & After ADM Designs)
Design Events ADM Design (Dry
Dam) After ADM (Dry
Dam) Spillway Design Flood - RH PMF Peak inflow (cfs) 43,100 43,100 Peak outflow (cfs) 28,000 15,800 Inflow volume (AF) Spillway Design Flood - MR PMF
6727 6727
Peak inflow (cfs) 36,900 36,900 Peak outflow (cfs) 24,500 13,500 Inflow volume (AF) Reservoir Design Flood
6092 6092
Peak inflow (cfs) 7,490 7,490 Peak outflow (cfs) 1,480 1,480 Inflow volume (AF) 1944 1944
Elevations (ft-NAVD88) ADM Design (Dry
Dam) After ADM (Dry
Dam) Top of Dam 1201.8 1207.4 RH PMF Pool 1199.7 1205.6 MR PMF Pool 1198.8 1204.4 Spillway Crest 1187.6 1191.6 Top of Flood Control Pool 1184.6 1184.6 Top of Multipurpose Pool - -Outlet Invert Elevation 1151.0 1151.0 Min Pool Elevation 1151.0 1151.0
Storage (AF) ADM Design (Dry
Dam) After ADM (Dry
Dam) Top of Dam 4111 5726 RH PMF Pool 3587 5172 MR PMF Pool 3376 4821 Spillway Crest 1415 1992 Top of Flood Control Pool 1055 1055 Top of Multipurpose Pool 0 0 Outlet Invert Elevation 0 0
31

,110 Re,aso,nabl1e High PiMF - sp·11way Crest at 119,1..6 ft-NA:VD88 0.0
0.2 ~ l I I I 0.4
0.6 e 5 0.8 _go
PIMP -Max 5-min depth = 1.6.8 in .. Max 1-hr depth = 15.3 iin
- 72-hr total = 39.1 in ... ~ HI CL
~
1.2
1.4 ... -1,8
1.8
1,205 t-- I I I ' I Max lP001I 100 ft Spill = 1205.6 ft
1,200 .
@ ~
~ 1,195 ~ * I
-
1,190
tJ 1,185 .:Harting poon t op FCl = 1 184.6 ft +
...-. .,,,
0,000
35,000
30,000
25,000
S 20,000 i [;: 15,000
10,000
5,000
0
■
I
00:00 12:,00
I 01Jali12000
--
l ~ I I I
00:00 12_00 00,00
02Jari2000 I
I
Inflow Peak Flow = 43,100 ds
Outflow Peak Flow = 15,800 ds
I
12:00 00:00 o,3Ja112000, I
I
12:00
04Jan2000
"
- ------
I
00:00
I
~f P,reop efion (5-:111i11)
Pl F Elev - 100 Spiway
MF ~ now - 00 ft Spilwil)'
PMF Oulfllw • 100 ft Sp lwa:
Figure 19. After ADM Design - Starting Pool Top of Flood Control
32

0.4
0.6 C
Q. 0.8 -
·u ~ 1.0
Q_
1.2
1.4
1.6
1,200
1,190
<I= 1,180
1 HO
1,160
1.150
40,000
35,000
30 000
~25000 ~ ~ 20,000
i 15,000 LL
10,000
5,000
0 1
~
I ~
--
LJ
DS-10 Ory Dam Reasonable High PMF-5 Day Drawdown
..
Service
outlet
operational
..
l + -
-
- I I I
RH PMP -
. I-Max 5-min d epth = 1.68 in
-Max 1-lu depth= 15.3 in 72-hr total = 39.1 in -
-I-- RH 1/2 PMP -
Max 5-min d epth = 0.87 in -Max 1-lu depth= 7.9 in
-+- 72-hr total = 20.2 in -
j Max Pool
100 ft Spill = 1203.8 ft
Service + .. out let
' I j blocked
f r
ervice
ut~e
operatio nal
S r en/Lc
out let
blocke
RH PMF Peak Inflow= 43, 100 cfs Peak Outfl ow = 12,470 cfs
RH½ PMF Pea k Inflow = 21,600 cfs : t Pea k Outfl ow = 1,660 cfs
--+---+----+--- 4 ~--+---+---
.. + ..
4 5 I 6 7 8 9 10 11 12 13 14 Ja112000
-Precipitation (5---min, in)i
Elevation (ff-NAV088)
Inflow (cfs)
oum:ow (cfs)
0.2
Figure 20. After ADM Design - Starting Pool 5-Day Drawdown
33

15 Hypothetical Design Storm Modeling Two hypothetical scenarios were modeled:
1. Dry dam future conditions 2. Dry dam existing conditions
The hypothetical design storms were routed into an empty reservoir because the dam has no permanent pool. Hypothetical or frequency events included the 0.2-, 0.5-, 1-, 2-, 4-, 10-, 20-, 50-and 99.9-percentAEP events (500-, 200-, 100-, 50-, 25-, 10-, 5- and 2- year events). Results shown are for existing and future conditions. Both sets of hydrographs were provided to the Omaha District Hydraulics section.
The hypothetical precipitation were NOAA Atlas 14 12-hour depths with temporal patterns and areal reductions from the Applied Weather Associates (AWA) study documented in Appendix J of the FYRA 2018 (FYRA, 2018). Temporal pattern calculations are shown in Appendix H of the FYRA report. These are the same events used in the project before TSP.
Table 16 shows the 12-hour NOAA Atlas 14 precipitation depths used for the frequency events. Appendix A-1B shows temporal patterns for those events not determined by FYRA. The FYRA report shows the other temporal events.
Table 17 and Table 18 and Figure 21 and Figure 22 summarize the outflows from the dry dam for these nine events with existing and future conditions. The unit hydrograph without peaking was used.
Note that a 70 square mile storm area was used in the analysis for cost-benefit calculations instead of the 10 square mile storm area. This was a decision made by the Omaha District Hydraulics section. The flows out of DS10 were used to design the proposed Little Papillion Creek levee which had a drainage area of about 70 square miles.
Table 16. NOAA Atlas 14 12-hour Depths
Duration
NOAA Atlas 14 Precipitation Depth 99.9% AEP
50% AEP
20% AEP
10% AEP
4% AEP
2% AEP
1% AEP
0.5% AEP
0.2% AEP
12-hr 1.88 2.64 3.33 3.96 4.94 5.77 6.67 7.65 9.06
34

Table 17. Existing Conditions Frequency Events
Event (AEP%)
Return Period
(YR)
Peak Inflow
(cfs)
Peak Outflow
(cfs)
Starting Pool
Elevation (ft)
Peak Elevation
(ft)
Rise in Pool (ft)
0.2 500 6,145 1,397 1151 1181.3 30.3 0.5 200 4,953 1,330 1151 1178.8 27.8 1 100 4,139 1,276 1151 1176.9 25.9 2 50 3,390 1,215 1151 1174.8 23.8 4 25 2,696 1,145 1151 1172.5 21.5
10 10 1,893 1,043 1151 1169.5 18.5 20 5 1,391 952 1151 1167 16 50 2 851 790 1151 1163.1 12.1
99.9 1 294 293 1151 1155.9 4.9
Table 18. Future Conditions Frequency Events
Event (AEP%)
Return Period
(YR)
Peak Inflow
(cfs)
Peak Outflow
(cfs)
Starting Pool
Elevation (ft)
Peak Elevation
(ft)
Rise in Pool (ft)
0.2 500 6,371 1,414 1151 1182 31 0.5 200 5,175 1,349 1151 1179.5 28.5 1 100 4,361 1,297 1151 1177.6 26.6 2 50 3,611 1,240 1151 1175.6 24.6 4 25 2,924 1,175 1151 1173.5 22.5
10 10 2,110 1,078 1151 1170.5 19.5 20 5 1,600 997 1151 1168.2 17.2 50 2 1,063 876 1151 1165.1 14.1
99.9 1 494 491 1151 1157.9 6.9
35

-10 Dry Dam Hypot het ical Frequency Event s - Exist ing Condit ions
~ -2,
cs: .9. u...
CD CD 0
~
1,600
1,400
1,200
1,000
800
600
400
200
0
1,180
1,175
1,170
---
---
---
Jl
~ 1,165
1,160
1,155 ---
1,150 00 :00
I
i ~
~ ' Jr~ \\ f h ' ' ' ' ' r
I
' ~ ,~
A
~ \ \ \\ V\\
(\ \ \ (\
f
I
\I ' ~ ~
II,,
I I
12:00
01J an 2050
\
I
00 :00
I
I I
12:00
02Jan2050
00:01
I
Outflow 0.2% A EF
Outflow 0.5% A EF
Outflow 1 % A EF
Outflow 2%AEF
Outflow 4% A EF
Outflow 10%AEF
Outflow 20% A EF
Outflow 50% A EF
Elev ation 0.2% A EF
Elev ation 0.5% A EP
Elev atio n 1%AEF
Elev ation 2%AEF
Elev atio n 4%AEF
Elevation 1 0% A EF
Elev ation 20% A EF
E.lev atio n 50% A EF
Figure 21. Existing Conditions Frequency Event Outflows and Pool Elevations
36

;.: a
c;::
DS-10 Dry Dam Hypothet ical Frequency Events - Future Conditions 1,600
1,400
1,200
1,000
-
~ "' ~y ~\ ., 800
' ' ' ' ' ' rJrr
600
400 ---
200
0
~ I/
1,180
1,175 --
1,170
1,165
1,160 --D11111
1,155
~ 1,150
00:00
I
\ \ ~
0..
~ ~ (:\\\ \\ h\ \\ \ \ \ / 1
- --
\
' ~ ~ . I I
12:00
01Jan2050
I I
00:00
I
I I
12:00
02Jan2050
00 :01
I
Outflow 0.2% A EF
Outflow 0.5% A EF
Outflow 1%AE.F
Outflow 2% A EF
Outflow 4% A EF
Outflow 10%AEF
Outflow 20% A EF
Outflow 50%AEF
Elev ation 0.2% A EP
Elev ation 0.5% A E.F
Elev ation 1 % A EF
Elev ation 2% A EF
Elevation 4% A EF
EJev at io n 1 0% A E F
Elev ation 20% A EF
Elev ation 50% A EF
Figure 22. Future Conditions Frequency Event Outflows and Pool Elevations
37

Site 10: After ADM Cost Optimization (275-Year Level of Protection)
Top of Dam: (1200.7 ft-NAVD88)
Reasonable High PMF Pool _.:.._ _____ _..:... ____ -_--l_,:..,__~_-'--:.__~ ~ - (1198. 7 ft-NAVD88) Most Reasonable PMF Pool (1197.7 ft-NAVD88)
PM F routed over full flood control pool
Min Spillway Crest/Top of FC: 1182.0 ft-NAVD88
*Sto rm was the 500-year 70
square mile event used in
screen ing analysis. This is the 275-year event at the dam.
Therefo re, level of protection is
275 year and not 500 year.
500-year routed over dry pool*
Dry Dam - no permanent pool
Low Elev: 1151 ft-NAVD88
Most Reasonable PMF
Qp = 21,500 cfs
16 Cost Optimization Cost optimization was undertaken to determine if DS10 could produce the same benefits of the current design (NED Plan) at a lower cost. The additional costs of the lining and excavation of the spillway resulted in higher costs than the design with the spillway crest at the top of the RDF.
In this analysis, the spillway was excavated to the 275-year level of protection for a 70-square mile rainfall event and lined to help protect the spillway from more frequent flows. In comparison, the original level of protect was the RDF, an event larger than the 0.2 percent AEP (~500-year event). The level of protection is the return period of the event that produces spillway flow. Note that the 275-year event was used opposed to the 500-year event to avoid running an additional benefit analysis which would affect schedule and study costs.
The spillway crest was lowered to the peak pool of the 275-year 70-square mile event over the drainage area behind the dam. Again, this was the equivalent to the 500-year 70-square mile rainfall event used in the analysis of alternatives downstream. Rainfall intensities increase with smaller drainage areas in accepted guidance.
Figure 23 shows this scenario. A dam with this level of protection has the following:
• Top of dam = 1200.7 ft NAVD88 • Spillway crest = 1182.0 ft NAVD88 • Spillway width = 100 ft • Flowage easement pool or RH PMF pool = 1198.7 NAVD88
Figure 23. Decreased Level of Protection Scenario
17 Study Risks Identified study risks related to modeling of DS10 outlined below.
38

17.1 Model Calibration Events The Papillion Creek watershed does not have a long history of gauge data to which to calibrate the model. The three events used to calibrate the FYRA model were all recent events and all occurred in the month of June. In comparison, the 1975 DM (USACE, 1975) estimated the unit hydrograph for the site from six events at the Irvington stream gauge downstream that were much larger than those used in the FYRA calibration.
This is a minor to moderate risk. It could lead to parameter adjustment in the model as the watershed experiences historic events in the future.
This risk was mitigated by incorporating additional unit hydrograph peaking in the RH PMF analysis used to determine the maximum pool that also informed the flowage easement.
17.2 Dry Dam Storage Loss Due to Sedimentation While the dry dam culvert design is expected to efficiently pass sediment, no analysis was conducted to determine expected sedimentation and future storage loss impacts to flood risk reduction.
This is a minor to moderate risk. It could be mitigated with additional reservoir sedimentation study.
17.3 Dam Safety Risk Analysis The feasibility analysis to date has included very limited dam safety risk analysis and has not compared risk across alternatives.
This is a moderate risk. However, risk analysis is planned in next steps to mitigate this risk.
18 NED Design Figure 24 shows the design of DS19 adopted as the NED after optimization and incorporating input from other disciplines. The conduit outlet invert was raised from 1151.0 ft to 1154.0 ft NAVD88 to elevate the outlet into more stable geology (glacial till). This change increased the top of flood control pool (determined by the RDF) by 0.4 feet, but it did not produce a perceptible increase in the PMF poolelevations. Results developed up to this point in the study using the After ADM Dry Dam Design were not negatively impacted by this change. See Appendix A-1A of this document for more information on sensitivity testing.
The RDF was not modified but retained as the SPF as was the case in previous designs. This is the event used to determine flood control pools for the existing Papillion Creek Dams as well.
Figure 25 and Table 19 show the outlet rating curve used for this design. Capacity and spillway curves remain the same as documented previously.
Figure 26 shows the spillway design flood routing and Figure 27 shows the RDF routing.
39

Site 10: NED Plan
Top of Dam: (1207.4 ft-NAVD88) --- ---~--
"'-:-;:'-~LIS.IWi20.GIIU:M.IE..fl!?..2.l.il;~0~4L.:.41.f!ft::.!-N::l.JA~Vl!D2.!8l..!:8u_ ____ ___:-::-::-::::;i::-=:- -'--__..I...__ Reasonable High PMF Pool
Vol. 4,821AF
Total Vol. (To MR PMF) 4821 AF Total Vol. (To RH PMF) 5172 AF
Spillway Crest (Perched): 1191.6 ft-NAVD88 ---#-7---~ Vol.1,992AF
Min Spillway Crest/Top of FC: 1185.0 ft-NAVD88 Vol.1,097 AF
RDF (SPF) routed over dry pool
Dry Dam-no permanent pool
Low Elev: 1151 ft-NAVD88 Inlet invert= 1154.0 ft
NAVD88
(1205 .6 ft-NAVD88)
t Reasonable PMF
13,700 cfs
Figure 24. NED Design
40

NED: DS10 Dry Dam Outlet Rating Curve 8ft(S)x7ft(R) Box Culvert
1150
1160
1170
1180
1190
1200
1210
DS10
0 200 400 600 800 1000 1200 1400 1600 1800 2000
Discharge (cfs)
Figure 25. NED Outlet Rating Curve
41

Table 19. NED Outlet Rating Curve
Elevatio n (ft
NAVD88 )
Discharg e (cfs)
Elevatio n (ft
NAVD88 )
Discharg e (cfs)
Elevatio n (ft
NAVD88 )
Discharg e (cfs)
Elevatio n (ft
NAVD88 )
Discharg e (cfs)
1154.0 0.0 1167.0 831.1 1180.0 1279.0 1193.0 1606.6 1154.5 9.6 1167.5 852.7 1180.5 1293.1 1193.5 1617.8 1155.0 27.2 1168.0 873.7 1181.0 1307.1 1194.0 1629.0 1155.5 50.0 1168.5 894.3 1181.5 1321.0 1194.5 1640.1 1156.0 77.0 1169.0 914.4 1182.0 1334.6 1195.0 1651.2 1156.5 107.7 1169.5 934.1 1182.5 1348.2 1195.5 1662.2 1157.0 141.5 1170.0 953.3 1183.0 1361.6 1196.0 1673.1 1157.5 178.3 1170.5 972.2 1183.5 1374.9 1196.5 1683.9 1158.0 217.9 1171.0 990.7 1184.0 1388.1 1197.0 1694.7 1158.5 260.0 1171.5 1008.9 1184.5 1401.1 1197.5 1705.3 1159.0 304.5 1172.0 1026.8 1185.0 1414.0 1198.0 1716.0 1159.5 351.3 1172.5 1044.3 1185.5 1426.8 1198.5 1726.5 1160.0 400.3 1173.0 1061.6 1186.0 1439.5 1199.0 1737.0 1160.5 451.4 1173.5 1078.6 1186.5 1452.0 1199.5 1747.5 1161.0 504.4 1174.0 1095.3 1187.0 1464.5 1200.0 1757.8 1161.5 539.3 1174.5 1111.7 1187.5 1476.9 1200.5 1768.1 1162.0 572.0 1175.0 1128.0 1188.0 1489.1 1201.0 1778.4 1162.5 602.9 1175.5 1144.0 1188.5 1501.3 1201.5 1788.6 1163.0 632.4 1176.0 1159.8 1189.0 1513.3 1202.0 1798.7 1163.5 660.5 1176.5 1175.3 1189.5 1525.3 1202.5 1808.8 1164.0 687.4 1177.0 1190.7 1190.0 1537.2 1203.0 1818.8 1164.5 713.4 1177.5 1205.9 1190.5 1549.0 1203.5 1828.8 1165.0 738.4 1178.0 1220.8 1191.0 1560.6 1204.0 1838.7 1165.5 762.7 1178.5 1235.6 1191.5 1572.3 1204.5 1848.5 1166.0 786.1 1179.0 1250.3 1192.0 1583.8 1166.5 808.9 1179.5 1264.7 1192.5 1595.2
42

I0 Reasonable Hig'h PMF - Spillway Crest a,t 1191.6, lft--NA,VD88
"e ~ C1 -~
,Si:
<I>
~
I .!:
$
0.0
0.2
0.4
0.6
0.8
1.0
1.2
1.4
1.6
1.8
1.205
1.200
1.115
1,1
0,000
35.000
30,000
25.000
~ 20000 ~ .
;::::: 15,000
110,000
5,000
PMP' M ax S~mi depth = 1.'68 in M ax 1-h r dep,th = 15.3 in
72-hr c t .ail = 39.1 in
Maix Pool 1.00 ft Spilll = l. 205.6
j I lllnflo'liV
Peaik Flow = 43,1.00 cfs
Outflrniv Peai Flow = 15,900 cfs
0-1-------c:.......,E_...:-..;:::: ______ .,..... ___ _,
OOnOO 1 12;00 00;00 1 01Jan2000 1 I
P!~F nflow- ·100 ft St;!lwini
~ FO -100 Splwll()'
Figure 26. NED Spillway Design Flood -- PMF Routed Over Full Flood Control Pool
(Outlet Blocked)
43

§, 0. <..> Q) ... a..
0.00
0.05
0.10
0.15
0.20
0.25
0.30 0.35
1,185
1,180 ~ 1,175 Cl i 1,170
~ 1,165 1,160
1,155 1,150
7,000
6,000
5,000
:§' 4,000 ... I 3,ooo Li: 2,000
1,000
0
----
-
-
-----
--
-
-
Reservoir Design Flood • Standard IP·roject Flood
-- i .. __ l -- I I Pr,eci pitation - -Max 5-min = 0.31 in Max 1-hr = 3.75 in --96-hr tota l = 15.81 in
--
- . ,-- - t -~t t I ,
Pool Elevation -Peak = 1185.0 ft-lNAVD88 -
~ -
-- - -I I
I Inflow - Peak = 7,494 cfs -Vol = 1,944 AF
I
-- Outflow Peak = 1,413 cfs
-e-L i,, ..._ I
I I
I I I I I I I I 1 2 3 4 5 6 7 8 9 10 111 12 13 14
Jan2000
-SPS Precip~atilrn (5-minJ
Pvol Eleva.tion
RDF Inflow
RDF Outflow
Figure 27. NED Reservoir Design Flood -- SPF Routed Over Full Multipurpose Pool
(Outlet Functional)
19 Equivalent Period of Record Based on reference to Table 4-5 in EM 1110-2-1619, the equivalent years of record for a rainfall-runoff model calibrated to several events recorded at a short-interval gauge in the watershed is somewhere between 20-30 years.
The recommended equivalent years of record for the Papillion Creek GRR project is 23 years. Several locations were used in the calibration of the model, but the events used were small in comparison with the historic and moderate events of record (except in the Papillion Creek at Fort Crook location). However, the watershed has changed significantly since these historic events (like the 1964 flood) so calibration to these larger events would not reflect current conditions.
In addition, the model was calibrated to events and not peak flow frequencies. Calibration or verification to a peak flow frequency at a gauge would have decreased uncertainty in model
44

results and resulted in a longer equivalent record. Twenty-three years opposed to 20 was selected to include the higher confidence due to the availability of higher-quality calibration data like radar rainfall.
The estimate of 23 year of equivalent years of record was used for both the existing and future conditions. Future conditions (2040) are not that far in the future so an assumption of 23 years (the same uncertainty in data) was considered reasonable.
20 References FYRA. 2018. Papillion Creek Watershed Hydrologic Analysis. Final Submittal. Prepared for the Papio-Missouri Natural Resources District. October 2018.
HEC. 2020. HEC-HMS version 4.4beta. February 2020.
MMC. 2017. MMC Precip Tool v1.2.0. Modeling Mapping and Consequence Center. March 2017.
USACE. 1991. ER 1110-8-2(FR). Inflow Design Floods for Dams and Reservoirs. U.S. Army Corps of Engineers. March 1991.
USACE. 1975. Papillion Creek and Tributaries Lakes Nebraska. Specific Design Memorandum No. MPC-33 Site 10. Army Engineering District, Omaha. Corps of Engineers Omaha, Nebraska. May 1975.
USACE. 1973. Papillion Creek and Tributaries lakes Design Memorandum No. MPC-22 Preliminary Development & Site Selection. U.S. Army Engineer District Omaha, Nebraska. February 1973.
USACE. 1971. Papillion Creek and Tributaries Nebraska General Design Memorandum No. MPC-10. U.S. Army Corps of Engineers Omaha District. August 1971.
WEST, 2013. Sedimentation Conditions at the Papio Creek Projects Updated August 2013. M.R.B. Sediment Memorandum 19a.
45

Appendix A-1A. Increase in Outlet Invert
A

Site 10: After ADM Dry Dam
Total Vol. (To MR PMF) 4821 AF Total Vol. (To RH PMF) 5172 AF
Top of Dam: (1 207.4 ft-NAVD88)
4 -NAVD88 - ---,~ - -\--__.1._- Reasonable High PMF
Vol. 4,821AF Pool (1205 .6 ft-NAVD88)
Spillway Crest (Perched): 1191.6 ft-NAVD88 ----#-7- - Vol. 1,992 AF
M in Spillway Crest/Top of FC: 1185.0 ft-NAVD88 t Reasonable PMF Vol. 1,097 AF 13,700 cfs
RDF {SPF) routed over dry pool
Dry Dam -no permanent pool
Low Elev: 1151 ft-NAVD88 let invert = 1154.0 ft ·
Increase in Outlet Invert This appendix summarized impacts to the results after the outlet invert of the dam was raised three feet from 1151.0 ft to 1154.0 ft NAVD88. Results presented previously were largely not sensitive to this change or their change would not negatively impact the benefit cost ratio results for the project. Figure A1 shows the conceptual design of the dry dam after the outlet invert of the box culvert is raised three feet.
Results that differed from those presented in this Addendum included:
• A 0.4-foot increase in the flood control pool (from 1184.6 ft to 1185.0 ft NAVD88). This increased the starting pool of the inflow design flood, but this did not affect the top of dam or flowage easement elevations. The updated PMF routing results are shown in Figure A2.
• A decrease in peak outflows for the frequency events (0.2 to 50 percent annual exceedance probabilities (AEP)) from 70 to 90 cfs. This increases the benefits of the project and would not negatively affect the benefit cost ratio. Table A1 shows the updated results.
• An increase in the peak pool elevations created by the frequency events. These changed from 1 foot for the 50 percent AEP to 0.3 of a foot for the 0.2 percent AEP. These increases would not affect the benefit cost ratio because real estate acquisitions are not dependent on these changes. Table A1 shows the updated results.
Figure A1. DS10 NED Plan with Raised Outlet
B

PMF Loading 1210
r f f 60,000
Dam Crest= 1207.4 ft 1205 --Pool Elevation 50,000
--Inflow 00 00 1200 0 --Outflow 40,000
~ z £ 1195 C: .Q I
~ u 30,000 3
.2 u...
+-' ro ::, 1190 ~
Spillway Crest= 1191.6 ft 20,000 I..LJ
1185 Flood Control= 1185.0 ft
10,000
1180 0
o6v~~~%~~~~~~~~~%~~½~
Hours
Figure A2. After ADM Design – Starting Pool Top of Flood Control (Outlet Raised)
Table A1. Frequency Event Results with Raised Outlet
Event (AEP%)
Event (YR)
Peak Inflow
(cfs)
Peak Outflow
(cfs)
Starting Pool
Elevation (ft)
Peak Elevation
(ft-NAVD88)
Rise in Pool (ft)
Change in Flow
with Raise (cfs)
Change in Elev with Raise (ft)
0.2 0.5 1 2 4 10 20 50
500 200 100 50 25 10 5 2
6371 5175 4361 3611 2924 2110 1600 1063
1343 1276 1221 1162 1096 994 912 790
1154 1154 1154 1154 1154 1154 1154 1154
1182.3 1179.9 1178
1176.1 1174
1171.1 1168.9 1166.1
28.3 25.9 24
22.1 20
17.1 14.9 12.1
71 73 76 78 79 84 85 86
0.3 0.4 0.4 0.5 0.5 0.6 0.7 1
C

Appendix A1-B. Rainfall Hyetographs
D

t
1-Year Local Storm 12 Hour Rainfall Depth (in) 1.88 Atlas 14, 2 Year (lower bound of 90% confidence limit)
Storm Size (sq mi) 10 20 30 50 70 95 120 150 200 250 300 400 ARF % Rainfall Depth (in)
98 1.84
96.1 1.81
94.4 1.77
91.1 1.71
88.4 1.66
85 1.6
82.4 1.55
79.4 1.49
75.6 1.42
72.8 1.37
70.7 1.33
68 1.28
Storm Time (hours) Cumulative % 0 0 0 0 0 0 0 0 0 0 0 0 0 0
0.17 0.1 0 0 0 0 0 0 0 0 0 0 0 0 0.33 0.2 0 0 0 0 0 0 0 0 0 0 0 0 0.50 0.4 0.01 0.01 0.01 0.01 0.01 0.01 0.01 0.01 0.01 0.01 0.01 0.01 0.67 0.6 0.01 0.01 0.01 0.01 0.01 0.01 0.01 0.01 0.01 0.01 0.01 0.01 0.83 0.8 0.01 0.01 0.01 0.01 0.01 0.01 0.01 0.01 0.01 0.01 0.01 0.01 1.00 1 0.02 0.02 0.02 0.02 0.02 0.02 0.02 0.01 0.01 0.01 0.01 0.01 1.17 1.3 0.02 0.02 0.02 0.02 0.02 0.02 0.02 0.02 0.02 0.02 0.02 0.02 1.33 1.5 0.03 0.03 0.03 0.03 0.02 0.02 0.02 0.02 0.02 0.02 0.02 0.02 1.50 1.7 0.03 0.03 0.03 0.03 0.03 0.03 0.03 0.03 0.02 0.02 0.02 0.02 1.67 1.9 0.03 0.03 0.03 0.03 0.03 0.03 0.03 0.03 0.03 0.03 0.03 0.02 1.83 2.2 0.04 0.04 0.04 0.04 0.04 0.04 0.03 0.03 0.03 0.03 0.03 0.03 2.00 2.6 0.05 0.05 0.05 0.04 0.04 0.04 0.04 0.04 0.04 0.04 0.03 0.03 2.17 3.1 0.06 0.06 0.05 0.05 0.05 0.05 0.05 0.05 0.04 0.04 0.04 0.04 2.33 3.6 0.07 0.07 0.06 0.06 0.06 0.06 0.06 0.05 0.05 0.05 0.05 0.05 2.50 4.2 0.08 0.08 0.07 0.07 0.07 0.07 0.07 0.06 0.06 0.06 0.06 0.05 2.67 5 0.09 0.09 0.09 0.09 0.08 0.08 0.08 0.07 0.07 0.07 0.07 0.06 2.83 6 0.11 0.11 0.11 0.1 0.1 0.1 0.09 0.09 0.09 0.08 0.08 0.08 3.00 7.5 0.14 0.14 0.13 0.13 0.12 0.12 0.12 0.11 0.11 0.1 0.1 0.1 3.17 9 0.17 0.16 0.16 0.15 0.15 0.14 0.14 0.13 0.13 0.12 0.12 0.12 3.33 10.5 0.19 0.19 0.19 0.18 0.17 0.17 0.16 0.16 0.15 0.14 0.14 0.13 3.50 12.5 0.23 0.23 0.22 0.21 0.21 0.2 0.19 0.19 0.18 0.17 0.17 0.16 3.67 14.5 0.27 0.26 0.26 0.25 0.24 0.23 0.22 0.22 0.21 0.2 0.19 0.19 3.83 17 0.31 0.31 0.3 0.29 0.28 0.27 0.26 0.25 0.24 0.23 0.23 0.22 4.00 19.5 0.36 0.35 0.35 0.33 0.32 0.31 0.3 0.29 0.28 0.27 0.26 0.25 4.17 22.5 0.41 0.41 0.4 0.38 0.37 0.36 0.35 0.34 0.32 0.31 0.3 0.29 4.33 25.5 0.47 0.46 0.45 0.44 0.42 0.41 0.4 0.38 0.36 0.35 0.34 0.33 4.50 29.5 0.54 0.53 0.52 0.5 0.49 0.47 0.46 0.44 0.42 0.4 0.39 0.38 4.67 33.5 0.62 0.61 0.59 0.57 0.56 0.54 0.52 0.5 0.48 0.46 0.45 0.43 4.83 38.5 0.71 0.7 0.68 0.66 0.64 0.62 0.6 0.57 0.55 0.53 0.51 0.49 5.00 43.5 0.8 0.79 0.77 0.74 0.72 0.7 0.67 0.65 0.62 0.6 0.58 0.56 5.17 49.5 0.91 0.9 0.88 0.85 0.82 0.79 0.77 0.74 0.7 0.68 0.66 0.63 5.33 55.5 1.02 1 0.98 0.95 0.92 0.89 0.86 0.83 0.79 0.76 0.74 0.71 5.50 62.5 1.15 1.13 1.11 1.07 1.04 1 0.97 0.93 0.89 0.86 0.83 0.8 5.67 70.5 1.3 1.28 1.25 1.21 1.17 1.13 1.09 1.05 1 0.97 0.94 0.9 5.83 77.5 1.43 1.4 1.37 1.33 1.29 1.24 1.2 1.15 1.1 1.06 1.03 0.99 6.00 83.5 1.54 1.51 1.48 1.43 1.39 1.34 1.29 1.24 1.19 1.14 1.11 1.07 6.17 88.5 1.63 1.6 1.57 1.51 1.47 1.42 1.37 1.32 1.26 1.21 1.18 1.13 6.33 91.5 1.68 1.66 1.62 1.56 1.52 1.46 1.42 1.36 1.3 1.25 1.22 1.17 6.50 93.5 1.72 1.69 1.65 1.6 1.55 1.5 1.45 1.39 1.33 1.28 1.24 1.2 6.67 94.5 1.74 1.71 1.67 1.62 1.57 1.51 1.46 1.41 1.34 1.29 1.26 1.21 6.83 95.5 1.76 1.73 1.69 1.63 1.59 1.53 1.48 1.42 1.36 1.31 1.27 1.22 7.00 96.3 1.77 1.74 1.7 1.65 1.6 1.54 1.49 1.43 1.37 1.32 1.28 1.23 7.17 97 1.78 1.76 1.72 1.66 1.61 1.55 1.5 1.45 1.38 1.33 1.29 1.24 7.33 97.5 1.79 1.76 1.73 1.67 1.62 1.56 1.51 1.45 1.38 1.34 1.3 1.25 7.50 97.9 1.8 1.77 1.73 1.67 1.63 1.57 1.52 1.46 1.39 1.34 1.3 1.25 7.67 98.2 1.81 1.78 1.74 1.68 1.63 1.57 1.52 1.46 1.39 1.35 1.31 1.26 7.83 98.5 1.81 1.78 1.74 1.68 1.64 1.58 1.53 1.47 1.4 1.35 1.31 1.26 8.00 98.7 1.82 1.79 1.75 1.69 1.64 1.58 1.53 1.47 1.4 1.35 1.31 1.26 8.17 98.9 1.82 1.79 1.75 1.69 1.64 1.58 1.53 1.47 1.4 1.35 1.32 1.27 8.33 99 1.82 1.79 1.75 1.69 1.64 1.58 1.53 1.48 1.41 1.36 1.32 1.27 8.50 99.1 1.82 1.79 1.75 1.69 1.65 1.59 1.54 1.48 1.41 1.36 1.32 1.27 8.67 99.2 1.83 1.8 1.76 1.7 1.65 1.59 1.54 1.48 1.41 1.36 1.32 1.27 8.83 99.3 1.83 1.8 1.76 1.7 1.65 1.59 1.54 1.48 1.41 1.36 1.32 1.27 9.00 99.4 1.83 1.8 1.76 1.7 1.65 1.59 1.54 1.48 1.41 1.36 1.32 1.27 9.17 99.5 1.83 1.8 1.76 1.7 1.65 1.59 1.54 1.48 1.41 1.36 1.32 1.27 9.33 99.6 1.83 1.8 1.76 1.7 1.65 1.59 1.54 1.48 1.41 1.36 1.32 1.27 9.50 99.7 1.83 1.8 1.76 1.7 1.66 1.6 1.55 1.49 1.42 1.37 1.33 1.28 9.67 99.8 1.84 1.81 1.77 1.71 1.66 1.6 1.55 1.49 1.42 1.37 1.33 1.28 9.83 99.9 1.84 1.81 1.77 1.71 1.66 1.6 1.55 1.49 1.42 1.37 1.33 1.28 10.00 100 1.84 1.81 1.77 1.71 1.66 1.6 1.55 1.49 1.42 1.37 1.33 1.28 10.17 100 1.84 1.81 1.77 1.71 1.66 1.6 1.55 1.49 1.42 1.37 1.33 1.28 10.33 100 1.84 1.81 1.77 1.71 1.66 1.6 1.55 1.49 1.42 1.37 1.33 1.28 10.50 100 1.84 1.81 1.77 1.71 1.66 1.6 1.55 1.49 1.42 1.37 1.33 1.28 10.67 100 1.84 1.81 1.77 1.71 1.66 1.6 1.55 1.49 1.42 1.37 1.33 1.28 10.83 100 1.84 1.81 1.77 1.71 1.66 1.6 1.55 1.49 1.42 1.37 1.33 1.28 11.00 100 1.84 1.81 1.77 1.71 1.66 1.6 1.55 1.49 1.42 1.37 1.33 1.28 11.17 100 1.84 1.81 1.77 1.71 1.66 1.6 1.55 1.49 1.42 1.37 1.33 1.28 11.33 100 1.84 1.81 1.77 1.71 1.66 1.6 1.55 1.49 1.42 1.37 1.33 1.28 11.50 100 1.84 1.81 1.77 1.71 1.66 1.6 1.55 1.49 1.42 1.37 1.33 1.28 11.67 100 1.84 1.81 1.77 1.71 1.66 1.6 1.55 1.49 1.42 1.37 1.33 1.28 11.83 100 1.84 1.81 1.77 1.71 1.66 1.6 1.55 1.49 1.42 1.37 1.33 1.28 12.00 100 1.84 1.81 1.77 1.71 1.66 1.6 1.55 1.49 1.42 1.37 1.33 1.28
E

I f t- t-
t- t-
t- t-
t- t-
t- t-
t- t-
t- t-
t- t-
t- t-
t- t-
2-Year Local Storm 12 Hour Rainfall Depth (in) 2.64 Atlas 14, 2 Year
Storm Size (sq mi) 10 20 30 50 70 95 120 150 200 250 300 400 ARF % Rainfall Depth (in)
98 2.59
96.1 2.54
94.4 2.49
91.1 2.41
88.4 2.33
85 2.24
82.4 2.18
79.4 2.1
75.6 2
72.8 1.92
70.7 1.87
68 1.8
Storm Time (hours) Cumulative % 0 0 0 0 0 0 0 0 0 0 0 0 0 0
0.17 0.1 0 0 0 0 0 0 0 0 0 0 0 0 0.33 0.2 0.01 0.01 0 0 0 0 0 0 0 0 0 0 0.50 0.4 0.01 0.01 0.01 0.01 0.01 0.01 0.01 0.01 0.01 0.01 0.01 0.01 0.67 0.6 0.02 0.02 0.01 0.01 0.01 0.01 0.01 0.01 0.01 0.01 0.01 0.01 0.83 0.8 0.02 0.02 0.02 0.02 0.02 0.02 0.02 0.02 0.02 0.02 0.01 0.01 1.00 1 0.03 0.03 0.02 0.02 0.02 0.02 0.02 0.02 0.02 0.02 0.02 0.02 1.17 1.3 0.03 0.03 0.03 0.03 0.03 0.03 0.03 0.03 0.03 0.02 0.02 0.02 1.33 1.5 0.04 0.04 0.04 0.04 0.03 0.03 0.03 0.03 0.03 0.03 0.03 0.03 1.50 1.7 0.04 0.04 0.04 0.04 0.04 0.04 0.04 0.04 0.03 0.03 0.03 0.03 1.67 1.9 0.05 0.05 0.05 0.05 0.04 0.04 0.04 0.04 0.04 0.04 0.04 0.03 1.83 2.2 0.06 0.06 0.05 0.05 0.05 0.05 0.05 0.05 0.04 0.04 0.04 0.04 2.00 2.6 0.07 0.07 0.06 0.06 0.06 0.06 0.06 0.05 0.05 0.05 0.05 0.05 2.17 3.1 0.08 0.08 0.08 0.07 0.07 0.07 0.07 0.07 0.06 0.06 0.06 0.06 2.33 3.6 0.09 0.09 0.09 0.09 0.08 0.08 0.08 0.08 0.07 0.07 0.07 0.06 2.50 4.2 0.11 0.11 0.1 0.1 0.1 0.09 0.09 0.09 0.08 0.08 0.08 0.08 2.67 5 0.13 0.13 0.12 0.12 0.12 0.11 0.11 0.11 0.1 0.1 0.09 0.09 2.83 6 0.16 0.15 0.15 0.14 0.14 0.13 0.13 0.13 0.12 0.12 0.11 0.11 3.00 7.5 0.19 0.19 0.19 0.18 0.17 0.17 0.16 0.16 0.15 0.14 0.14 0.14 3.17 9 0.23 0.23 0.22 0.22 0.21 0.2 0.2 0.19 0.18 0.17 0.17 0.16 3.33 10.5 0.27 0.27 0.26 0.25 0.24 0.24 0.23 0.22 0.21 0.2 0.2 0.19 3.50 12.5 0.32 0.32 0.31 0.3 0.29 0.28 0.27 0.26 0.25 0.24 0.23 0.23 3.67 14.5 0.38 0.37 0.36 0.35 0.34 0.32 0.32 0.3 0.29 0.28 0.27 0.26 3.83 17 0.44 0.43 0.42 0.41 0.4 0.38 0.37 0.36 0.34 0.33 0.32 0.31 4.00 19.5 0.51 0.5 0.49 0.47 0.45 0.44 0.43 0.41 0.39 0.37 0.36 0.35 4.17 22.5 0.58 0.57 0.56 0.54 0.52 0.5 0.49 0.47 0.45 0.43 0.42 0.41 4.33 25.5 0.66 0.65 0.63 0.61 0.59 0.57 0.56 0.54 0.51 0.49 0.48 0.46 4.50 29.5 0.76 0.75 0.73 0.71 0.69 0.66 0.64 0.62 0.59 0.57 0.55 0.53 4.67 33.5 0.87 0.85 0.83 0.81 0.78 0.75 0.73 0.7 0.67 0.64 0.63 0.6 4.83 38.5 1 0.98 0.96 0.93 0.9 0.86 0.84 0.81 0.77 0.74 0.72 0.69 5.00 43.5 1.13 1.1 1.08 1.05 1.01 0.97 0.95 0.91 0.87 0.84 0.81 0.78 5.17 49.5 1.28 1.26 1.23 1.19 1.15 1.11 1.08 1.04 0.99 0.95 0.93 0.89 5.33 55.5 1.44 1.41 1.38 1.34 1.29 1.24 1.21 1.17 1.11 1.07 1.04 1 5.50 62.5 1.62 1.59 1.56 1.51 1.46 1.4 1.36 1.31 1.25 1.2 1.17 1.13 5.67 70.5 1.83 1.79 1.76 1.7 1.64 1.58 1.54 1.48 1.41 1.35 1.32 1.27 5.83 77.5 2.01 1.97 1.93 1.87 1.81 1.74 1.69 1.63 1.55 1.49 1.45 1.4 6.00 83.5 2.16 2.12 2.08 2.01 1.95 1.87 1.82 1.75 1.67 1.6 1.56 1.5 6.17 88.5 2.29 2.25 2.2 2.13 2.06 1.98 1.93 1.86 1.77 1.7 1.65 1.59 6.33 91.5 2.37 2.32 2.28 2.21 2.13 2.05 1.99 1.92 1.83 1.76 1.71 1.65 6.50 93.5 2.42 2.37 2.33 2.25 2.18 2.09 2.04 1.96 1.87 1.8 1.75 1.68 6.67 94.5 2.45 2.4 2.35 2.28 2.2 2.12 2.06 1.98 1.89 1.81 1.77 1.7 6.83 95.5 2.47 2.43 2.38 2.3 2.23 2.14 2.08 2.01 1.91 1.83 1.79 1.72 7.00 96.3 2.49 2.45 2.4 2.32 2.24 2.16 2.1 2.02 1.93 1.85 1.8 1.73 7.17 97 2.51 2.46 2.42 2.34 2.26 2.17 2.11 2.04 1.94 1.86 1.81 1.75 7.33 97.5 2.53 2.48 2.43 2.35 2.27 2.18 2.13 2.05 1.95 1.87 1.82 1.76 7.50 97.9 2.54 2.49 2.44 2.36 2.28 2.19 2.13 2.06 1.96 1.88 1.83 1.76 7.67 98.2 2.54 2.49 2.45 2.37 2.29 2.2 2.14 2.06 1.96 1.89 1.84 1.77 7.83 98.5 2.55 2.5 2.45 2.37 2.3 2.21 2.15 2.07 1.97 1.89 1.84 1.77 8.00 98.7 2.56 2.51 2.46 2.38 2.3 2.21 2.15 2.07 1.97 1.9 1.85 1.78 8.17 98.9 2.56 2.51 2.46 2.38 2.3 2.22 2.16 2.08 1.98 1.9 1.85 1.78 8.33 99 2.56 2.51 2.47 2.39 2.31 2.22 2.16 2.08 1.98 1.9 1.85 1.78 8.50 99.1 2.57 2.52 2.47 2.39 2.31 2.22 2.16 2.08 1.98 1.9 1.85 1.78 8.67 99.2 2.57 2.52 2.47 2.39 2.31 2.22 2.16 2.08 1.98 1.9 1.86 1.79 8.83 99.3 2.57 2.52 2.47 2.39 2.31 2.22 2.16 2.09 1.99 1.91 1.86 1.79 9.00 99.4 2.57 2.52 2.48 2.4 2.32 2.23 2.17 2.09 1.99 1.91 1.86 1.79 9.17 99.5 2.58 2.53 2.48 2.4 2.32 2.23 2.17 2.09 1.99 1.91 1.86 1.79 9.33 99.6 2.58 2.53 2.48 2.4 2.32 2.23 2.17 2.09 1.99 1.91 1.86 1.79 9.50 99.7 2.58 2.53 2.48 2.4 2.32 2.23 2.17 2.09 1.99 1.91 1.86 1.79 9.67 99.8 2.58 2.53 2.49 2.41 2.33 2.24 2.18 2.1 2 1.92 1.87 1.8 9.83 99.9 2.59 2.54 2.49 2.41 2.33 2.24 2.18 2.1 2 1.92 1.87 1.8 10.00 100 2.59 2.54 2.49 2.41 2.33 2.24 2.18 2.1 2 1.92 1.87 1.8 10.17 100 2.59 2.54 2.49 2.41 2.33 2.24 2.18 2.1 2 1.92 1.87 1.8 10.33 100 2.59 2.54 2.49 2.41 2.33 2.24 2.18 2.1 2 1.92 1.87 1.8 10.50 100 2.59 2.54 2.49 2.41 2.33 2.24 2.18 2.1 2 1.92 1.87 1.8 10.67 100 2.59 2.54 2.49 2.41 2.33 2.24 2.18 2.1 2 1.92 1.87 1.8 10.83 100 2.59 2.54 2.49 2.41 2.33 2.24 2.18 2.1 2 1.92 1.87 1.8 11.00 100 2.59 2.54 2.49 2.41 2.33 2.24 2.18 2.1 2 1.92 1.87 1.8 11.17 100 2.59 2.54 2.49 2.41 2.33 2.24 2.18 2.1 2 1.92 1.87 1.8 11.33 100 2.59 2.54 2.49 2.41 2.33 2.24 2.18 2.1 2 1.92 1.87 1.8 11.50 100 2.59 2.54 2.49 2.41 2.33 2.24 2.18 2.1 2 1.92 1.87 1.8 11.67 100 2.59 2.54 2.49 2.41 2.33 2.24 2.18 2.1 2 1.92 1.87 1.8 11.83 100 2.59 2.54 2.49 2.41 2.33 2.24 2.18 2.1 2 1.92 1.87 1.8 12.00 100 2.59 2.54 2.49 2.41 2.33 2.24 2.18 2.1 2 1.92 1.87 1.8
F

I
+
+
+
+
+
+
+
5-Year Local Storm 12 Hour Rainfall Depth (in) 3.33 Atlas 14, 5 Year
Storm Size (sq mi) 10 20 30 50 70 95 120 150 200 250 300 400 ARF % Rainfall Depth (in)
98 3.26
96.1 3.2
94.4 3.14
91.1 3.03
88.4 2.94
85 2.83
82.4 2.74
79.4 2.64
75.6 2.52
72.8 2.42
70.7 2.35
68 2.26
Storm Time (hours) Cumulative % 0 0 0 0 0 0 0 0 0 0 0 0 0 0
0.17 0.1 0 0 0 0 0 0 0 0 0 0 0 0 0.33 0.2 0.01 0.01 0.01 0.01 0.01 0.01 0.01 0.01 0.01 0 0 0 0.50 0.4 0.01 0.01 0.01 0.01 0.01 0.01 0.01 0.01 0.01 0.01 0.01 0.01 0.67 0.6 0.02 0.02 0.02 0.02 0.02 0.02 0.02 0.02 0.02 0.01 0.01 0.01 0.83 0.8 0.03 0.03 0.03 0.02 0.02 0.02 0.02 0.02 0.02 0.02 0.02 0.02 1.00 1 0.03 0.03 0.03 0.03 0.03 0.03 0.03 0.03 0.03 0.02 0.02 0.02 1.17 1.3 0.04 0.04 0.04 0.04 0.04 0.04 0.04 0.03 0.03 0.03 0.03 0.03 1.33 1.5 0.05 0.05 0.05 0.05 0.04 0.04 0.04 0.04 0.04 0.04 0.04 0.03 1.50 1.7 0.06 0.05 0.05 0.05 0.05 0.05 0.05 0.04 0.04 0.04 0.04 0.04 1.67 1.9 0.06 0.06 0.06 0.06 0.06 0.05 0.05 0.05 0.05 0.05 0.04 0.04 1.83 2.2 0.07 0.07 0.07 0.07 0.06 0.06 0.06 0.06 0.06 0.05 0.05 0.05 2.00 2.6 0.08 0.08 0.08 0.08 0.08 0.07 0.07 0.07 0.07 0.06 0.06 0.06 2.17 3.1 0.1 0.1 0.1 0.09 0.09 0.09 0.08 0.08 0.08 0.08 0.07 0.07 2.33 3.6 0.12 0.12 0.11 0.11 0.11 0.1 0.1 0.1 0.09 0.09 0.08 0.08 2.50 4.2 0.14 0.13 0.13 0.13 0.12 0.12 0.12 0.11 0.11 0.1 0.1 0.09 2.67 5 0.16 0.16 0.16 0.15 0.15 0.14 0.14 0.13 0.13 0.12 0.12 0.11 2.83 6 0.2 0.19 0.19 0.18 0.18 0.17 0.16 0.16 0.15 0.15 0.14 0.14 3.00 7.5 0.24 0.24 0.24 0.23 0.22 0.21 0.21 0.2 0.19 0.18 0.18 0.17 3.17 9 0.29 0.29 0.28 0.27 0.26 0.25 0.25 0.24 0.23 0.22 0.21 0.2 3.33 10.5 0.34 0.34 0.33 0.32 0.31 0.3 0.29 0.28 0.26 0.25 0.25 0.24 3.50 12.5 0.41 0.4 0.39 0.38 0.37 0.35 0.34 0.33 0.32 0.3 0.29 0.28 3.67 14.5 0.47 0.46 0.46 0.44 0.43 0.41 0.4 0.38 0.37 0.35 0.34 0.33 3.83 17 0.55 0.54 0.53 0.52 0.5 0.48 0.47 0.45 0.43 0.41 0.4 0.38 4.00 19.5 0.64 0.62 0.61 0.59 0.57 0.55 0.53 0.51 0.49 0.47 0.46 0.44 4.17 22.5 0.73 0.72 0.71 0.68 0.66 0.64 0.62 0.59 0.57 0.54 0.53 0.51 4.33 25.5 0.83 0.82 0.8 0.77 0.75 0.72 0.7 0.67 0.64 0.62 0.6 0.58 4.50 29.5 0.96 0.94 0.93 0.89 0.87 0.83 0.81 0.78 0.74 0.71 0.69 0.67 4.67 33.5 1.09 1.07 1.05 1.02 0.98 0.95 0.92 0.88 0.84 0.81 0.79 0.76 4.83 38.5 1.26 1.23 1.21 1.17 1.13 1.09 1.05 1.02 0.97 0.93 0.9 0.87 5.00 43.5 1.42 1.39 1.37 1.32 1.28 1.23 1.19 1.15 1.1 1.05 1.02 0.98 5.17 49.5 1.61 1.58 1.55 1.5 1.46 1.4 1.36 1.31 1.25 1.2 1.16 1.12 5.33 55.5 1.81 1.78 1.74 1.68 1.63 1.57 1.52 1.47 1.4 1.34 1.3 1.25 5.50 62.5 2.04 2 1.96 1.89 1.84 1.77 1.71 1.65 1.58 1.51 1.47 1.41 5.67 70.5 2.3 2.26 2.21 2.14 2.07 2 1.93 1.86 1.78 1.71 1.66 1.59 5.83 77.5 2.53 2.48 2.43 2.35 2.28 2.19 2.12 2.05 1.95 1.88 1.82 1.75 6.00 83.5 2.72 2.67 2.62 2.53 2.45 2.36 2.29 2.2 2.1 2.02 1.96 1.89 6.17 88.5 2.89 2.83 2.78 2.68 2.6 2.5 2.42 2.34 2.23 2.14 2.08 2 6.33 91.5 2.98 2.93 2.87 2.77 2.69 2.59 2.51 2.42 2.31 2.21 2.15 2.07 6.50 93.5 3.05 2.99 2.94 2.83 2.75 2.65 2.56 2.47 2.36 2.26 2.2 2.11 6.67 94.5 3.08 3.02 2.97 2.86 2.78 2.67 2.59 2.49 2.38 2.29 2.22 2.14 6.83 95.5 3.11 3.06 3 2.89 2.81 2.7 2.62 2.52 2.41 2.31 2.24 2.16 7.00 96.3 3.14 3.08 3.02 2.92 2.83 2.73 2.64 2.54 2.43 2.33 2.26 2.18 7.17 97 3.16 3.1 3.05 2.94 2.85 2.75 2.66 2.56 2.44 2.35 2.28 2.19 7.33 97.5 3.18 3.12 3.06 2.95 2.87 2.76 2.67 2.57 2.46 2.36 2.29 2.2 7.50 97.9 3.19 3.13 3.07 2.97 2.88 2.77 2.68 2.58 2.47 2.37 2.3 2.21 7.67 98.2 3.2 3.14 3.08 2.98 2.89 2.78 2.69 2.59 2.47 2.38 2.31 2.22 7.83 98.5 3.21 3.15 3.09 2.98 2.9 2.79 2.7 2.6 2.48 2.38 2.31 2.23 8.00 98.7 3.22 3.16 3.1 2.99 2.9 2.79 2.7 2.61 2.49 2.39 2.32 2.23 8.17 98.9 3.22 3.16 3.11 3 2.91 2.8 2.71 2.61 2.49 2.39 2.32 2.24 8.33 99 3.23 3.17 3.11 3 2.91 2.8 2.71 2.61 2.49 2.4 2.33 2.24 8.50 99.1 3.23 3.17 3.11 3 2.91 2.8 2.72 2.62 2.5 2.4 2.33 2.24 8.67 99.2 3.23 3.17 3.11 3.01 2.92 2.81 2.72 2.62 2.5 2.4 2.33 2.24 8.83 99.3 3.24 3.18 3.12 3.01 2.92 2.81 2.72 2.62 2.5 2.4 2.33 2.24 9.00 99.4 3.24 3.18 3.12 3.01 2.92 2.81 2.72 2.62 2.5 2.41 2.34 2.25 9.17 99.5 3.24 3.18 3.12 3.01 2.93 2.82 2.73 2.63 2.51 2.41 2.34 2.25 9.33 99.6 3.25 3.19 3.13 3.02 2.93 2.82 2.73 2.63 2.51 2.41 2.34 2.25 9.50 99.7 3.25 3.19 3.13 3.02 2.93 2.82 2.73 2.63 2.51 2.41 2.34 2.25 9.67 99.8 3.25 3.19 3.13 3.02 2.93 2.82 2.73 2.63 2.51 2.42 2.35 2.26 9.83 99.9 3.26 3.2 3.14 3.03 2.94 2.83 2.74 2.64 2.52 2.42 2.35 2.26 10.00 100 3.26 3.2 3.14 3.03 2.94 2.83 2.74 2.64 2.52 2.42 2.35 2.26 10.17 100 3.26 3.2 3.14 3.03 2.94 2.83 2.74 2.64 2.52 2.42 2.35 2.26 10.33 100 3.26 3.2 3.14 3.03 2.94 2.83 2.74 2.64 2.52 2.42 2.35 2.26 10.50 100 3.26 3.2 3.14 3.03 2.94 2.83 2.74 2.64 2.52 2.42 2.35 2.26 10.67 100 3.26 3.2 3.14 3.03 2.94 2.83 2.74 2.64 2.52 2.42 2.35 2.26 10.83 100 3.26 3.2 3.14 3.03 2.94 2.83 2.74 2.64 2.52 2.42 2.35 2.26 11.00 100 3.26 3.2 3.14 3.03 2.94 2.83 2.74 2.64 2.52 2.42 2.35 2.26 11.17 100 3.26 3.2 3.14 3.03 2.94 2.83 2.74 2.64 2.52 2.42 2.35 2.26 11.33 100 3.26 3.2 3.14 3.03 2.94 2.83 2.74 2.64 2.52 2.42 2.35 2.26 11.50 100 3.26 3.2 3.14 3.03 2.94 2.83 2.74 2.64 2.52 2.42 2.35 2.26 11.67 100 3.26 3.2 3.14 3.03 2.94 2.83 2.74 2.64 2.52 2.42 2.35 2.26 11.83 100 3.26 3.2 3.14 3.03 2.94 2.83 2.74 2.64 2.52 2.42 2.35 2.26 12.00 100 3.26 3.2 3.14 3.03 2.94 2.83 2.74 2.64 2.52 2.42 2.35 2.26
G

f t- t-
I
t- t-
t- t-
t- t-
t- t-
t- t-
200-Year Local Storm 12 Hour Rainfall Depth (in) 7.65 Atlas 14, 200 Year
Storm Size (sq mi) 10 20 30 50 70 95 120 150 200 250 300 400 ARF % Rainfall Depth (in)
98 7.5
96.1 7.35
94.4 7.22
91.1 6.97
88.4 6.76
85 6.5
82.4 6.3
79.4 6.07
75.6 5.78
72.8 5.57
70.7 5.41
68 5.2
Storm Time (hours) Cumulative % 0 0 0 0 0 0 0 0 0 0 0 0 0 0
0.17 0.1 0.01 0.01 0.01 0.01 0.01 0.01 0.01 0.01 0.01 0.01 0.01 0.01 0.33 0.2 0.02 0.01 0.01 0.01 0.01 0.01 0.01 0.01 0.01 0.01 0.01 0.01 0.50 0.4 0.03 0.03 0.03 0.03 0.03 0.03 0.03 0.02 0.02 0.02 0.02 0.02 0.67 0.6 0.05 0.04 0.04 0.04 0.04 0.04 0.04 0.04 0.03 0.03 0.03 0.03 0.83 0.8 0.06 0.06 0.06 0.06 0.05 0.05 0.05 0.05 0.05 0.04 0.04 0.04 1.00 1 0.08 0.07 0.07 0.07 0.07 0.07 0.06 0.06 0.06 0.06 0.05 0.05 1.17 1.3 0.1 0.1 0.09 0.09 0.09 0.08 0.08 0.08 0.08 0.07 0.07 0.07 1.33 1.5 0.11 0.11 0.11 0.1 0.1 0.1 0.09 0.09 0.09 0.08 0.08 0.08 1.50 1.7 0.13 0.12 0.12 0.12 0.11 0.11 0.11 0.1 0.1 0.09 0.09 0.09 1.67 1.9 0.14 0.14 0.14 0.13 0.13 0.12 0.12 0.12 0.11 0.11 0.1 0.1 1.83 2.2 0.17 0.16 0.16 0.15 0.15 0.14 0.14 0.13 0.13 0.12 0.12 0.11 2.00 2.6 0.2 0.19 0.19 0.18 0.18 0.17 0.16 0.16 0.15 0.14 0.14 0.14 2.17 3.1 0.23 0.23 0.22 0.22 0.21 0.2 0.2 0.19 0.18 0.17 0.17 0.16 2.33 3.6 0.27 0.26 0.26 0.25 0.24 0.23 0.23 0.22 0.21 0.2 0.19 0.19 2.50 4.2 0.32 0.31 0.3 0.29 0.28 0.27 0.26 0.25 0.24 0.23 0.23 0.22 2.67 5 0.38 0.37 0.36 0.35 0.34 0.33 0.32 0.3 0.29 0.28 0.27 0.26 2.83 6 0.45 0.44 0.43 0.42 0.41 0.39 0.38 0.36 0.35 0.33 0.32 0.31 3.00 7.5 0.56 0.55 0.54 0.52 0.51 0.49 0.47 0.46 0.43 0.42 0.41 0.39 3.17 9 0.68 0.66 0.65 0.63 0.61 0.59 0.57 0.55 0.52 0.5 0.49 0.47 3.33 10.5 0.79 0.77 0.76 0.73 0.71 0.68 0.66 0.64 0.61 0.58 0.57 0.55 3.50 12.5 0.94 0.92 0.9 0.87 0.85 0.81 0.79 0.76 0.72 0.7 0.68 0.65 3.67 14.5 1.09 1.07 1.05 1.01 0.98 0.94 0.91 0.88 0.84 0.81 0.78 0.75 3.83 17 1.28 1.25 1.23 1.18 1.15 1.11 1.07 1.03 0.98 0.95 0.92 0.88 4.00 19.5 1.46 1.43 1.41 1.36 1.32 1.27 1.23 1.18 1.13 1.09 1.05 1.01 4.17 22.5 1.69 1.65 1.62 1.57 1.52 1.46 1.42 1.37 1.3 1.25 1.22 1.17 4.33 25.5 1.91 1.87 1.84 1.78 1.72 1.66 1.61 1.55 1.47 1.42 1.38 1.33 4.50 29.5 2.21 2.17 2.13 2.06 1.99 1.92 1.86 1.79 1.71 1.64 1.6 1.53 4.67 33.5 2.51 2.46 2.42 2.33 2.26 2.18 2.11 2.03 1.94 1.87 1.81 1.74 4.83 38.5 2.89 2.83 2.78 2.68 2.6 2.5 2.43 2.34 2.23 2.14 2.08 2 5.00 43.5 3.26 3.2 3.14 3.03 2.94 2.83 2.74 2.64 2.51 2.42 2.35 2.26 5.17 49.5 3.71 3.64 3.57 3.45 3.35 3.22 3.12 3 2.86 2.76 2.68 2.57 5.33 55.5 4.16 4.08 4.01 3.87 3.75 3.61 3.5 3.37 3.21 3.09 3 2.89 5.50 62.5 4.69 4.59 4.51 4.36 4.23 4.06 3.94 3.79 3.61 3.48 3.38 3.25 5.67 70.5 5.29 5.18 5.09 4.91 4.77 4.58 4.44 4.28 4.07 3.93 3.81 3.67 5.83 77.5 5.81 5.7 5.6 5.4 5.24 5.04 4.88 4.7 4.48 4.32 4.19 4.03 6.00 83.5 6.26 6.14 6.03 5.82 5.64 5.43 5.26 5.07 4.83 4.65 4.52 4.34 6.17 88.5 6.64 6.5 6.39 6.17 5.98 5.75 5.58 5.37 5.12 4.93 4.79 4.6 6.33 91.5 6.86 6.73 6.61 6.38 6.19 5.95 5.76 5.55 5.29 5.1 4.95 4.76 6.50 93.5 7.01 6.87 6.75 6.52 6.32 6.08 5.89 5.68 5.4 5.21 5.06 4.86 6.67 94.5 7.09 6.95 6.82 6.59 6.39 6.14 5.95 5.74 5.46 5.26 5.11 4.91 6.83 95.5 7.16 7.02 6.9 6.66 6.46 6.21 6.02 5.8 5.52 5.32 5.17 4.97 7.00 96.3 7.22 7.08 6.95 6.71 6.51 6.26 6.07 5.85 5.57 5.36 5.21 5.01 7.17 97 7.28 7.13 7 6.76 6.56 6.31 6.11 5.89 5.61 5.4 5.25 5.04 7.33 97.5 7.31 7.17 7.04 6.8 6.59 6.34 6.14 5.92 5.64 5.43 5.27 5.07 7.50 97.9 7.34 7.2 7.07 6.82 6.62 6.36 6.17 5.94 5.66 5.45 5.3 5.09 7.67 98.2 7.37 7.22 7.09 6.84 6.64 6.38 6.19 5.96 5.68 5.47 5.31 5.11 7.83 98.5 7.39 7.24 7.11 6.87 6.66 6.4 6.21 5.98 5.69 5.49 5.33 5.12 8.00 98.7 7.4 7.25 7.13 6.88 6.67 6.42 6.22 5.99 5.7 5.5 5.34 5.13 8.17 98.9 7.42 7.27 7.14 6.89 6.69 6.43 6.23 6 5.72 5.51 5.35 5.14 8.33 99 7.43 7.28 7.15 6.9 6.69 6.44 6.24 6.01 5.72 5.51 5.36 5.15 8.50 99.1 7.43 7.28 7.16 6.91 6.7 6.44 6.24 6.02 5.73 5.52 5.36 5.15 8.67 99.2 7.44 7.29 7.16 6.91 6.71 6.45 6.25 6.02 5.73 5.53 5.37 5.16 8.83 99.3 7.45 7.3 7.17 6.92 6.71 6.45 6.26 6.03 5.74 5.53 5.37 5.16 9.00 99.4 7.46 7.31 7.18 6.93 6.72 6.46 6.26 6.03 5.75 5.54 5.38 5.17 9.17 99.5 7.46 7.31 7.18 6.94 6.73 6.47 6.27 6.04 5.75 5.54 5.38 5.17 9.33 99.6 7.47 7.32 7.19 6.94 6.73 6.47 6.27 6.05 5.76 5.55 5.39 5.18 9.50 99.7 7.48 7.33 7.2 6.95 6.74 6.48 6.28 6.05 5.76 5.55 5.39 5.18 9.67 99.8 7.49 7.34 7.21 6.96 6.75 6.49 6.29 6.06 5.77 5.56 5.4 5.19 9.83 99.9 7.49 7.34 7.21 6.96 6.75 6.49 6.29 6.06 5.77 5.56 5.4 5.19 10.00 100 7.5 7.35 7.22 6.97 6.76 6.5 6.3 6.07 5.78 5.57 5.41 5.2 10.17 100 7.5 7.35 7.22 6.97 6.76 6.5 6.3 6.07 5.78 5.57 5.41 5.2 10.33 100 7.5 7.35 7.22 6.97 6.76 6.5 6.3 6.07 5.78 5.57 5.41 5.2 10.50 100 7.5 7.35 7.22 6.97 6.76 6.5 6.3 6.07 5.78 5.57 5.41 5.2 10.67 100 7.5 7.35 7.22 6.97 6.76 6.5 6.3 6.07 5.78 5.57 5.41 5.2 10.83 100 7.5 7.35 7.22 6.97 6.76 6.5 6.3 6.07 5.78 5.57 5.41 5.2 11.00 100 7.5 7.35 7.22 6.97 6.76 6.5 6.3 6.07 5.78 5.57 5.41 5.2 11.17 100 7.5 7.35 7.22 6.97 6.76 6.5 6.3 6.07 5.78 5.57 5.41 5.2 11.33 100 7.5 7.35 7.22 6.97 6.76 6.5 6.3 6.07 5.78 5.57 5.41 5.2 11.50 100 7.5 7.35 7.22 6.97 6.76 6.5 6.3 6.07 5.78 5.57 5.41 5.2 11.67 100 7.5 7.35 7.22 6.97 6.76 6.5 6.3 6.07 5.78 5.57 5.41 5.2 11.83 100 7.5 7.35 7.22 6.97 6.76 6.5 6.3 6.07 5.78 5.57 5.41 5.2 12.00 100 7.5 7.35 7.22 6.97 6.76 6.5 6.3 6.07 5.78 5.57 5.41 5.2
H