Embed Size (px)
Citation preview

IOP Conference Series: Materials Science and Engineering
PAPER • OPEN ACCESS
Mechanical process and size characterisation of rice husk, mango barkand mango leaves as a drag reduction additiveTo cite this article: M A At-Tasneem et al 2020 IOP Conf. Ser.: Mater. Sci. Eng. 736 022112
View the article online for updates and enhancements.
This content was downloaded from IP address 103.53.34.15 on 12/03/2020 at 08:27
brought to you by COREView metadata, citation and similar papers at core.ac.uk
provided by UMP Institutional Repository

Content from this work may be used under the terms of the Creative Commons Attribution 3.0 licence. Any further distributionof this work must maintain attribution to the author(s) and the title of the work, journal citation and DOI.
Published under licence by IOP Publishing Ltd
Energy Security and Chemical Engineering Congress
IOP Conf. Series: Materials Science and Engineering 736 (2020) 022112
IOP Publishing
doi:10.1088/1757-899X/736/2/022112
1
Mechanical process and size characterisation of rice husk, mango bark and mango leaves as a drag reduction additive
M A At-Tasneem1, A N Oumer1, W H Azmi1 and K Sulihaakma2 1 Faculty of Mechanical Engineering, Universiti Malaysia Pahang, 26600 Pekan,
Pahang, Malaysia. 2 Centre of Excellence for Advanced Research in Fluid Flow (CARIFF), Universiti
Malaysia Pahang, 26600 Pekan, Pahang, Malaysia.
E-mail: [email protected]
Abstract. In many drag reduction applications, polymer and organic fibre additives are mostly
used because they alter the generation of turbulence at the core region. Nano-sized particles
may able to reach the viscous region of the boundary layer and alter the internal turbulent
structure near the wall. However, the challenge is that it is hard to find nano-sized organic
particles in the market. This paper presents the preparation and characterisation of organic-
based nanoparticles to be dispersed in a base fluid as drag reduction additives. Similar steps of
nanoparticles preparation proposed by researchers were employed. The coarse powder of rice
husk and raw samples of mango bark and mango leaves were ground using a domestic grinder.
Then, the samples were further ground using planetary ball milling until reached nanoscale.
The size of all samples was measured using Zetasizer. Then, all samples were ultrasonicated
for three hours to de-agglomerate larger particles. It revealed that rice husk was able to produce
61% intensity of nanoparticles after four hours of the dry milling, five hours of wet milling and
three hours of ultrasonication. The mango bark and mango leaves formed the maximum of only
6.7% and 4% intensity of nanoparticles after seven hours of wet milling and three hours of
ultrasonication, respectively. However, mango bark and mango leaves remain stable after two
months of observation, and rice husk showed significant sedimentation after two weeks of idle
time.
1. Introduction Drag reduction is a flow-alteration technique to minimise the frictional force resulting in the generation of turbulent structure which consumes great energy. Numerous methods have been suggested to reduce drag near to the wall and at the core region. The amendment of flow on the bounded wall by smoothing the wall using the superhydrophobic coating increases the viscous sublayer thickness, which delays the transition of laminar to turbulent boundary layer [1]. The vibrant wall produces negative spanwise vortices that reducing the mean velocity gradient near the wall region which inducing the turbulent generation at turbulent boundary layer [2]. Microbubble injection near-wall deforms the boundary internal structure that may reduce drag [3]. The microbubbles have the drawback where it is unsteady and easy to crack which may create even larger drag force and noise. Among all the methods mentioned above, the dispersion of the drag reduction additive in a fluid is among the favoured method of drag reduction. The suspension of polymers with a long chain of monomer can block the production of eddies, diminish the frequency and rotational rate of vortexes [4]. Fibres which contain a formulation of networks between tangled fibre receive the hydrodynamic
Energy Security and Chemical Engineering Congress
IOP Conf. Series: Materials Science and Engineering 736 (2020) 022112
IOP Publishing
doi:10.1088/1757-899X/736/2/022112
2
interaction between coherent turbulent structure near the wall and the flow streamline that deflect the position of fibre and amend the orientation of the flow [5]. Aloe vera [6], okra [7], nata de coco [8], rice husk [9] and chitosan [10] are among organic-based polymers and fibres used as drag reduction additives. There are various types of organic-based materials were synthesized into micro- and nano-sized particles for other research purposes such as wood pulp [11], palm kernel [12], banana stem [13], mango bark [14-16], coconut fiber [17, 18] and rice husk [19, 20]. Nano-sized organic-based particles were used in diverse researches. The existence of organic-based nanoparticle improved the thermophysical properties of the base fluid such as viscosity, thermal and electrical conductivity [12-14]. Nano-additives in biodiesels is used to reduce the amount of emission and enhance the performance of a direct injection compression ignition engine [19, 20]. The nanoscale herbal phyto used to control the bacterial infection in fabric and as a UV-blocking to maintain the colour of the textile [21, 22]. At the same time, the organic source of nanoparticles will minimise the contributions on various emission scenarios not only toward the environment but also for human and aquaculture. Nevertheless, none in the literature used nano-sized organic-based nanoparticles as a drag reduction additive. The nano-sized particles dispersion may able to reach a viscous region of the boundary layer and alter the internal turbulent structure just like the benefits of the existence microbubbles layer near the wall. Majority of the research of nanofluids utilised a single type or mixed types of synthetic based materials as nanoparticles dispersed in a base fluid. Synthetic nanoparticles can be easily purchased from various supplies locally and internationally. On the other hand, it is nearly impossible to find nano-sized organic-based nanoparticles in the market. Therefore, nano-sized organic-based particles need to be prepared in the laboratory. Nevertheless, the selection of the method to synthesis a raw organic-based material to become nano-sized particles is very crucial as the size and shape of nanoparticles influence the thermophysical properties and stability of nanoparticles [23]. There are two general methods used to produce nano-sized particles which are top-down method and bottom-up method [24]. The top-down method is used when the raw material in bulk size is reduced by various process. The size reduction of particles through mechanical and mechanochemical process is depending on the type and sensitivity of the samples towards ambience of experiment as well as the duration of the size reduction process. The mechanical process can be done through mechanical milling at below or room temperature. The process works on the collision between the milling balls and powder samples against the surface wall of the mill jar due to the centrifugal force. The ball milling process includes attrition ball mill, planetary ball mill, vibrating ball mill, low energy tumbling mill and high energy ball mill [25]. The mechanochemical process, on the other hand, is the process of the mixture between the mechanical and chemical phenomenon. It can be conducted using reactive atmosphere, under cryogenic condition or in the solvent [26]. The comminution of the samples from both processes are governed by many parameters including type of mill, type and size of ball mill, rotational speed of milling jar, temperature and duration of the milling process, the type of materials to be milled and the method of dry or wet milling process [26, 27]. The process of laser ablation and ion sputtering are also in this category [24]. The bottom-up method involved building up nanoparticles from the joints of atoms and molecules of materials constituents. The solid-state methods, liquid state synthesis methods, gas phase methods and biological methods are among examples of bottom-up methods. The ball milling process is the most suitable method for organic-based material because it can be conducted at room temperature to preserve the texture of natural materials [25]. At the same time the ball milling process produces a homogenous compound [26]. For example, the coconut shell nanoparticles were produced using a top-down method of milling process. The bulk coconut shell was crushed using hardened steel crusher and disc grinder before it was milled for 70 hours until reached the nanoparticles size average of 50nm [28]. Table 1 shows a few examples of how the selected organic-based nanoparticles were prepared by using a ball mill for various applications.

Energy Security and Chemical Engineering Congress
IOP Conf. Series: Materials Science and Engineering 736 (2020) 022112
IOP Publishing
doi:10.1088/1757-899X/736/2/022112
3
T
able
1. O
rgan
ic b
ased
nan
opar
ticle
s pr
epar
atio
n.
Ref
. O
rgan
ic
Sam
ple
Bas
e Fl
uid
Obj
ecti
ve o
f re
sear
ch
Size
of
NP
(nm
) T
ype
of B
all
Mill
ing
T
ype
of
Bal
ls
Mill
ing
tim
e (h
ours
)
Rot
atio
nal
Spe
ed
(rpm
)
Soni
catio
n du
rati
on
(hou
r)
Surf
acta
nt
[19]
R
ice
husk
B
iodi
esel
bl
ends
N
anoa
dditi
ves
in p
ine
oil
biof
uel
100
Dom
esti
c m
ixer
an
d Pl
anet
ary
ball
m
ill (
dry
met
hod)
Tun
gste
n carb
ide
(10
mm
)
6 35
0 N
ot
perf
orm
ed
Non
e
[20]
R
ice
husk
B
iodi
esel
bl
ends
N
anoa
dditi
ves
in d
iese
l-bi
odie
sel f
uel
blen
ds
100
Dom
esti
c m
ixer
an
d Pl
anet
ary
mon
o m
ill (
wet
m
etho
d)
- 5
30
0 N
ot
perf
orm
ed
Non
e
[14-
16]
Man
go
Bar
k D
e-io
nize
d w
ater
T
herm
ophy
sica
l pr
oper
ties
100
- -
- -
1 ho
ur
10%
of
Hex
adec
yltr
i m
ethy
l am
mon
ia
brom
ide,
sod
ium
do
decy
l sul
fate
and
la
uric
aci
d.
[21]
A
loe
Ver
a D
istil
led
wat
er
Tex
tile
appl
icat
ion
40
Pla
neta
ry b
all
mil
l, PM
100,
R
etsc
h, G
erm
any
Zir
coni
a (2
0mm
an
d 10
0mm
)
16
300
0.5
Non
e
[12]
Pa
lm
Ker
nel
Dei
oniz
ed
wat
er/E
thyl
ene
Gly
col [
50:5
0]
and
[60:
40]
The
rmal
co
nduc
tivi
ty
100
Bal
l mil
l -
48
- 1
Non
e
[13]
B
anan
a St
em
Dei
oniz
ed
wat
er
Vis
cosi
ty
200
Bal
l mil
l (dr
y m
etho
d)
- -
- 2/
3 So
dium
do
decy
lben
zene
sulf
onat
e (S
DB
S)
[22]
T
rida
x pr
ocum
bens
pl
ant l
eave
s
Dis
tille
d w
ater
A
ntim
icro
bial
pr
oper
ties
45-1
14
Pla
neta
ry b
all
mil
l, PM
100,
R
etsc
h, G
erm
any
-
1, 6
, 9,
12 a
nd
15
300
Not
pe
rfor
med
N
one
Energy Security and Chemical Engineering Congress
IOP Conf. Series: Materials Science and Engineering 736 (2020) 022112
IOP Publishing
doi:10.1088/1757-899X/736/2/022112
4
Despite the various parameters which are propositional the size reduction of the sample, researchers were not revealed all the settings used in their experiment. Raw materials of organic-based samples generally undergo ball milling process for a wide range of duration at the rotational speed in between 300 – 350 rpm. The grinding process was conducted in between 15 hours to 48 hours depending on the type of organic sample, type and size of ball mill to achieve the average particles size below than 100 nm to be called nanoparticles [29]. The optimum duration of the grinding process is required to avoid overheated and burnt of sample. The size characterisation can be done to monitor the production of nanoparticles. Nanoparticles will be diluted in a solvent through two-steps methods to produce a nanofluid [30]. Then, a sample of nanofluids which content a suspended nanoparticles will be observed through various techniques were used in the literature including zeta potential distribution [15] and particle size distribution (PSD) [15, 20, 22], monitor the sample morphology using scanning electron microscopy (SEM) [12, 14, 15] or transmission electron microscopy (TEM) [12, 15]. The size characterisation of nanoparticles can also be done through various techniques of stability test. The stability test was frequently used to monitor the nanoparticles dispersion. The sample is considered as nanofluid if the sample is dispersed uniformly and it is kinetically stable. The suspensions considered unstable when the particles were dispersed in a base fluid, and the particles were quickly settled at the bottom of the container. After a few minutes of resting time, the sample formed a well-defined two-phase form of liquid and solid particles in the same container. The stability test is essential for nanofluid to make it usable for heat enhancement and other engineering applications. The methods including of UV-visible spectroscopy, viscosity measurement, Zeta potential analysis, observation drop evaluation, sedimentation and centrifugation method, spectral absorbency method, electron microscopy and light scattering methods are among the favourite to observe the stability of nanofluid [12, 31]. However, the stability of nanofluid not only depends on the size of particles, the physical structure of nanoparticle, the usage of surfactant, the pH value of nanofluids and ultrasonication energy also influence the stability of the nanofluids [15, 17, 32]. Though few works in the open literature mentioned they produced organic nano-sized particles for various applications, it is not convincing as some of the paper mentioned nano-sized particles were produced after a specific duration of grinding process without any evident [16, 19]. Besides that, there are a few works of literature which proved the production of nanoparticles by displaying the images sample morphology in micro-sized scale which is 1000 times larger particles than nano-sized particles. Therefore, this paper will discuss in detail the process of preparing the nano-sized organic-based nanoparticles from rice husk, mango bark and mango leaves to be dispersed in a fluid as a drag reduction additive. Then, the sized of produced samples will be characterised by measuring the particles size dispersion at each milling hours. Finally, a flow of work for the synthesis of organic-based nanoparticles will be suggested. 2. Methodology The framework for the preparation of the nanoparticles from rice husk, mango bark and mango leaves are presented in figure 1. The organic-based samples will undergo three main steps, which are sample preparation, size characterisation and stability test. 2.1. Sample preparation Rice husk was obtained from a local supplier in the form of coarse powder. The sample of rice husk had an average particle size of 3764 nm. After collecting the rice husk particles, they were divided into two different samples called sample A and sample B. The amount of 30g of sample A was further ground using a domestic grinder for two hours with 3 minutes grinding and resting alternately. Then, the sample was sieved using a domestic sieve to separate the samples with larger particles. On the other hand, sample B with the weight of 10g was ground using Planetary Micro Mill (Fritsch, Pulverisette 7) in two grinding bowls with the volume of 40ml, each, by using dry grinding method.

Energy Security and Chemical Engineering Congress
IOP Conf. Series: Materials Science and Engineering 736 (2020) 022112
IOP Publishing
doi:10.1088/1757-899X/736/2/022112
5
The sample was ground in a constant rotational speed of 800 rpm with Zirconia grinding balls of diameter 5mm. The grinding process of sample B was held for 4 hours with 6 minutes of grinding and 3 minutes rest, repeatedly before proceeding with size characterisation. Next, the weight of sample A and sample B were measured using a digital weighing balance (Mettler Toledo, maximum capacity: 200g, accuracy: 0.0001g). The weights of sample A and sample B after grinding were 5 g and 1.77 g, respectively. Both samples were placed in two separate bowls, and they were ball milled using the wet grinding method by using ultra-pure water as a solver for seven hours until the average nano-sized of particles are obtained. The grinding process was alternately repeated with 6 minutes grinding and 3 minutes resting time to avoid the samples from dry out and burning.
Figure 1. The flowchart of organic-based nanoparticles preparation.
Raw sample of mango bark and mango leaves were collected from a mango garden located in a small village at Kelantan, Malaysia Peninsula. Mango bark and mango leaves were cleaned using ultra-fine water to remove grit, dirt, impurities and unrequited particles [14, 15, 17]. Then, the samples were cut into small pieces and sun-dried for a few weeks to remove the moisture content in the samples. The samples were weighted and sundried repeatedly until the weight of both samples is constant. Next, samples were ground using domestic grinder until they become powder. Then, both samples were ground using wet milling with ultra-fine water for seven hours, with 6 minutes grinding and 3 minutes resting time before proceeding with size characterisation. Figure 2 shows the rice husk, mango bark and mango leaves samples in the wet grinding process in mill bowls after grinding process for one hour.
Wet milling
Particle sizing
Ultrasonicating
Particle sizing
Particle sizing
Stability observation
Dry milling
Coarse powder of rice
Domestic grinding, sieve
Cleaned, cut, sundried
Raw mango bark and mango leaves
Sample preparation
Size Characterization
Stability test

Energy Security and Chemical Engineering Congress
IOP Conf. Series: Materials Science and Engineering 736 (2020) 022112
IOP Publishing
doi:10.1088/1757-899X/736/2/022112
6
(a) Rice husk. (b) Mango bark. (c) Mango leaves.
Figure 2. Wet grinding process. 2.2. Size characterization Before the size characterisation process was performed, calibration test was conducted on the Zetasizer particle sizer (Malvern Panalytical Technologies, measurement range: 0.3 nm – 5 �m in diameter, accuracy: �2% on Polymer microsphere in ultra-fine water, mean diameter = 100 nm � 3 nm). The calibration test was conducted by three different individuals to observe human error while conducting particles size measurements. This test was necessary to identify the correct way to handle the measurement cell for sample measurements to minimalise the error and increase the accuracy of data measurement. This test will eliminate any mistakes during sample handling such as cuvette cleaning process, avoiding fingerprint and handle the test in a clean environment. This step gives a significant influence in data measurement using dynamic light scattering in Zetasizer. The intensity of particles reflected by the amount of scattered light fluctuations appeared from Brownian motion of the particles in the cuvette [33]. Therefore, it is essential to make sure that the measurement of scattered light fluctuations is from the samples ultimately. The polymer microsphere in water was used as a calibration specimen. The polymer microsphere has an average diameter of 100 � 3 nm. The result of the test for the average size of polymer microsphere diluted in water is presented in figure 3. The percentage of particles intensity for all tests shows that the human error is in between 2.6 – 13.6% � 3%, which is acceptable for this research objective.
(a) Average size of particles.
(b) Particle size distribution.
Figure 3. Calibration test of polymer microsphere in water.
Energy Security and Chemical Engineering Congress
IOP Conf. Series: Materials Science and Engineering 736 (2020) 022112
IOP Publishing
doi:10.1088/1757-899X/736/2/022112
7
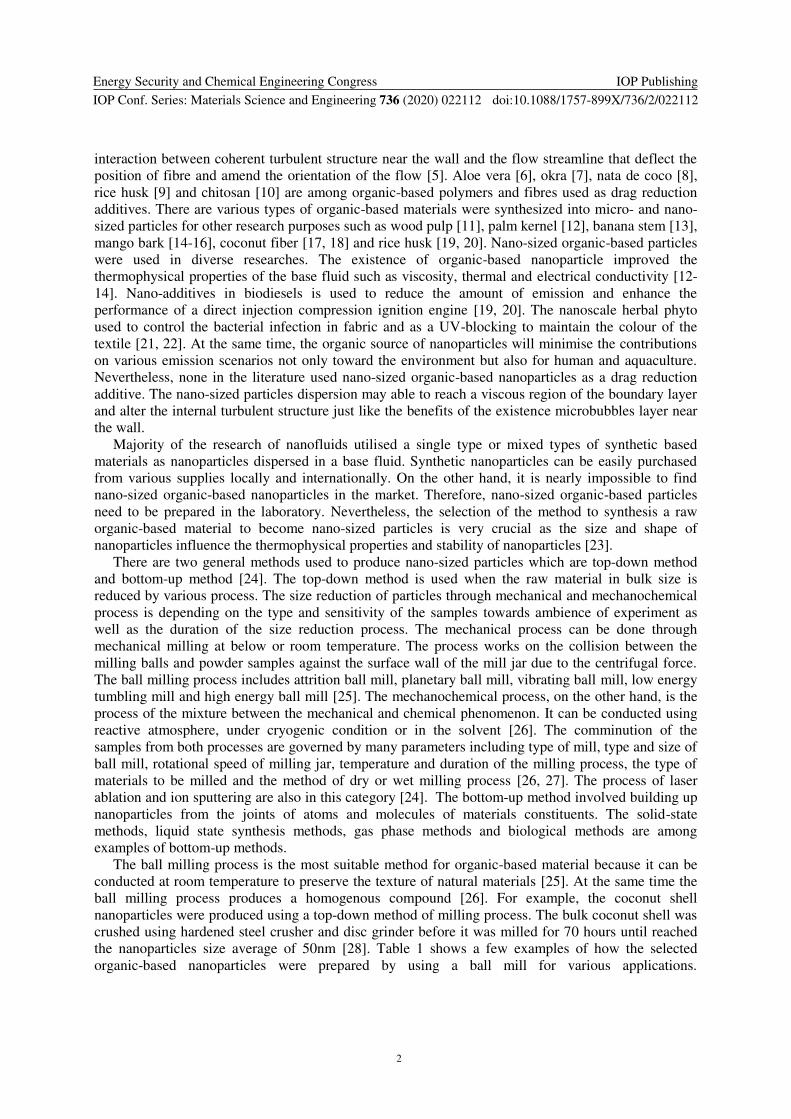
In order to identify the optimum duration of the milling process, the size characterisation of nanoparticles should be conducted alternately with the milling process. Size characterisation process was conducted for each hour of dry milling and wet milling process for all samples. The amount of 0.1g of the sample was taken from the milling bowl and diluted in 60 ml of ultra-fine water. The sample was stirred manually for a few minutes until the sample was dissolved completely, by naked eyes observation. The amount of 2 ml of the diluted sample was pumped into a cuvette to measure the size distribution of the particles. Surfactants are seldom used to avoid the agglomeration of the production of nano-sized particles [17]. Nevertheless, mango bark was proved to be able to be stabilised without the usage of surfactant [15]. This method is cost-efficient and no settlement after two weeks. Therefore, no surfactant will be used in this experiment. 2.3. Stability test The remaining diluted samples were ultrasonicated for three hours. The sonification process is used to reach stability by breaking large agglomerations of mango bark nanoparticles in the base fluid. The viscosity of nanofluids may be reduced as the ultrasonication energy increased [34]. Then, the particles size distribution of all samples was measured one more time. The sonication process was conducted using a Powersonic Ultrasonic Cleaner (Crest Ultrasonics P1800D, sonic power: 240V/800W, frequency: 50/60 Hz). All samples were kept at rest for two months for a sedimentation and observation test. 3. Result and discussion The coarse powder of rice husk underwent a dry milling process. The temporal variation of the average rice husk particles size by using the dry method of ball milling process was plotted in figure 4. The size of nanoparticles undesirably increased gradually from 2020 nm to 6308 nm after four hours and 18 minutes of milling durations. The particles were gradually agglomerated and highly attached like a piece of cookie at the bottom of the jar, as shown in figure 5. This particle agglomerations may be affected by the increment of the temperature inside the milling bowl as a result of high kinetic energy generated from the high energy impact between the balls and the milling bowl as well as the collusions of the samples against the wall of the milling bowl [27]. The higher the temperature, the greater the atomic mobility between particles and increase the diffusivity of the rice husk powder. Due to this condition, all milling process was conducted in the wet method by using ultra-fine water as a solvent.
Figure 4. The average size of rice husk particles using dry milling
method. Figure 5. Dry method grinding of
rice husk.
The comminution of rice husk in sample A and sample B were plotted in figure 6(a) and 7(a), respectively. The size of sample A was initially 787.3 nm and gradually decreased to 144 nm after 6 hours of the grinding process. On the other hand, sample B was initially 6038 nm decrease to 177.2

Energy Security and Chemical Engineering Congress
IOP Conf. Series: Materials Science and Engineering 736 (2020) 022112
IOP Publishing
doi:10.1088/1757-899X/736/2/022112
8
nm after 5 hours of grinding. As the grinding process was further continued, the average size of nanoparticles increased drastically. The ultrasonication process was conducted to break the agglomeration between particles. The ultrasonic with the frequency of 50/60 Hz is transmitted to the samples of each hour. It shows that most of the comminution is decreasing in between 2-39% for sample A and 10-34% for sample B.
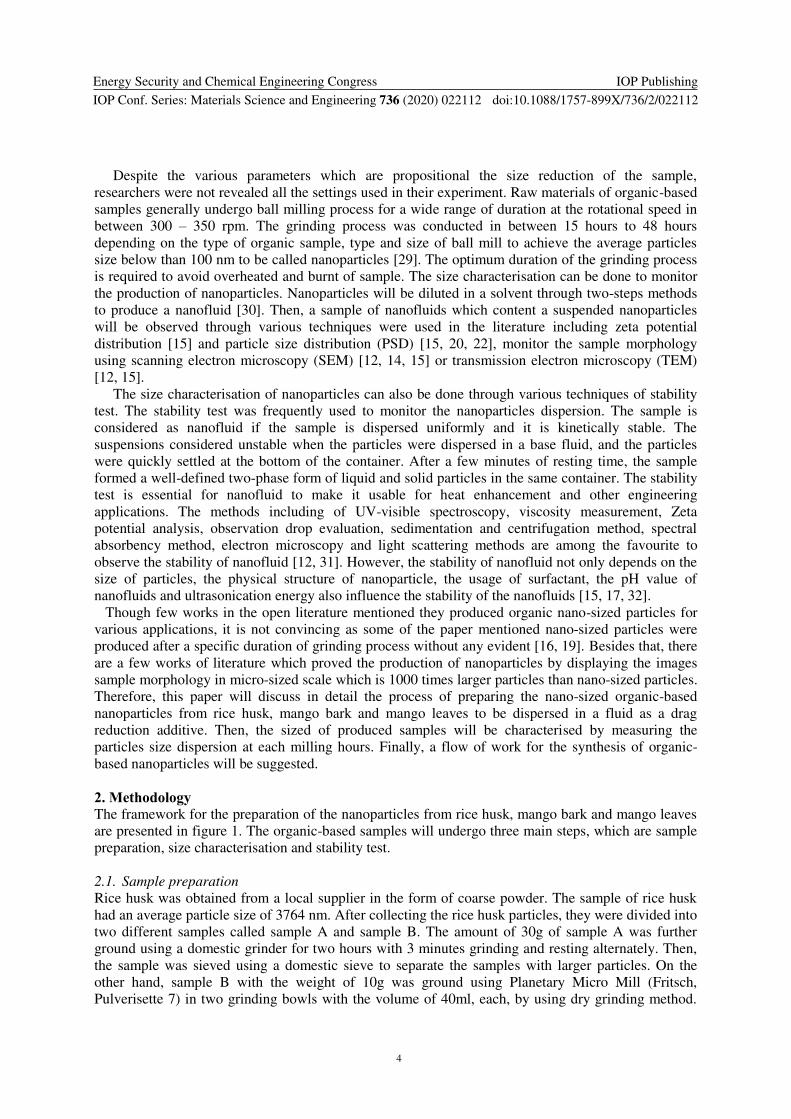
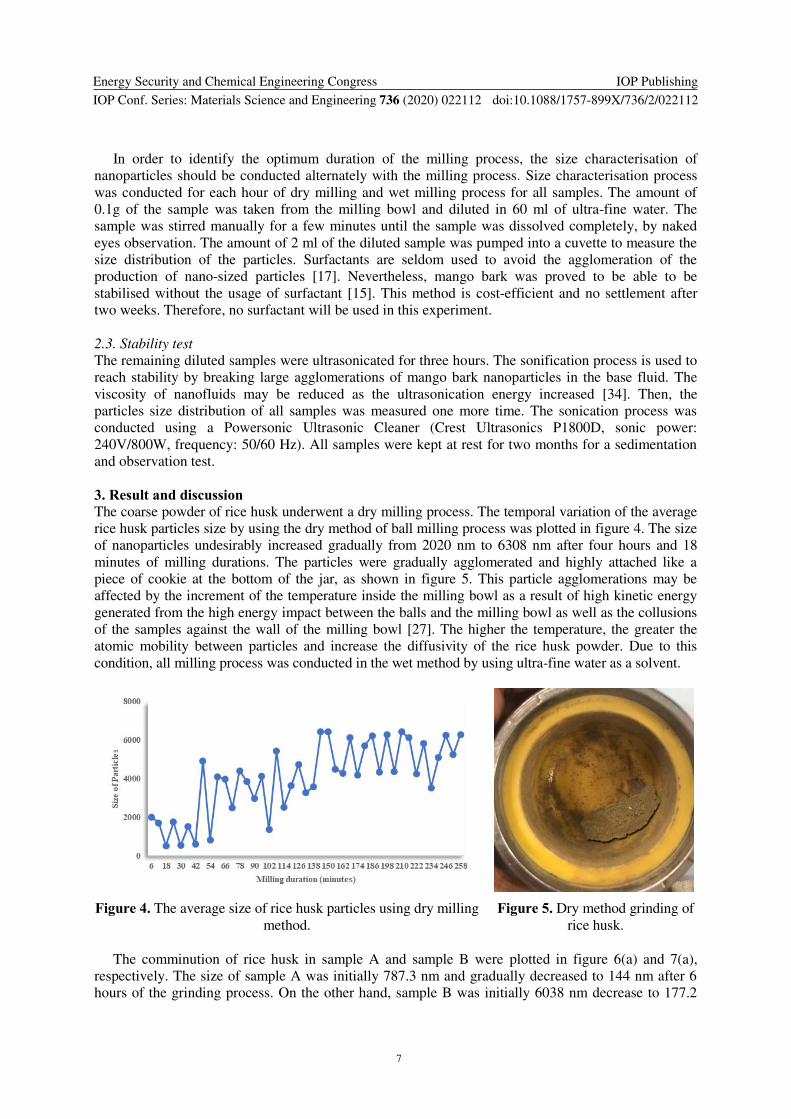
In order to further identify the existence of nanoparticles in the sample, the particle size distribution (PSD) for both samples at every hour of the grinding process were plotted in figure 6(b) and 7(b). The black dotted vertical line in both figures shows borderline between the nano-sized region and micro-sized particles where the size is in between 1-100 nm and the particles above 100 nm, respectively. The samples were begun to shift to the left toward nano-sized region after the grinding was held for four hours for sample A and as early as two hours for sample B. The nanoparticles were expected to keep increasing as the wet grinding process continued. However, there are no nanoparticles existed on the next two hours of grinding for sample A, and only 5% intensity of nanoparticles exist after 4 hours of grinding in sample B. The PSD is highly concentrated in between 100 nm until 530 nm for both samples. However, the PSD has shifted towards nano-sized region again as the grinding process continued. From the observation, as the milling process continue spinning with the centrifugal force, the samples were fine enough to spread out from the milling bowl through the bowl/cap rubber seal and spilt out from the milling media leaves the bigger particles inside the bowl. The organic-based sample burned out and escaped thought bowl-cap rubber gap after long hours of the grinding process, as shown in figure 8.
After three hours of ultrasonication, PSD of nanoparticles increased in between 5.9-54.4% with the maximum intensity of nanoparticles was produced after four hours of wet milling of sample A as shown in figure 6(c). On the other hand, close to 32.1% intensity of nanoparticles of sample B was produced after two hours of the milling process, as shown in figure 7(c). The nanoparticles increased by 58.5% after ultrasonication for three hours to 50.9% of nanoparticles intensity. However, the intensity percentage shifted to the right of the graph after 4 hours of milling and back again after 5 hours of the milling process. The maximum nanoparticles intensity is achieved after five hours of grinding process with 61.1% after ultrasonication process was conducted. The smallest size of nanoparticles is 24 nm with 0.2% intensity for sample A of rice husk and 16 nm for sample B with 0.1% intensity.
(a) Comminution. (b) Particle size distribution. (c) Nanoparticles distribution.
Figure 6. Results for rice husk nanoparticles production (sample A).
Energy Security and Chemical Engineering Congress
IOP Conf. Series: Materials Science and Engineering 736 (2020) 022112
IOP Publishing
doi:10.1088/1757-899X/736/2/022112
9
(a) Comminution. (b) Particle size distribution. (c) Nanoparticles distribution.
Figure 7. Results for rice husk nanoparticles production (sample B).
Figure 8. Sample burn out and escape from milling bowl.
The dry milling method was not conducted for mango bark and mango leaves. The coarse powder of mango bark and mango leaves produced using domestic grinding process were then wet-milled for seven hours. The coarse powder of mango bark and mango leaves have the average size of 1047.6 nm and 2560.2 nm, respectively. Figure 9(a) and 10(a) show the comminution of mango bark and mango leaves particles. The size of samples reduces gradually after each hour of the wet milling process. The sample of mango bark reached the smallest size of particles after five hours of the milling process with 286.3 nm. However, mango leaves require a longer time to produce nanoparticles. The lowest average of the size of mango leaves was obtained after seven hours of the milling process, which is 454.6 nm. Following the same trend of rice husk nanoparticles production, the average size of nanoparticles for both samples increased after a specific duration of the milling process. Most of the samples were wasted because of the reason that the particles either burned out or escaped from the milling bowl through a small gap between milling bowl and its cover. The ultrasonication was presented for the samples that were ground for more than three hours. The ultrasonication process broke up the newly formed particles and reduced the average size of particles of all samples. The comminution of mango bark and mango leaves nanoparticles are decreased in between 4.8-35% and 5-50.5% after ultrasonication at each hour of milling time, respectively.
Figure 9(b) and 10(b) display the PSD for mango bark and mango leaves. Like the previous figures, the black dotted vertical line shows the border between nano-sized and micro-sized particles in the left and the right side of graph, respectively. Mango bark and mango leaves required three hours of the wet milling process to allow the PSD shifted to the left towards the nano-sized region. The nano-sized particles of mango bark are slowly and steadily shifted to the left towards the nano-sized region as the duration of the grinding process increased. Nevertheless, the PSD of mango bark is highly concentrated in between 164 nm to 1106 nm after seven hours of the grinding process. On the other

Energy Security and Chemical Engineering Congress
IOP Conf. Series: Materials Science and Engineering 736 (2020) 022112
IOP Publishing
doi:10.1088/1757-899X/736/2/022112
10
hand, nanoparticles of mango leaves can only be seen after three hours of grinding and with the help of ultrasonication. The percentage of intensity of mango leaves is deficient with 0.2% with the size of 91 nm. The PSD is slowly increased as the grinding duration increased. However, most of the particles are concentrated between 255 nm and above. After seven hours of the wet milling process, the PSD of mango leaves is widespread with the minimum size of nanoparticles is 59 nm, and the maximum is 1281 nm.
(a) Comminution. (b) Particle size distribution. (c) Nanoparticles distribution.
Figure 9. Results for mango bark nanoparticles production.
(a) Comminution. (b) Particle size distribution. (c) Nanoparticles distribution.
Figure 10. Results for mango leaves nanoparticles production.
The production of nanoparticles for rice husk, mango bark and mango leaves are summarised in figure 11. Overall, the ultrasonication disrupted larger particles and detached small particles and consequently increased the percentage intensity of nanoparticles. The highest intensity percentage of rice husk is reached after four hours of dry milling, five hours of wet milling and ultrasonicated for three hours in sample B. The size of nanoparticles is in between 24 nm to 91 nm with the total intensity percentage of 61.1%. Mango bark and mango leaves extracted from the raw sample were cleaned, cut, sundried and ground until becoming coarse powder. Then, both samples were wet ground for seven hours and further ultrasonicated for three hours. However, the ultrasonication was relatively ineffective for mango bark when the maximum percentages of mango bark nanoparticles intensity are relatively similar, which is 6.7% and 6.9% with and without ultrasonication respectively. Unfortunately, only 4% nanoparticles intensity of mango leaves were produced after six hours of milling time and three hours of ultrasonication before the sample was burned or wasted through the bowl/cap gap.

Energy Security and Chemical Engineering Congress
IOP Conf. Series: Materials Science and Engineering 736 (2020) 022112
IOP Publishing
doi:10.1088/1757-899X/736/2/022112
11
(a) Rice husk. (b) Mango bark and mango leaves.
Figure 11. Organic-based nanoparticles production.
The sedimentation test was conducted for rice husk, mango bark and mango leaves. Figure 12 shows the sedimentation observation for rice husk after one hour, five days and two weeks of idle time. It was observed that the diluted rice husk nanoparticles were unstable when the samples are slowly sedimented after five days. After two weeks of observation, the rice husk nanoparticles were completely sedimented. On the other hand, the mango bark and mango leaves were stable after two months of observation.
After the production of nanoparticles for rice husk, mango bark and mango leaves was conducted, it can be seen that domestic grinding process followed by sieve is required to eliminate larger particles with smaller particles and reduce the time of nanoparticles production. Then, the process should be continued with the dry milling process. Even though the produced nanoparticles were undesirably gradually agglomerated and highly contacted with each other like a piece of cookie at the bottom of the jar, the size of particles was drastically reduced to 300% after the sample was continued with the wet milling process. The wet milling process has a critical disadvantage when the produced nanoparticles are small enough to spread through the bowl/cap rubber seal and spilt out from the milling media leaves the bigger particles inside the bow. It allows a massive amount of sample was wasted. Rice husk nanoparticles were able to produce for more than 60%. However, it is highly sedimented. On the other hand, mango bark and mango leaves require more than 7 hours of the grinding process to produce nanoparticles. They are stable even with the highest percentage of intensity is in micro-sized particles.
Rice husk - One
hour Rice husk - 5 days Rice husk - 2
weeks Mango bark and mango leaves - 2
months
Figure 12. Sedimentation observation.
Therefore, figure 13 is a suggested new workflow for organic-based nanoparticles production. In order to produce a high percentage of intensity of nanoparticles, the coarse powder of organic sample should further be ground using a domestic grinder and repeatedly sieve until the size of particles is consistent. Then, the sample should undergo a dry milling process before further wet grinding to

Energy Security and Chemical Engineering Congress
IOP Conf. Series: Materials Science and Engineering 736 (2020) 022112
IOP Publishing
doi:10.1088/1757-899X/736/2/022112
12
shorten the wet milling time and minimise the waste of samples. Ultrasonication process should be done until the percentage of intensity of nanoparticles is constant. Finally, the sample can be observed for its morphology and further conducting the sedimentation and stability test. The duration of dry and wet milling process will vary depending on the types of ball mill, size and types of milling balls and the rotational speed the milling bowl.
Figure 13. The suggestion of nanoparticles production workflow.
4. Conclusion Nanoparticles from three different types of organic-based resources, which are rice husk, mango bark and mango leaves were synthesised through the top-down method of the dry and wet milling process. Then, the samples were ultrasonicated before the process of size characterisation was conducted. This mechanical process produced 61% intensity of nano-sized rice husk nanoparticles after five hours of milling process and three hours of ultrasonication, but the samples were unstable after observation in five days. On the other hand, 6.9% and 4% intensity of mango bark and mango leaves nanoparticles were produced after five hours of wet milling process, and three hours of ultrasonication process. Nevertheless, the sample was remained stable after two months of observation time. However, the average size of rice husk, mango bark and mango leaves particles did not reach a nano-sized particle throughout the mechanical process. The new workflow of mechanical process for organic-based nanoparticles synthesis was suggested to increase nanoparticles production and maintain the weight of samples in the milling bowl. Mango bark and mango leaves may be used as a drag reduction additive as it is highly stable as compared to rice husk. 5. References [1] Im H J and Lee J H 2017 Comparison of superhydrophobic drag reduction between turbulent
pipe and channel flows Physics of Fluids 29 095101 [2] Zhou D and Ball K S 2008 Turbulent drag reduction by spanwise wall oscillations IJE
Transactions A: Basics 21 85 – 104
Stability Test
Wet milling
Ultrasonicating
Particle sizing
Morphology Observation
Sedimentation Test
Dry milling
Coarse powder of organic samples
Domestic grinding and sieve

Energy Security and Chemical Engineering Congress
IOP Conf. Series: Materials Science and Engineering 736 (2020) 022112
IOP Publishing
doi:10.1088/1757-899X/736/2/022112
13
[3] Song W, Wang C, Wei Y, Zhang X and Wang W 2018 Experimental study of microbubble drag reduction on an axisymmetric body Modern Physics Letter B 1850035
[4] Han W J, Dong Y Z and Choi H J 2017 Application of water-soluble polymers in turbulent drag reduction Processes 5 1 – 27
[5] Zhenjiang Y, Jianzhong L and Zhaosheng Y 2004 Hydrodynamic instability of fibre suspensions in channel flows Fluid Dynamics Research 34 251 – 271
[6] Bari H A A, Letchmanan K and Yunus R M 2011a Drag reduction characteristics using aloe vera natural mucilage: An experimental study Journal of Applied Sciences 11 1039 – 1043
[7] Ahmad M A, Bari H A A and Yunus R M 2009 Studying the effect addition of okra-natural mucilage as drag reduction agent in different size of pipes in turbulent water flowing system. National Conference on Postgraduate Research 6
[8] Warashina J and Ogata S 2015 Drag reduction of nata de coco suspensions in circular pipe flow. Journal of Physics: Conference Series 602 1 – 6
[9] Bari H A A, Ahmad M A and Yunus R B M 2010 Experiment study on the reduction of pressure drop of flowing water in horizontal pipes using paddy husk fibres Canadian Journal of pure and applied sciences 4 1221 – 1225
[10] Bari H A A, Mohamad N K, Mohd N and Nour A H 2011b Effect of chitosan solution in turbulent drag reduction is aqueous media flow Scientific Research and Essays 6 3058-3064
[11] Krochak P, Holm R and Soderberg D 2011 Drag reduction characteristics of micro-fibrilled cellulose suspensions PaperCon 667 - 676
[12] Awua J, Ibrahim S and Kwaghger A 2017 Investigation of thermal conductivity of palm kernel fibre nanofluid using de-ionized water and ethylene glycol mixed at ratio of 50:50 and 60:40. International journal of engineering trends and technology 49 47 – 53
[13] Kallamu U M, Ibrahim J S, Sharifpur M and Meyer J P 2016. Experimental investigation on viscosity of nanofluids prepared from banana fibre nanoparticles. 12th International Conference on Heat Transfer, Fluid Mechanics and Thermodynamics (Spain)
[14] Sharifpur M S, Solomon A B, Josua P M, Ibrahim J S and Immanue B 2017 Thermal conductivity and viscosity of mango bark/water nanofluids 13th International Conference on Mechanics and Thermodynamics (Slovenia)
[15] Barki E, Ibrahim J S, Kuhe A and Iortyer H A 2016 Experimental studies of viscosity and stability of mango bark (Mangifera indica) based nanofluid 2nd African International Conference/workshop on application of nanotechnology for energy, environment and health: African Scenario 2 22 – 33
[16] Barki E, Ibrahim J S, Kuhe A and Iortyer H A 2017 Experimental investigation of electrical conductivity and Ph of mango bark based nanofluid American Journal of Engineering Research 6 103 – 108
[17] Adewumi G A, Inambao F, Sharifpur M and Meyer J P 2018. Investigation of the viscosity and stability of green nanofluids from coconut fibre carbon nanoparticles: Effect of temperature and mass fraction International Journal of Applied Engineering Research 13 7
[18] Wulandari W, Waskito K T, Mau S, Yanuar and Talahatu M A 2018 Effect of coconut fiber suspensions on drag reduction in circular pipe. IOP Conference Series: Earth and Environmental Science 105 012050.
[19] Panithasan M S, Gopalakichenin D, Venkadesan G and Veeraraagavan S 2019 Impact of rice husk nanoparticle on the performance and emission aspect of a diesel engine running on blends on pine oil-diesel Environmental Science and Pollution Research 26 282 - 291
[20] Vinukumar K, Azhagurajan A, Vettivel S C and Vedaraman N 2018 Rice husk as nanoadditive in diesel-bio-diesel fuel blends used in diesel engine Journal of Thermal Analysis and Calorimetry 131 1333 – 1343
[21] Subramani K, Shanmugam B K, Rangaraj S, Palanisamy M, Periasamy P and Venkatachalam R 2018 Screening the UV-blocking and antimicrobial properties of herbal nanoparticles prepared from Aloe vera leaves for textile applications EIT Nanobiotechnology 12 459 – 465

Energy Security and Chemical Engineering Congress
IOP Conf. Series: Materials Science and Engineering 736 (2020) 022112
IOP Publishing
doi:10.1088/1757-899X/736/2/022112
14
[22] Karthik S, Suriyaprabha R, Balu K S, Manivasakan P and Rajendran V 2017 Influence of ball milling on the particle size and antimicrobial properties of Tridax procumbens leaf nanoparticles IET Nanobiotechnology 11 12-17
[23] Khan A I and Arasu A V 2019 A review of influence of nanoparticle synthesis and geometrical parameters on thermophysical properties and stability of nanofluids Thermal Science and Engineering Progress 11 334-364
[24] Jamkhande P G, Ghule N W, Bamer A H and Kalaskar M G 2019 Metal nanoparticles synthesis: An overview on methods of preparation, advantages and disadvantages, and applications Journal of Drug Delivery Science and Technology 53 101174
[25] Rajput N 2015 Methods of preparation of nanoparticles - A review International Journal of Advances in Engineering and Technology 7 1806 – 1811
[26] Gennari F C and Andrade-Gamboa J J 2018 A systematic approach to the synthesis, thermal stability and hydrogen storage properties of rare-earth borohydrides Emerging Materials for Energy Conversion and Storage 429-459
[27] Yadav T P, Yadav R M and Singh D P 2012 Mechanical Milling: a top down approach for the synthesis of nanomaterials and nanocomposites Nanoscience and nanotechnology 2 22-48
[28] Bello S A, Agunsoye J O and Hassan S B 2015 Synthesis of coconut shell nanoparticles via a top down approach: Assessment of milling duration on the particle size and morphologies of coconut shell nanoparticles Material Letters 159 514-519
[29] Yu W and Xie 2012 H A review on nanofluids: preparation, stability mechanisms, and application Journal of nanomaterials 2012 17
[30] Devendiran D K and Amirtham V A 2016 A review on preparation, characterization, properties and applications of nanofluids Renewable and Sustainable Energy Reviews 60 21 - 40
[31] Fuskele V and Sarviya R M 2017 Recent development in nanoparticles synthesis, preparation and stability of nanofluids 5th International Conference of Material Proceeding and Characterization 4049-4060
[32] Haddad Z, Abid C, Oztop H F and Mataoui A 2014 A review on how the researchers prepare their nanofluids International Journal of Thermal Sciences 76 168 – 189
[33] Choo S W 2014 Particle sizing using dynamic light scattering Malvern [34] Adio S A, Sharifpur M And Meyer J P 2015 Influence of ultrasonication energy on the
dispersion consistency of Al2O3-glycerol nanofluid based on viscosity data, and model development for the required ultrasonication energy density Journal of experimental nanoscience 1 - 21